smart classes first year chapter (3) basic elements of supply and demand 1
TRANSCRIPT

1
SMART Classes
First Year
Chapter (3)
Basic Elements of Supply and Demand

2
Learning ObjectivesThis chapter introduces the notions of supply and demand and shows how they operate in competitive markets for individual commodities by showing:(A) The demand schedule
(B) The supply schedule
(C) Equilibrium of supply and demand

3
(A) The Demand Schedule
• Demand schedule “represents the relationship between price of a good and quantity demanded of that good, other things held constant”.
• Other things held constant means we are changing the price without changing any of the other determinants of demand (such as tastes and income).
• The following table represents the demand schedule:

4
(A) The Demand Schedule
At each market price, consumers will want to buy a certain quantity of the good (cornflakes). As the price of the good falls, the quantity demanded of the good (cornflakes) will rise.

5
The Demand Curve and demand law• The demand curve is the graphical
representation of the demand schedule. We can represent the demand schedule in the following demand curve:

6
The Demand Curve and demand law• The demand curve slopes downward showing
that quantity demanded and price are inversely related, that is Q increases when P decreases. This is called the law of downward-sloping demand.
• Law of downward-sloping demand “states that when the price of a commodity is raised (and other things are held constant), buyers tend to buy less of the commodity. Similarly, when the price is lowered, other things being constant, quantity demanded increases”.

7
The Demand Curve and demand law• Quantity demanded tends to fall as price rises
for two reasons:
1- Substitution effect which occurs because a good becomes relatively more expensive when its price rises. For example, as the price of beef rises, I eat more chicken.
2- Income effect which occurs because when a price rises, you will find yourself poorer than you were before, as you will have less real income.
• In the analysis of market, the focus is on market demand that is found by adding together the quantities demanded by all individuals at each price.

8
Changes in Demand and Changes in Quantity Demanded
• There is a difference between changes in demand and changes in quantity demanded.
• A change in demand occurs when there is a change in one of the factors affecting demand other than the good’s price, and this is represented by a shift in the demand curve. This means that the quantity demanded at each price will change.
• An increase in demand is illustrated by a rightward shift in the demand curve, while a decrease in demand is illustrated by a leftward shift in the demand curve.

9
Changes in Demand and Changes in Quantity Demanded
• There are a number of factors that influence how much will be demanded at a given price and cause a shift in demand curve:
1- Average income of consumers:
As people’s income rises, individuals tend to buy more even if prices don’t change.
2- Size of the market: (population)
When population increases, market demand increases.

10
Changes in Demand and Changes in Quantity Demanded
3- Prices and availability of related goods:
If the two goods are substitutes (such as pens and pencils, oil and natural gas), then the demand for one good will be low, if the price of the other is low.
If the two goods are complements (such as cars and oil, tea and sugar), then the demand for one good will be high, if the price of the other is low.
4- Tastes or preferences: (subjective element)
Tastes represent a variety of cultural and historical influences.
11
Changes in Demand and Changes in Quantity Demanded
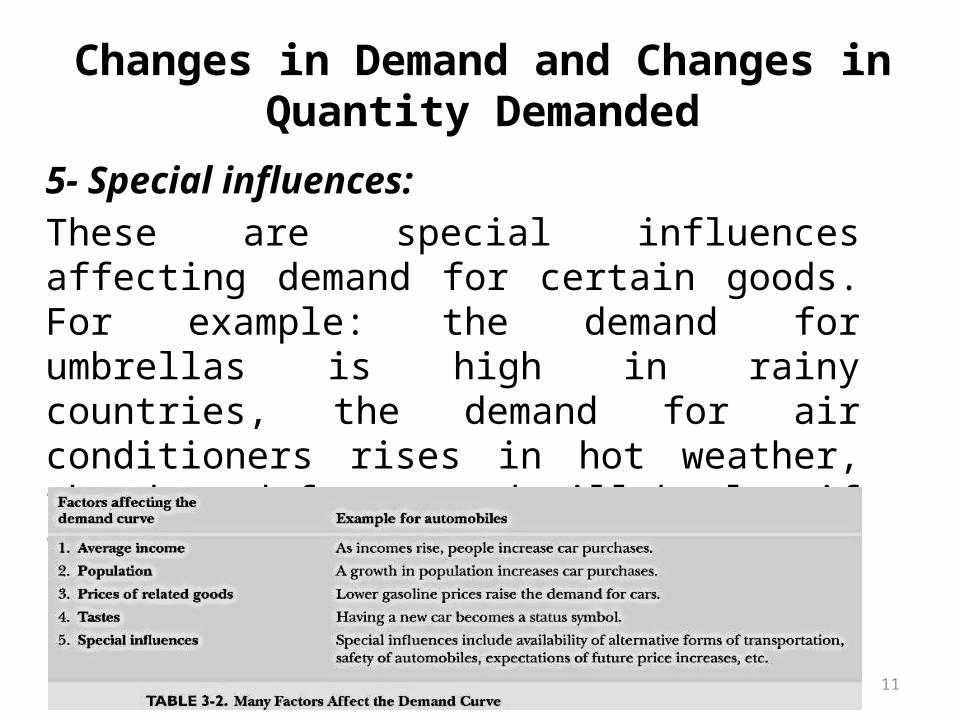
5- Special influences:
These are special influences affecting demand for certain goods. For example: the demand for umbrellas is high in rainy countries, the demand for air conditioners rises in hot weather, the demand for a good will be low if there are expectations of future price decreases.

12
Changes in Demand and Changes in Quantity Demanded
• An increase in demand due to the change in one of the factors affecting demand other than the price of the good will result in a shift in the demand curve to the right, as shown by this graph:

13
Changes in Demand and Changes in Quantity Demanded
• On the other hand, a change in quantity demanded occurs when the good’s price changes, while all other factors are held constant. This change in quantity demanded is represented by a movement along the demand curve. (low of demand)
• If the good’s price rises, the quantity demanded will fall, and there will be an upward movement along the same demand curve. But if the good’s price falls, the quantity demanded will rise, and there will be a downward movement in the demand curve.

14
(B) The Supply Schedule• Supply schedule “shows the relationship
between the market price of a commodity and the amount of that commodity that producers are willing to produce and sell, other thing held constant”.
• In considering supply, other things that are held constant include input prices, prices of related goods, and government policies.
• The following table represents the demand schedule:

15
(B) The Supply Schedule
At each market price, the quantity of the good that producers want to produce and sell will increase as the price of the good rises. There is a positive relationship between price and quantity supplied.

16
The Supply Curve • Supply curve is the graphical representation
of the supply schedule. We can represent the supply schedule in the following supply curve:

17
The Supply Curve• At the price of $1, the producers of the good
will not produce and they will produce other goods. But after the price of $1, as the price of the good increases, the producers will increase their production because it will be more profitable for the producers to add more inputs and increase production as the price rises.
• The supply curve shows a positive slope, due the law of diminishing returns stating that by adding more workers to other fixed inputs, each new worker will be adding less and less extra product. So price of the good should be raised to persuade producers to produce more.

18
Changes in Supply and Changes in Quantity Supplied
• There is a difference between changes in supply and changes in quantity supplied.
• A change in supply occurs when there is a change in one of the factors affecting supply other than the good’s price, and this is represented by a shift in the supply curve. This means that the quantity supplied at each price will change.
• An increase in supply is illustrated by a rightward shift in the supply curve, while a decrease in supply is illustrated by a leftward shift in the supply curve.

19
Changes in Supply and Changes in Quantity Supplied
• There are a number of factors that influence supply and cause a shift in supply curve:
1- Cost of production:
When production costs for a good are low relative to the market price, it is profitable for producers to supply more. But, When production costs are high relative to price, firms produce little, switch to the production of other goods, or may go out of business.
Production costs are primarily determined by the prices of inputs and technological advances.

20
Changes in Supply and Changes in Quantity Supplied
As the prices of inputs (labor, energy, or machines) decrease, the production costs will fall relative to the price, and the supply will increase resulting in a shift to the right.
As technological advances consist of changes that lower the quantity of inputs needed to produce the same of output, these advances in technology will reduce the production costs causing a shift in the supply curve to the right.

21
Changes in Supply and Changes in Quantity Supplied
2- Prices of related goods:
If the price of a production substitute rises, the production of another substitute will decrease. For example, if the price of corn rises, the supply of wheat will fall.
3- Government policy:
This policy includes taxes, subsidies, minimum-wage laws, and trade agreements. For example, if subsidies are raised on the good, then the producer will increase production, and the supply curve will shift to the right.
22
Changes in Supply and Changes in Quantity Supplied
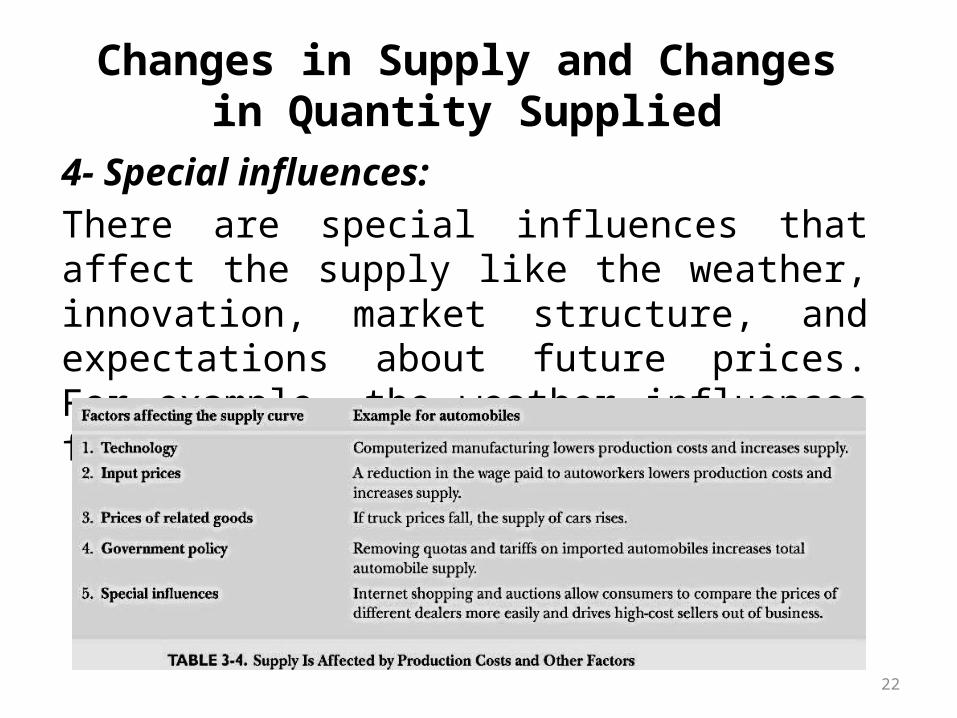
4- Special influences:
There are special influences that affect the supply like the weather, innovation, market structure, and expectations about future prices. For example, the weather influences farming.

23
Changes in Supply and Changes in Quantity Supplied
• An increase in supply due to the change in one of the factors affecting supply other than the price of the good will result in a shift in the supply curve to the right, as shown by this graph:
24
Changes in Supply and Changes in Quantity Supplied
• On the other hand, a change in quantity supplied occurs when the good’s price changes, while all other factors are held constant. This change in quantity supplied is represented by a movement along the supply curve. (low of demand)
• If the good’s price rises, the quantity supplied will rise, and there will be an upward movement along the same demand curve. But if the good’s price falls, the quantity demanded will fall, and there will be a downward movement along the same demand curve.

25
(C) Equilibrium of Supply and Demand• The supply and demand interact to produce an
equilibrium price and quantity, or a market equilibrium.
• Market equilibrium “comes at the price at which quantity demanded equals quantity supplied”.
• At the equilibrium price, the amount that buyers want to buy is just equal to the amount that sellers want to sell. The equilibrium price is also called the market-clearing price.
• At market equilibrium, there is no tendency for the price to rise or fall.

26
(C) Equilibrium of Supply and Demand• The reason it is called equilibrium price is that
when the forces of supply and demand are in balance, there is no reason for price to rise or fall, as long as other things remain unchanged.
• Market equilibrium can be illustrated by the following example:

27
(C) Equilibrium of Supply and Demand• Market equilibrium can be shown also by this
graph:

28
(C) Equilibrium of Supply and Demand• If the price was $5, then the quantity
supplied will exceed the quantity demanded, and there will be a surplus. As the consumers are too few relative to the quantity supplied, the price will tend to fall.
• If the price was $2, then the quantity demanded will exceed the quantity supplied, and there will be a shortage. As the consumers are too many relative to the quantity supplied, the price will tend to rise.
• Different prices will result in surplus or shortage except the equilibrium price.

29
(C) Equilibrium of Supply and Demand• At $3, the quantity demanded by consumers is
just equal to the quantity supplied by producers, and so it is the equilibrium price.
• The market equilibrium is found at the intersection of supply and demand curves at point C. At this point of intersection, there are no shortages or surpluses.
• But what will happen to the market equilibrium if there is a change in one of the forces or factors affecting demand or supply, that is if there is a shift in demand or supply.
30
Effect of a Shift in Supply or Demand• Supply and demand analysis can be used to
predict the impact of changes in economic conditions on prices and quantities.
• Changes in one of the factors affecting supply or demand (other than price of the good) will shift supply or demand curve resulting in changes in market equilibrium.
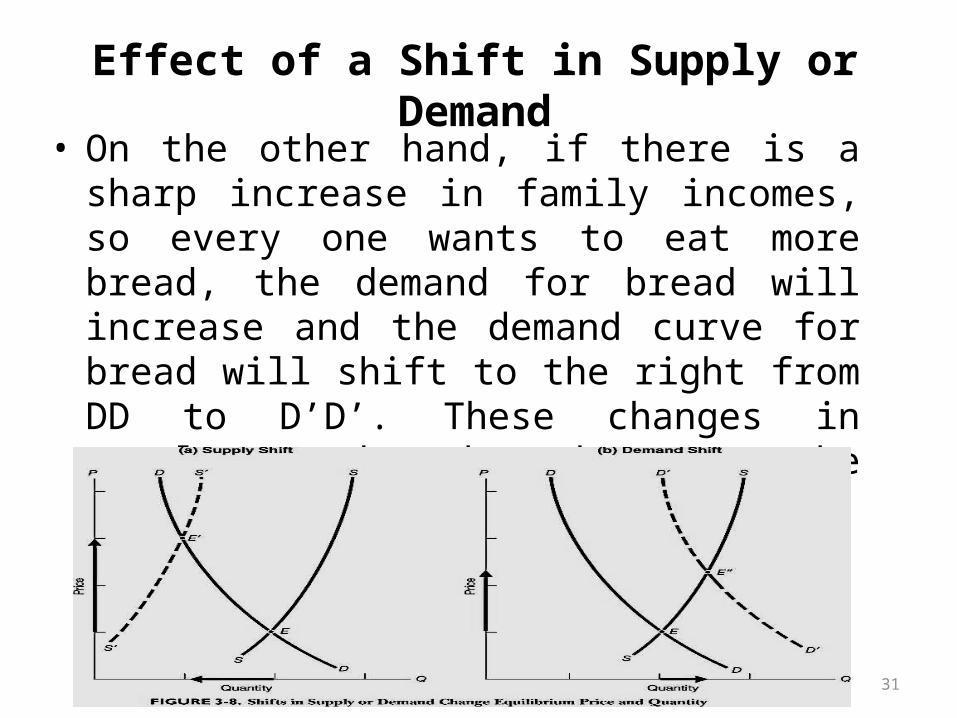
• For example, if the bad weather raises the price of wheat, that is the basic ingredient of bread, then the cost of producing bread will rise, and the supply curve will shift to the left from SS to S’S’, while demand curve will not shift because demand is not affected by weather.
31
Effect of a Shift in Supply or Demand• On the other hand, if there is a sharp increase
in family incomes, so every one wants to eat more bread, the demand for bread will increase and the demand curve for bread will shift to the right from DD to D’D’. These changes in supply and demand can be illustrated by this graph:

32
Effect of a Shift in Supply or Demand• The rise in the costs of production caused the
producers to produce less of bread at the old price at point E resulted, so the quantity demanded exceeded the quantity supplied. So the price rises encouraging production and discouraging consumption, until a new equilibrium at point E’ is reached at a higher price and a lower quantity.
• On the other hand, the increase in the demand for bread resulted in a shortage of bread at the old price, so price rises until supply and demand come back at balance at a higher price and a higher quantity.
33
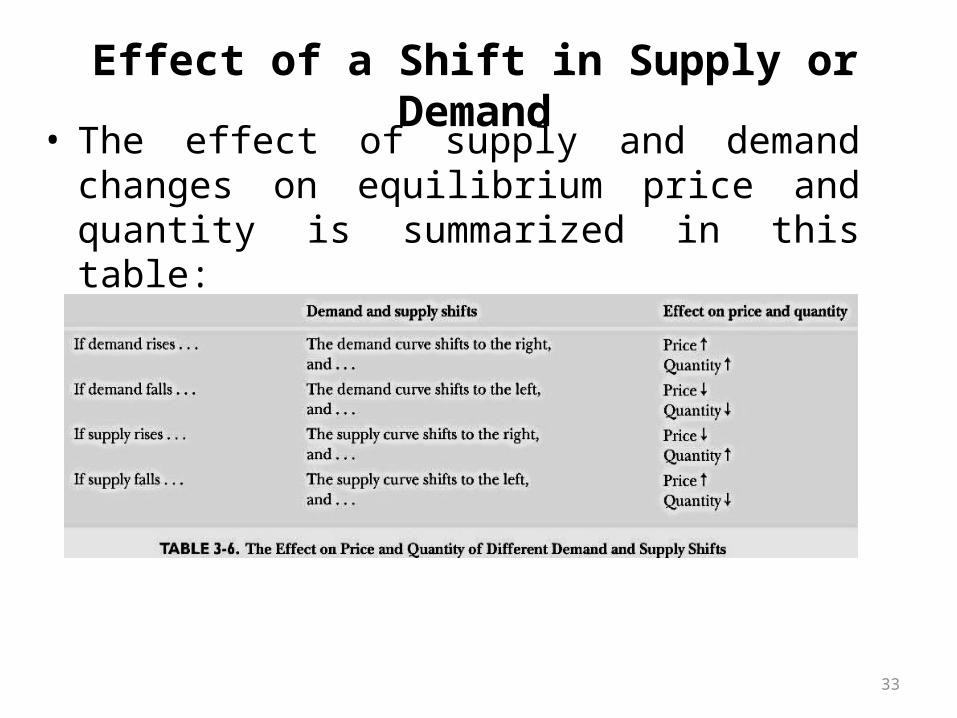
Effect of a Shift in Supply or Demand• The effect of supply and demand changes on
equilibrium price and quantity is summarized in this table:
34
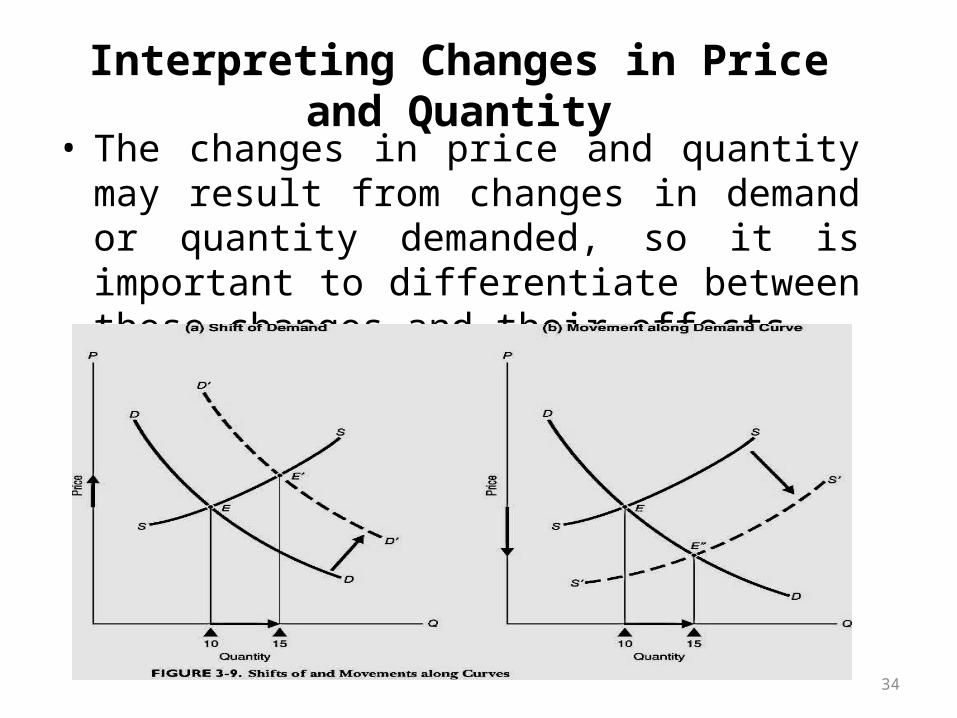
Interpreting Changes in Price and Quantity
• The changes in price and quantity may result from changes in demand or quantity demanded, so it is important to differentiate between these changes and their effects.
35
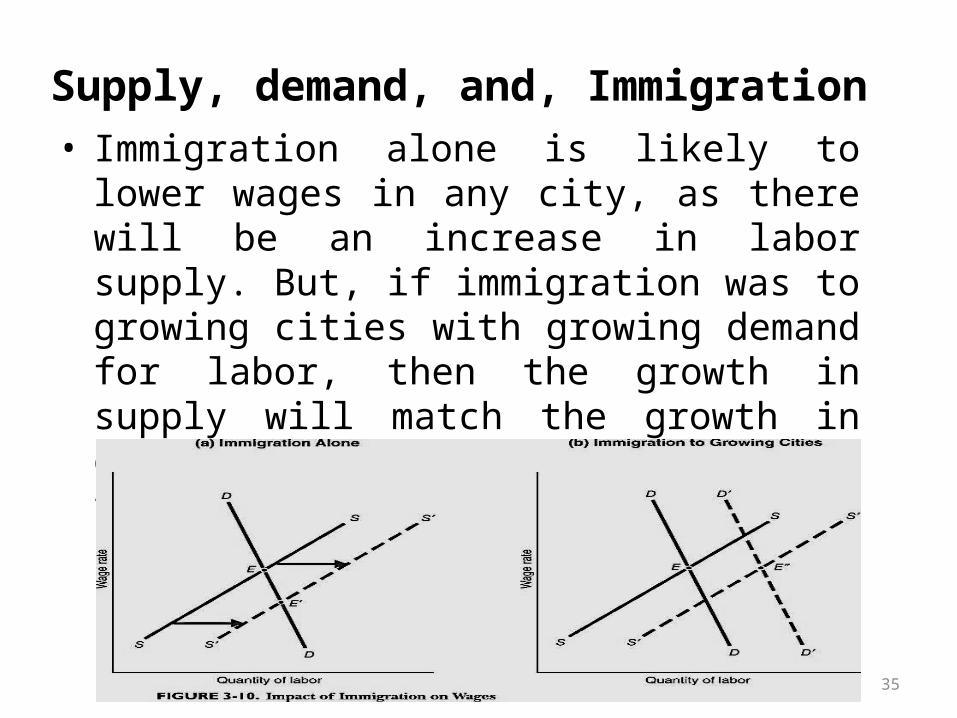
Supply, demand, and, Immigration• Immigration alone is likely to lower wages in
any city, as there will be an increase in labor supply. But, if immigration was to growing cities with growing demand for labor, then the growth in supply will match the growth in demand and the wage rate will be the same as the original wage at point E.