smart beta: 2015 survey findings from u.s. financial · pdf filesmart beta: 2015 survey...
TRANSCRIPT


Contents
1 Introduction
2 Summary of key themes
3 Survey background
5 Section1:Defining“smartbeta,”andwhatisclassifiedassmartbeta,continuestobeapointofconfusionforfinancialadvisors,evenamongusersofsmartbetaproducts
7 Section2:Educationaboutsmartbetaisstillimportant
9 Section3:Advisorsviewsmartbetaproductssimilarlytothewaytheyviewactivelymanagedproducts
12 Section 4: Among existing smart beta investment approaches,DividendandHighQualityhavethemostadvisor usage and interest
16 Section5:Thesmartbetauserprofilehasseveralnotable characteristics
18 Section6:RIAsaremorefamiliarwithsmartbeta and more likely to identify as being users of smartbetaproducts
20 Conclusion
21 Appendix
24 Definitionsofsmartbetaindexesreferenced
Smartbeta:2015surveyfindingsfromU.S.financialadvisors

3Smart beta: 2015 survey findings from U.S. financial advisors
Advisors have taken note and have increasingly embraced smart beta as a wayofincorporatingnewideaswithintheirclients’portfolios.Butmorechoiceandflexibilitycarrieswithitaneedformoreeducation.FTSERussellconductedthissurveyofadvisorsaspartofitsongoingeducationalprogram.Theresultsare intended to establish a baseline assessmentofcurrentperceptionsandlevelsofadoptionofsmartbetaintheadvisorcommunity.
There is still some confusion about thedefinitionofsmartbetaandthedistinctionbetweenactiveandpassiveinvesting.Thesurveyrevealsthatsome advisors consider smart beta as akindofactivemanagement.Whiletheselectionofasmartbetaproductfor a client can require almost as much due diligence as selecting an active manager,itisimportanttokeepinmindthat the underlying smart beta index is transparentandrules-based;thereisnoactivedecisionastowhatsecuritiesareincludedorexcludedwithintheindex.
Itisinterestingtocompareadvisors’perceptionsonsmartbetawithresultsfromourprevioussurveysofinstitutionalassetowners.Advisors’toptwosmart
betaproductsareDividend/IncomeYieldandHighQuality.Forinstitutionalassetowners,thetopsmartbetaproducthasbeenLowVolatilityfortwoyearsinarow,witheitherFundamentalorMultifactorbeingthesecond.Thecontrastreflectsthedifferingneedsofadvisors’clientsversus the needs of institutional asset owners.Asimilarityisthatbothadvisorsandassetownersarekeentoexploremultifactorindexproducts.
This survey also demonstrates that morethantwo-thirdsoftheadvisorssurveyed are currently using a variety of smartbetaproductsintheirpractices.Yet,withlessthanoneinfiveadvisorsreportingthattheyareveryfamiliarwiththeterm“smartbeta,”itisevidentthatsmartbetaeducationisstillneeded.Providers of indexes and smart beta products,includingexchangetradedfunds(ETFs),needtorampuptheireducationalprogramsfocusedontheadvisorcommunity.Hopefully,thissurveyprovidesausefulperspectiveforallmarketparticipants.
RolfAgather,CFA Managing Director of Research, North America
Introduction
Factor-based and alternatively-weighted indexes have transformed the current investment landscape. These indexes, generically called “smart beta indexes” are weighted differently than traditional market-value or capitalization-weighted indexes, providing new tools to help tailor exposures to specific risk and return objectives. For the purpose of this study we will use the term “smart beta” or “smart beta products” to refer to an investable product such as a mutual fund or ETF that closely tracks one of these indexes.

4 Smart beta: 2015 survey findings from U.S. financial advisors
Summary of key themes
Defining“smartbeta,”andwhatisclassifiedassmartbeta,continuestobeapointofconfusionforfinancialadvisors,evenamongusersofsmartbetaproducts.
› Withoutthehelpofdescriptivepromptsorproductexamples,35%ofadvisorsreportedhavingusedasmartbetaproduct.Promptedbyspecificsmartbetaproductnames,morethantwo-thirdsofadvisorsidentifiedthemselvesasusersofsmart beta.
› Uponseeingexamplesofsmartbetaproducts,89%ofnon-usersofsmartbetaexpressedaninterestinusingthem.
Education about smart beta is stillimportant.
› While65%ofadvisorshadheardtheterm“smartbeta”priortotakingpartinthisresearch,only18%reportedthattheyare“veryfamiliar”withsmartbeta.
› Lackofknowledgeisoneofthetopreasons advisors cite for not using smartbetaproducts.
Advisorsviewsmartbetaproductssimilarlytothewaytheyviewactivelymanagedproducts.
› Advisors have an interest in using smartbetatoprotectportfoliosindownmarkets,controlvolatilityandincreasealpha.
› Significantnumbersofadvisorsareusingtheterm“active”todescribesmartbeta.
Among existing smart beta investmentapproaches,DividendandHighQualityhave the most advisor usage andinterest.
› Of all smart beta investment approachestested,advisorsaremost likely to be using a smart beta approachthatweightscompaniesbytheirhistoricaldividendyield,with36%usingthistypeofsmartbetaproductand35%interestedinusingit.
› AHighQualityinvestmentapproachshowsthemostpotentialforuse,with27% of advisors currently using it and 40%verylikelytouseitinthefuture.
› Morethan70%offinancialadvisorswhoareusingsmartbetaareusingmorethanonetypeofsmartbetainvestment approach.
The smart beta user profilehasseveralnotablecharacteristics.
› Advisorswhousesmartbetaaremore likely to be younger and to have ahighershareofAUMinETFsandalternative investments.
› Advisorswhousesmartbetaaremorelikelytohavepracticesthatextend beyond the core activities ofinvestmentselection,assetallocationandfinancialplanning.
› Smart beta users are more likely toviewsmartbetaasaformofactivemanagement,andtheyaremorereceptivetonewerformsofsmartbeta.
RIAsaremorefamiliarwithsmart beta and more likely to identify as being users of smartbeta products.
› Registered investment advisors (RIAs)aremorelikelythanregional,independentandwirehouseadvisorstoknowtheterm “smartbeta.”
› Forty-sixpercentofRIAadvisorsprovidedunaidedaffirmationofsmartbetaproductusage,comparedwithanaverageof 32%ofotheradvisors.

5Smart beta: 2015 survey findings from U.S. financial advisors
Thissurveytestssmartbetaawarenessandinterestamongaselectpopulationofexperiencedadvisors.Tobeeligibletoparticipateinthestudy,advisorsmetthefollowingcriteria:
› HaveAUMgreaterthan$20million › Haveatleast4%ofAUMinvestedin ETFs
› Haveatleast20%fee-basedannual revenue
Theserequirementswereputinplacetogenerateasamplefromamongadvisorswhowerelikelytobeactivelymanagingportfolios,ratherthansimplysellinginvestmentsonacommissionbasis.
The screening criteria were intended to provide a detailed look at advisors who are likely to give thoughtful consideration to the role of smart beta within client portfolios.FTSERussellpartneredwithGreenwald& Associates to execute this research onsmartbetaperceptionandusageamongfinancialadvisors.Theresearch
wasconductedinJune2015andallresultspresentedherearebasedonFTSERussellanalysisofresponsesfrom307financialadvisors.Respondentsweredrawnprimarilyfromwirehouses(29%),regionalbroker-dealers(23%),RIAs(23%)andindependentbroker-dealers(21%).Ninety-ninepercentofrespondentshadmorethanfiveyearsoffinancialadvisorexperienceand84%hadmorethan10yearsofexperience.ByAUM,81%managemorethan$50millionand52%managemorethan$100million.Fulldetailonthesampledemographicscanbefoundintheappendix.
Basedonthecountofadvisorsnotselectedduetoscreeningcriteria,weestimatethatthetargetpopulationforthisstudy(asdeterminedbyAUM,percentageofAUMinvestedinETFs,andpercentageoffee-basedannualrevenue)representsapproximately40%ofthetotalfinancialadvisoruniverse.
Throughoutthereport,percentagesmaynotequal100,becauseofrounding,and/orbecausesomequestionsallowedmultipleresponses.Questionswithmultipleresponsesarenotedineachchartfooter.
Survey background
Smart beta defined
Smartbetaproductsarepassivelymanaged and use a smart beta indexasthebasisoftheproduct.Smart beta indexes are not market capweighted,thewayindexfundstraditionallyareweighted.Smartbetaindexesareweightedbasedonother factors or alternative methods (i.e.,fundamentalweighted,equalweighted,factorweighted,optimized,etc.).

6 Smart beta: 2015 survey findings from U.S. financial advisors
23% RIAs21%Independentbroker-dealers
23%Regionalbroker-dealers
4% Others
Respondents were drawn primarily from :
29%Wirehouses
7Smart beta: 2015 survey findings from U.S. financial advisors
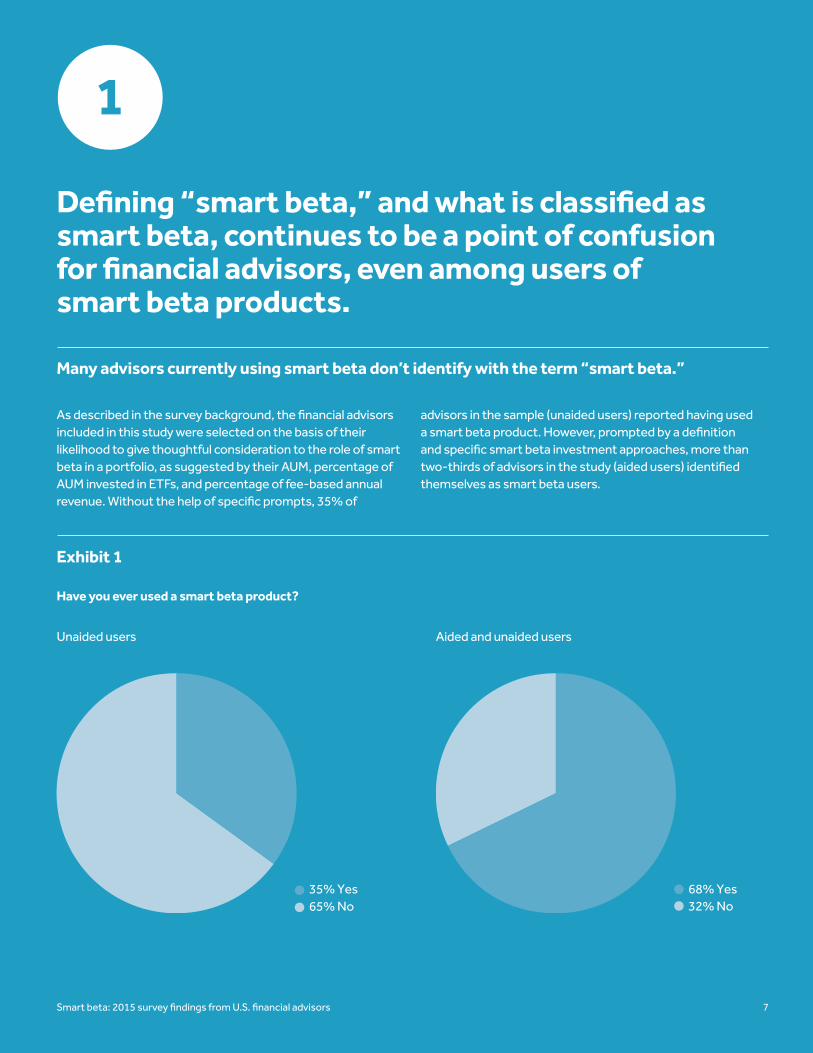
Defining “smart beta,” and what is classified as smart beta, continues to be a point of confusion for financial advisors, even among users of smart beta products.
Many advisors currently using smart beta don’t identify with the term “smart beta.”
Asdescribedinthesurveybackground,thefinancialadvisorsincludedinthisstudywereselectedonthebasisoftheirlikelihood to give thoughtful consideration to the role of smart betainaportfolio,assuggestedbytheirAUM,percentageofAUMinvestedinETFs,andpercentageoffee-basedannualrevenue.Withoutthehelpofspecificprompts,35%of
advisorsinthesample(unaidedusers)reportedhavingusedasmartbetaproduct.However,promptedbyadefinitionandspecificsmartbetainvestmentapproaches,morethantwo-thirdsofadvisorsinthestudy(aidedusers)identifiedthemselvesassmartbetausers.
1
35% Yes65% No
68% Yes32% No
Unaidedusers Aided and unaided users
Exhibit 1
Have you ever used a smart beta product?

8 Smart beta: 2015 survey findings from U.S. financial advisors
Upon seeing examples of smart beta, 89% of non-users expressed interest in using a smart beta product if a major investment firm offered it.
Exhibit 2 How interested are you in using smart beta?
Despitenotbeingfamiliarwithoridentifyingwiththeterm“smartbeta,”asignificantnumberofadvisorsinthesurveyexpressedinterestinconsideringsmartbetaafterlearningmoreaboutthekindsofproductsthatwouldbeconsideredsmartbeta.
Afterlearningthedefinitionsofsmartbetaandseeingexamples,89%ofnon-usersofsmartbetaexpressedinterestinusingasmartbetaproductifitwasofferedbyamajorinvestmentfirm,with28%sayingtheywere“veryinterested”insmartbeta.
Not at all interestedNot too interestedSomewhat interestedVery interested
28%
61%
9% 2%
Segment = Never used smart beta (unaided)

9Smart beta: 2015 survey findings from U.S. financial advisors
Education about smart beta is still important.
2
Among advisors not using smart beta, lack of familiarity is a primary obstacle to usage.
Withintheadvisorycommunity,educationaboutsmartbetaisneeded.While65%ofparticipatingadvisorshadheardtheterm“smartbeta”priortotakingpartinthisresearch,only18%reportedthattheywere“veryfamiliar”withsmartbetaproducts.
Exhibit 3
Do you know the term “smart beta?”
Exhibit 4
How familiar are you with smart beta products?
Yes 65%
No 16%
Not Sure 19%
Not at all familiar
Not too familiar
Somewhat familiar
Very familiar 18%
54%
20%
7%

10 Smart beta: 2015 survey findings from U.S. financial advisors
Exhibit 5 How important is each of these reasons for not using smart beta in your practice?
Lack of knowledge is one of the top reasons advisors cite for not using smart beta.
“Notknowingenoughaboutsmartbeta”iscitedby42%ofrespondentsasa“veryimportant”reasonfornotusingsmartbetaintheirpractices;35%ofrespondentscite“nothavingalongenoughtrackrecord.”
Multi-pick; Segment = Never used smart beta (unaided)
Don't know enough aboutthem
42%
Not a longenough trackrecord
35%
Haven't foundan assetmanager youtrust whoo�ers thesestrategies
26%
Not possibleto predictwhether ornot they willoutperformconventionalactive orindex funds
25%
Don't feelthat backtesting showsthese strategieso�er enough
21%
Don't feel that the strategies are worth the extra fees
16%
You can capture smart beta objectives with your own portfolio management
16%

11Smart beta: 2015 survey findings from U.S. financial advisors
Multi-pick; Percentage indicating “very motivating”
Advisors view smart beta products similarly to the way they view actively managed products.
3
Protecting portfolio assets is top of mind for advisors, and several findings suggest that advisors may view smart beta as being a form of active management.
Advisorshaveaninterestinusingsmartbetatoprotectportfoliosindownmarkets,controlvolatilityandincreasealpha.Theirprimaryreasonsforusingasmartbetaproductare similar to the motivations driving use of actively managed
funds.Incontrast,advisorschoosepassiveindexfundsprimarilyfor theirlowcost.Costislessofadrivingfactorintheselectionofasmartbetaproduct.
Exhibit 6
How motivating would each of these reasons be for using a smart beta product?
Lower volatility
Increased alpha
Higher yield
Portfolio diversification
Addresses specific investment objective cost effectively
Lower cost than other similar active strategies
Client demand
Something new to offer clients
Low turnover
Higher Sharpe ratios
Seems like a reasonable strategy
Downside protection in bad markets 62%
53%
49%
40%
38%
36%
36%
30%
24%
22%
21%
19%

12 Smart beta: 2015 survey findings from U.S. financial advisors
Exhibit 7 Percentage of respondents indicating a factor is “very important” when deciding which smart beta product to use.
When it comes to selecting a smart beta product, performance history is a key driver.
Asidefromavailabilityontheadvisor’splatform,thestrongestfactorinchoosingasmartbetaproductisitsperformancehistoryingoodandbad markets.Seventy-threepercentofadvisorspointtoperformancehistoryoverthelongtermas
beingaveryimportantfactorindecidingwhich smart betaproducttouse,whileslightlylessthanhalfsaycostisaveryimportantfactor.
Available onyour firm’splatform
77%
Performancehistory ingood and badmarkets overthe long term
73%
Detailedinformationon indexmethodology
48%
Cost
47%
Guidance onhow touse whenconstructingportfolios
30%
Marketingmaterials foryour clients
18%
Performancehistory overshort term
17%
Third partyendorsementsof the productand/or ratingsof the product
8%
Multi-pick

13Smart beta: 2015 survey findings from U.S. financial advisors
A significant number of advisors are using the term “active” to describe smart beta products.
Asmallbutsignificantnumberofadvisorsusetheterm“active”todescribesmartbetaproducts.Whenaskedaboutdescriptivetermsotherthan“smartbeta”,advisors’mostcommonresponse,asidefromthenameofaspecificsmartbetainvestmentapproachwaseither“activelymanaged”or
“activeindexing.”Thiswasofferedby15%ofrespondents.
Amongthoseadvisorswhowroteinaspecificsmartbetainvestmentapproach,themostcommonlymentionedwereequalweighting,fundamentalweightingandfactorweighting.
Findingssuggestthatcomparedtonon-usersofsmartbeta,users of smart beta1aremorelikelytoviewsmartbetaasaformofactivemanagement.Relativetonon-users,smartbetausersaremorelikelytodescribesmartbetaas“activelymanaged”(18%vs.5%)andtofeelthat“increasingalpha”
(95%vs.83%)and“highSharperatios”(76%vs.59%)areatleastsomewhatmotivatingreasonsforusingsmartbeta.Smartbetausersarealsomorelikelytoseesmartbetafittinginsmallcap(39%vs.25%),anassetclasstypicallyassociatedwithactivemanagement.
1 Includes both aided and unaided users of smart beta.
Exhibit 8 Please describe other names or terms you use for smart beta–top responses.
Segment = Familiar with smart beta
Actively managed ETFs/Active indexing
Alternative weighting
Alternative index
Enhanced index
Risk/volatility management
Specific smart beta investment approach 23%
15%
13%
5%
4%
4%

14 Smart beta: 2015 survey findings from U.S. financial advisors
4
Among existing smart beta investment approaches, Dividend and High Quality have the most advisor usage and interest.
Of the existing smart beta investment approaches tested, Dividend and High Quality show the most potential for use in the marketplace.
Oftheexistingsmartbetainvestmentapproachestested,anindexstrategythatweightscompaniesbytheirhistoricaldividendyieldsiscurrentlythemostusedbyadvisors;36%ofrespondentsareusingthisstrategy,and35%areinterestedinusingit.AHighQualityinvestmentapproachshowsthemostpotentialforuse,with27%ofadvisorscurrentlyusingitand40%verylikelytouseitinthefuture.RoughlyhalfeitheruseorareverylikelytouseaFundamental,LowVolatilityorEqualWeightinvestmentapproaches.Somewhatfewereitheruse(17%)orareverylikelytouse(24%)aMomentumapproach
thatpickscompaniesthathaveconsistentlyexhibitedstrongperformanceovertheprior12months.
ForHighQuality,Fundamental,LowVolatilityandMomentum,thenumberofadvisorswhosaidtheywereverylikelytousetheinvestmentapproachinthefutureexceededthenumberalreadyusing.ForDividend/IncomeYieldandEqualWeight,thenumberofadvisorswhoarelikelytousetheinvestmentapproachinthefuturewasroughlythesameasthenumberofthosecurrentlyusingit.
Exhibit 9
Percentage of advisors using or very likely to use existing smart beta approaches.
Dividend/income yield
36%
35%70%
High quality
40%67%
27%
Low volatility
35%52%
17%
Equal weight
26%
22%48%
Momentum
41%24%
17%
Fundamental
54%31%
23%TotalVery likely to useAlready use
15Smart beta: 2015 survey findings from U.S. financial advisors
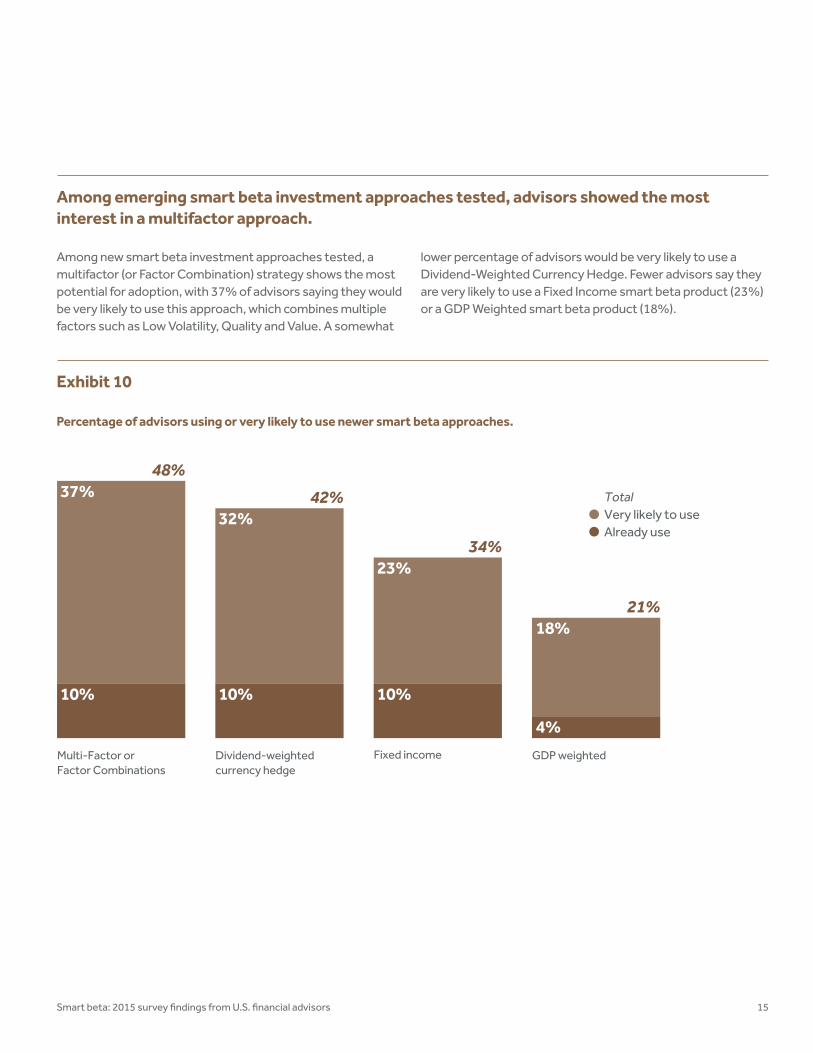
Among emerging smart beta investment approaches tested, advisors showed the most interest in a multifactor approach.
Exhibit 10 Percentage of advisors using or very likely to use newer smart beta approaches.
Amongnewsmartbetainvestmentapproachestested,amultifactor(orFactorCombination)strategyshowsthemostpotentialforadoption,with37%ofadvisorssayingtheywouldbeverylikelytousethisapproach,whichcombinesmultiplefactorssuchasLowVolatility,QualityandValue.Asomewhat
lowerpercentageofadvisorswouldbeverylikelytouseaDividend-WeightedCurrencyHedge.FeweradvisorssaytheyareverylikelytouseaFixedIncomesmartbetaproduct(23%)oraGDPWeightedsmartbetaproduct(18%).
TotalVery likely to useAlready use
42%
34%
21%
Dividend-weightedcurrency hedge
Fixed income GDP weightedMulti-Factor orFactor Combinations
48%
10% 10%
4%
10%
32%
23%
18%
37%

16 Smartbeta:2015surveyfindingsfromU.S.financialadvisors
Exhibit 11 How likely would you be to use the following smart beta approaches in your practice?
Advisors who are currently using smart beta are more receptive to newer smart beta approaches.
Comparedtothosewhohavenotusedsmartbetaproducts,smartbetausersaresignificantlymorereceptivetoeachofthenewerinvestmentapproachestested.Fifty-fivepercentofcurrent smart beta users2 are either already using or very likely tousemultifactororFactorCombinations,comparedto31%of
non-usersofsmartbeta.Similarly,currentsmartbetausersaremorereceptivethannon-userstoDividend-WeightedCurrencyHedge(53%vs.18%),FixedIncome(41%vs.19%)andGDPWeighted(25%vs.13%)approaches.
Smart beta usersNot users of smart beta
Multi-Factor orFactor Combinations
55%
31%
Dividend-weightedcurrency hedge
53%
18%
Fixed income
41%
19%
GDP weighted
25%
13%
2 Includes both aided and unaided smart beta users.
Percentage indicates respondents already using, or very likely to use in the next year or two

17Smartbeta:2015surveyfindingsfromU.S.financialadvisors
More than 70% of financial advisors who are using smart beta are using more than one smart beta investment approach.
Amongfinancialadvisorswhoarecurrentlyusingsmartbeta,just28%areusingasinglesmartbetainvestmentapproach.Halfofsmartbetausersareusingtwoorthreedifferentsmartbetaapproaches,while20%ofusersareusingfourormore.
Segment = Smart beta users (aided and unaided)
Exhibit 12 Number of smart beta investment approaches being used
28% One33% Two17% Three10% Four11% Five or more

18 Smart beta: 2015 survey findings from U.S. financial advisors
5
The smart beta user profile has several notable characteristics.
Compared to non-users of smart beta, the profile of a financial advisor currently using one or more smart beta products has several evident characteristics.
Advisorswhousesmartbetaaremorelikelytobeyounger,tohavehighersharesofAUMinETFsandalternativeinvestmentsandtohavepracticesthatextendbeyondthecoreactivitiesofinvestmentselection,assetallocationandfinancialplanning.
Asdiscussedearlier,smartbetausersaremorelikelytoviewsmartbetaasactivemanagementandtheyaremorereceptivetothenewersmartbetaapproachestested.Youngeradvisorsaremorelikelytobeusingsmartbetaandarealsomorelikelytohaveunaidedfamiliaritywiththeterm“smartbeta.”
Exhibit 13
Age of smart beta users.
Segment = Smart beta users
44%
34%
Under 40
41%
29%
40-49
26%
39%
50-59
33%
21%
78%
70%65%
54%
60 or older
TotalAided UsersUnaided Users

19Smart beta: 2015 survey findings from U.S. financial advisors
Advisors using smart beta are heavier users of ETFs and alternative investments (hedge funds, limited partnerships).
SmartbetastrategiesaremoreoftenusedbyadvisorswhoalsousemoreETFsandalternativeinvestmentsintheirpractices.Amongsmartbetausers,32%ofadvisorshavemorethan20%ofclientportfolioassetsinvestedinETFs
comparedto16%fornon-usersofsmartbeta.Similarly,20%ofadvisorswhousesmartbetahavemorethan10%ofclientportfolioassetsinvestedinalternativeinvestmentscomparedto11%fornon-usersofsmartbeta.
Includes both aided and unaided smart beta users.
Exhibit 14 Percentage of advisors with more than 20% invested in ETFs
Exhibit 15 Percentage of advisors with more than 10% invested in alternative investments
32%
16%
Smart beta users Non users of smart beta
Smart beta users Non users of smart beta
Smart beta users are more often advisors whose practices extend beyond the core activities of investment selection, asset allocation and financial planning.
Comparedtoadvisorswhohavenotusedasmartbetaproducts,smartbetausersaremoreapttoreportspendingagreatdealoftimedoingriskmodeling(27%vs.14%)andestateplanning(18%vs.9%).Conceivably,becausetheir
practicesprovideagreaterrangeofclientservicesandbecause they don’t have enough time to manage individual stocksandbonds,smartbetausersaremorelikelythannon-userstouseactivelymanagedfunds(79%vs.68%).
20%
11%

20 Smart beta: 2015 survey findings from U.S. financial advisors
RIAs are more familiar with smart beta and more likely to identify as being users of smart beta products.
6
RIAs are more likely than regional, independent and wirehouse advisors to know the term “smart beta.”
RIAs are also the most likely to identify as being smart beta users.Forty-sixpercentofRIAadvisorsinthesurveyanswered“Yes”tothequestion“Haveyoueverusedsmartbeta?,”comparedwithanaverageof32%ofotheradvisors.
Consideringbothunaidedandaidedsmartbetausers(“aided”beingthosepromptedbyspecificsmartbetaproductnames):
WirehouseandRIAadvisorsreporthigherusage(73%and70%,respectively)thanindependentorregionalbroker-dealers(62%and63%,respectively),althoughthesedifferencesarenotstatisticallysignificant.
Exhibit 16
Do you know the term “smart beta”?
Independent
RIA
Wirehouse
Total = 65%
Regional
58%
79%
66%
56%

21Smart beta: 2015 survey findings from U.S. financial advisors
Exhibit 17 Smart beta usage by channel.
Regional
32%
31%
63%
Independent
29%
32%61%
RIA
24%
46%
70%
Wirehouse
34%
39%73%
Unaided usersAided usersTotal

22 Smart beta: 2015 survey findings from U.S. financial advisors
Conclusion
TheprofileofadvisorsusingsmartbetaproductsthemostincludesRIAsunder50yearsoldwhohaveasignificantshareofAUMinETFsandalternativeinvestments (such as hedge funds and commodities).Theyalsotendtohavepracticesthatgobeyondinvestmentselectionandsimplefinancialplanningintomorecomplexareassuchasriskmodelingandestateplanning.More
thantwo-thirdsofadvisorssurveyedarecurrentlyusingsmartbetaproductsintheirpractices,andamongthoseadvisorsnotusing,89%areinterestedinsmartbeta.Yet,withlessthanoneinfiveadvisorsreportingthattheyareveryfamiliarwiththeterm“smartbeta,”andwithsomeadvisorsthinkingsmartbetaisatypeofactivemanagement,itisevidentthateducationisstillneeded.
The results of this study demonstrate that advisor interest in smart beta is high.

23Smart beta: 2015 survey findings from U.S. financial advisors
Appendix
How long have you worked as a financial advisor or producer?
What are your total assets under management?
Which of the following type of organization do you work for?
About what percent of your assets under management is in ETFs?
3 to 5 years
6 to 10 years
11 to 20 years
20 years or more
1%15%
45%39%
4% to 5%
13%
6% to 10%
28%
11% to 20%
33%
21% to 50%
24%
More than 50%
3%
$20-25 M
$25-50 M
$50-100 M
$100-250 M
$250+M
5%
14%
29%34%
18%
Regional broker-dealer
Registered investment advisor (RIA)
An independent broker-dealer
Other
Wirehouse or national broker-dealer 29%
23%
23%
21%
4%

What percent of your annual revenue is fee-based?
Gender
28%
39%34%
20% to 49% 50% to 74% 75% or more
FemaleMale
90% 10%
Currently how many clients do you work with?
Age
Less than 50
2%
50 to 149
25%
150 to 249
32%
250 to 349
24%
350 or more
17%
50–5940–49Under 40
16%
60 or older
16%
25%
Prefer not to say
11%
32%
24 Smartbeta:2015surveyfindingsfromU.S.financialadvisors

Thinking about your practice, how much of your time is spent on the following activities for clients:
SomeA great deal
Estate planning 15% 59%
Asset allocation 56% 39%
Investment selection 63% 34%
Financial planning 53% 42%
Risk modeling 23% 53%
25Smartbeta:2015surveyfindingsfromU.S.financialadvisors

26 Smart beta: 2015 survey findings from U.S. financial advisors
Definitions of smart beta indexes referenced
Dividend/income yield–Companiesintheindexareweightedbyhistoricaldividendyield.Resultingindexesmayprovidehigherdividendyieldthantraditionalmarketcapweightedindexes.
Equal weight–Companiesinanindexareequallyweightedsosmallercapstocksmaycomprisealargerportionoftheindexascomparedtothetraditionalmarketcapweightedindexes.
Low volatility–Companiesarerankedaccordingtohistoricalvolatility(fromlowesttohighest)andstocksexhibitinglowvolatilityareincludedintheindex.Theresultingindexmayexhibitlowervolatilitythantraditionalmarketcapweightedindexes.
Fundamental–Companiesintheindexareweightedbyfundamentalmeasuresofcompanysize(salesgrowth,operatingcashflow,dividends)ratherthanbymarketcapitalization.
High quality–Companiesintheindexareweightedbycertainqualityvariables(i.e.lowearningsvariability,highreturnonassets,andlowleverage)andmayprovidehigherreturnsthantraditionalmarketcapweightedindexeswithasimilarlevelofvolatility.
Momentum–Companiesintheindexthathaveconsistentlyexhibitedstrongperformanceovertheprior12monthsareselected.
Fixed income–Index-basedfixedincomestrategythatdoesn’tweightonsizeofthedebtissuedbutbondsareequalweightedoryield-weighted.
Multifactor or factor combinations–Indexcombinesmultiplefactors(i.e.lowvolatility,quality,value,etc.)inordertoenhancereturns,maximizediversification,andpotentiallyprovidehigherrisk-adjustedreturns,ascomparedtotraditionalmarketcapweightedindexes.
GDP weighted–AglobalindexwherecountryexposureisGDP-weighted.Thisprovidesalinkbetweenaglobalorregionalindex’scountryallocationsandtherelativeeconomicimportanceofthecountriesrepresentedbytheindex.Thisenablesmoreweighttobeputinemergingmarketsandlessindevelopedmarketsthantraditionalmarketcapweightedindexes.
Dividend-weighted currency hedge–Companiesintheindexareinternational/globaldevelopedmarketcompaniesweightedbyhistoricaldividendgrowthandtheindexprovidescurrencyhedging.TheresultingindexesmayprovidehigherreturnpotentialthantraditionalmarketcapweightedindexeswhileatthesametimeneutralizingexposuretofluctuationsbetweenthevalueofforeigncurrenciesandtheU.S.dollar.

Important information
© 2015 London Stock ExchangeGroupcompanies.
LondonStockExchangeGroupcompaniesincludesFTSEInternationalLimited(“FTSE”),FrankRussellCompany(“Russell”),MTSNextLimited(“MTS”),andFTSETMXGlobalDebtCapitalMarketsInc(“FTSETMX”).Allrightsreserved.
“FTSE®”,“Russell®”,“MTS®”,“FTSETMX®”and“FTSERussell”andotherservice marks and trademarks related totheFTSEorRussellindexesaretrademarks of the London Stock ExchangeGroupcompaniesandareusedbyFTSE,MTS,FTSETMXandRussellunderlicense.
Allinformationisprovidedforinformationpurposesonly.Everyeffortis made to ensure that all information giveninthispublicationisaccurate,butnoresponsibilityorliabilitycanbeacceptedbytheLondonStockExchangeGroupcompaniesnoritslicensors for any errors or for any loss fromuseofthispublication.
Neither the London Stock Exchange Groupcompaniesnoranyoftheirlicensorsmakeanyclaim,prediction,warrantyorrepresentationwhatsoever,expresslyorimpliedly,eitherastothe results to be obtained from the useoftheFTSERussellIndexesorthefitnessorsuitabilityoftheIndexesforanyparticularpurposetowhichtheymightbeput.
The London Stock Exchange Groupcompaniesdonotprovideinvestment advice and nothing in this communication should be takenasconstitutingfinancialorinvestmentadvice.TheLondonStockExchangeGroupcompaniesmakenorepresentationregardingtheadvisabilityofinvestinginanyasset.A decision to invest in any such asset should not be made in reliance on any informationherein.Indexescannotbeinvestedindirectly.Inclusionofanassetin an index is not a recommendation tobuy,sellorholdthatasset.Thegeneral information contained in thispublicationshouldnotbeacteduponwithoutobtainingspecificlegal,tax,andinvestmentadvicefromalicensedprofessional.
Nopartofthisinformationmaybereproduced,storedinaretrievalsystem or transmitted in any form or byanymeans,electronic,mechanical,photocopying,recordingorotherwise,withoutpriorwrittenpermissionoftheLondonStockExchangeGroupcompanies.DistributionoftheLondonStockExchangeGroupcompanies’index values and the use of their indexes tocreatefinancialproductsrequirealicensewithFTSE,FTSETMX,MTSand/orRusselland/oritslicensors.
CORP-10578

About FTSE RussellFTSERussellisaleadingglobalproviderofbenchmarking,analyticsanddatasolutionsforinvestors,givingthemapreciseviewofthemarketrelevanttotheirinvestmentprocess.Acomprehensiverangeofreliableandaccurateindexesprovidesinvestorsworldwidewiththetools they require to measure and benchmark marketsacrossassetclasses,stylesorstrategies.
FTSERussellindexexpertiseandproductsare used extensively by institutional and retail investorsglobally.Forover30years,leadingassetowners,assetmanagers,ETFprovidersandinvestmentbankshavechosenFTSERussell indexes to benchmark their investment performanceandcreateETFs,structuredproductsandindex-basedderivatives.
FTSERussellisfocusedonapplyingthehighest industry standards in index design and governance,employingtransparentrules-basedmethodologyinformedbyindependentcommitteesofleadingmarketparticipants.FTSERussellfullyembracestheIOSCOPrinciplesanditsStatementofCompliancehasreceivedindependentassurance.Indexinnovationisdrivenbyclientneedsandcustomerpartnerships,allowingFTSERusselltocontinuallyenhancethebreadth,depthandreachofitsoffering.
FTSERusselliswhollyownedbyLondonStockExchangeGroup.
Formoreinformation,visitwww.ftserussell.com.
Contact us for more informationEmail: [email protected],[email protected]: +44(0)2078661810North America: +18775036437Asia PacificHong Kong: +85221643333Tokyo: +81335812764Sydney: +61(0)288233521 ftserussell.com