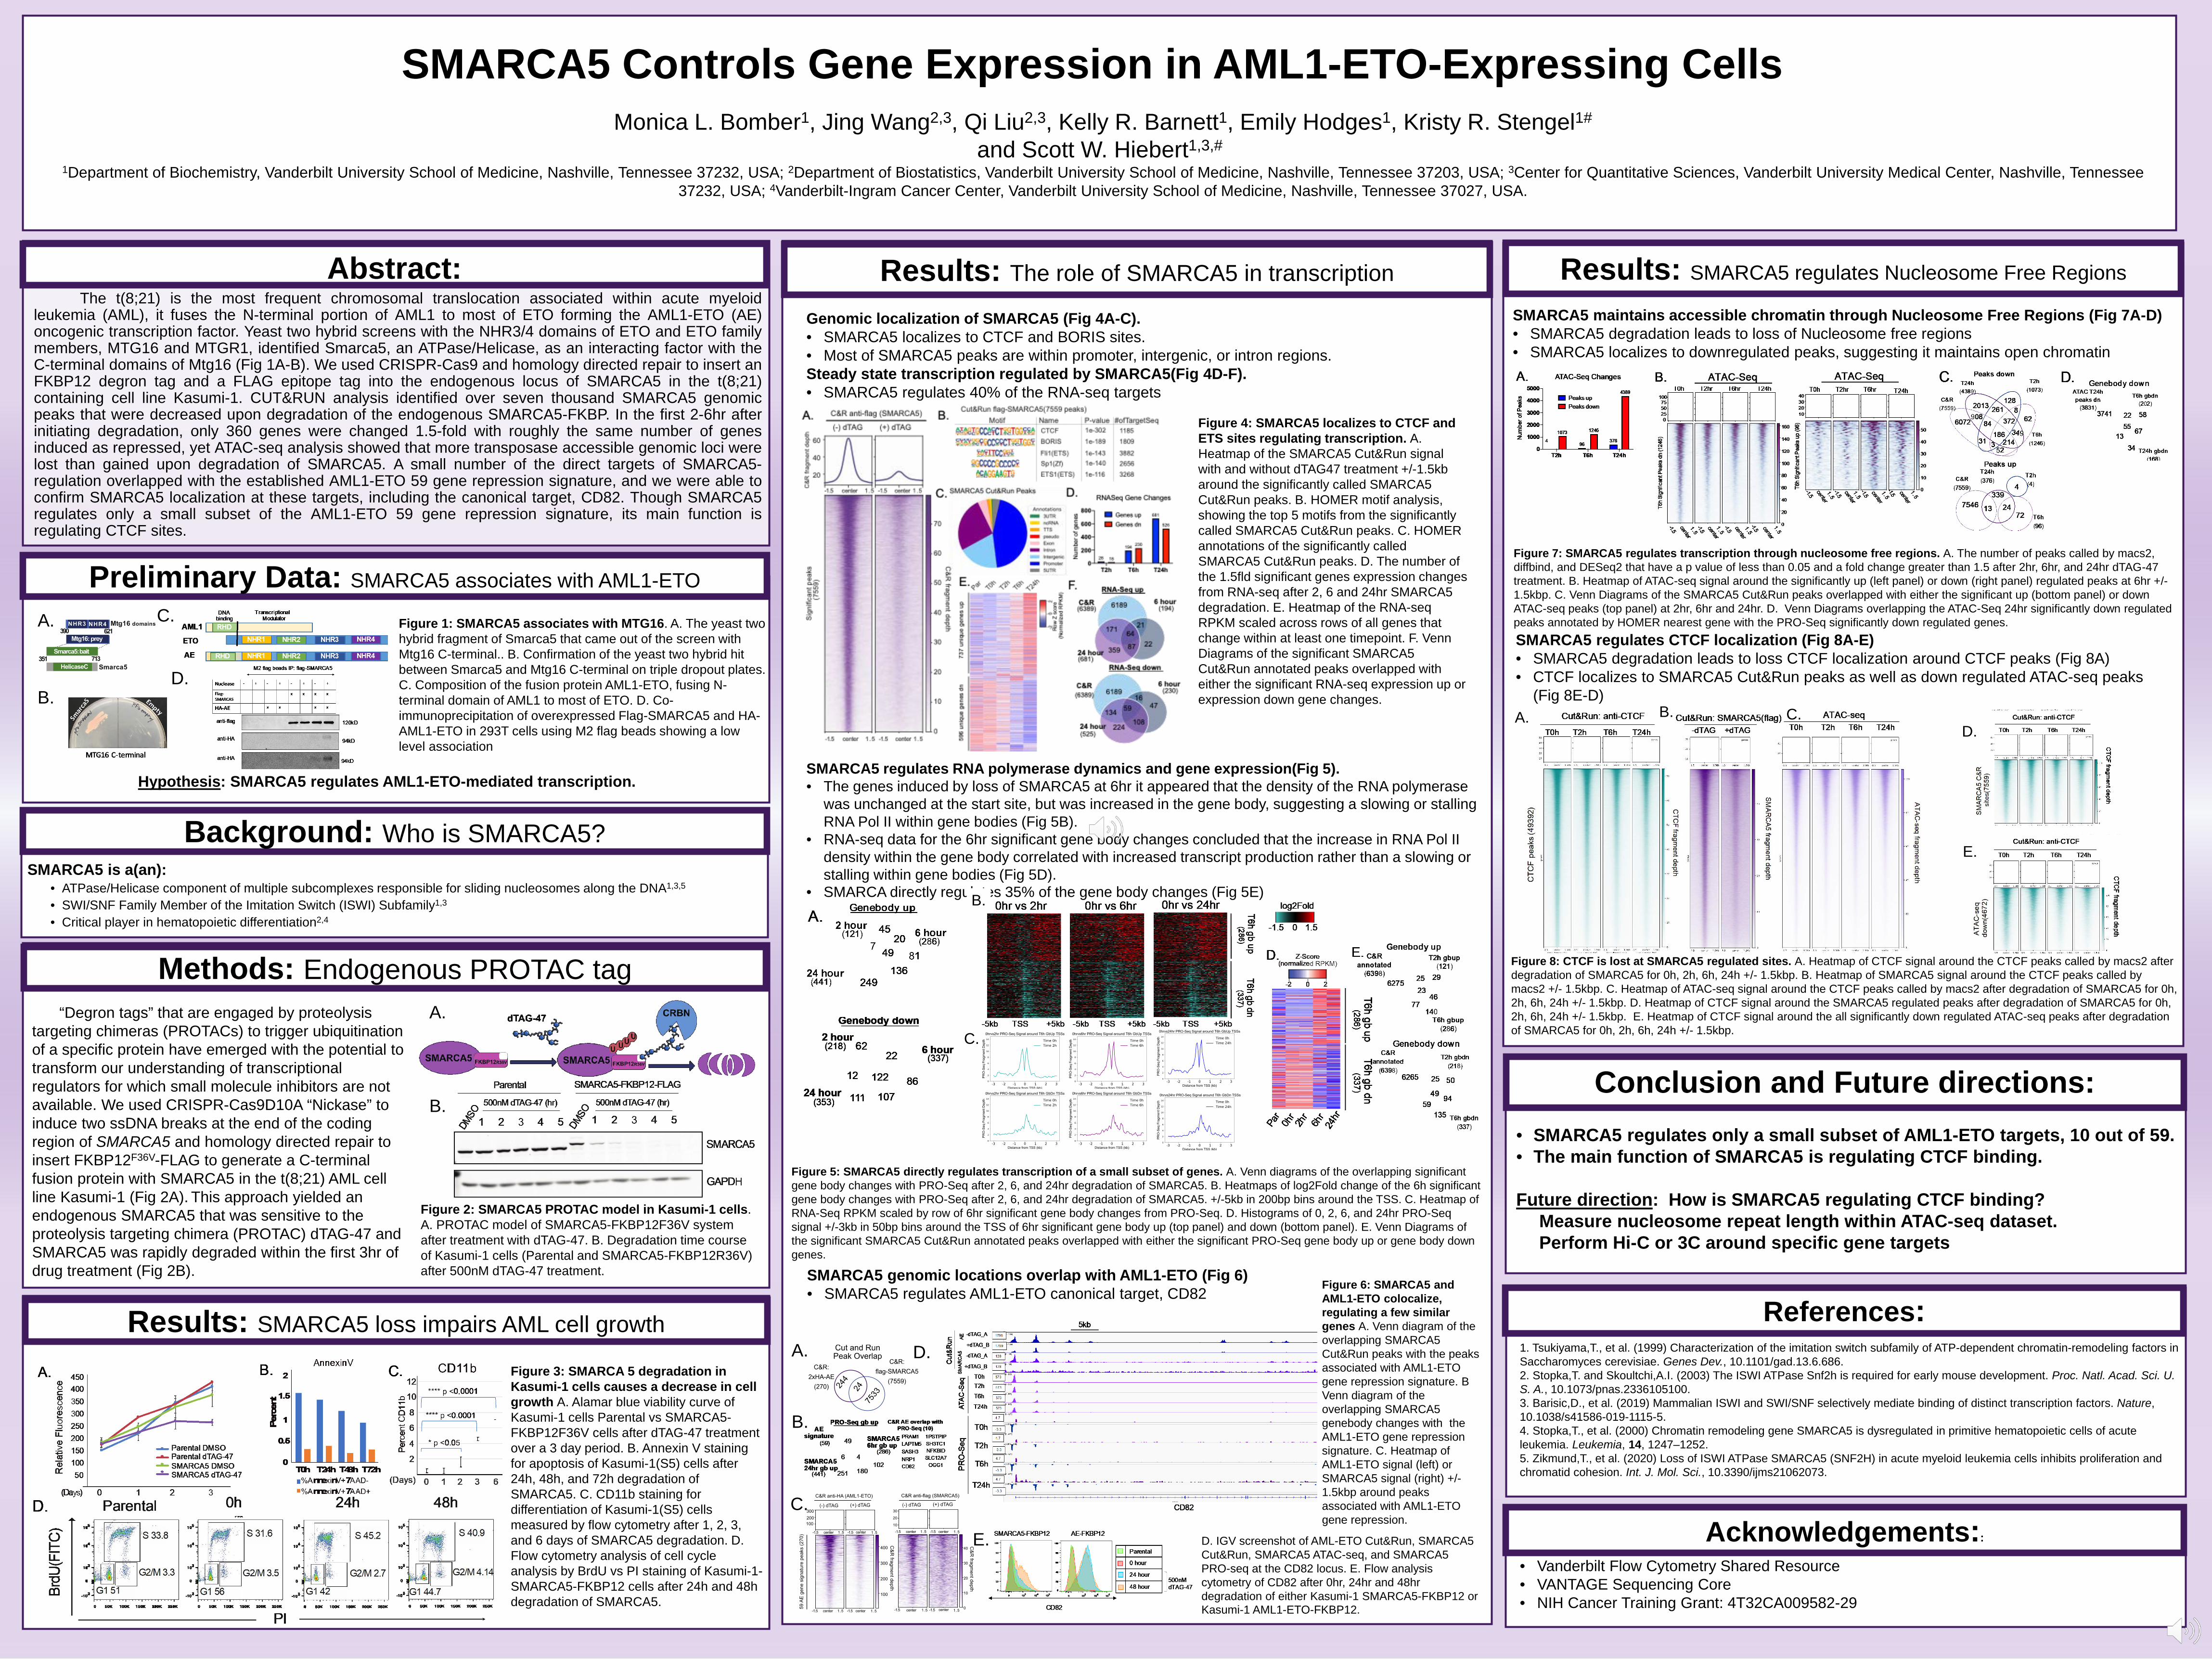
smarca5 controls gene expression in aml1-eto-expressing cells

1
Abstract: Results: SMARCA5 loss impairs AML cell growth Results: The role of SMARCA5 in transcription Results: SMARCA5 regulates Nucleosome Free Regions Acknowledgements:: Methods: Endogenous PROTAC tag References: Conclusion and Future directions: Figure 2: SMARCA5 PROTAC model in Kasumi-1 cells. A. PROTAC model of SMARCA5-FKBP12F36V system after treatment with dTAG-47. B. Degradation time course of Kasumi-1 cells (Parental and SMARCA5-FKBP12R36V) after 500nM dTAG-47 treatment. Figure 3: SMARCA 5 degradation in Kasumi-1 cells causes a decrease in cell growth A. Alamar blue viability curve of Kasumi-1 cells Parental vs SMARCA5- FKBP12F36V cells after dTAG-47 treatment over a 3 day period. B. Annexin V staining for apoptosis of Kasumi-1(S5) cells after 24h, 48h, and 72h degradation of SMARCA5. C. CD11b staining for differentiation of Kasumi-1(S5) cells measured by flow cytometry after 1, 2, 3, and 6 days of SMARCA5 degradation. D. Flow cytometry analysis of cell cycle analysis by BrdU vs PI staining of Kasumi-1- SMARCA5-FKBP12 cells after 24h and 48h degradation of SMARCA5. A. B. Vanderbilt Flow Cytometry Shared Resource VANTAGE Sequencing Core NIH Cancer Training Grant: 4T32CA009582-29 Monica L. Bomber 1 , Jing Wang 2,3 , Qi Liu 2,3 , Kelly R. Barnett 1 , Emily Hodges 1 , Kristy R. Stengel 1# and Scott W. Hiebert 1,3,# 1 Department of Biochemistry, Vanderbilt University School of Medicine, Nashville, Tennessee 37232, USA; 2 Department of Biostatistics, Vanderbilt University School of Medicine, Nashville, Tennessee 37203, USA; 3 Center for Quantitative Sciences, Vanderbilt University Medical Center, Nashville, Tennessee 37232, USA; 4 Vanderbilt-Ingram Cancer Center, Vanderbilt University School of Medicine, Nashville, Tennessee 37027, USA. SMARCA5 Controls Gene Expression in AML1-ETO-Expressing Cells The t(8;21) is the most frequent chromosomal translocation associated within acute myeloid leukemia (AML), it fuses the N-terminal portion of AML1 to most of ETO forming the AML1-ETO (AE) oncogenic transcription factor. Yeast two hybrid screens with the NHR3/4 domains of ETO and ETO family members, MTG16 and MTGR1, identified Smarca5, an ATPase/Helicase, as an interacting factor with the C-terminal domains of Mtg16 (Fig 1A-B). We used CRISPR-Cas9 and homology directed repair to insert an FKBP12 degron tag and a FLAG epitope tag into the endogenous locus of SMARCA5 in the t(8;21) containing cell line Kasumi-1. CUT&RUN analysis identified over seven thousand SMARCA5 genomic peaks that were decreased upon degradation of the endogenous SMARCA5-FKBP. In the first 2-6hr after initiating degradation, only 360 genes were changed 1.5-fold with roughly the same number of genes induced as repressed, yet ATAC-seq analysis showed that more transposase accessible genomic loci were lost than gained upon degradation of SMARCA5. A small number of the direct targets of SMARCA5- regulation overlapped with the established AML1-ETO 59 gene repression signature, and we were able to confirm SMARCA5 localization at these targets, including the canonical target, CD82. Though SMARCA5 regulates only a small subset of the AML1-ETO 59 gene repression signature, its main function is regulating CTCF sites. Figure 4: SMARCA5 localizes to CTCF and ETS sites regulating transcription. A. Heatmap of the SMARCA5 Cut&Run signal with and without dTAG47 treatment +/-1.5kb around the significantly called SMARCA5 Cut&Run peaks. B. HOMER motif analysis, showing the top 5 motifs from the significantly called SMARCA5 Cut&Run peaks. C. HOMER annotations of the significantly called SMARCA5 Cut&Run peaks. D. The number of the 1.5fld significant genes expression changes from RNA-seq after 2, 6 and 24hr SMARCA5 degradation. E. Heatmap of the RNA-seq RPKM scaled across rows of all genes that change within at least one timepoint. F. Venn Diagrams of the significant SMARCA5 Cut&Run annotated peaks overlapped with either the significant RNA-seq expression up or expression down gene changes. Figure 5: SMARCA5 directly regulates transcription of a small subset of genes. A. Venn diagrams of the overlapping significant gene body changes with PRO-Seq after 2, 6, and 24hr degradation of SMARCA5. B. Heatmaps of log2Fold change of the 6h significant gene body changes with PRO-Seq after 2, 6, and 24hr degradation of SMARCA5. +/-5kb in 200bp bins around the TSS. C. Heatmap of RNA-Seq RPKM scaled by row of 6hr significant gene body changes from PRO-Seq. D. Histograms of 0, 2, 6, and 24hr PRO-Seq signal +/-3kb in 50bp bins around the TSS of 6hr significant gene body up (top panel) and down (bottom panel). E. Venn Diagrams of the significant SMARCA5 Cut&Run annotated peaks overlapped with either the significant PRO-Seq gene body up or gene body down genes. “Degron tags” that are engaged by proteolysis targeting chimeras (PROTACs) to trigger ubiquitination of a specific protein have emerged with the potential to transform our understanding of transcriptional regulators for which small molecule inhibitors are not available. We used CRISPR-Cas9D10A “Nickase” to induce two ssDNA breaks at the end of the coding region of SMARCA5 and homology directed repair to insert FKBP12 F36V -FLAG to generate a C-terminal fusion protein with SMARCA5 in the t(8;21) AML cell line Kasumi-1 (Fig 2A). This approach yielded an endogenous SMARCA5 that was sensitive to the proteolysis targeting chimera (PROTAC) dTAG-47 and SMARCA5 was rapidly degraded within the first 3hr of drug treatment (Fig 2B). Genomic localization of SMARCA5 (Fig 4A-C). SMARCA5 localizes to CTCF and BORIS sites. Most of SMARCA5 peaks are within promoter, intergenic, or intron regions. Steady state transcription regulated by SMARCA5(Fig 4D-F). SMARCA5 regulates 40% of the RNA-seq targets SMARCA5 regulates RNA polymerase dynamics and gene expression(Fig 5). The genes induced by loss of SMARCA5 at 6hr it appeared that the density of the RNA polymerase was unchanged at the start site, but was increased in the gene body, suggesting a slowing or stalling RNA Pol II within gene bodies (Fig 5B). RNA-seq data for the 6hr significant gene body changes concluded that the increase in RNA Pol II density within the gene body correlated with increased transcript production rather than a slowing or stalling within gene bodies (Fig 5D). SMARCA directly regulates 35% of the gene body changes (Fig 5E) Figure 8: CTCF is lost at SMARCA5 regulated sites. A. Heatmap of CTCF signal around the CTCF peaks called by macs2 after degradation of SMARCA5 for 0h, 2h, 6h, 24h +/- 1.5kbp. B. Heatmap of SMARCA5 signal around the CTCF peaks called by macs2 +/- 1.5kbp. C. Heatmap of ATAC-seq signal around the CTCF peaks called by macs2 after degradation of SMARCA5 for 0h, 2h, 6h, 24h +/- 1.5kbp. D. Heatmap of CTCF signal around the SMARCA5 regulated peaks after degradation of SMARCA5 for 0h, 2h, 6h, 24h +/- 1.5kbp. E. Heatmap of CTCF signal around the all significantly down regulated ATAC-seq peaks after degradation of SMARCA5 for 0h, 2h, 6h, 24h +/- 1.5kbp. Figure 7: SMARCA5 regulates transcription through nucleosome free regions. A. The number of peaks called by macs2, diffbind, and DESeq2 that have a p value of less than 0.05 and a fold change greater than 1.5 after 2hr, 6hr, and 24hr dTAG-47 treatment. B. Heatmap of ATAC-seq signal around the significantly up (left panel) or down (right panel) regulated peaks at 6hr +/- 1.5kbp. C. Venn Diagrams of the SMARCA5 Cut&Run peaks overlapped with either the significant up (bottom panel) or down ATAC-seq peaks (top panel) at 2hr, 6hr and 24hr. D. Venn Diagrams overlapping the ATAC-Seq 24hr significantly down regulated peaks annotated by HOMER nearest gene with the PRO-Seq significantly down regulated genes. 1. Tsukiyama,T., et al. (1999) Characterization of the imitation switch subfamily of ATP-dependent chromatin-remodeling factors in Saccharomyces cerevisiae. Genes Dev., 10.1101/gad.13.6.686. 2. Stopka,T. and Skoultchi,A.I. (2003) The ISWI ATPase Snf2h is required for early mouse development. Proc. Natl. Acad. Sci. U. S. A., 10.1073/pnas.2336105100. 3. Barisic,D., et al. (2019) Mammalian ISWI and SWI/SNF selectively mediate binding of distinct transcription factors. Nature, 10.1038/s41586-019-1115-5. 4. Stopka,T., et al. (2000) Chromatin remodeling gene SMARCA5 is dysregulated in primitive hematopoietic cells of acute leukemia. Leukemia, 14, 1247–1252. 5. Zikmund,T., et al. (2020) Loss of ISWI ATPase SMARCA5 (SNF2H) in acute myeloid leukemia cells inhibits proliferation and chromatid cohesion. Int. J. Mol. Sci., 10.3390/ijms21062073. Preliminary Data: SMARCA5 associates with AML1-ETO Figure 1: SMARCA5 associates with MTG16. A. The yeast two hybrid fragment of Smarca5 that came out of the screen with Mtg16 C-terminal.. B. Confirmation of the yeast two hybrid hit between Smarca5 and Mtg16 C-terminal on triple dropout plates. C. Composition of the fusion protein AML1-ETO, fusing N- terminal domain of AML1 to most of ETO. D. Co- immunoprecipitation of overexpressed Flag-SMARCA5 and HA- AML1-ETO in 293T cells using M2 flag beads showing a low level association A. B. C. D. Hypothesis : SMARCA5 regulates AML1-ETO-mediated transcription. SMARCA5 genomic locations overlap with AML1-ETO (Fig 6) SMARCA5 regulates AML1-ETO canonical target, CD82 A. B. C. E. D. Figure 6: SMARCA5 and AML1-ETO colocalize, regulating a few similar genes A. Venn diagram of the overlapping SMARCA5 Cut&Run peaks with the peaks associated with AML1-ETO gene repression signature. B Venn diagram of the overlapping SMARCA5 genebody changes with the AML1-ETO gene repression signature. C. Heatmap of AML1-ETO signal (left) or SMARCA5 signal (right) +/- 1.5kbp around peaks associated with AML1-ETO gene repression. D. IGV screenshot of AML-ETO Cut&Run, SMARCA5 Cut&Run, SMARCA5 ATAC-seq, and SMARCA5 PRO-seq at the CD82 locus. E. Flow analysis cytometry of CD82 after 0hr, 24hr and 48hr degradation of either Kasumi-1 SMARCA5-FKBP12 or Kasumi-1 AML1-ETO-FKBP12. B. C. SMARCA5 regulates only a small subset of AML1-ETO targets, 10 out of 59. The main function of SMARCA5 is regulating CTCF binding. Future direction : How is SMARCA5 regulating CTCF binding? Measure nucleosome repeat length within ATAC-seq dataset. Perform Hi-C or 3C around specific gene targets Background: Who is SMARCA5? SMARCA5 is a(an): • ATPase/Helicase component of multiple subcomplexes responsible for sliding nucleosomes along the DNA 1,3,5 • SWI/SNF Family Member of the Imitation Switch (ISWI) Subfamily 1,3 • Critical player in hematopoietic differentiation 2,4 B. A. D. C. E. SMARCA5 maintains accessible chromatin through Nucleosome Free Regions (Fig 7A-D) SMARCA5 degradation leads to loss of Nucleosome free regions SMARCA5 localizes to downregulated peaks, suggesting it maintains open chromatin SMARCA5 regulates CTCF localization (Fig 8A-E) SMARCA5 degradation leads to loss CTCF localization around CTCF peaks (Fig 8A) CTCF localizes to SMARCA5 Cut&Run peaks as well as down regulated ATAC-seq peaks (Fig 8E-D)

Upload: others

Post on 24-Dec-2021

3 views

Category:

Documents


0 download

TRANSCRIPT

Abstract:

Results: SMARCA5 loss impairs AML cell growth

Results: The role of SMARCA5 in transcription Results: SMARCA5 regulates Nucleosome Free Regions

Acknowledgements::

Methods: Endogenous PROTAC tag

References:

Conclusion and Future directions:

Figure 2: SMARCA5 PROTAC model in Kasumi-1 cells. A. PROTAC model of SMARCA5-FKBP12F36V system after treatment with dTAG-47. B. Degradation time course of Kasumi-1 cells (Parental and SMARCA5-FKBP12R36V) after 500nM dTAG-47 treatment.

Figure 3: SMARCA 5 degradation in Kasumi-1 cells causes a decrease in cell growth A. Alamar blue viability curve of Kasumi-1 cells Parental vs SMARCA5-FKBP12F36V cells after dTAG-47 treatment over a 3 day period. B. Annexin V staining for apoptosis of Kasumi-1(S5) cells after 24h, 48h, and 72h degradation of SMARCA5. C. CD11b staining for differentiation of Kasumi-1(S5) cells measured by flow cytometry after 1, 2, 3, and 6 days of SMARCA5 degradation. D. Flow cytometry analysis of cell cycle analysis by BrdU vs PI staining of Kasumi-1-SMARCA5-FKBP12 cells after 24h and 48h degradation of SMARCA5.

A.

B.

• Vanderbilt Flow Cytometry Shared Resource• VANTAGE Sequencing Core• NIH Cancer Training Grant: 4T32CA009582-29

Monica L. Bomber1, Jing Wang2,3, Qi Liu2,3, Kelly R. Barnett1, Emily Hodges1, Kristy R. Stengel1#

and Scott W. Hiebert1,3,#1Department of Biochemistry, Vanderbilt University School of Medicine, Nashville, Tennessee 37232, USA; 2Department of Biostatistics, Vanderbilt University School of Medicine, Nashville, Tennessee 37203, USA; 3Center for Quantitative Sciences, Vanderbilt University Medical Center, Nashville, Tennessee

37232, USA; 4Vanderbilt-Ingram Cancer Center, Vanderbilt University School of Medicine, Nashville, Tennessee 37027, USA.

SMARCA5 Controls Gene Expression in AML1-ETO-Expressing Cells

The t(8;21) is the most frequent chromosomal translocation associated within acute myeloidleukemia (AML), it fuses the N-terminal portion of AML1 to most of ETO forming the AML1-ETO (AE)oncogenic transcription factor. Yeast two hybrid screens with the NHR3/4 domains of ETO and ETO familymembers, MTG16 and MTGR1, identified Smarca5, an ATPase/Helicase, as an interacting factor with theC-terminal domains of Mtg16 (Fig 1A-B). We used CRISPR-Cas9 and homology directed repair to insert anFKBP12 degron tag and a FLAG epitope tag into the endogenous locus of SMARCA5 in the t(8;21)containing cell line Kasumi-1. CUT&RUN analysis identified over seven thousand SMARCA5 genomicpeaks that were decreased upon degradation of the endogenous SMARCA5-FKBP. In the first 2-6hr afterinitiating degradation, only 360 genes were changed 1.5-fold with roughly the same number of genesinduced as repressed, yet ATAC-seq analysis showed that more transposase accessible genomic loci werelost than gained upon degradation of SMARCA5. A small number of the direct targets of SMARCA5-regulation overlapped with the established AML1-ETO 59 gene repression signature, and we were able toconfirm SMARCA5 localization at these targets, including the canonical target, CD82. Though SMARCA5regulates only a small subset of the AML1-ETO 59 gene repression signature, its main function isregulating CTCF sites.

Figure 4: SMARCA5 localizes to CTCF and ETS sites regulating transcription. A. Heatmap of the SMARCA5 Cut&Run signal with and without dTAG47 treatment +/-1.5kb around the significantly called SMARCA5 Cut&Run peaks. B. HOMER motif analysis, showing the top 5 motifs from the significantly called SMARCA5 Cut&Run peaks. C. HOMER annotations of the significantly called SMARCA5 Cut&Run peaks. D. The number of the 1.5fld significant genes expression changes from RNA-seq after 2, 6 and 24hr SMARCA5 degradation. E. Heatmap of the RNA-seq RPKM scaled across rows of all genes that change within at least one timepoint. F. Venn Diagrams of the significant SMARCA5 Cut&Run annotated peaks overlapped with either the significant RNA-seq expression up or expression down gene changes.

Figure 5: SMARCA5 directly regulates transcription of a small subset of genes. A. Venn diagrams of the overlapping significant gene body changes with PRO-Seq after 2, 6, and 24hr degradation of SMARCA5. B. Heatmaps of log2Fold change of the 6h significantgene body changes with PRO-Seq after 2, 6, and 24hr degradation of SMARCA5. +/-5kb in 200bp bins around the TSS. C. Heatmap of RNA-Seq RPKM scaled by row of 6hr significant gene body changes from PRO-Seq. D. Histograms of 0, 2, 6, and 24hr PRO-Seq signal +/-3kb in 50bp bins around the TSS of 6hr significant gene body up (top panel) and down (bottom panel). E. Venn Diagrams of the significant SMARCA5 Cut&Run annotated peaks overlapped with either the significant PRO-Seq gene body up or gene body down genes.

“Degron tags” that are engaged by proteolysis targeting chimeras (PROTACs) to trigger ubiquitination of a specific protein have emerged with the potential to transform our understanding of transcriptional regulators for which small molecule inhibitors are not available. We used CRISPR-Cas9D10A “Nickase” to induce two ssDNA breaks at the end of the coding region of SMARCA5 and homology directed repair to insert FKBP12F36V-FLAG to generate a C-terminal fusion protein with SMARCA5 in the t(8;21) AML cell line Kasumi-1 (Fig 2A). This approach yielded an endogenous SMARCA5 that was sensitive to the proteolysis targeting chimera (PROTAC) dTAG-47 and SMARCA5 was rapidly degraded within the first 3hr of drug treatment (Fig 2B).

Genomic localization of SMARCA5 (Fig 4A-C).• SMARCA5 localizes to CTCF and BORIS sites.• Most of SMARCA5 peaks are within promoter, intergenic, or intron regions.Steady state transcription regulated by SMARCA5(Fig 4D-F).• SMARCA5 regulates 40% of the RNA-seq targets

SMARCA5 regulates RNA polymerase dynamics and gene expression(Fig 5).• The genes induced by loss of SMARCA5 at 6hr it appeared that the density of the RNA polymerase

was unchanged at the start site, but was increased in the gene body, suggesting a slowing or stalling RNA Pol II within gene bodies (Fig 5B).

• RNA-seq data for the 6hr significant gene body changes concluded that the increase in RNA Pol II density within the gene body correlated with increased transcript production rather than a slowing or stalling within gene bodies (Fig 5D).

• SMARCA directly regulates 35% of the gene body changes (Fig 5E)

Figure 8: CTCF is lost at SMARCA5 regulated sites. A. Heatmap of CTCF signal around the CTCF peaks called by macs2 after degradation of SMARCA5 for 0h, 2h, 6h, 24h +/- 1.5kbp. B. Heatmap of SMARCA5 signal around the CTCF peaks called by macs2 +/- 1.5kbp. C. Heatmap of ATAC-seq signal around the CTCF peaks called by macs2 after degradation of SMARCA5 for 0h, 2h, 6h, 24h +/- 1.5kbp. D. Heatmap of CTCF signal around the SMARCA5 regulated peaks after degradation of SMARCA5 for 0h, 2h, 6h, 24h +/- 1.5kbp. E. Heatmap of CTCF signal around the all significantly down regulated ATAC-seq peaks after degradation of SMARCA5 for 0h, 2h, 6h, 24h +/- 1.5kbp.

Figure 7: SMARCA5 regulates transcription through nucleosome free regions. A. The number of peaks called by macs2, diffbind, and DESeq2 that have a p value of less than 0.05 and a fold change greater than 1.5 after 2hr, 6hr, and 24hr dTAG-47 treatment. B. Heatmap of ATAC-seq signal around the significantly up (left panel) or down (right panel) regulated peaks at 6hr +/-1.5kbp. C. Venn Diagrams of the SMARCA5 Cut&Run peaks overlapped with either the significant up (bottom panel) or down ATAC-seq peaks (top panel) at 2hr, 6hr and 24hr. D. Venn Diagrams overlapping the ATAC-Seq 24hr significantly down regulated peaks annotated by HOMER nearest gene with the PRO-Seq significantly down regulated genes.

1. Tsukiyama,T., et al. (1999) Characterization of the imitation switch subfamily of ATP-dependent chromatin-remodeling factors in Saccharomyces cerevisiae. Genes Dev., 10.1101/gad.13.6.686. 2. Stopka,T. and Skoultchi,A.I. (2003) The ISWI ATPase Snf2h is required for early mouse development. Proc. Natl. Acad. Sci. U. S. A., 10.1073/pnas.2336105100.3. Barisic,D., et al. (2019) Mammalian ISWI and SWI/SNF selectively mediate binding of distinct transcription factors. Nature, 10.1038/s41586-019-1115-5. 4. Stopka,T., et al. (2000) Chromatin remodeling gene SMARCA5 is dysregulated in primitive hematopoietic cells of acute leukemia. Leukemia, 14, 1247–1252.5. Zikmund,T., et al. (2020) Loss of ISWI ATPase SMARCA5 (SNF2H) in acute myeloid leukemia cells inhibits proliferation and chromatid cohesion. Int. J. Mol. Sci., 10.3390/ijms21062073.

Preliminary Data: SMARCA5 associates with AML1-ETO

Figure 1: SMARCA5 associates with MTG16. A. The yeast two hybrid fragment of Smarca5 that came out of the screen with Mtg16 C-terminal.. B. Confirmation of the yeast two hybrid hit between Smarca5 and Mtg16 C-terminal on triple dropout plates. C. Composition of the fusion protein AML1-ETO, fusing N-terminal domain of AML1 to most of ETO. D. Co-immunoprecipitation of overexpressed Flag-SMARCA5 and HA-AML1-ETO in 293T cells using M2 flag beads showing a low level association

A.

B.

C.

D.

Hypothesis: SMARCA5 regulates AML1-ETO-mediated transcription.

SMARCA5 genomic locations overlap with AML1-ETO (Fig 6)• SMARCA5 regulates AML1-ETO canonical target, CD82

A.

B.

C.

E.

D.

Figure 6: SMARCA5 and AML1-ETO colocalize, regulating a few similar genes A. Venn diagram of the overlapping SMARCA5 Cut&Run peaks with the peaks associated with AML1-ETO gene repression signature. B Venn diagram of the overlapping SMARCA5 genebody changes with the AML1-ETO gene repression signature. C. Heatmap of AML1-ETO signal (left) or SMARCA5 signal (right) +/-1.5kbp around peaks associated with AML1-ETO gene repression.

D. IGV screenshot of AML-ETO Cut&Run, SMARCA5 Cut&Run, SMARCA5 ATAC-seq, and SMARCA5 PRO-seq at the CD82 locus. E. Flow analysis cytometry of CD82 after 0hr, 24hr and 48hr degradation of either Kasumi-1 SMARCA5-FKBP12 or Kasumi-1 AML1-ETO-FKBP12.

B.

C.

• SMARCA5 regulates only a small subset of AML1-ETO targets, 10 out of 59.• The main function of SMARCA5 is regulating CTCF binding.

Future direction: How is SMARCA5 regulating CTCF binding? Measure nucleosome repeat length within ATAC-seq dataset.Perform Hi-C or 3C around specific gene targets

Background: Who is SMARCA5?SMARCA5 is a(an):

• ATPase/Helicase component of multiple subcomplexes responsible for sliding nucleosomes along the DNA1,3,5

• SWI/SNF Family Member of the Imitation Switch (ISWI) Subfamily1,3

• Critical player in hematopoietic differentiation2,4

B.A.D.

C.

E.

SMARCA5 maintains accessible chromatin through Nucleosome Free Regions (Fig 7A-D)• SMARCA5 degradation leads to loss of Nucleosome free regions• SMARCA5 localizes to downregulated peaks, suggesting it maintains open chromatin

SMARCA5 regulates CTCF localization (Fig 8A-E)• SMARCA5 degradation leads to loss CTCF localization around CTCF peaks (Fig 8A)• CTCF localizes to SMARCA5 Cut&Run peaks as well as down regulated ATAC-seq peaks

(Fig 8E-D)