smallholder farmers response to changes in the farming
TRANSCRIPT
SMALLHOLDER FARMERS’ RESPONSES TO CHANGES
IN THE FARMING ENVIRONMENT IN GOKWE-
KABIYUNI, ZIMBABWE
A mini-thesis submitted to the Institute for Poverty, Land and Agrarian Studies (PLAAS) at the University of The Western Cape, in partial fulfilment of the Master of
Philosophy degree in Land and Agrarian Studies
By: Simbarashe Chereni Registration Number: 2832155
Supervisor: Dr. Michael Aliber
May 2010
ii
ABSRACT Smallholder Farmers’ Responses to Changes in the Farming Environment in Gokwe-Kabiyuni, Zimbabwe S. Chereni Master of Philosophy Degree in Land and Agrarian Studies, Institute for Poverty, Land and Agrarian Studies, University of the Western Cape Following Bryceson’s article, ‘De-agrarianisation in Sub-Saharan Africa: Acknowledging the Inevitable’, and other related writings in the volume Farewell to Farms, rural development has become a contested academic and policy domain. One side of the debate is characterized by ‘agrarian optimism’, mirrored in various state policies and advice from the World Bank; the other side is typified by the de-agrarianisation thesis, which is sceptical regarding the agrarian path to rural development, because it doesn’t accord with dominant trends. The main reasons given for the trend of de-agrarianisation are: unfavourable climatic trends, economic adjustments, and population growth. While the de-agrarianisation thesis seems to be a sensible proposition, it has failed to attract many disciples, evidenced by the continuation of current policy directions towards the agrarian optimistic path. The purpose of this study was to assess the applicability of the de-agrarianisation thesis in the Gokwe-Kabiyuni area of Zimbabwe, during a time when the nation went through climatic, economic and political crises. The idea was to assess the influence of such an environment to smallholder farmers in terms of livelihood strategies by observing trends in climate, education, occupation, and crop yields over the period. Both qualitative and quantitative methods were used to establish whether the de-agrarianisation process can be noted in two villages over the period 1990-2008. A comparative analysis of the experiences of smallholder farmers in these two villages revealed the existence of a cultivation culture and differential agrarian resilience depending on natural resource endowment and levels of infrastructural development, notwithstanding the involvement of the villagers in non-farm activities to diversify their livelihood portfolios. Because inflation intensified towards 2008, non-farm activities were gradually adjusted, in that those which involved buying and selling were dropped. May 2010
iii
DECLARATION I declare that Smallholder Farmers’ Responses to the Farming Environment in Gokwe-Kabiyuni, Zimbabwe is my own work and that it has not been submitted for any degree or examination in any other University and that all the sources I have used or quoted have been indicated and acknowledged by complete references. Full name: Simbarashe Chereni Date: 14 May 2010
Signed
iv
DEDICATION To all rural development practitioners and academics
v
ACKNOWLEDGEMENTS I wish to express my heartfelt gratitude to a couple of colleagues who contributed their ideas to make this project a success. Firstly I would like to thank my supervisor, Dr. Michael Aliber for his useful contributions from the conceptualization stage of the research question to the final compilation of this volume. Through his analytical rigor, I developed invaluable academic writing skills. To him I say its job well done. Secondly, I appreciate Dr. Moenieba Isaacs’ contributions on the formulation of research ideas, especially the need to capture the economic, physical, social, and political dimensions of the farming environment in the study. I also express my sincere gratitude to the Belgian Government for funding this thesis. Lastly I would like to thank my wife Emerita for enduring days of loneliness when I was doing the fieldwork, writing and editing of this dissertation.
vi
CONTENTS
CHAPTER 1: INTRODUCTION
1.1 Introduction………………………………………………………………………..... 1 1.2 Statement of the problem…………………………………………………………… 2 1.3 General objective………………………………………………..……………………. 3 1.4 Specific objectives…………………………………………………………………….. 3 1.5 Research questions…………………………………………………………………... 4 1.6 Justification of study………………………………………………………………… 4 1.7 Dissertation outline…………………………………………………………………… 6
CHAPTER 2: LITERATURE REVIEW AND CONCEPTUAL FRAMEWORK 2.1 Introduction…………………………………………………………………………. 8 2.2 Conceptual framework……………………………………………………………... 8 2.2.1 The Marxist approach………………..…………………………………….. 8 2.2.2 The Inverse relationship (GKI perspective)………………………………... 10 2.2.3 The de-agrarianisation hypothesis…………………………………………. 10 2.2.4 Economic theories and models……………………………………………... 11 2.2.5 Systems theory………………………………………………………………. 12 2.3 Definition of Terms………………………………………………………………….. 14 2.3.1 Farm inputs………………………………………………………………… 14 2.3.2 Farm process……………………………………………………………….. 14 2.3.3 Farm produce………………………………………………………………. 15 2.4 Review of Past Studies………………………………………………………………. 16 CHAPTER 3: BACKGROUND TO THE STUDY 3.1 Introduction………………………………………………………………………….. 22 3.2 Background to Zimbabwe’s agrarian policy………………………………………. 22 3.2.1 Zimbabwe under company rule……………………………………………. 22 3.2.2 Agricultural policy under self governing rule……………………………... 23 3.2.3 The post independence land and agrarian experience…………………….. 25 3.3 The Gokwe- Kabiyuni area…………………………………….................................. 26 3.3.1 Physical environmental trends……………………………………………… 27 3.3.2 The political landscape…………………………………………………........ 28 3.3.4 The economic environment…………………………………………………. 31 CHAPTER 4: RESEARCH METHODOLOGY 4.1 Introduction…………………………………………………………………………. 35
vii
4.2 Data requirements………………………………………………………………….. 35 4.3 Sampling procedure………………………………………………………………… 36 4.4 Data gathering Techniques…………………………………………………………. 37
4.4.1 Desktop research…………………………………………………………... 37 4.4.2 Interviews…………………………………………………………………. 37 4.4.3 Household interviews……………………………………………................ 38 4.4.4 Transect walks……………………………………………………………... 39
4.5 Data presentation and analysis techniques………………………………………... 39 4.5.1 Manual data analysis……………………………………………………….. 39
4.5.2 Content analysis…………………………………………………………… 40 4.6 Synopsis……………………………………………………………………………... 40 CHAPTER 5: DATA PRESENTATION, ANALYSIS AND INTERPRETATION Error! Bookmark not defined.
5.1 Introduction ........................................................................ Error! Bookmark not defined. 5.2 Findings ............................................................................... Error! Bookmark not defined.
5.2.1 Introduction .................................................................. Error! Bookmark not defined. 5.2.2 Nyoni village household socio-economic data ............ Error! Bookmark not defined. 5.2.3 Maringa 1 village household socio-economic data ..... Error! Bookmark not defined.
5.3 Comparing Nyoni village and Maringa 1 village ............ Error! Bookmark not defined. 5.4 Synopsis and discussion ..................................................... Error! Bookmark not defined.
5.4.1 Introduction .................................................................. Error! Bookmark not defined. 5.4.2 Applicability of the de-agrarianisation thinking ......... Error! Bookmark not defined. 5.4.3 Social differentiation/identification and the Gokwe-Kabiyuni areaError! Bookmark not defined. 5.4.4 Market structures and the de-agrarianisation thinkingError! Bookmark not defined. 5.4.5 The livestock side of smallholder farming……………………………………... 82
CHAPTER 6: CONCLUSION AND RECOMMENDATIONS……………………… 83 REFERENCES…………………………………………………………………………… 85 APPENDIX……………………………………………………………………………….. 89
viii
ACCRONYMS CMB : Cotton Marketing Board
ESAP : Economic Structural Adjustment Programme
GMB : Grain Marketing Board
MERP : Millennium Economic Recovery Programme
MET : Meteorological Services Department
MDC : Movement for Democratic Change
NDPP : National Development Priority Programme
NERP : National Economic Recovery Programme
NGO : Non Governmental Organisation
UNDP : United Nations Development Programme
ZANU PF : Zimbabwe African National Union (Patriotic Front)
ZIMPREST : Zimbabwe Programme for Economic and Social Transformation
ix
LIST OF TABLES 3(i) Zimbabwe’s inflation statistics………………………………………………………... 33 4(i) Summary of research methodology…………………………………………………… 40
5(i) Household 1 socio-economic data…………………………………………………… 44
5(ii) Household 2 socio-economic data…………………………………………………… 48
5(iii) Household 3 socio-economic data………………………………………………… 51
5(iv) Household 4 socio-economic data…………………………………………………. 56
5(v) Household 5 socio-economic data…………………………………………………. 60
5(vi) Household 6 socio-economic data…………………………………………………. 63
5(vii) Household 7 socio-economic data…………………………………………….. 68
5(viii) Household 8 socio-economic data……………………………………………. 72
5(ix) Summary of households ………………………………………………………….... 77
x
LIST OF FIGURES
2(i) Farming as a system………………………………………………………………. 13
3(i) Rainfall trends for Gokwe………………………………………………………… 27
3(ii) Temperature trends for Gokwe……………………………………………………… 28
3(iii) Tsetse fly traps……………………………………………………………………. 30
3(iv) Cattle affected by tsetse fly…………………………………………………….... 30
3(v) Calf affected by tsetse fly………………………………………………………... 31
3(vi) Village members registering for inputs…………………………………………... 32
5(i) Household 1’s crop production levels……………………………………………. 45
5(ii) A woman going to sell water at the business centre………………………………… 47
5(iii) Household 2’s crop production levels……………………………………………. 49
5(iv) Household 3’s crop production levels……………………………………………. 53
5(v) Diversified gardening………………..…………………………………………… 54
5(vi) Effort to guarantee perennial water supply for the garden……………………….. 55
5(vii) Household 4’s crop production levels…………………………………………... 58
5(viii) Household 5’s crop production levels…………………………………………... 61
5(ix) Household 6’s crop production levels…………………………………………… 65
5(x) Household 7’s crop production levels…………………………………………… 70
5(xi) Household 8’s crop production levels…………………………………………… 73
5(xii) Villagers digging planting holes for conservation farming …….………………. 74
5(xiii) completely dug holes for conservation farming………………………………….. 75
1
CHAPTER 1: INTRODUCTION 1.1 Introduction While smallholder agriculture has always been viewed as the major source of livelihoods of the
poor in rural areas on the African continent, it is continuously responding to changes in the
farming environment. In order to support rural dwellers, it is therefore crucial to understand not
only the needs of smallholder farmers, but how they adapt their livelihoods over time changes in
the environment. The ‘farming environment’ in this dissertation can be defined as the physical,
economic, political and social fabric within which smallholder farming is practiced. Smallholder
farmers’ responses are defined as the coping or adaptive strategies which they embark on in the
event of an unfavourable condition or new opportunity in the environment. These responses may
include farm related adaptation practices (for example, shifts in planting dates, innovations in
land preparation and land management, crop diversification and mixed farming) and
diversification into off-farm activities.
Understanding trends in the farming environment and farmers’ responses has been an object of
contention over the past three decades. Therefore policy recommendations for rural development
have pursued different directions. For example Bryceson (1997) noted a downward spiral of the
orientation towards agro-based livelihoods in Sub-Saharan Africa in general over the past few
decades, a process which she termed ‘de-agrarianisation’. In terms of policy, she expressed
concern over the way in which policy makers are turning a blind eye to de-agrarianisation and
thus promoting an overly-optimistic ‘neo-liberal’ agrarian path to rural development. After
Bryceson’s publication, views on the contribution of smallholder farming to rural livelihoods and
regional economies have been polarized.
It is true that communities innovate new ‘situated micro practices’ to cope with, or take
advantage of, changes in the environment. In the face of current trends in rainfall patterns, and
the worsening political and economic situation in some parts of Sub-Saharan Africa, the
understanding of these innovations is vital for policy makers in formulating overall strategies for
the smallholder sector and rural dwellers at both national and regional level. What is still unclear
is the role of some non-agricultural activities (which were cited by Bryceson as evidence of de-
2
agrarianisation) in farming in an input-output sense, which still calls for a microscopic analysis
of the experience of smallholder farmers at the household and village level. Another interesting
question is: what happens to the trends perceived by Bryceson if some crucial inputs like land are
added to the productivity equation together with some changes in the agrarian structure, for
example, improving market regimes for the smallholder sector?
Using the case of two rural villages in Gokwe, Zimbabwe, this study employed both qualitative
and quantitative methods to understand the relationship between smallholder farming and non-
farm activities in the area since 1990. In particular, the study sought to establish whether
population growth, social differentiation, and spatial relocation were associated with a process of
de-agrarianisation, given the special circumstances which Zimbabwe went through over this
period, including severe economic instability, climate variability and political crisis.
1.2 Statement of the problem
The polarisation of ideology between the de-agrarianisation hypothesis and ‘neo-liberal
agricultural optimism’ has provided two extreme perspectives from which policy makers may
approach rural development in Africa. For example, Bryceson’s concept of de-agrarianisation
conveys the idea that smallholder agriculture is dwindling in significance for rural livelihoods;
on the other hand, the neo-classical agrarian optimists view smallholder agriculture as the spring-
board for the rural economy. Of much concern is the continuation of current policy formulations
along the neo-liberal path, especially the policies of the International Monetary Fund and the
World Bank.
Contemporary Zimbabwe presents an opportunity for a multi-disciplinary study of the
relationship between smallholder farming and rural development under special circumstances,
namely severe macro-economic instability. In other words, the current situation in Zimbabwe
presents an opportunity to look at Bryceson’s de-agrarianisation hypothesis in different
circumstances. If in ‘normal circumstances’ rural dwellers branch out more and more into non-
farm activities and thus both take advantage of, and contribute to, the diversification and
development of the economy, then where the development of the economy is halted or stressed
3
by external factors (in this case, severe macro-economic mismanagement), we might expect to
see a re-emphasis on farming, i.e. ‘re-agrarianisation’. On the other hand, some of the features of
Zimbabwe’s recent economic landscape mirror the pressures that earlier promoted de-
agrarianisation; for example, the Structural Adjustment Programme of the early 1990s arguably
had an effect on reducing state support to farmers in a manner similar to the macro-economic
crisis 10 years later.
1.3 General objective
The aim of this study is to deepen our understanding of the relationship between the farming
environment, farming activities, and non-farm activities in a rural area of Zimbabwe, namely
Gokwe-Kabiyuni, over the period 1990-2008, and establish how it relates to Bryceson’s de-
agrarianisation hypothesis. The hypothesis to be explored is that the changing farming
environment (not physical only) has exerted contradictory pressures on rural households in the
Gokwe-Kabiyuni area, of which some have the effect of advancing the process of de-
agrarianisation, and others have the effect of reversing it.
1.4 Specific objectives
(i) To establish the impact of the physical environmental trends on smallholder farming in
Gokwe-Kabiyuni from 1990 to 2008.
(ii) To assess the implications of the changes in the policy environment in Zimbabwe from
1990 to 2008.
(iii) To examine how smallholder farmers in Gokwe-Kabiyuni adapted to physical
environmental trends and policy shifts.
(iv) To relate the experiences of smallholder farmers in Gokwe-Kabiyuni from 1990 to 2008
to the de-agrarianisation thesis.
4
1.5 Research questions
(i) What changes in the farming environment have smallholder farmers experienced since
1990?
(ii) What changes can be noted in their occupation and livelihood portfolios, in relation to
trends in the farming environment and broader economic environment?
(iii) What is the relationship between the non-farm activities and farming activities in the
area, and how has this relationship evolved over time?
1.6 Justification for the study
Bryceson’s (1997) de-agrarianisation hypothesis has stimulated debate and further research
around the contribution of smallholder agriculture to rural livelihoods and rural development on
the African continent, especially by economists. The basic observation on which her concept and
conclusion are drawn is that although there is fluidity in the use of agriculture as a source of
livelihood both in rural areas and in urban areas, there is a general shift from farming-based
livelihoods to non-agricultural activities on the African continent. It is in this context that she
attacks the neo-liberal orientation of contemporary development policy which is still optimistic
about the agrarian growth path. Her question is whether or not it still makes sense to rely on
liberal agricultural policy prescriptions when the African continent is experiencing a shift in
agricultural orientation.
Recent studies in the area have tried to answer this question. For example, the literature on de-
agrarianisation (presented in Chapter 3) illustrates the real-world complexity of the process.
Current research findings cannot draw policy conclusions to completely answer Bryceson’s
question – whether it still makes sense to follow the agrarian optimistic approach to rural
development in Sub-Saharan Africa. There is still need for further research in various localities.
Besides, the conceptual frameworks that have been used by some researchers leave out some
important concepts like the implication of opening up new opportunities in agriculture, for
example land redistribution, development of irrigation infrastructure, conservation agriculture
5
and input and produce market reforms, which can assist in understanding the behaviour of
smallholder farmers in response to the changing environment. An omission of an analysis of the
relationship between farm activities, non-farm activities and off-farm activities was also made by
Bryceson and other related scholars like Yaro 1999. However, Estudillo and Otsuka (1999),
Mohapatra et al. (2005) observed a symbiotic relationship between farm activities and non-farm
activities, together with off-farm activities.
Non-farm activities can be defined as those activities with are carried out to generate income but
are not directly related to farming, for example selling water, whereas off-farm activities are
related to farming but do not constitute the main farm activity, for example gardening. This is
crucial for assessing the role of smallholder farming in such diversification efforts if appropriate
policy directions are to be recommended.
This study adopts a comprehensive multi-disciplinary conceptual framework, which includes
climatic, economic and socio-political processes that influence smallholder farmers’ behaviour in
decision-making. The concepts are drawn from a couple of theoretical propositions that include
Marxist theory, economic models and the de-agrarianisation hypothesis. The idea is to avoid a
parochial investigation and analysis of data, which does not capture social processes, power
struggles, accumulation and economic incentive and disincentive mechanisms within the
boundaries of peasant farming and rural diversification. Above all, Zimbabwe presents a special
case in terms of its political economy and a special re-orientation of the economy to an agro-
based economy which provides a special opportunity to test Bryceson’s hypothesis under special
circumstances.
6
1.7 Dissertation outline
The dissertation is organized as follows:
Chapter 1: Introduction
This is the introductory chapter which demarcates the scope of the dissertation by explaining the
key words in the title. The chapter presents the problem for which this dissertation sought to
provide solutions. The main objective and specific objectives of the dissertation are also
presented. The chapter also explains why this dissertation was worth undertaking by
summarising the dark and grey areas related to the de-agrarianisation of rural livelihoods in
Africa as a theoretical or hypothetical explanation of smallholder farmers’ responses to the
farming environment.
Chapter 2: Conceptual Framework and Literature Review
The concepts which guided this study are presented in this chapter. Firstly the chapter lays down
six theoretical arguments which relate to the Marxist theory, the GKI perspective, the de-
agrarianisation hypothesis, economic theory and systems theory and relates them to smallholder
activities. Although all the theoretical arguments mentioned above are used to generate concepts
for study, the main theoretical framework which was observed was the de-agrarianisation
hypothesis. Secondly, it presents in a discursive approach, recent studies related to the responses
of smallholder farmers to environmental dynamics. The knowledge gape which motivated the
researcher to undertake this study is also demonstrated.
Chapter 3: Background to The Study
The background of Gokwe-Kabiyuni and Zimbabwe in general is outlined in this chapter. Issues
related to the history of smallholder agriculture – physical, economic, social and political – are
the building blocks of this chapter. The Chapter is crucial in that it explains the attributes of the
7
study area. By so doing, it helps to demonstrate the features and experiences of the farmers in the
area which form the basis for using it in the ongoing debates explained in chapter one and two.
Chapter 4: Research Methodology
This chapter outlines the research strategy for this dissertation. Firstly it summarises the data
requirements of the dissertation from an analysis of the research problem and research objectives
outlined in chapter one. Secondly it explains the stages which were followed in selecting the
sample. Attention was put on the adequacy of the sample in representing various types of
smallholder farmers which are found in the study area. Thirdly, it explains the data gathering
techniques and the rationale behind the use of specific techniques which were used. The
appropriateness of these techniques in relation to the data requirements of the research objectives
was the main consideration in the choice of the research techniques. Lastly the chapter
summarises the data presentation and analysis techniques which were used to draw meaning out
of the field data gathered.
Chapter 5: Data Presentation and Analysis
The research findings are presented and analysed in this chapter. It details the characteristics of
the respondents, the environmental data (physical, social, economic and political) of the study
area, smallholder farmers’ experiences. The chapter engages in a discussion of the meaning of
the data gathered and discusses how the data relates to the theoretical frameworks and previous
research findings presented in chapter two. The overall argument of the dissertation is presented
in this chapter.
Chapter 6: Conclusions and Recommendations
Chapter 6 summarises the dissertation and explains the implications of the research findings to
policy. It ends by listing possible ideas which can be adopted by policy makers in rural
development.
8
CHAPTER 2: CONCEPTUAL FRAMEWORK AND LITERATURE
REVIEW
2.1 Introduction
This chapter presents the concepts that guided the study. It is structured into three sections.
Firstly, it presents the theoretical body of knowledge that has developed to explain the role of
smallholder farming in rural development. This is followed by a review of past studies and their
methodologies. The literature review adopts a discursive approach in a way unearthing what is
still unclear and/or what has been ignored in previous studies.
2.2 Conceptual framework
The objective of this section is to review the theoretical body of knowledge that has been
developed to understand the notion of the peasantry and rural livelihoods. Since the study adopts
a holistic (multi-disciplinary approach) to the analysis of smallholder farmers and rural
livelihoods, Marxist theories, the GKI inverse relationship hypothesis (Griffin et al 2002) and the
de-agrarianisation hypothesis (Bryceson 1997) are briefly discussed to provide a yardstick for
constructing the conceptual framework and review of past studies, observation and analysis of
smallholder farmers’ behaviour in relation to changes in the farming environment.
2.2.1 The Marxist approach
Marx, in his famous influential volume, Capital, first published in 1867, viewed development as
a schematic transition from pre-capitalist modes of production through primitive accumulation –
which creates a condition of market dependence – to a capitalist mode of agricultural production
which creates conditions for growth and productivity of land and labour through technical
innovation and new forms of exploitation. Capitalist agriculture and Petty Commodity
Production (PCP) become the major drivers towards increased agricultural productivity
(Bernstein 1994). According to him, this generates a surplus crucial for industrial accumulation.
9
Subsequently economic growth is realised, which creates a precondition for socialism, i.e. an
egalitarian condition characterized by the re-appropriation of resources. The transition from a
pre-capitalist mode of production is demonstrated by the formation (over time) of classes or at
least class places (Neocosmos 1986), that exemplify a new capitalist social relation: capitalist
landed property, agrarian capital and proletarian agrarian labour’ (Bernstein 2004). The simplest
formulation by Marx (observed from the industrialisation of Britain) is that the first stage is
Feudalism, where the feudal lord/feudal tenant formed the dominant class structure. Changes in
the countryside were stimulated by the political transition-dispossession of the monarchy to
democracy. This created a condition where more successful commercial farmers (usually those
who were previously feudal lords) assimilated the less successful peasants (tenant capitalist
farmers) as wage labour. This exploitation of labour led to increased production and with the
help of trade by merchants, led to the transformation of Britain into an industrial nation.
Variations to this formulation have been given after the study of transformations in Germany, the
United States of America (Lenin 1973), France, Japan and Taiwan. Their detail is outside the
scope of this dissertation, suffice it to say that class formation and new class relations are central
in explaining the transformation of pre-capitalist relations in these states.
What becomes apparent is that the Marxist agrarian question is the question of capital (Bernstein
2006). This first impression brought in by the Marxist tradition has stimulated much debate as it
implies that, once capitalist agriculture is achieved, there is no need for further adjustment in the
land ownership and agrarian structure. This assertion is questionable in post-colonial states like
Zimbabwe who have a history of injustices in land ownership. It might not be true that maximum
productivity is achieved when capitalistic agriculture is achieved. However, the theory has
become an eye-opener to subsequent theorists. Its strength can be established in the concept of
class which has been central not only in theoretical perspectives of later ‘Marxists’ but also in the
theoretical formulations of his critics, for example Griffin, Khan and Ikowitz (2002).
In summary, from a Marxist perspective, it can be concluded that development should be viewed
within the context of class struggles between the capitalist class and the proletariat over the
means of production. In the initial stages in societal development he suggests a gradual process
of differentiation through primitive accumulation (mainly in cultivation) which creates classes in
10
society. The class of capital owns the means of production and the class of labour is dispossessed
of the means of production (Bernstein 1994), and left with no option other than to offer wage
labour to the capitalist enterprises. Such processes have been observed in South Africa during the
apartheid era, leading to structural poverty and inequality which is still a developmental
challenge to the post independence government (see Wolpe 1972). Both Marx and the later
Marxists suggested that the primitive community gradually starts a capitalist tendency through
petty commodity production (PCP). Stronger petty commodity producers start to exploit the
weaker until they become reliant on wage labour. In the quest for understanding the dynamics of
peasant farming and livelihood strategies in Gokwe, this formulation was one of the most crucial
building blocks in the construction of the conceptual map which guided this study.
2.2.2 The inverse relationship between farm size and productivity (the GKI perspective)
The proponents of this view include Griffin, Khan and Ickowitz (2002). They used Marx’s
analysis to further observe the role of fragmented factor markets and labour control in
perpetuating poverty and vulnerability in the peasantry and later classes of capitalist formations,
hence they advocate for the subdivision of large scale commercial farms into small farm units
within the auspices of a land redistributive approach to poverty reduction – a paradigm which
Byres (2004) called neo-classical neo-populism. Their major argument is that small farm units
are more productive as compared to large farm units. Consequently they advocate for the
redistribution of large-scale commercial farms into smaller manageable units to improve
productivity. The concept of size of landholding was of much interest in this study as it is one of
the factors that affect smallholder farmers’ decisions with regards to diversification.
2.2.3 The de-agrarianisation hypothesis
This has been one of the most controversial propositions in the literature on agricultural
development. It suggests a gradual shift from farm-based livelihoods to a diversified portfolio of
activities (Ellis 2000), which include off-farm and non-farm activities in Sub Saharan Africa.
The notable contributor in the formulation of this hypothesis is Bryceson (1997). She defined de-
agrarianisation as a: ‘long-term process of: (i) Occupational adjustment, (ii) income earning
11
orientation, (iii) social identification, and (iv) spatial relocation of rural dwellers away from
strictly peasant modes of livelihood’ Bryceson (1997: 4). In other words the abovementioned
four processes are the indicators of de-agrarianisation. The drivers of de-agrarianisation are
mentioned in her article as: (i) vagaries of climate, (ii) unfavourable market prices for
agricultural produce, (iii) changing access to land, (iv) personal misfortune, (vi) illness and (vii)
war.
The basic observation on which her concept and conclusion are drawn is that although there is
fluidity in the use of agriculture as a source of livelihood both in rural areas and in urban areas,
there is a general shift from farming-based livelihoods to non-agricultural activities. To her, non-
agricultural rural employment “refers to the gamut of economic activities that are performed by
rural dwellers outside farming and maintenance of rural subsistence needs” (ibid: 5). The
consequences of such a shift have been the replacement of public goods with goods provided by
the market (for example provision of safe drinking water), a reduction in demand for traditional
handcraft products and the emerging and establishment of a local service economy in various
rural localities (ibid). It is in this context that she attacks the neo-liberal orientation of
contemporary development policy. According to her, rural development strategies that capitalize
on farm activities and ignore the gradual shift towards off and non-farm activities are not likely
to yield desired results because the poor are shifting their focus from and reducing their
commitment to farm-based livelihood activities. Therefore the question Bryceson raises is
whether one should still rely on liberal agricultural policy prescriptions when the African
continent is experiencing a shift in agricultural orientation.
2.2.4 Economic theories and models
On the other hand, there is the neo-liberal school of thought, which seems to provide signposts
for contemporary development theory in the African context, for example economic
liberalisation policies such as those historically favoured by the World Bank. The principles of
such policies have been exemplified in state policies like the Growth, Employment and
Redistribution (GEAR) strategy in South Africa. Neo-liberal economists have spent a
considerable effort specifying the larger indirect role of agriculture in the economy by examining
12
the forward and backward linkages between agriculture and other sectors of the economy
through input-output analysis (Van Zyl and Vink 1988; Van Seventer, Faux and Van Zyl 1992)
and by simulating the impacts of periodic droughts on growth and employment (Pretorius and
Smal 1992; Van Seventer et al (1999)These studies have demonstrated the existence of a positive
correlation between agricultural production, economic growth and employment, and conclude
that agriculture is therefore a driver of economic development.
The above studies draw from earlier studies, for example Adam Smith’s formulation of the
relationship between agriculture and industry and from Marx’s use of England as a classic
example of primitive accumulation in agriculture and industrialisation. Although economic
modellers during the same period assumed a zero marginal productivity of labour (Lewis 1954;
Gulliver 1955; Mitchell 1957; Elkan 1960), by the mid 1960s, economic analysts and
government policy makers adopted the view that migration from rural areas was depleting
agriculture in terms of the labour force (Bryceson 1997). This view tends to corroborate
Bryceson’s concept of de-agrarianisation since it acknowledges that spatial relocation of people
from farm-based activities contributes to a reorientation from farm-based livelihoods. What
remains unclear is the actual relationship between the movement of labour into other sectors of
the economy and agricultural production, especially in view of linkages in the form of
remittances and the supply of inputs to the farming system (see Reardon et al 2006 and
Mohapatra et al 2005). The question is whether de-agrarianisation in Bryceson’s formulation
necessarily reduces agricultural output and its centrality in fostering rural livelihoods in Africa,
and if yes under what circumstances? Another question of much interest in this debate is that of
the ways in which smallholder farmers adapt to current trends in climate variability and how
these efforts impact on the livelihood orientation.
2.2.5 Systems Theory
In this study farming is viewed in the context of a system with inputs, processes and outputs
within a livelihood framework. The following diagram illustrates this:
13
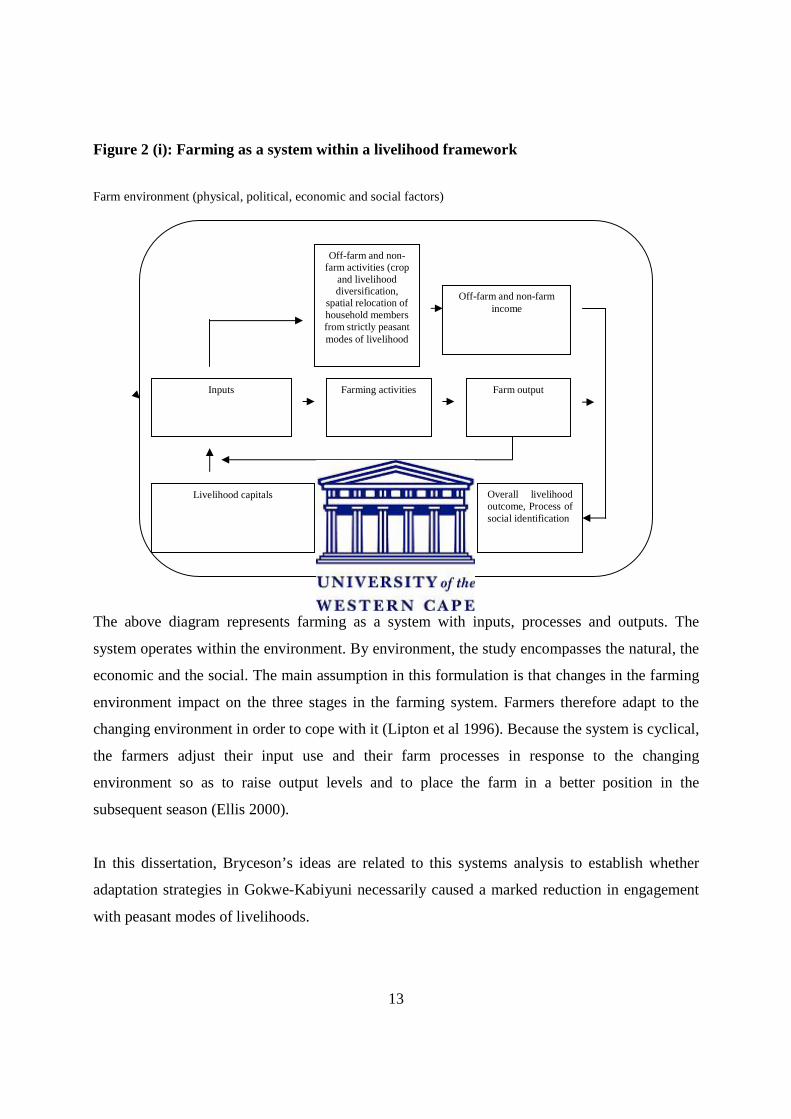
Figure 2 (i): Farming as a system within a livelihood framework
Farm environment (physical, political, economic and social factors)
The above diagram represents farming as a system with inputs, processes and outputs. The
system operates within the environment. By environment, the study encompasses the natural, the
economic and the social. The main assumption in this formulation is that changes in the farming
environment impact on the three stages in the farming system. Farmers therefore adapt to the
changing environment in order to cope with it (Lipton et al 1996). Because the system is cyclical,
the farmers adjust their input use and their farm processes in response to the changing
environment so as to raise output levels and to place the farm in a better position in the
subsequent season (Ellis 2000).
In this dissertation, Bryceson’s ideas are related to this systems analysis to establish whether
adaptation strategies in Gokwe-Kabiyuni necessarily caused a marked reduction in engagement
with peasant modes of livelihoods.
Inputs Farming activities Farm output
Off-farm and non-farm income
Livelihood capitals Overall livelihood outcome, Process of social identification
Off-farm and non-farm activities (crop
and livelihood diversification,
spatial relocation of household members from strictly peasant modes of livelihood
14
2.3 Definition of terms
2.3.1 Farm inputs
These are the resources needed in farming and they can be classified in the following way:
(v) Human Capital – the people who work and provide expertise of the farm.
(vi) Physical Capital – the farm implements and other hard capital endowments on the farm –
this includes land, ploughs, cattle, harrows, yokes etc.
(vii) Natural capital – climate and weather.
(viii) Financial capital – money to use on the farm, for example to buy seed and fertilizer.
(ix) Social capital – these are relational ties that can guarantee access to assistance during
times of need.
(x) Political capital – these are the organisational groupings that necessitate the lobbying for
and appropriation of resources at local level.
2.3.2 Farm Processes
For the purposes of this study, farm processes are not defined in a narrow scientific sense. They
include plant biology, economic processes and socio-political processes that occur in a
household and in a peasant community, which affect the quantity and value of output. The
following concepts are crucial in this regard:
• Contract farming – A system in which farmers are given farming inputs usually by
produce marketing companies on loan, the cost of which will be deducted from what will
be due to them when they sell their produce
• Conservation agriculture – An adaptation strategy which involves minimum tillage, use
of manure and/or fertilizer, and the increasing of the number of crop units per square
meter
15
• Diversification – This is divided into two: (i) Farm activity diversification, which can
capture mixed farming; and (ii) ‘Pluriactivity’ (Barrett et al 2004) – engaging in both on-
farm and off-farm activities. This involves occupational adjustment of the rural dwellers,
income earning orientation and spatial relocation of rural dwellers away from strictly
peasant modes of livelihoods (Bryceson 1997).
• Social Identification – The gradual change in how people identify themselves within and
among peasant households which impacts on their degree of involvement in peasant
activities Bryceson (1997).
• Income earning orientation – This can be defined as the extent to which the household
depends on income from a certain livelihood strategy, for example, a household might be
oriented more towards farm livelihoods or towards non-farm livelihoods.
• Spatial relocation – A process in which rural dwellers shift from areas in which certain
livelihood strategies are central to those areas were they rely basically on different modes
of livelihood.
2.3.3 Farm produce
These are farm products, for example, grain, cotton, milk, meat etc. This term is related to the
terms defined below:
• Produce market – The combined effect of demand and supply on the farm produce.
• Surplus – Surplus in this context is the difference between farm produce and what the
farmer requires for subsistence.
• Farm income – Farm income is the earnings that are derived from the selling of farm
produce.
16
• Off-farm income – Generally this implies all the income that is derived from activities
that are done outside the family farm. This includes therefore piece work done on other
people’s landholdings. However for the purposes of comprehensibility, in this study this
shall imply farm related income earned not from the household’s farm account (Ellis
2000).
• Non-farm income – Non-farm income relates to all the other income from other activities
not directly related to farming for example, informal trading, remittances etc.
• Remittances – This implies money or goods sent to the household concerned, by other
people (usually relatives) who are employed in other sectors of the economy, away from
peasant the community.
2.4 Review of past studies
This section explores recent empirical work that has been carried out in relation to smallholder
farmers’ responses to changes in the farming environment to demonstrate the knowledge gap,
which this study attempts to close. The concepts used and the techniques employed in gathering
and analysing data are reviewed in order to assess the conclusiveness of the studies and the
validity of the data. The review captures what has been found on the international platform,
zeroing down to the Zimbabwean situation.
Research has proliferated around the concept of the peasantry in Sub-Saharan Africa. The reason
for this trend is the perceived centrality of smallholder farming in alleviating poverty and in rural
development. Researchers have therefore converged from various disciplines in a bid to provide
signposts for poverty alleviation and rural development policy. Such disciplines have included
inter alia sociology, economics, and geography. Until recently, researchers from these fields
have been adopting a parochial disciplinary approach to the understanding of smallholder
farmers’ behaviour in relation to the circumstances that they find themselves in. These
17
researchers have therefore created a platform for debate, based on their conceptualizations of
smallholder farming and research findings. Results range from those who are keen to show that
changes in the farming environment cause smallholder farmers to lose interest in farming – to
gradually reorient their livelihood strategies towards non-farm income (de-agrarianisation), to
those which show that smallholder farmers do innovate new strategies to adapt their farming
systems and strategies in line with the changing physical, economic and socio-political
environment to reduce risk, not necessarily reorienting more towards non-farm activities.
A notable contribution is Bryceson’s (1997) de-agrarianisation concept, developed after doing a
cross country analysis of census data on population growth and changes in occupation among
citizens of rural Sub-Saharan Africa since 1960. For example, she noted that between 1965 and
1989, the percentage of the labour force involved in agriculture dropped from 79.0 to 73.8 in
Angola, 86.0 to 74.0 in Cameroon, 61.0 to 59.3 in Ghana and 79.0 to 64.7 in Zimbabwe (see
Table 1: African de-agrarianisation indices under the appendices section). Regardless of the
limitations of analysis (relying on cross country national level census data), Bryceson is
confident to challenge the neo-liberal approach to development that is still optimistic about the
agrarian path to rural development. Her argument is that it is no longer logical to keep on relying
on the agricultural path to rural development because the continent of Africa is reorienting
towards non-agricultural income.
Although there is some sense in Bryceson’s proposition, one would wonder whether national
level census statistics can support such generalisations. In other words, what happens in various
localities still needs attention, especially regarding to the relationship between farm activities and
non-farm activities. Such an analysis was attempted by Mohapatra et al. (2005), studying in
China. They established that there was a linkage between farm activities and non-farm activities,
wherein agricultural produce could be used in non-farm activities and the profit ploughed back to
improve agricultural inputs such as seeds and tractors in a cyclical input-output formula alluded
to in Figure 2 (i) above. Similar processes were also observed by Estudillo and Otsuka (1999) in
the Philippines and by Dione (1989) in Mali.
18
This leaves one with questions as to how the symbiotic relationship influences the general
picture painted by Bryceson’s thesis. Another question becomes that on the dynamics of rural
occupation. Bryceson seems to assume a unilinear process which might not be accurate. There
are occupational dynamics within communities which are induced by changes in the physical,
economic and socio-political environment which are crucial in understanding smallholder
farmers’ behaviour in relation to the environment, if appropriate policy prescriptions are to be
provided. This realisation opened a niche for other researchers like Barrett et al. (2005) studying
Cote d’Ivoire, Rwanda and Kenya, and Jansen et al. (2006) studying a community in Honduras.
These scholars established that diversification is influenced by constraints and opportunities in
the communities that they studied. Such opportunities, incentives and constraints include, inter
alia, the market for agricultural produce, size of landholdings, population pressure, climate and
the level of capital endowment (Reardon 2006). Jansen established that households with low
propensity to diversify into non-farm activities embarked on labour-intensive systems of farming
to manage risk.
The issue of incentives, constraints and opportunities in Sub-Saharan Africa should not just be
viewed from a narrow perspective. Africa’s colonial background has a very big role in shaping
the lives and capabilities of smallholder farmers in Sub-Saharan Africa. Therefore studies which
are quick to conclude that smallholder farmers in Sub-Saharan Africa are re-orienting their
livelihood portfolios towards non-farm based livelihoods without paying attention to the
essential input requirements for smallholder farmers, and analysing how the colonial legacy
adopted by post-independence governments influence their behaviour, are not conclusive. The
majority of their conceptual frameworks conceal crucial issues in understanding the peasantry.
McAllister (2000) asserts that such studies have often undervalued the contribution of agriculture
in rural livelihoods by omitting the significance of green produce (for example green mealies,
pumpkins, water melons, among others) from the perspective. Researchers from a Pan-Africanist
perspective are worth noting in this regard. The following extract about pre-independence South
Africa assists in the understanding of the influence of colonial regulations to smallholder
farmers’ options for survival:
19
“…The overwhelming economic and political power of the capitalist sector had succeeded, whether
through unequal terms of trade or otherwise, in under-developing the African economy so that it no longer
presented any significant competitive threat to White farmers. Production in the African Reserves, of a
marketable surplus became increasingly rare, finally disappearing altogether. Unlike some other situations
elsewhere, therefore, the capitalist sector was unable to extract the (non-existent) surplus product from the
African pre-capitalist sector. The relations between the two were, indeed reduced to the provision by the
backward sector of a supply of labour power to the capitalist sector” (Wolpe 1972:12).
The implication of this is that even to date the problem of the peasantry not only in South Africa,
but in Southern Africa, is still structural. In other words, issues related to landholding and access
to the market cannot be overemphasized in understanding the behaviour of smallholder farmers
in the Southern African region. This is most likely to be the reason why, to Bryceson’s
amazement, the world seems to “turn a blind eye to de-agrarianisation”. Yaro’s (2006) study in
northern Ghana throws some weight on this assertion, recommending that de-agrarianisation
should be conceptualized as a process embedded in social change, recognising the iteration
between farm and non-farm livelihoods. Some interesting observations he made are worth noting
here – even the supposedly booming informal sector is not well established in this area, because
of marginalization and exclusion of the poor peasantry. Therefore the process of adaptation did
not solely imply re-orientation to non-farm activities, but to a greater extent, an intensification of
efforts in the farm sector with seasonal diversification into other livelihood activities.
Studying effects of climate variability in the southern part of Zimbabwe from a geographical
perspective, Scoones (1996) noted that the community shifted crop choices and adjusted the area
planted, and that the benefits from such forms of adaptation accrued more to those with large
areas of land. Deane’s (1997) dissertation established the same in Zimbabwe, reiterating that
even by making small changes in the proportion of the area devoted to maize or small grains,
farm-level productivity in communal areas can be improved because small grains are drought
resistant. A later study by Molua (2002) in southern Cameroon observed shifts in planting dates,
furrow planting, mixed cropping as methods of adaptation to climate variability in the farm
sector.
20
A recent study by Gwimbi (2009) of cotton famers’ vulnerability to climate change in Gokwe
established anomalies in rainfall and temperature patterns which seem to follow the El Nino and
Southern Oscillation, and the La Nina episodes. Three dry spells were observed –
1981/82, 1991/92 and 2001/02 – during which the area received below normal rainfall and
increased temperatures, resulting in massive reduction in cotton yields. The study also
established a long term reduction in rainfall totals particularly for the period after 1980.
To adapt to such changes some farmers switched to drought resistant cotton varieties, others
diversified into other crops, and others were timing the planting dates in line with seasonal shifts.
A large number thought that it would assist much if irrigation facilities could be provided by the
government of Zimbabwe.
Gwimbi (2009) gathered some of the constraints that cotton farmers face in their effort to adapt
to these climate dynamics. These have been cited as: (i) lack of access to timely weather
forecasts, climate change information and credit facilities necessary for them to undertake water
conservation strategies; and (ii) poverty and lack of technology to adapt to climate change.
Scoones’, Deane’s, Molua and Gwimbi’s observations show that if smallholder farmers in Sub-
Saharan Africa are supported in terms of land provision, information dissemination and the
provision of other requisite capitals, they are more likely to remain oriented towards farm-based
livelihoods. It is Yaro’s argument therefore that, in as much as the concept of de-agrarianisation
has been romanticized by some scholars in contemporary literature on the peasantry, ‘re-
agrarianisation’ should also be considered and new conceptual frameworks be built that do not
leave out some of the factors of production. Studies should therefore be carried out in various
localities if comprehensibility of smallholder farmers’ behaviour is to be achieved.
Although neo-liberal economists seem to be on the right track in advocating for the deregulation
of the agricultural market to liberate the peasantry from unfair terms of trade in selling their
produce, studies by Vink and Kirsten (2000) in South Africa established that market deregulation
benefited commercial farmers, but it did not necessarily mean that smallholder farmers enjoyed
these gains. Scholars like Freeman and Silim (2001), as well as Heinman (2002), have cited lack
21
of information, organizational fuzziness (lack of well established groupings for lobbying), and
lack of experience with market negotiation as the major constraints in play. Other limitations
relate to physical market access like roads, market facilities, power and electricity (Magingxa
and Kamara 2003).
Such studies ushered the institutional element into the analysis of the peasantry. The question
that remains is the extent to which institutional reform can assist in the improvement of farm-
based rural livelihoods, and how it will relate to Bryceson’s conclusion? Therefore, in addition to
the other applications of the New Institutional Economics (NIE) framework to input market
failure, it can as well be argued that the rapid changes in the food and agricultural sector in
developing countries after liberalisation and government devolution require that contemporary
researchers include ideas in the NIE (Magingxa and Kamara 2003).
22
CHAPTER 3: BACKGROUND TO THE STUDY
3.1 Introduction
This chapter traces the history of Zimbabwe’s land and agrarian policy in general since 1890. It
also traces the background to the resettlements in Gokwe-Kabiyuni so as to explain the roots of
some special circumstances which necessitated the testing of the de-agrarianisation thesis and its
reverse. Attention is put on the dynamics of the regulatory and policy frameworks and how they
impacted on smallholder farming within the context of a changing physical and policy
environment.
3.2 Background to Zimbabwe’s agrarian policy
3.2.1 Zimbabwe under company rule
By the time of colonization by the British South Africa Company in 1890, white settlers found
traditional agriculture dating back some 2000 years (Kosim 1977), albeit mixed with hunting and
gathering. The pre-Rhodesian society practiced livestock production and also produced a wide
variety of crops and fruits, and engaged in barter trade (Kosim 1977).
This society was devoid of class in the Marxist sense, although one may suggest the existence of
rich and poor peasants. It is also true that in some localities like the south-western part of what is
now Matabeleland Province, hunting and gathering was the sole livelihood strategy among the
Kalanga, the Khoi-Khoi and the San people. In short, before colonization, Zimbabwe was a
primitive communalist territory. After the defeat of the pre-colonial Zimbabweans by the settlers
in the 1890s, an order in council was passed in 1898, which led to the creation of black native
reserves in the drier, less favoured areas, the implementation of which was the responsibility of
the native commissioners (Rukuni 2006). Although the order had some provisions to ensure that
Zimbabweans had access to adequate land for cultivation, grazing and water, these provisions
ignored as shall be seen in the following sections of this chapter.
23
By 1907, it was clear that the white agricultural policy promoted commercial farming through
reliance on imported seed for maize, tobacco, wheat, sorghum, groundnuts and sunflower
(Arrighi 1967). The capacity of the white commercial farmers to capitalize their agricultural
production was enabled by the establishment of the Land Bank in 1912 Arrighi (1967). The
growth in demand for land among the white community led to the 1914 Native reserves
commission, which allocated the better parts of the native reserves to white settlers. As the white
commercial farms were established, they demanded labour from the black reserve areas which in
the early years was not forthcoming. This led to forced labour (chibharo) and in some cases
taxes were imposed so as to force blacks to become wage labourers. Forced labour was also used
to facilitate commodity production. It is also crucial to note that demand for labour was not only
from commercial farms but from the mines as well.
From the economic relations explained above, one observes the emergence of classes. For
example, the white commercial farmers and miners constituted the bourgeoisie while the
labourers on the farms and mines became the proletariat, albeit not in their pure form. In most
cases they were seasonal and/or casual workers who had some land for cultivation in the
reserves, a process which Cordell et al. termed ‘…a combination of hoe and wage’ (1996, cited
by Bernstein 2004:211). This class of the proletariat is called the worker peasant class (Bernstein
ibid). Those who depended on wages and did not own land in the reserves became the proletariat
in their pure form.
3.2.2 Agricultural policy under self-governing rule
The structure of the current agricultural industry in Zimbabwe was shaped during the forty years
of self-governing rule from 1924 to 1965 (Rukuni 2006). The most influential events in the
shaping of current debates in the land and agrarian system of Zimbabwe were: (i) the 1930 Land
Apportionment Act, which formalized the already existing dual economy; (ii) the setting of a
50% subsidy of input costs and a free technical support program for all white commercial
farmers in 1935; (iii) the 1939 declaration that agriculture was a controlled industry which
formalized differential pricing of agricultural commodities depending on whether it was
produced by white commercial farmers or black native peasants; (iv) the control of the
24
agricultural industry was facilitated by the establishment of parastatals such as the Grain
Marketing Board (GMB), Cold Storage Commission (CSC), among others; (v) the establishment
of the Land Settlement Board in 1945 which sought to settle ex-servicemen returned from the
Second World War; (vi) the passage of the Land Husbandry Act, which enforced private land
ownership among the white population and regulated stocking rates among the black native
farmers, and which also led to the establishment of the Tribal Trust Lands (TTLs), formally
native reserves (Beach 1977).
One of the significant events of much interest in this dissertation is the emergence of black
commercial farmers and the stratification of the peasantry into rich, middle and poor peasants,
especially during the Federal Government from 1953 when smallholder farmers were
encouraged to grow crops such as cotton. Cheater’s 1984 study of smallholder production in the
Musengezi area demonstrated how black farmers exploited themselves as petty commodity
producers. She noted that a class of rich black peasants emerged among members of the
vapositori religious sect because the men were polygamous and had many children, the majority
of whom did not go to school, concentrating on the smallholder farm. Because of abundant
labour from their wives and children, they managed to produce much surplus which enabled
them to buy more farm implements and other farm inputs. (See also Cousins et al 1992.)
By this time the main urban areas, especially Harare and Bulawayo, had been significantly
industrialised and were demanding labour. In the period before the federal government, the
proletariat was completely constituted by worker peasants. The formation of the federal
government led to the recruitment of labour from Northern Rhodesia and Nyasaland (now
Zambia and Malawi, respectively) to work in commercial farms and mines (Bernstein 2004).
These people formed a purely proletarian class, free of the means of production. They did not
have pieces of land for cultivation and they completely depended on wage labour. This class
further grew during the time of the Unilateral Declaration of Independence from 1965 because of
the then Prime Minister Ian Smith’s import substitution policy under sanctions by Britain. The
import substitution policy encouraged the growing of cash crops to supply the local
manufacturing industry to such an extent that the purely peasant class disappeared.
Consequently, there was an increase in petty commodity production among the smallholder
25
farmers but still under the dual agricultural structure. However, population pressure in the Tribal
Trust lands increased and signs of reduction in productivity due to land shortages and poor
farming practices were beginning to be noticed (Bernstein 2004).
3.2.3 The Post Independence Land and Agrarian Experience
At independence in 1980, Zimbabwe’s land and agrarian question was deeply rooted in
inequitable and segregatory capitalistic tendencies elaborated in subsequent sections in this
dissertation. The Land Policy Papers – “Intensive Resettlement Policies and Procedures” of
1980, 1983, and 1990 – are the major land policy documents that directed the post independence
agrarian experience in Zimbabwe. Within the auspices of these polices, the government
embarked on a redistributive land reform programme through the willing buyer - willing seller
approach. An argument was however generated which questioned the desirability of the
resettlement model because of fear that it would disturb production in the white commercial
farms (Sachikonye 2003). This strand of debate generated a lot of support from the influential
Commercial Farmers Union (CFU) and also from multilateral institutions (Kinsey 1999).
The government heeded to this call and avoided more radical approaches to land reform. It
therefore focused attention on other elements of agrarian reform, for example agricultural
research and extension, credit, development of irrigation schemes, and social production
infrastructure. When these facilities were extended to smallholder farmers around 1985, it
boosted production and for the first time smallholder agricultural output outstripped the
commercial agricultural output (mainly in grains like maize and sorghum) (Chatora 2003).
Smallholder agriculture was also recognized by the market for agricultural products, evidenced
by the establishment of collection depots of agricultural marketing boards such as the Grain
Marketing Board (GMB) and the Cotton Marketing Board (CMB) in the countryside.
Another strand of the policy debate emerged pertaining to the desirability of tenure reform in
resettlement land holdings. However, the government has been reluctant to intertwine land
redistribution with tenure reform.
26
In the year 2000, there was a new twist in land policy and political debates because of the
polarisation of the relationship between the then ruling party – Zimbabwe African National
Union Patriotic Front (ZANU PF) – and the white commercial farmers. This relationship
emanated from the failure of the 1998 donor conference which was organised to raise funds for
land reform. Issues of neo-colonialism became central in shaping the subsequent approaches to
land and agrarian reform, especially the Fast Track Land Reform Programme under which
ZANU PF, with the assistance of the Zimbabwe Liberation War Veterans Association, embarked
on a violent compulsory acquisition of land which saw most remaining white commercial
farmers being disenfranchised of their landed property. On the other hand the white commercial
farmers, the Movement for Democratic change (the main opposition party) and civil society
shunned this policy stance, mainly on the premise that it disturbed productivity and destabilized
the economy.
3.3 The Gokwe-Kabiyuni Area
There have been notable changes in rainfall patterns in Zimbabwe at large. For example,
Unganai (1996) noted a 10% reduction in average precipitation in the October to April season
from 1900 to 1994.
The Gokwe-Kabiyuni area is one of the four parliamentary constituencies located in the
midlands province to the south-west of Harare. The constituency is characterized by both
medium and very low rainfall. One part of the area falls in natural farming region 3 while the
other part falls in region 4 of Zimbabwe. Historically, it is a thinly populated area where people
have been resettled in the 1990s from other areas like Mberengwa, Zvishavane and Zaka, among
others, to relieve pressure on land in such areas. The area falls within the Communal Areas
(formerly Tribal Trust Lands) and, as the name suggests, it is communally managed. However,
the word communal here does not denote collective management. Land is vested in the president
but traditionally managed by Chiefs, Headmen, and Village Heads who allocate plots to families
who in turn share grazing land. A greater part of the area contains deep fertile soils suitable for
cotton and maize production, along with livestock rearing.
27
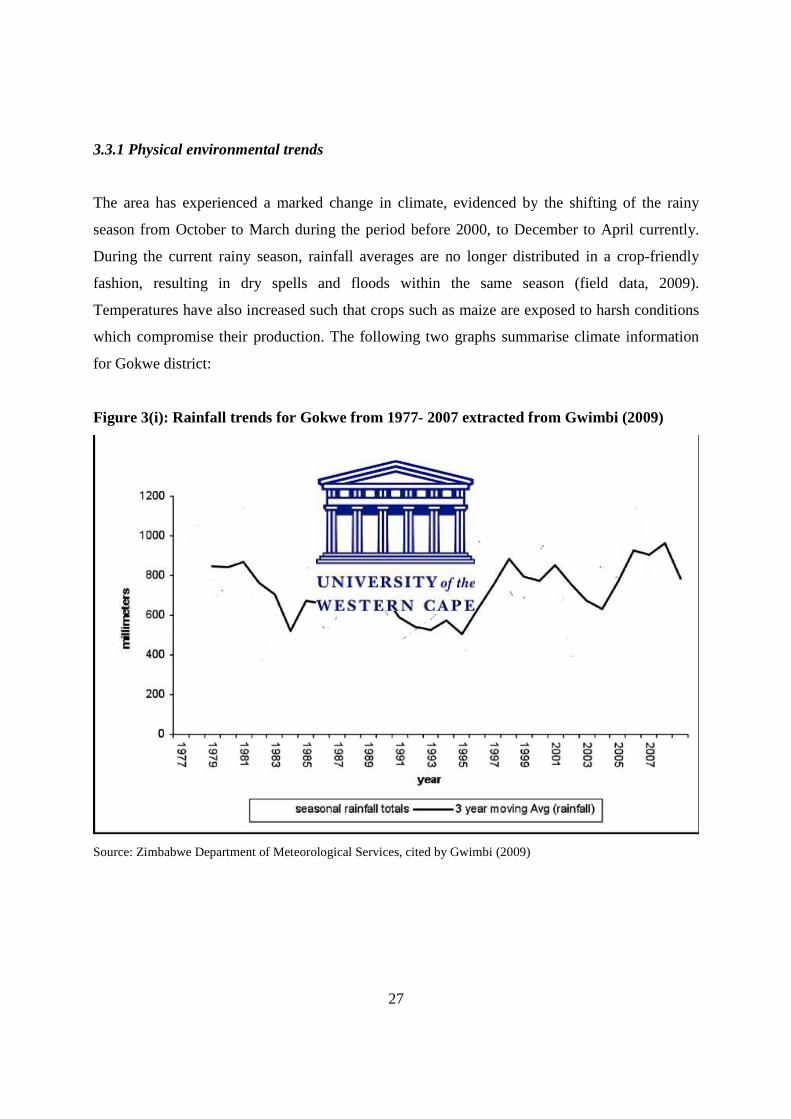
3.3.1 Physical environmental trends
The area has experienced a marked change in climate, evidenced by the shifting of the rainy
season from October to March during the period before 2000, to December to April currently.
During the current rainy season, rainfall averages are no longer distributed in a crop-friendly
fashion, resulting in dry spells and floods within the same season (field data, 2009).
Temperatures have also increased such that crops such as maize are exposed to harsh conditions
which compromise their production. The following two graphs summarise climate information
for Gokwe district:
Figure 3(i): Rainfall trends for Gokwe from 1977- 2007 extracted from Gwimbi (2009)
Source: Zimbabwe Department of Meteorological Services, cited by Gwimbi (2009)
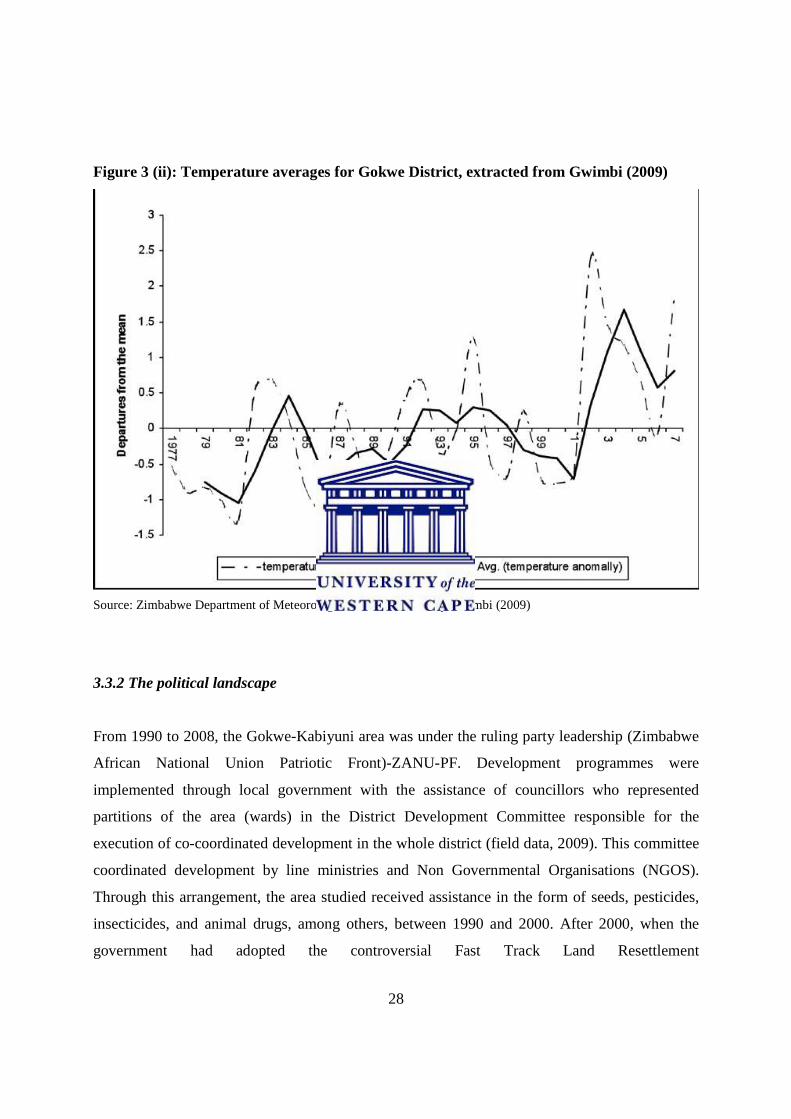
28
Figure 3 (ii): Temperature averages for Gokwe District, extracted from Gwimbi (2009)
Source: Zimbabwe Department of Meteorological Services, cited by Gwimbi (2009)
3.3.2 The political landscape
From 1990 to 2008, the Gokwe-Kabiyuni area was under the ruling party leadership (Zimbabwe
African National Union Patriotic Front)-ZANU-PF. Development programmes were
implemented through local government with the assistance of councillors who represented
partitions of the area (wards) in the District Development Committee responsible for the
execution of co-coordinated development in the whole district (field data, 2009). This committee
coordinated development by line ministries and Non Governmental Organisations (NGOS).
Through this arrangement, the area studied received assistance in the form of seeds, pesticides,
insecticides, and animal drugs, among others, between 1990 and 2000. After 2000, when the
government had adopted the controversial Fast Track Land Resettlement
29
Programme and inflation increased, the government of Zimbabwe was double-bound. On the one
hand the fiscus was strained to such an extent that the government was no longer able to fund the
bulk of development programmes, especially in marginal communities like Gokwe-Kabiyuni; on
the other hand NGOS which operated in the area either downsized their operations or withdrew
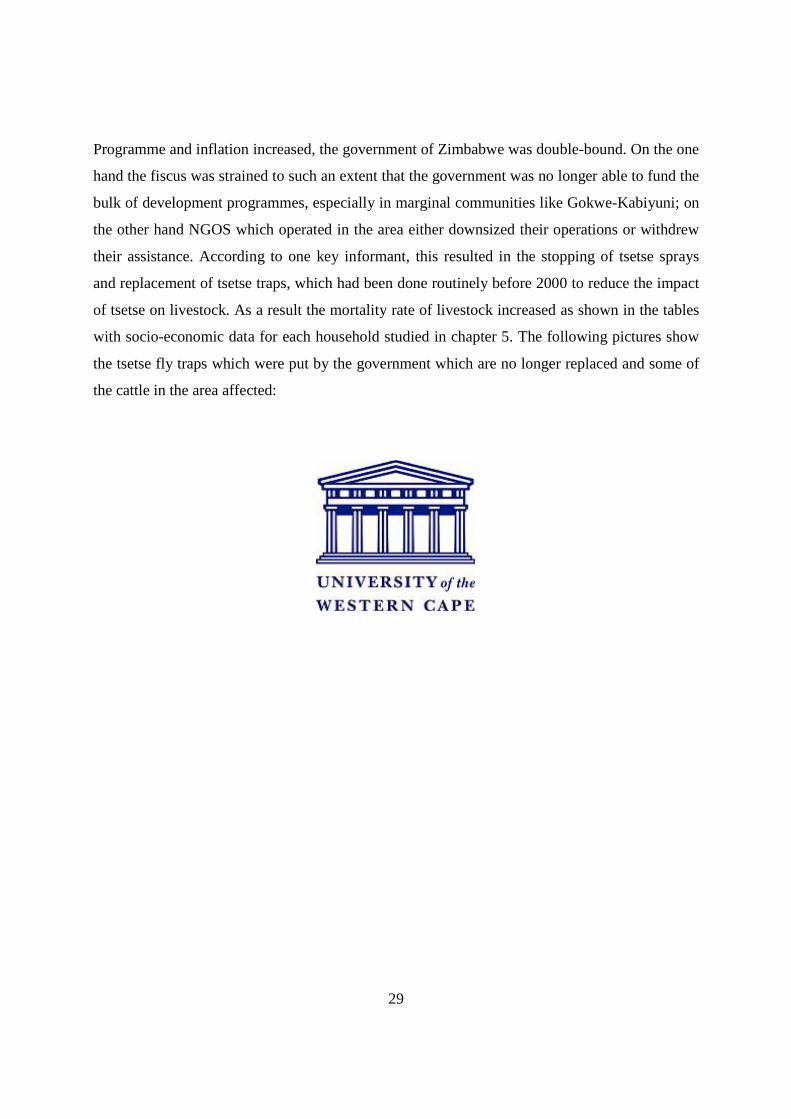
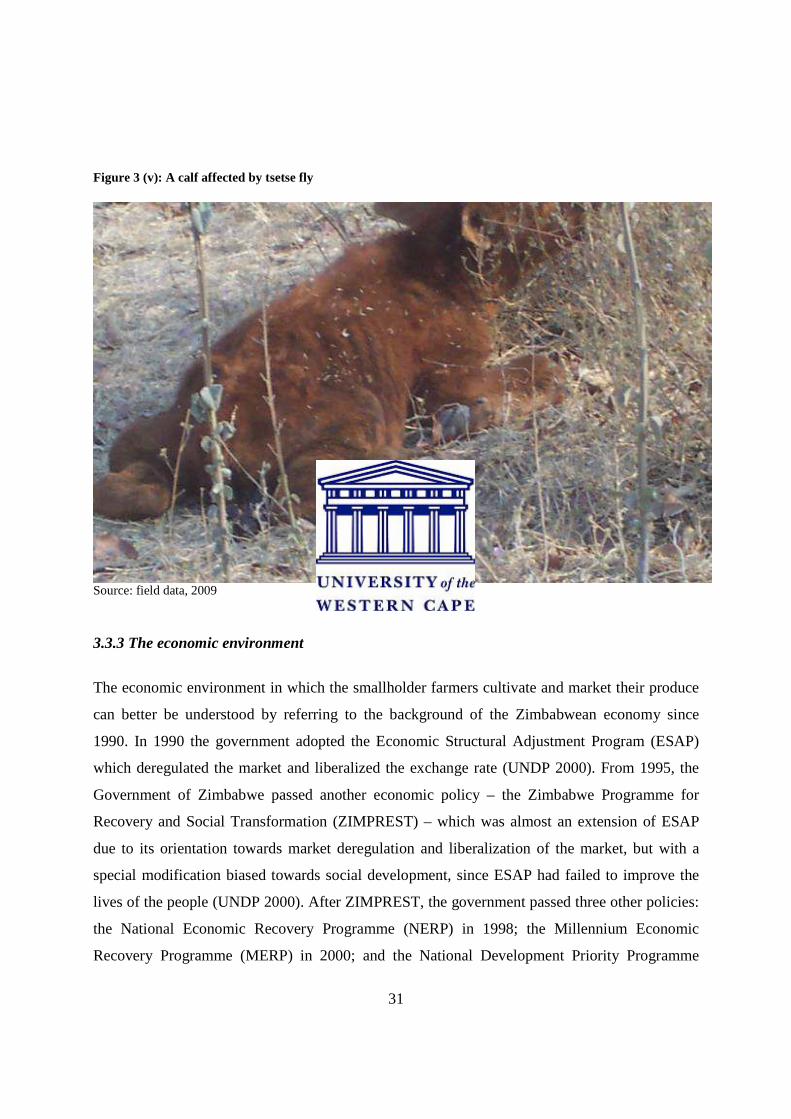
their assistance. According to one key informant, this resulted in the stopping of tsetse sprays
and replacement of tsetse traps, which had been done routinely before 2000 to reduce the impact
of tsetse on livestock. As a result the mortality rate of livestock increased as shown in the tables
with socio-economic data for each household studied in chapter 5. The following pictures show
the tsetse fly traps which were put by the government which are no longer replaced and some of
the cattle in the area affected:
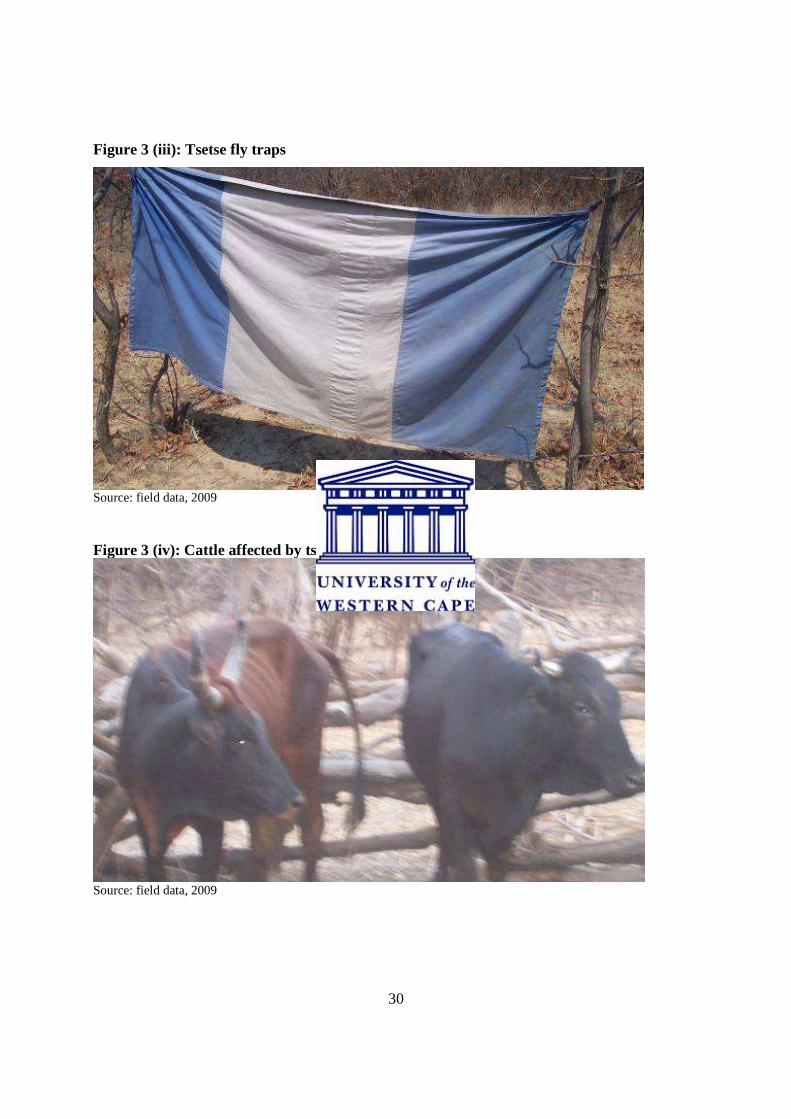
30
Figure 3 (iii): Tsetse fly traps
Source: field data, 2009 Figure 3 (iv): Cattle affected by tsetse fly
Source: field data, 2009
31
Figure 3 (v): A calf affected by tsetse fly
Source: field data, 2009 3.3.3 The economic environment
The economic environment in which the smallholder farmers cultivate and market their produce
can better be understood by referring to the background of the Zimbabwean economy since
1990. In 1990 the government adopted the Economic Structural Adjustment Program (ESAP)
which deregulated the market and liberalized the exchange rate (UNDP 2000). From 1995, the
Government of Zimbabwe passed another economic policy – the Zimbabwe Programme for
Recovery and Social Transformation (ZIMPREST) – which was almost an extension of ESAP
due to its orientation towards market deregulation and liberalization of the market, but with a
special modification biased towards social development, since ESAP had failed to improve the
lives of the people (UNDP 2000). After ZIMPREST, the government passed three other policies:
the National Economic Recovery Programme (NERP) in 1998; the Millennium Economic
Recovery Programme (MERP) in 2000; and the National Development Priority Programme
32
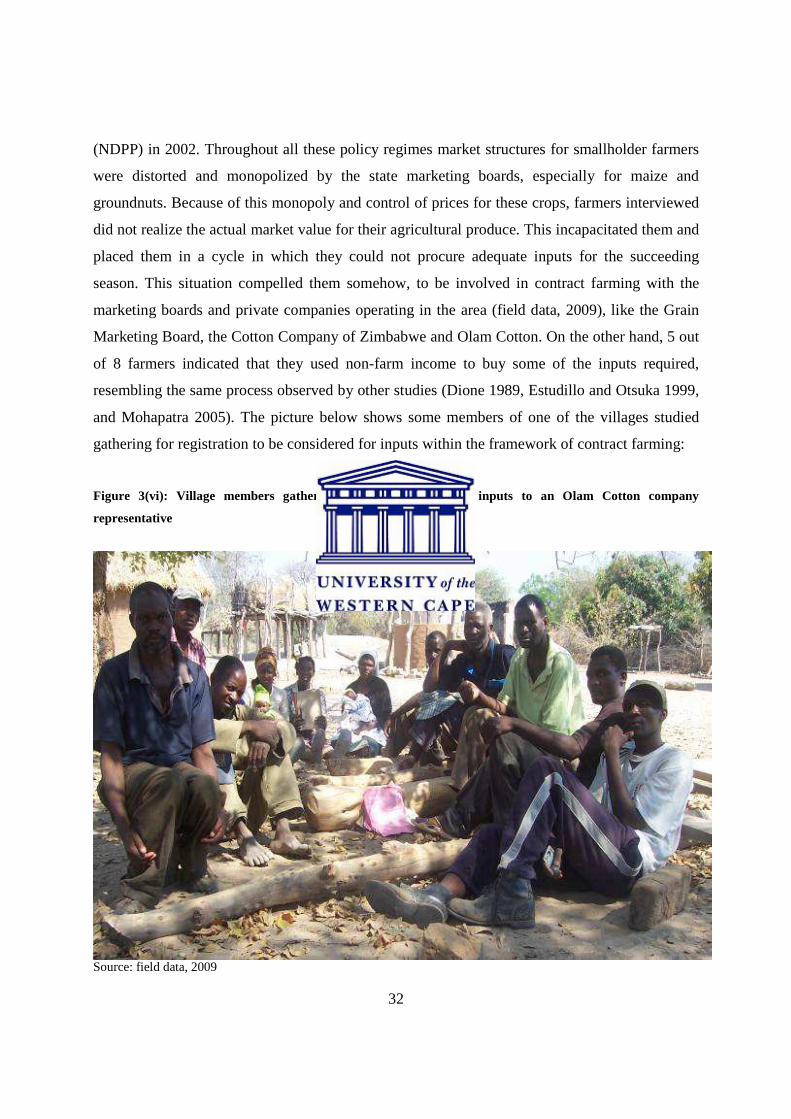
(NDPP) in 2002. Throughout all these policy regimes market structures for smallholder farmers
were distorted and monopolized by the state marketing boards, especially for maize and
groundnuts. Because of this monopoly and control of prices for these crops, farmers interviewed
did not realize the actual market value for their agricultural produce. This incapacitated them and
placed them in a cycle in which they could not procure adequate inputs for the succeeding
season. This situation compelled them somehow, to be involved in contract farming with the
marketing boards and private companies operating in the area (field data, 2009), like the Grain
Marketing Board, the Cotton Company of Zimbabwe and Olam Cotton. On the other hand, 5 out
of 8 farmers indicated that they used non-farm income to buy some of the inputs required,
resembling the same process observed by other studies (Dione 1989, Estudillo and Otsuka 1999,
and Mohapatra 2005). The picture below shows some members of one of the villages studied
gathering for registration to be considered for inputs within the framework of contract farming:
Figure 3(vi): Village members gathered to register for cotton inputs to an Olam Cotton company
representative
Source: field data, 2009
33
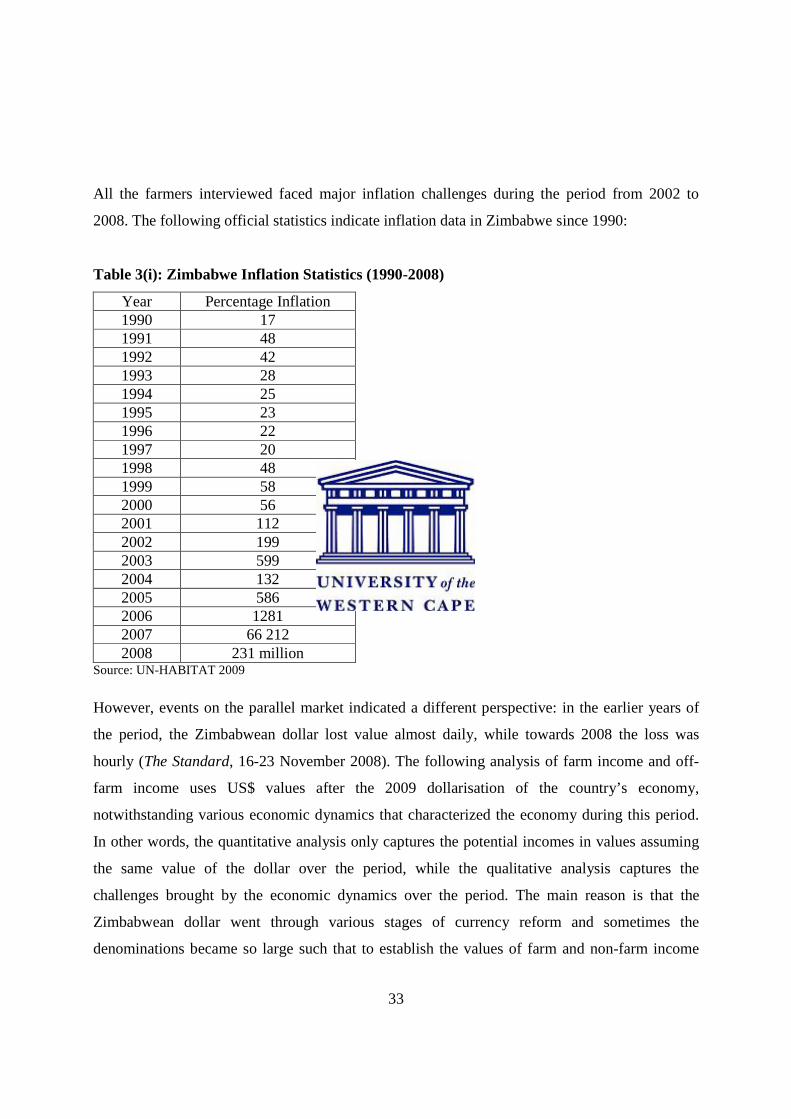
All the farmers interviewed faced major inflation challenges during the period from 2002 to
2008. The following official statistics indicate inflation data in Zimbabwe since 1990:
Table 3(i): Zimbabwe Inflation Statistics (1990-2008)
Year Percentage Inflation 1990 17 1991 48 1992 42 1993 28 1994 25 1995 23 1996 22 1997 20 1998 48 1999 58 2000 56 2001 112 2002 199 2003 599 2004 132 2005 586 2006 1281 2007 66 212 2008 231 million
Source: UN-HABITAT 2009
However, events on the parallel market indicated a different perspective: in the earlier years of
the period, the Zimbabwean dollar lost value almost daily, while towards 2008 the loss was
hourly (The Standard, 16-23 November 2008). The following analysis of farm income and off-
farm income uses US$ values after the 2009 dollarisation of the country’s economy,
notwithstanding various economic dynamics that characterized the economy during this period.
In other words, the quantitative analysis only captures the potential incomes in values assuming
the same value of the dollar over the period, while the qualitative analysis captures the
challenges brought by the economic dynamics over the period. The main reason is that the
Zimbabwean dollar went through various stages of currency reform and sometimes the
denominations became so large such that to establish the values of farm and non-farm income
34
using it as the basis for computation might be problematic and even more confusing due to dual
exchange rates which prevailed (the formal rate and the black market rate).
35
CHAPTER 4: RESEARCH METHODOLOGY
4.1 Introduction
This chapter outlines the research strategy which was used to gather the necessary data for the
study. Since the study was mainly focused on smallholder farmers’ experiences in a changing
farming environment, it was both qualitative and quantitative in nature. In other words the study
relied both on qualitative and quantitative data on socio-economic characteristics of selected
households.
4.2 Data requirements
The study sought data on people’s experiences with the farming environment in Gokwe since
1990 and the ways in which they adapted to the perceived trends. Therefore the collection of data
pertaining to their strategies in farming and outside farming also constituted a significant part of
the study aim. In this regard a historical exploration of the dynamics of farming systems and
livelihood portfolios was crucial.
A broader conceptualisation of the environment to include natural, economic, social and political
elements means data on climatic trends, economic trends, social trends and political trends
broadened the scope of this study. Rainfall and seasonal patterns, together with natural resource
endowment, constituted the natural component of the farming environment, while data on
physical infrastructure and economic policy trends (especially with regards to input and produce
markets) explained the economic element of the farming environment. On social trends, data on
cultural and behavioural perceptions, including relational ties throughout the period, were
sought. Finally, the organizational infrastructure that coordinates economic development
activities constituted the political element of the farming environment.
Within the farming environment, farming systems and strategies that smallholder farmers use
and their occupation over the period under investigation, were also crucial building blocks for
understanding their behaviour in relation to the farming environment. On the other hand their
36
assets, incomes and wages (livelihood portfolios) were central in this study, especially how the
livelihood portfolios have been adjusted and readjusted in relation to the farming environmental
trends. Population dynamics were also captured and an establishment of their link with the
above-mentioned adjustments was carried out.
4.3 Sampling procedure
Two villages were purposefully selected from the list of villages in the Gokwe-Kabiyuni area,
namely Nyoni village and Maringa 1 village. The main reason for choosing this area was its
history of intensified smallholder farming. In this regard the researcher wanted to observe the
applicability of the de-agrarianisation thinking in such communities which have a long history of
dependency on smallholder farming. A list of village households was requested from both village
heads. With the assistance of the village heads and other informants, a sub-list of households and
their years of establishment was constructed and stratified according to the time of establishment
in the area. Two strata were constructed, one with households which were established before
2000 and another with households established after 2000. The households for analysis were
chosen mainly from the first stratum, in order to establish a detailed picture of what happened
within these households during some significant periods in Zimbabwe’s politico-economic
history.
Nyoni village had a total of 37 households among which 21 were established before 2000. From
the 21 households which were established before 2000, 3 households were randomly selected for
study while the other two were selected from the stratum of households established after 2000.
Maringa 1 village had 17 households, 10 of which were established before 2000. After 2000
these two villages also experienced an exodus of other households into new resettlement areas in
Empress near Kwekwe. However, these households were not many – 3 households from Nyoni
village and 1 household from Maringa 1 village. The overall trend shows that the two villages
grew significantly since 2000. This was a result of the combined effect of newcomer households
migrating from other districts and offshoot households derived from established households in
the area.
37
Three households were chosen for study from Maringa 1 village, making a total of 8 households
for the study. Choice of narrowness in population coverage (sample fraction) and depth in
analysis was made rather than breadth and shallowness. A sample fraction of 14% was the result.
Within these households, experiences and perceptions of adults, women and the youth were
established through their life histories in order to establish a rich perceptual mix derived from
different experiences relating to age and gender.
4.4 Data gathering techniques
Both qualitative and quantitative methods were used. The specific methods that were used, the
type of data that they sought to gather and the respondents are listed below.
4.4.1 Desktop research
Textbooks and documentary sources of data were used to establish climatic and policy trends in
the area and in Zimbabwe at large. The documentary sources included NGO reports, government
reports and research reports. Data on yields were also generated in some instances by referring to
vouchers and receipts for selling crop yields, especially of those crops which were sold to
established marketing companies like the Grain Marketing Board and the Cotton Marketing
Board. NGO reports were also used to review the changes in the Zimbabwean economic
environment during the period under investigation.
4.4.2 Interviews
Unstructured interviews were used in the familiarisation visit to gain understanding of the area in
order to map out the strategy for research execution. For example, because the study traced what
happened since 1990, there was need to find households which were already established in the
area by that year. Such information was gathered through interviews with key informants.
38
4.4.3 Household Interviews
A structured interview was developed and administered to the 8 households to gather socio-
economic data. Such data included assets possessed, household income, family size, age, level of
education, gender, farming inputs and estimated output, size of land holding, distance from
service centres, and other infrastructure available.
Because the data required were historical and needed a lot of exploration and recall of past
events, household interviews were conducted to complement the household survey. The idea was
to improve accuracy by involving many people who went through the same experience so that
they could assist each other in exploring their shared past. Each household was first visited and
an appointment to meet possibly all the household members present was made. On the second
visit to each household is when the researcher administered the questionnaire in the form of a
household interview, where the groups comprised the members of the households selected for the
questionnaire survey. In other words the themes in the household interviews were revisited in the
focus groups, each comprising members of the household to which the questionnaire was
administered.
These groups comprised women, men and youth. Since the study was not seeking any sensitive
marital data, the researcher saw no harm in combining the different age groups and genders so
that they could assist each other in providing the historical data sought by the study. In such a
platform respondents were free to share their common experience. This was useful in gathering
data on the trends in the farming environment since 1990, asset possession over the years, crop
yields, off-farm and non-farm activities and levels of education of household members during
specific periods under investigation.
To assist the respondents better explore their past experiences, the researcher highlighted some
of the ways they could use, for example starting with the years they had bumper harvests,
remembering what they harvested during highly memorable seasons such as: (i) the year when
there was a drought (in this case 1992 and 2002), (ii) the year in which national elections were
held (in this case 1990, 1995, 2000, 2002, and 2005, (iii) the year when a mother gave birth to a
39
child, and (iv) the year when a member of the household sat for examinations at school or at
college. Data related to these periods were easier to remember first. When the respondents
explored data related to other periods closer to these memorable events, it was also easier.
In vivo codes were also used to ascertain whether the data generated was accurate or near
accurate, for example there were instances in which the focus group respondents could argue
among themselves, making efforts to convince each other by further exploration of other related
events. After a respondent was convinced that the colleague was right, he/she would make a big
exclamation in agreement with the other respondents saying; ‘E-e-eh asi ipapo urikurevesa’,
meaning ‘yes, on that you are surely correct’. After that consensus the researcher would note that
the information was accurate.
4.4.5 Transect walks
Transact walks were done along the boundaries of landholdings to verify the information given
by the informants on the size of landholdings. Although no accurate measurements of the fields
were done, the researcher observed that the information was near accurate. The main reason for
this accuracy was that when they came to settle in this area, people’s plots were pegged.
4.5 Data presentation and analysis techniques
This section gives a summary of the techniques that were used to generate meaning out of the
data obtained from the field. Two techniques were used.
4.5.1 Manual data analysis
Data on household yields, asset possession, off-farm and non-farm income, and literacy levels
were analysed and presented with the assistance of Microsoft Excel. The data were tabulated and
further presented in graphs to give a clear picture of the trends, especially those pertaining to
crop yields over the period.
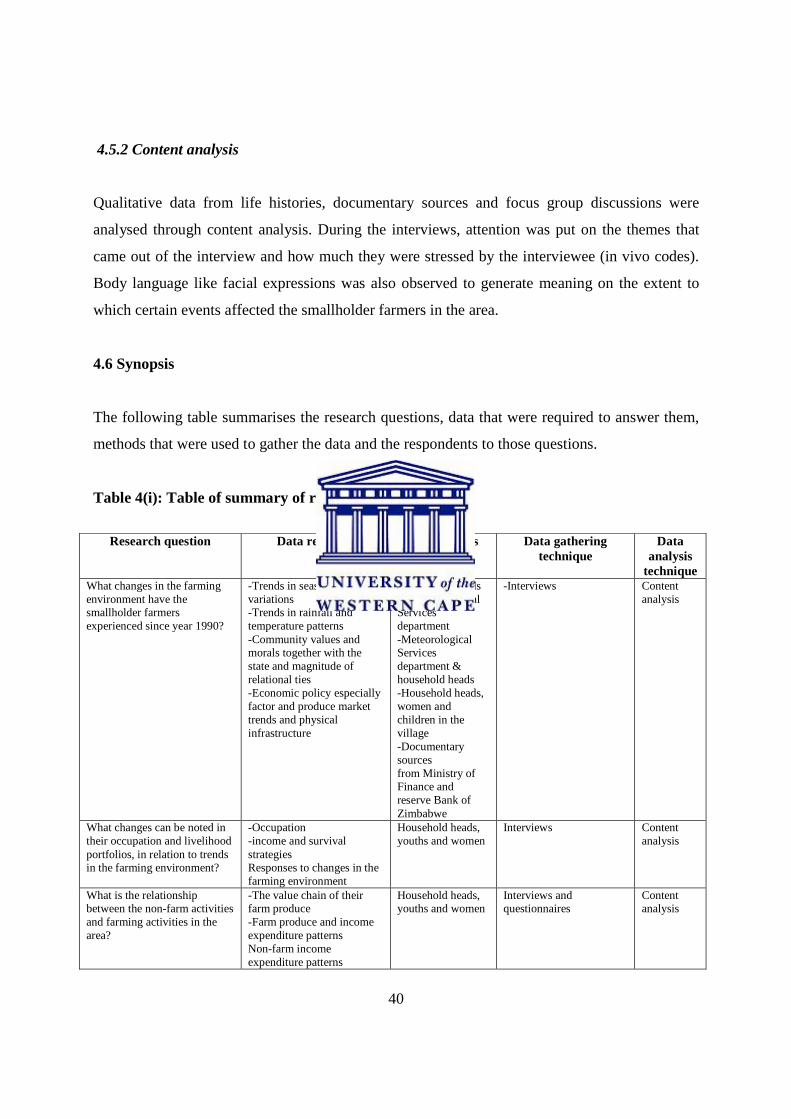
40
4.5.2 Content analysis
Qualitative data from life histories, documentary sources and focus group discussions were
analysed through content analysis. During the interviews, attention was put on the themes that
came out of the interview and how much they were stressed by the interviewee (in vivo codes).
Body language like facial expressions was also observed to generate meaning on the extent to
which certain events affected the smallholder farmers in the area.
4.6 Synopsis
The following table summarises the research questions, data that were required to answer them,
methods that were used to gather the data and the respondents to those questions.
Table 4(i): Table of summary of research methodology
Research question Data required Respondents Data gathering
technique Data
analysis technique
What changes in the farming environment have the smallholder farmers experienced since year 1990?
-Trends in seasonal variations -Trends in rainfall and temperature patterns -Community values and morals together with the state and magnitude of relational ties -Economic policy especially factor and produce market trends and physical infrastructure
-Household heads & Meteorological Services department -Meteorological Services department & household heads -Household heads, women and children in the village -Documentary sources from Ministry of Finance and reserve Bank of Zimbabwe
-Interviews Content analysis
What changes can be noted in their occupation and livelihood portfolios, in relation to trends in the farming environment?
-Occupation -income and survival strategies Responses to changes in the farming environment
Household heads, youths and women
Interviews Content analysis
What is the relationship between the non-farm activities and farming activities in the area?
-The value chain of their farm produce -Farm produce and income expenditure patterns Non-farm income expenditure patterns
Household heads, youths and women
Interviews and questionnaires
Content analysis

41
42
CHAPTER 5: DATA PRESENTATION, ANALYSIS AND INTERPRETATION 5.1 Introduction This chapter presents the findings from the research and the central interpretations thereof, in the
light of the academic and policy debates examined in the previous chapters, especially Chapters
1 and 2. In Chapter 4, it was stated that this study is both qualitative and quantitative, focusing
on smallholder farmers’ experiences within the farming environment of Gokwe, and how this
affected their livelihood orientation. In this regard, the findings include both ‘hard data’ and ‘soft
data’. The data reveal the existence of a cultivation culture (in a dual economy order alluded to in
Chapter 2) among the smallholder farmers in the two villages studied, which generates resilience
(although variable) to the changing farming environment, and innovation, which breeds various
adaptation strategies. This is notwithstanding the evidence of changes in both the physical and
socio-political environment. In this setting, there are dynamics in the trends of livelihood
orientation among the smallholder farmers in the two villages since 1990, revealing some
iteration between de-agrarianisation and re-agrarianisation depending on the dynamics of the
farming environment over the years.
It is also demonstrated that there is a relationship between smallholder farming and the types of
non-farm or off-farm activities that they do in this area. The relationship can be established in the
way surplus or profit is used or where the starting capital is derived from and the nature of the
activities themselves.
This chapter is structured into 3 substantive sections. The first states the types of respondents
observed during fieldwork. The second presents the findings in a discursive way in which the
findings are related to the ongoing debates in the subject area and the previously related studies.
The third section summarises the findings and presents the overall argument in the dissertation –
that de-agrarianisation in Gokwe-Kabiyuni is not evident during years which recorded good crop
production levels. With the introduction of conservation agriculture as an adaptation strategy,
there has been a general shift towards re-agrarianisation.
43
5.2 Findings
5.2.1 Introduction
The respondents in this study were families involved in smallholder farming in the villages of
Nyoni and Maringa 1. Agricultural extension workers in the area were also interviewed in
relation to their experience with the area. Much of the detail about their profiles is shown in
subsequent sections because it forms part of the crucial data for the analysis of the findings
The data presented here was gathered with the view of establishing the relationship between the
farming environment, farming activities, and non-farm activities in a rural area of Zimbabwe,
namely Gokwe-Kabiyuni, over the period from 1990 to 2008, and establish how it relates to
Bryceson’s de-agrarianisation hypothesis. The main variables in this study were derived from
Bryceson’s (1997) drivers of de-agrarianisation in Sub-Saharan Africa (climate change,
population growth and policy adjustments). However, as has been indicated in the conceptual
map which guided this study, the word environment adopted in this study does not imply climate
only, but also includes the political and socio-economic environment. It also takes into
consideration the policy environment, party politics, NGO operations, and produce and factor
market structure for agriculture.
The following section summarises the smallholder farmers’ experience since 1990. The first five
households were selected from Nyoni village (about eight kilometres from Chitekete business
centre) while the last three were selected from Maringa 1 village (about a kilometre from the
business centre). It should be noted that the exact income values from non-farm activities were
not captured in the research; however average figures and differential experiences of households
were gathered through qualitative methods.
44
5.2.2 Nyoni village household socio-economic data
Household 1
The following table (Table 5(i)) shows the socio-economic data for the first household studied:
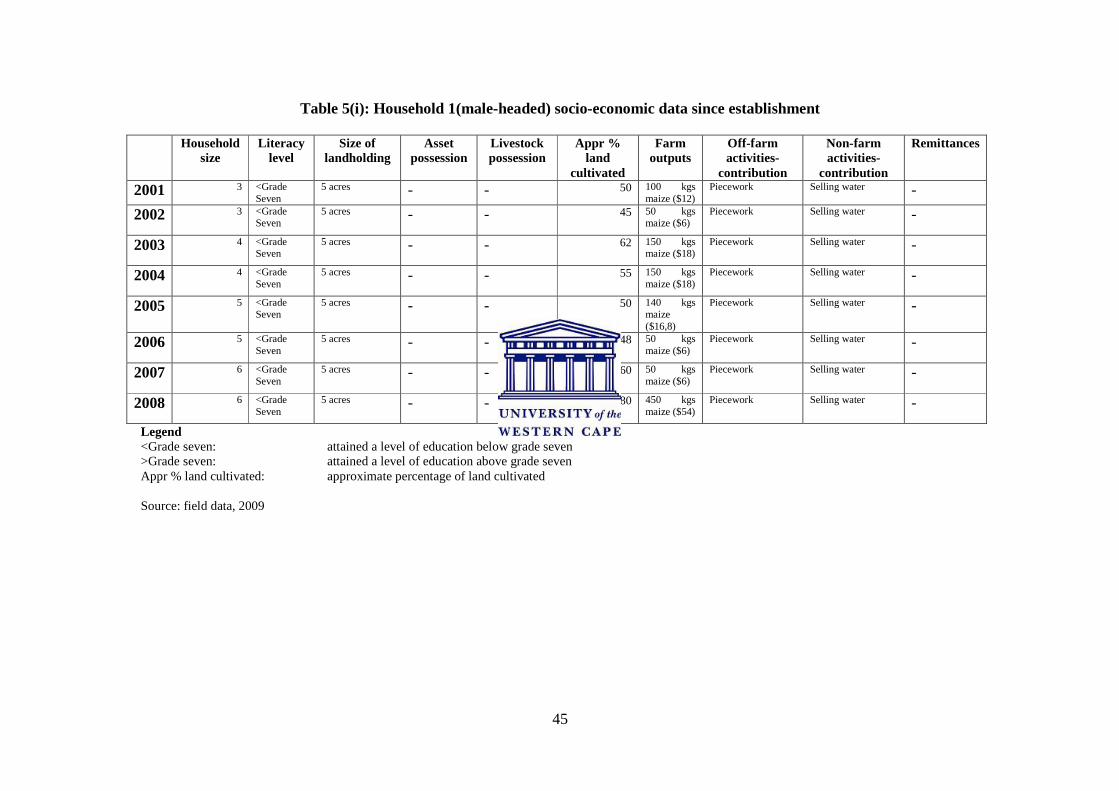
45
Table 5(i): Household 1(male-headed) socio-economic data since establishment
Household size
Literacy level
Size of landholding
Asset possession
Livestock possession
Appr % land
cultivated
Farm outputs
Off-farm activities-
contribution
Non-farm activities-
contribution
Remittances
2001 3 <Grade Seven
5 acres - - 50 100 kgs maize ($12)
Piecework
Selling water
-
2002 3 <Grade Seven
5 acres - - 45 50 kgs maize ($6)
Piecework
Selling water
-
2003 4 <Grade Seven
5 acres - - 62 150 kgs maize ($18)
Piecework
Selling water
-
2004 4 <Grade Seven
5 acres - - 55 150 kgs maize ($18)
Piecework
Selling water
-
2005 5 <Grade Seven
5 acres - - 50 140 kgs maize ($16,8)
Piecework
Selling water
-
2006 5 <Grade Seven
5 acres - - 48 50 kgs maize ($6)
Piecework
Selling water
-
2007 6 <Grade Seven
5 acres - - 60 50 kgs maize ($6)
Piecework
Selling water
-
2008 6 <Grade Seven
5 acres - - 80 450 kgs maize ($54)
Piecework
Selling water
-
Legend <Grade seven: attained a level of education below grade seven >Grade seven: attained a level of education above grade seven Appr % land cultivated: approximate percentage of land cultivated Source: field data, 2009
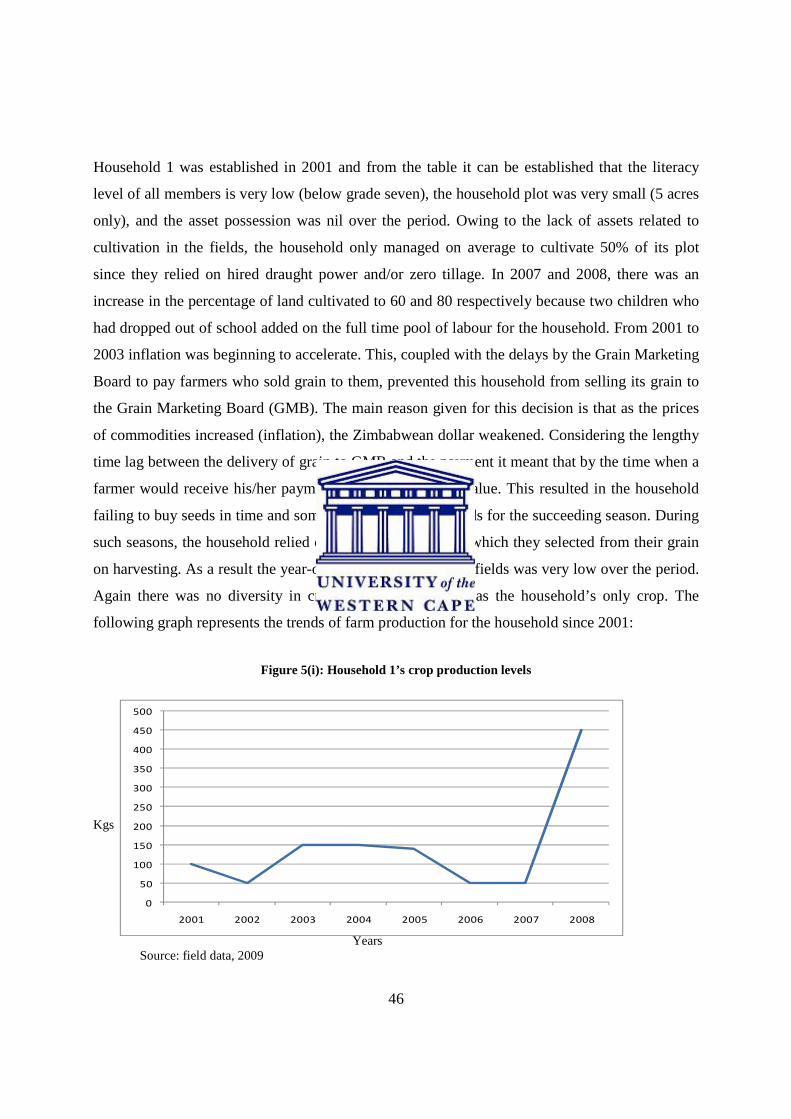
46
Household 1 was established in 2001 and from the table it can be established that the literacy
level of all members is very low (below grade seven), the household plot was very small (5 acres
only), and the asset possession was nil over the period. Owing to the lack of assets related to
cultivation in the fields, the household only managed on average to cultivate 50% of its plot
since they relied on hired draught power and/or zero tillage. In 2007 and 2008, there was an
increase in the percentage of land cultivated to 60 and 80 respectively because two children who
had dropped out of school added on the full time pool of labour for the household. From 2001 to
2003 inflation was beginning to accelerate. This, coupled with the delays by the Grain Marketing
Board to pay farmers who sold grain to them, prevented this household from selling its grain to
the Grain Marketing Board (GMB). The main reason given for this decision is that as the prices
of commodities increased (inflation), the Zimbabwean dollar weakened. Considering the lengthy
time lag between the delivery of grain to GMB and the payment it meant that by the time when a
farmer would receive his/her payment, it would have lost value. This resulted in the household
failing to buy seeds in time and sometimes to fail to buy seeds for the succeeding season. During
such seasons, the household relied on untreated maize seed which they selected from their grain
on harvesting. As a result the year-on-year production in the fields was very low over the period.
Again there was no diversity in crops grown, with maize as the household’s only crop. The
following graph represents the trends of farm production for the household since 2001:
Figure 5(i): Household 1’s crop production levels Kgs Years Source: field data, 2009
0
50
100
150
200
250
300
350
400
450
500
2001 2002 2003 2004 2005 2006 2007 2008
47
From the graph above, it can be observed that farm productivity of household 1 fluctuated over
the period, reaching its peak in 2008 (450 kgs) and at its lowest in 2002, 2006, 2007 (50 kgs).
Comparing farm productivity to off-farm and non-farm activities’ contribution to the overall
livelihood, one can conclude that there is a greater percentage of off-farm and non-farm
contribution from 2001 to 2007. This is so because farm produce was not adequate to cater for
the needs of the household. Off-farm activities were mainly done as piecework in other people’s
plots (maricho) during the rainy season and the harvesting season. According to the family
informant, on average the household members could be involved in off-farm activities for an
average of once a week, generating an average of US$8 per day for the period ranging from
November to April. Therefore the household generated approximately $192 per year from
piecework in other people’s fields. This figure declined for 2008 because the year had good
harvests and the household needed to do piecework to get money for petty expenses only since
they had harvested adequate grain.
The only non-farm activity which the household was involved in is selling water at the service
centre (Chitekete), since the borehole water at the service centre was sour because of the
presence of coal in the area. On average the household sold water 2 days per week over the
period ranging from May to October, raising an average of US$96 per annum. Therefore if one
was to consider crop production levels only, the data suggest a process of de-agrarianisation.
However the sharp increase in the harvest in 2008 (mainly because of conservation agriculture)
and the consequent dwindling of the share of non-farm and off-farm activities in the overall
livelihood portfolio of the household studied might also suggest a process of re-agrarianisation.
The household was involved in off-farm activities and non-farm activities over the period. The
picture below shows a woman going to the business centre to sell water:
48
Figure 5(ii): A woman heading for the business centre to sell water
Source: field data, 2009 Household 2
Household 2 was also established in 2001, but it is a female-headed household with almost zero
asset possession over the years. It was only in 2006 and 2007 when it bought a cow and a
donkey. The livestock had been bought using money obtained from compensation for the
impregnation of the daughter when she was in form 3 in 2004. Because of the low level of asset
possession the farm production was very low because of a lower percentage of cultivated land, of
which only 2 acres were available in any case. Like household 1 they basically depended on
hired draught power and/or zero tillage, save for 2006 and 2007 when they had a cow and a
donkey. During these years they combined their livestock with those of their neighbours to form
a competent combination of draught livestock (Chipani) until the livestock died because of tsetse
infection mid 2007. Consequently, their harvest increased in 2007 to 500 kgs of maize. A further
increase in the harvest was recorded in 2008 although there was no livestock for draught power,
which was attributed to the hiring of more draught power and the buying of enough seed with the
assistance of the remittances sent by the household member employed as a temporary teacher.
Table 5(ii) below presents the data for the second household studied:
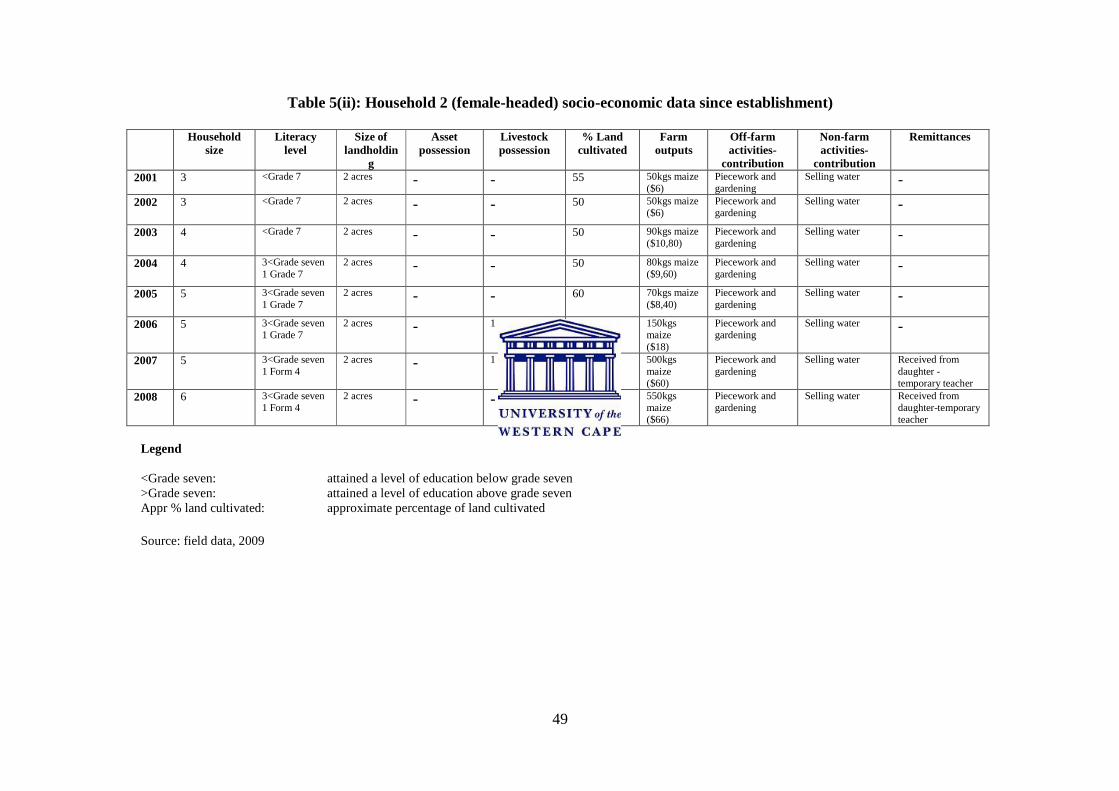
49
Table 5(ii): Household 2 (female-headed) socio-economic data since establishment)
Household size
Literacy level
Size of landholdin
g
Asset possession
Livestock possession
% Land cultivated
Farm outputs
Off-farm activities-
contribution
Non-farm activities-
contribution
Remittances
2001 3 <Grade 7 2 acres - - 55 50kgs maize ($6)
Piecework and gardening
Selling water
- 2002 3 <Grade 7 2 acres - - 50 50kgs maize
($6) Piecework and gardening
Selling water
-
2003 4 <Grade 7 2 acres - - 50 90kgs maize ($10,80)
Piecework and gardening
Selling water
-
2004 4 3<Grade seven 1 Grade 7
2 acres - - 50 80kgs maize ($9,60)
Piecework and gardening
Selling water
-
2005 5 3<Grade seven 1 Grade 7
2 acres - - 60 70kgs maize ($8,40)
Piecework and gardening
Selling water
-
2006 5 3<Grade seven 1 Grade 7
2 acres - 1 cow 45 150kgs maize ($18)
Piecework and gardening
Selling water
-
2007 5 3<Grade seven 1 Form 4
2 acres - 1 donkey 90 500kgs maize ($60)
Piecework and gardening
Selling water
Received from daughter - temporary teacher
2008 6 3<Grade seven 1 Form 4
2 acres - - 65 550kgs maize ($66)
Piecework and gardening
Selling water Received from daughter-temporary teacher
Legend <Grade seven: attained a level of education below grade seven >Grade seven: attained a level of education above grade seven Appr % land cultivated: approximate percentage of land cultivated Source: field data, 2009
50
The following graph (Figure 5(iii)) illustrates what was happening in the household as far as
farm production is concerned:
Figure 5(iii): Household 2’s maize production trends
Kgs
Years
Source: field data, 2009 The literacy level is low for other members and average for one member, especially from 2006 to
2007, when she attained a GCE Ordinary level certificate. On this merit the household member
managed to secure a temporary teaching opportunity at a nearby primary school which resulted
in the sending of remittances of about $720 per annum to the household in 2007 and 2008.
According to the main informant in the household, the magnitude of piecework which the
household was involved in was very small because the only family members who were at home
during the majority of the time was the mother and her grandchildren (children to the daughter
who later secured employment in 2007). So the labour was very limited and as a result the
household was involved in piecework in others’ fields for an average of once per fortnight,
which generated an average of $96 per annum. Gardening also contributed to the livelihood
portfolio at an average of $5 per fortnight from April to October every year, giving an average
contribution of $80 per annum. This includes both the market value for sold vegetables and the
imputed value for those consumed by the household.
0
100
200
300
400
500
600
2001 2002 2003 2004 2005 2006 2007 2008
51
Besides the off-farm activity, the household was also involved in selling water, albeit to a lesser
extent than Household 1. This non-farm activity contributed about $1 per month, giving an
average of $12 per annum. Combining the income which was to be derived from the field
harvests, it becomes clear that the household largely relied on off-farm and non-farm income for
livelihood. For example, if one adds the off-farm and non-farm income averages per annum (to
get $188 per annum) and compares to the price of agricultural produce on the market (in this
case $22,73/yr on average), one would establish that income from off-farm and non-farm
activities is higher by 827% for this household. (Note: the values of both cotton and maize were
averaged at $1.20 per kg and the average weight of one bale of cotton was found to be 210 kgs).
Even if one were to take into consideration the value of green produce, the value of farm income
was still greatly outweighed by the income from off-farm and non-farm activities.
Household 3
Household 3 is quite different in structure and in its experience to the previous two households,
as summarised in Table 5(iii) below:
52
Table 5(iii): Household 3 (male-headed) socio-economic data since establishment
Household size
Literacy level
Size of landholding
Asset possession
Livestock possession
Appr % land
cultivated
Farm outputs Off-farm activities-
contribution
Non-farm activities-
contribution
Remit-tances
1990 8 3<Grade 7 & 5 Grade 7
25 acres Plough, scotch cart, harrow
2 cattle, 5 donkeys, >ten goats
50 1400 kgs maize, 11 bales cotton, 150kgs groundnuts
Piecework, gardening
Traditional healing -
1991 9 3<Grade 7 & 6 Grade 7
25 acres Plough, scotch cart, harrow
2 cattle, 5 donkeys, >ten goats
50 500kgs maize, 5 bales cotton,
Piecework, gardening
Traditional healing -
1992 9 3<Grade 7 & 6 Grade 7
25 acres Plough, scotch cart, harrow
2 cattle, 5 donkeys, >ten goats
50 50kgs groundnuts Piecework, gardening
Traditional healing -
1993 9 3<Grade 7 & 6 Grade 7
25 acres Plough, scotch cart, harrow
2 cattle, 5 donkeys, >ten goats
55 2000kgs maize, 16 bales cotton, 800kgs groundnuts
Piecework, gardening
Traditional healing -
1994 9 3<Grade 7 & 6 Grade 7
25 acres Plough, scotch cart, harrow
2 cattle, 5 donkeys, >ten goats
60 300kgs maize, 4 bales cotton, 200kgs groundnuts
Piecework, gardening
Traditional healing -
1995 9 3<Grade 7 & 6 Grade 7
25 acres Plough, scotch cart, harrow
5 cattle, 5 donkeys, >ten goats
80 200kgs maize, 3 bales cotton, 100kgs groundnuts
Piecework, gardening
Traditional healing -
1996 9 3<Grade 7 & 6 Grade 7
25 acres Plough, scotch cart, harrow
5 cattle, 5 donkeys, >ten goats
75 1200kgs maize, 11 bales cotton, 80kgs groundnuts
Piecework, gardening
Traditional healing -
1997 9 3<Grade 7 & 6 Grade 7
25 acres Plough, scotch cart, harrow
3 cattle, 5 donkeys, >ten goats
60 1000kgs maize, 10 bales cotton, 100kgs groundnuts
Piecework, gardening
Traditional healing -
1998 9 3<Grade 7 & 6 Grade 7
25 acres Plough, scotch cart, harrow
4 cattle, 5 donkeys, >ten goats
66 2000kgs maize, 16 bales cotton, 110kgs groundnuts
Piecework, gardening
Traditional healing -
1999 9 3<Grade 7 & 6 Grade 7
25 acres Plough, scotch cart, harrow
3 cattle, 5 donkeys, >ten goats
78 180kgs maize, 4 bales cotton, 50kgs groundnuts
Piecework, gardening
Traditional healing -
2000 9 3<Grade 7 & 6 Grade 7
25 acres Plough, scotch cart, harrow
3 cattle, 5 donkeys, >ten goats
78 180kgs maize, 5 bales cotton, 100kgs groundnuts
Piecework, gardening
Traditional healing -
2001 7 3<Grade 7 & 4 Grade 7
25 acres Plough, scotch cart, harrow
3 cattle 50 80kgs maize, 2 bales cotton, 80kgs groundnuts.
Piecework, gardening
Traditional healing -
2002 7 3<Grade 7 & 4Grade 7
25 acres Plough, scotch cart, harrow
3 cattle 50 50kgs maize, 1,5 bales cotton, 20kgs groundnuts
Piecework, gardening
Traditional healing -
53
2003 7 3<Grade 7 & 4 Grade 7
25 acres Plough, scotch cart, harrow
3 cattle 54 100kgs maize, 2 bales cotton, 100kgs groundnuts
Piecework, gardening
Traditional healing -
2004 7 3<Grade 7 & 4 Grade 7
25 acres Plough, scotch cart, harrow
3 cattle 55 300kgs maize, 4,5 bales cotton,1000kgs sorghum, 100kgs groundnuts,
Piecework, gardening
Traditional healing -
2005 7 3<Grade 7 & 4 Grade 7
25 acres Plough, scotch cart, harrow
1 cow 45 350kgs maize, 4 bales cotton, 950kgs sorghum, 550kgs groundnuts
Piecework, gardening
Traditional healing -
2006 6 3<Grade 7 & 3 Grade 7
25 acres Plough, scotch cart, harrow
7 cattle 78 400kgs maize, 6 bales cotton, 800kgs sorghum, 450kgs groundnuts
Piecework, gardening
Traditional healing -
2007 6 3<Grade 7 & 4 Grade 7
25 acres Plough, scotch cart, harrow
7 cattle 78 1000kgs maize, 9 bales cotton, 850kgs sorghum, 300kgs groundnuts
Piecework, gardening
Traditional healing -
2008 6 3<Grade 7 & 4 Grade 7
25 acres Plough, scotch cart, harrow
6 cattle 80 2500kgs maize, 12 bales cotton, 1000kgs sorghum, 850kgs groundnuts
Piecework, gardening
Traditional healing -
Legend: <Grade seven: attained a level of education below grade seven >Grade seven: attained a level of education above grade seven Appr % land cultivated: approximate percentage of land cultivated Source: field data, 2009
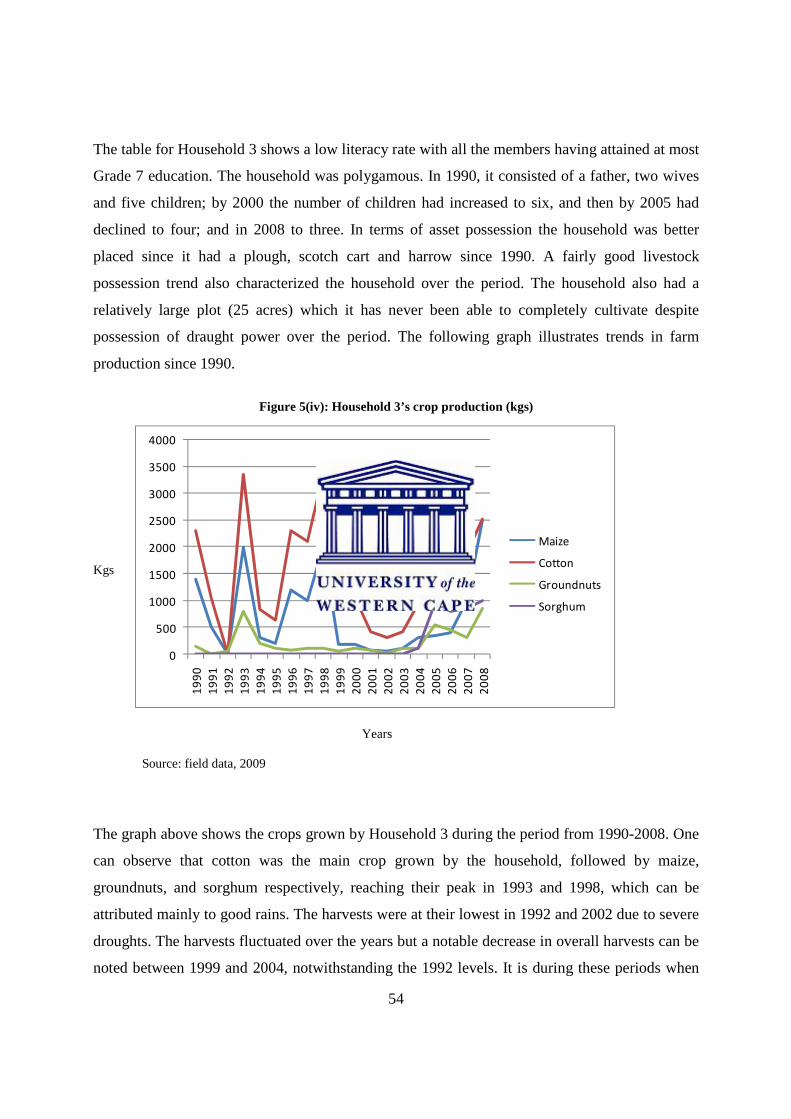
54
The table for Household 3 shows a low literacy rate with all the members having attained at most
Grade 7 education. The household was polygamous. In 1990, it consisted of a father, two wives
and five children; by 2000 the number of children had increased to six, and then by 2005 had
declined to four; and in 2008 to three. In terms of asset possession the household was better
placed since it had a plough, scotch cart and harrow since 1990. A fairly good livestock
possession trend also characterized the household over the period. The household also had a
relatively large plot (25 acres) which it has never been able to completely cultivate despite
possession of draught power over the period. The following graph illustrates trends in farm
production since 1990.
Figure 5(iv): Household 3’s crop production (kgs)
Kgs
Years Source: field data, 2009
The graph above shows the crops grown by Household 3 during the period from 1990-2008. One
can observe that cotton was the main crop grown by the household, followed by maize,
groundnuts, and sorghum respectively, reaching their peak in 1993 and 1998, which can be
attributed mainly to good rains. The harvests were at their lowest in 1992 and 2002 due to severe
droughts. The harvests fluctuated over the years but a notable decrease in overall harvests can be
noted between 1999 and 2004, notwithstanding the 1992 levels. It is during these periods when
0
500
1000
1500
2000
2500
3000
3500
4000
1990
1991
1992
1993
1994
1995
1996
1997
1998
1999
2000
2001
2002
2003
2004
2005
2006
2007
2008
Maize
Cotton
Groundnuts
Sorghum
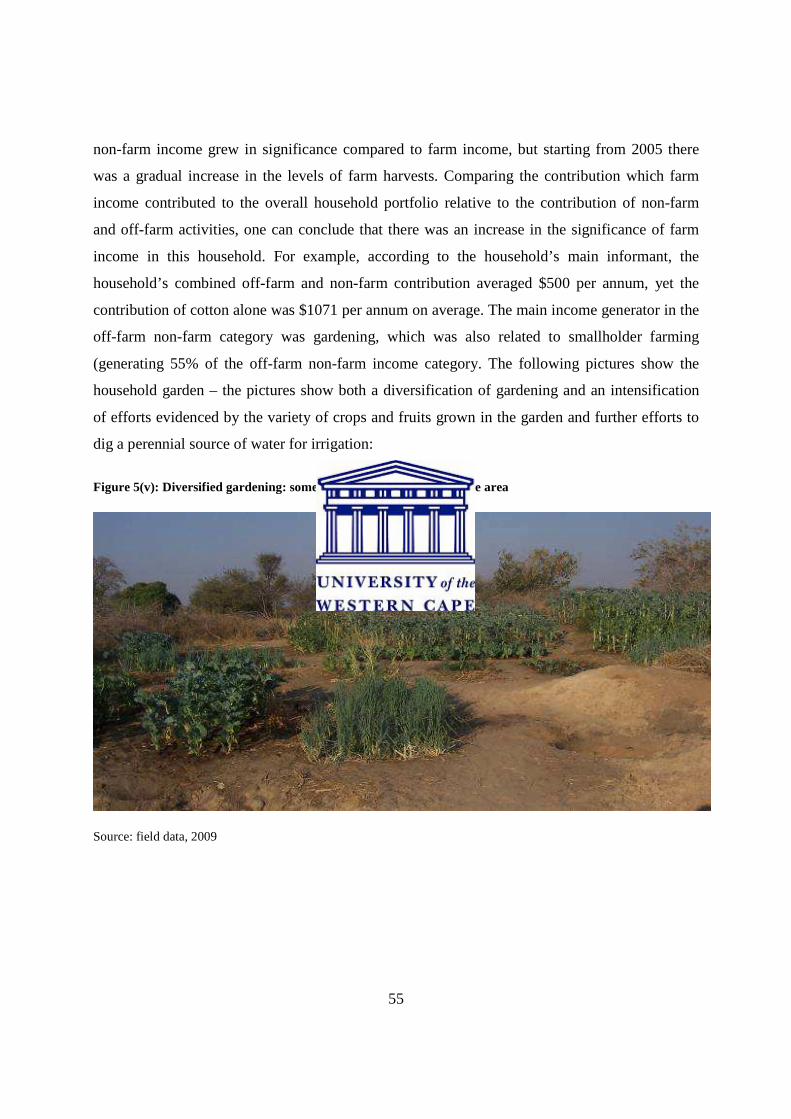
55
non-farm income grew in significance compared to farm income, but starting from 2005 there
was a gradual increase in the levels of farm harvests. Comparing the contribution which farm
income contributed to the overall household portfolio relative to the contribution of non-farm
and off-farm activities, one can conclude that there was an increase in the significance of farm
income in this household. For example, according to the household’s main informant, the
household’s combined off-farm and non-farm contribution averaged $500 per annum, yet the
contribution of cotton alone was $1071 per annum on average. The main income generator in the
off-farm non-farm category was gardening, which was also related to smallholder farming
(generating 55% of the off-farm non-farm income category. The following pictures show the
household garden – the pictures show both a diversification of gardening and an intensification
of efforts evidenced by the variety of crops and fruits grown in the garden and further efforts to
dig a perennial source of water for irrigation:
Figure 5(v): Diversified gardening: some of the off-farm activity in the area
Source: field data, 2009
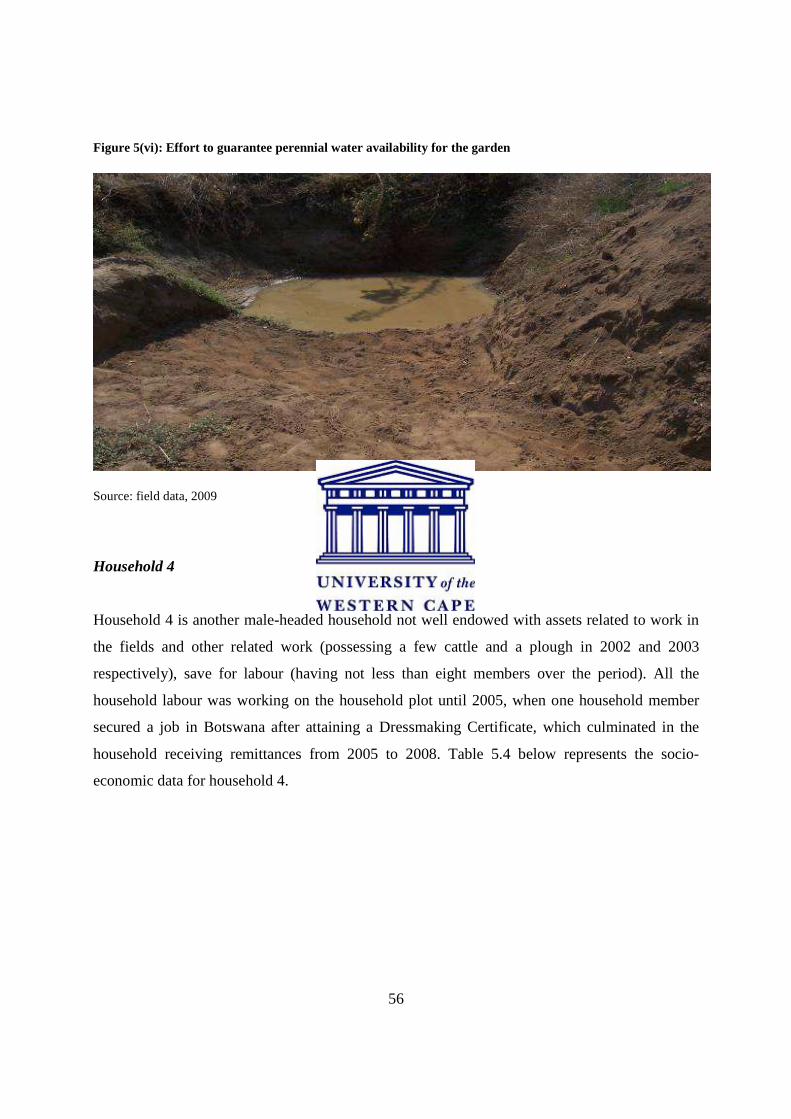
56
Figure 5(vi): Effort to guarantee perennial water availability for the garden
Source: field data, 2009 Household 4 Household 4 is another male-headed household not well endowed with assets related to work in
the fields and other related work (possessing a few cattle and a plough in 2002 and 2003
respectively), save for labour (having not less than eight members over the period). All the
household labour was working on the household plot until 2005, when one household member
secured a job in Botswana after attaining a Dressmaking Certificate, which culminated in the
household receiving remittances from 2005 to 2008. Table 5.4 below represents the socio-
economic data for household 4.
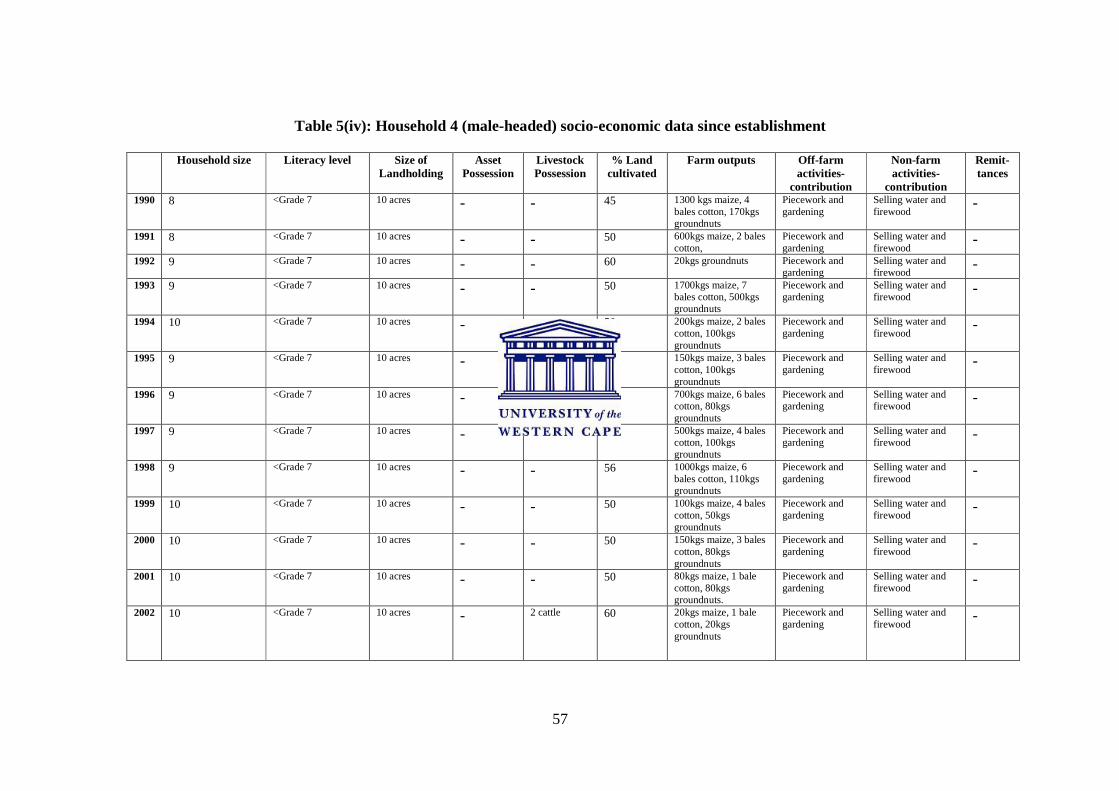
57
Table 5(iv): Household 4 (male-headed) socio-economic data since establishment
Household size Literacy level Size of Landholding
Asset Possession
Livestock Possession
% Land cultivated
Farm outputs Off-farm activities-
contribution
Non-farm activities-
contribution
Remit-tances
1990 8 <Grade 7 10 acres - - 45 1300 kgs maize, 4 bales cotton, 170kgs groundnuts
Piecework and gardening
Selling water and firewood
-
1991 8 <Grade 7 10 acres - - 50 600kgs maize, 2 bales cotton,
Piecework and gardening
Selling water and firewood
- 1992 9 <Grade 7 10 acres - - 60 20kgs groundnuts Piecework and
gardening Selling water and firewood
- 1993 9 <Grade 7 10 acres - - 50 1700kgs maize, 7
bales cotton, 500kgs groundnuts
Piecework and gardening
Selling water and firewood
-
1994 10 <Grade 7 10 acres - - 50 200kgs maize, 2 bales cotton, 100kgs groundnuts
Piecework and gardening
Selling water and firewood
-
1995 9 <Grade 7 10 acres - - 55 150kgs maize, 3 bales cotton, 100kgs groundnuts
Piecework and gardening
Selling water and firewood
-
1996 9 <Grade 7 10 acres - - 55 700kgs maize, 6 bales cotton, 80kgs groundnuts
Piecework and gardening
Selling water and firewood
-
1997 9 <Grade 7 10 acres - - 52 500kgs maize, 4 bales cotton, 100kgs groundnuts
Piecework and gardening
Selling water and firewood
-
1998 9 <Grade 7 10 acres - - 56 1000kgs maize, 6 bales cotton, 110kgs groundnuts
Piecework and gardening
Selling water and firewood
-
1999 10 <Grade 7 10 acres - - 50 100kgs maize, 4 bales cotton, 50kgs groundnuts
Piecework and gardening
Selling water and firewood
-
2000 10 <Grade 7 10 acres - - 50 150kgs maize, 3 bales cotton, 80kgs groundnuts
Piecework and gardening
Selling water and firewood
-
2001 10 <Grade 7 10 acres - - 50 80kgs maize, 1 bale cotton, 80kgs groundnuts.
Piecework and gardening
Selling water and firewood
-
2002 10 <Grade 7 10 acres - 2 cattle 60 20kgs maize, 1 bale cotton, 20kgs groundnuts
Piecework and gardening
Selling water and firewood
-
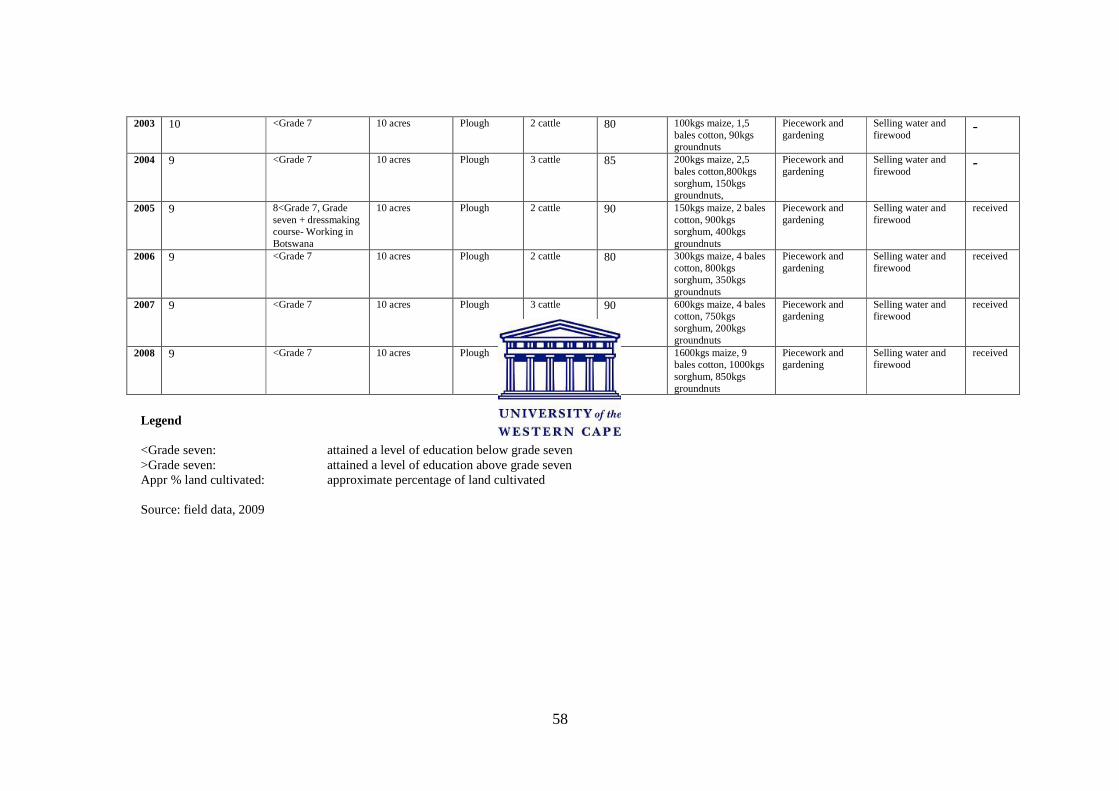
58
2003 10 <Grade 7 10 acres Plough 2 cattle 80 100kgs maize, 1,5 bales cotton, 90kgs groundnuts
Piecework and gardening
Selling water and firewood
-
2004 9 <Grade 7 10 acres Plough 3 cattle 85 200kgs maize, 2,5 bales cotton,800kgs sorghum, 150kgs groundnuts,
Piecework and gardening
Selling water and firewood
-
2005 9 8<Grade 7, Grade seven + dressmaking course- Working in Botswana
10 acres Plough 2 cattle 90 150kgs maize, 2 bales cotton, 900kgs sorghum, 400kgs groundnuts
Piecework and gardening
Selling water and firewood
received
2006 9 <Grade 7 10 acres Plough 2 cattle 80 300kgs maize, 4 bales cotton, 800kgs sorghum, 350kgs groundnuts
Piecework and gardening
Selling water and firewood
received
2007 9 <Grade 7 10 acres Plough 3 cattle 90 600kgs maize, 4 bales cotton, 750kgs sorghum, 200kgs groundnuts
Piecework and gardening
Selling water and firewood
received
2008 9 <Grade 7 10 acres Plough 3 cattle 90 1600kgs maize, 9 bales cotton, 1000kgs sorghum, 850kgs groundnuts
Piecework and gardening
Selling water and firewood
received
Legend <Grade seven: attained a level of education below grade seven >Grade seven: attained a level of education above grade seven Appr % land cultivated: approximate percentage of land cultivated Source: field data, 2009
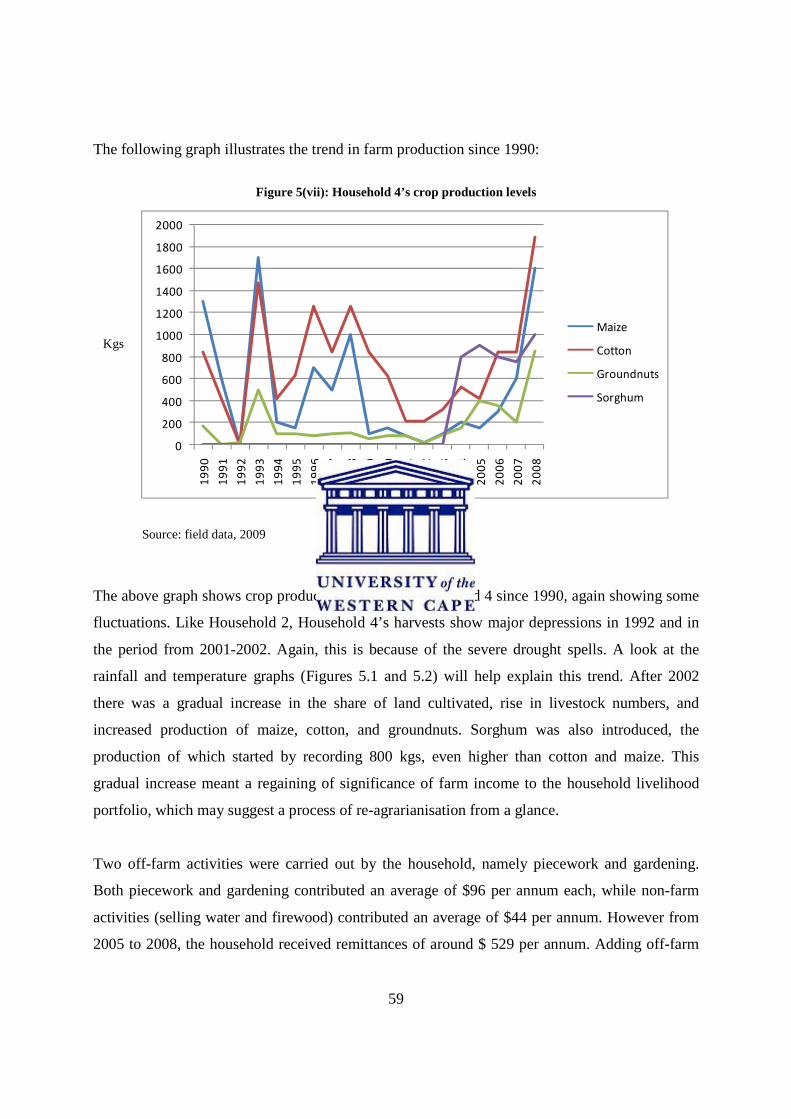
59
The following graph illustrates the trend in farm production since 1990:
Figure 5(vii): Household 4’s crop production levels
Kgs
Y Years
Source: field data, 2009
The above graph shows crop production trends for Household 4 since 1990, again showing some
fluctuations. Like Household 2, Household 4’s harvests show major depressions in 1992 and in
the period from 2001-2002. Again, this is because of the severe drought spells. A look at the
rainfall and temperature graphs (Figures 5.1 and 5.2) will help explain this trend. After 2002
there was a gradual increase in the share of land cultivated, rise in livestock numbers, and
increased production of maize, cotton, and groundnuts. Sorghum was also introduced, the
production of which started by recording 800 kgs, even higher than cotton and maize. This
gradual increase meant a regaining of significance of farm income to the household livelihood
portfolio, which may suggest a process of re-agrarianisation from a glance.
Two off-farm activities were carried out by the household, namely piecework and gardening.
Both piecework and gardening contributed an average of $96 per annum each, while non-farm
activities (selling water and firewood) contributed an average of $44 per annum. However from
2005 to 2008, the household received remittances of around $ 529 per annum. Adding off-farm
0
200
400
600
800
1000
1200
1400
1600
1800
2000
1990
1991
1992
1993
1994
1995
1996
1997
1998
1999
2000
2001
2002
2003
2004
2005
2006
2007
2008
Maize
Cotton
Groundnuts
Sorghum
60
income and non-farm income contribution, one gets a total average of $765 which is lower than
the total average price of cotton alone, which is $875 per annum. Therefore the overall picture
painted here is that the household’s livelihood strategy continues to be skewed towards
smallholder farming.
Household 5
Table 5.5 below summarises the socio-economic data for the fifth household, which is the last
household from Nyoni village in our sample:
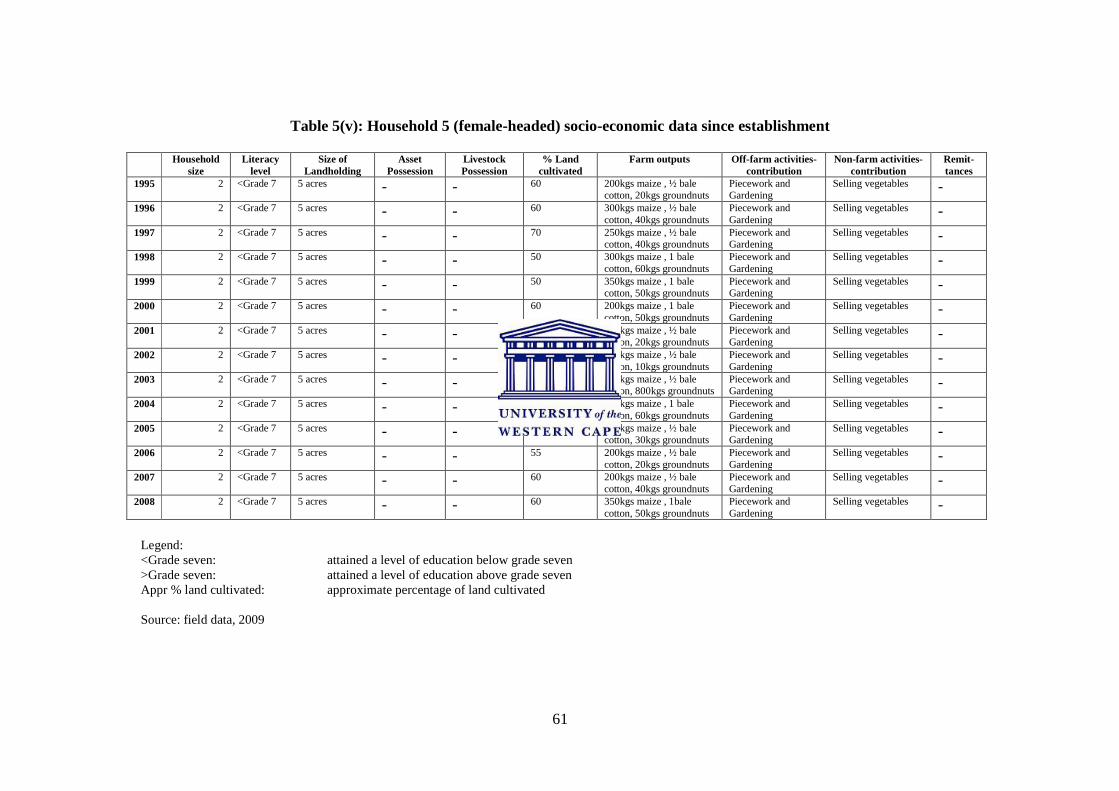
61
Table 5(v): Household 5 (female-headed) socio-economic data since establishment
Household size
Literacy level
Size of Landholding
Asset Possession
Livestock Possession
% Land cultivated
Farm outputs Off-farm activities-contribution
Non-farm activities-contribution
Remit-tances
1995 2 <Grade 7 5 acres - - 60 200kgs maize , ½ bale cotton, 20kgs groundnuts
Piecework and Gardening
Selling vegetables - 1996 2 <Grade 7 5 acres - - 60 300kgs maize , ½ bale
cotton, 40kgs groundnuts Piecework and Gardening
Selling vegetables - 1997 2 <Grade 7 5 acres - - 70 250kgs maize , ½ bale
cotton, 40kgs groundnuts Piecework and Gardening
Selling vegetables - 1998 2 <Grade 7 5 acres - - 50 300kgs maize , 1 bale
cotton, 60kgs groundnuts Piecework and Gardening
Selling vegetables - 1999 2 <Grade 7 5 acres - - 50 350kgs maize , 1 bale
cotton, 50kgs groundnuts Piecework and Gardening
Selling vegetables - 2000 2 <Grade 7 5 acres - - 60 200kgs maize , 1 bale
cotton, 50kgs groundnuts Piecework and Gardening
Selling vegetables - 2001 2 <Grade 7 5 acres - - 50 150kgs maize , ½ bale
cotton, 20kgs groundnuts Piecework and Gardening
Selling vegetables - 2002 2 <Grade 7 5 acres - - 50 100kgs maize , ½ bale
cotton, 10kgs groundnuts Piecework and Gardening
Selling vegetables - 2003 2 <Grade 7 5 acres - - 60 200kgs maize , ½ bale
cotton, 800kgs groundnuts Piecework and Gardening
Selling vegetables - 2004 2 <Grade 7 5 acres - - 55 260kgs maize , 1 bale
cotton, 60kgs groundnuts Piecework and Gardening
Selling vegetables - 2005 2 <Grade 7 5 acres - - 45 100kgs maize , ½ bale
cotton, 30kgs groundnuts Piecework and Gardening
Selling vegetables - 2006 2 <Grade 7 5 acres - - 55 200kgs maize , ½ bale
cotton, 20kgs groundnuts Piecework and Gardening
Selling vegetables - 2007 2 <Grade 7 5 acres - - 60 200kgs maize , ½ bale
cotton, 40kgs groundnuts Piecework and Gardening
Selling vegetables - 2008 2 <Grade 7 5 acres - - 60 350kgs maize , 1bale
cotton, 50kgs groundnuts Piecework and Gardening
Selling vegetables -
Legend: <Grade seven: attained a level of education below grade seven >Grade seven: attained a level of education above grade seven Appr % land cultivated: approximate percentage of land cultivated Source: field data, 2009
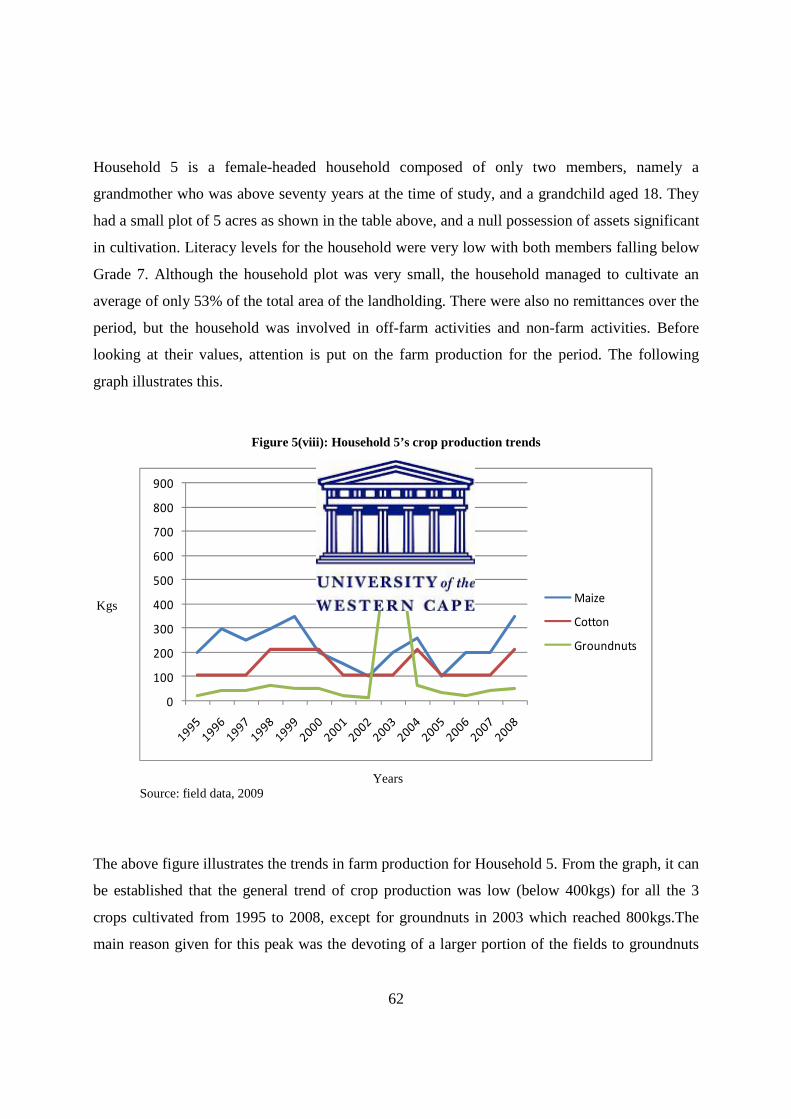
62
Household 5 is a female-headed household composed of only two members, namely a
grandmother who was above seventy years at the time of study, and a grandchild aged 18. They
had a small plot of 5 acres as shown in the table above, and a null possession of assets significant
in cultivation. Literacy levels for the household were very low with both members falling below
Grade 7. Although the household plot was very small, the household managed to cultivate an
average of only 53% of the total area of the landholding. There were also no remittances over the
period, but the household was involved in off-farm activities and non-farm activities. Before
looking at their values, attention is put on the farm production for the period. The following
graph illustrates this.
Figure 5(viii): Household 5’s crop production trends Kgs
Years Source: field data, 2009
The above figure illustrates the trends in farm production for Household 5. From the graph, it can
be established that the general trend of crop production was low (below 400kgs) for all the 3
crops cultivated from 1995 to 2008, except for groundnuts in 2003 which reached 800kgs.The
main reason given for this peak was the devoting of a larger portion of the fields to groundnuts
0
100
200
300
400
500
600
700
800
900
Maize
Cotton
Groundnuts
63
because of its resistance to drought spells. The generally low level of crop production can be
understood by considering lack of assets and enough labour for the plot as inputs for the farm.
The household head also mentioned the problem of seeds as another drawback.
Off-farm income and non-farm income was not much because of the problem of inadequate
labour to be involved in such activities. The average sum of off-farm and non-farm income was
about $60 (field data, 2009), which is far below the value of the farm produce. However, there
were times when the ratio of off-farm and non-farm income to farm income was very high, i.e. in
drought years.
5.2.3 Maringa 1 village household socio-economic data From this village, only households established before 2000 were studied, since those who were
established after 2000 were offshoot households established in 2007 and 2008, which the
researcher felt was too recent considering the scope of this study.
Household 6
Table 5.6 below summarises socio-economic data for the first household in the village, which we
refer to nonetheless as Household 6.
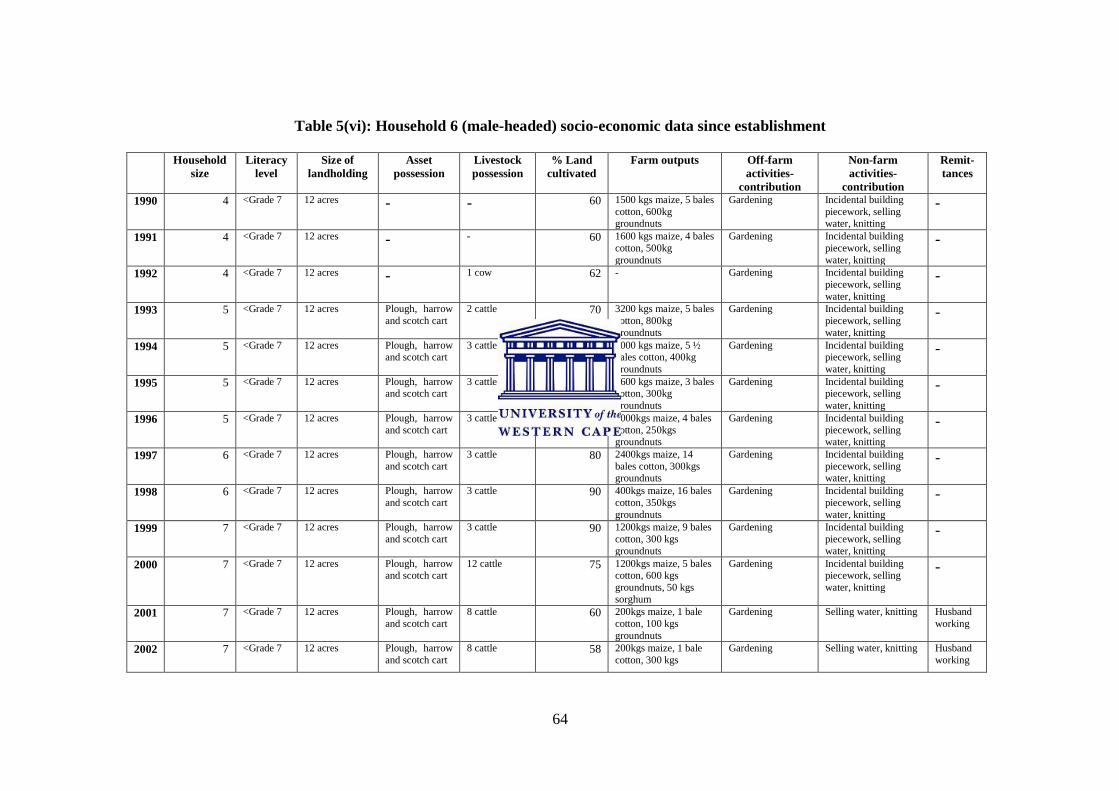
64
Table 5(vi): Household 6 (male-headed) socio-economic data since establishment
Household size
Literacy level
Size of landholding
Asset possession
Livestock possession
% Land cultivated
Farm outputs Off-farm activities-
contribution
Non-farm activities-
contribution
Remit-tances
1990 4 <Grade 7 12 acres - - 60 1500 kgs maize, 5 bales cotton, 600kg groundnuts
Gardening
Incidental building piecework, selling water, knitting
-
1991 4 <Grade 7 12 acres - - 60 1600 kgs maize, 4 bales cotton, 500kg groundnuts
Gardening
Incidental building piecework, selling water, knitting
-
1992 4 <Grade 7 12 acres - 1 cow 62 - Gardening
Incidental building piecework, selling water, knitting
-
1993 5 <Grade 7 12 acres Plough, harrow and scotch cart
2 cattle 70 3200 kgs maize, 5 bales cotton, 800kg groundnuts
Gardening
Incidental building piecework, selling water, knitting
-
1994 5 <Grade 7 12 acres Plough, harrow and scotch cart
3 cattle 80 1000 kgs maize, 5 ½ bales cotton, 400kg groundnuts
Gardening
Incidental building piecework, selling water, knitting
-
1995 5 <Grade 7 12 acres Plough, harrow and scotch cart
3 cattle 90 3600 kgs maize, 3 bales cotton, 300kg groundnuts
Gardening
Incidental building piecework, selling water, knitting
-
1996 5 <Grade 7 12 acres Plough, harrow and scotch cart
3 cattle 70 1000kgs maize, 4 bales cotton, 250kgs groundnuts
Gardening
Incidental building piecework, selling water, knitting
-
1997 6 <Grade 7 12 acres Plough, harrow and scotch cart
3 cattle 80 2400kgs maize, 14 bales cotton, 300kgs groundnuts
Gardening
Incidental building piecework, selling water, knitting
-
1998 6 <Grade 7 12 acres Plough, harrow and scotch cart
3 cattle 90 400kgs maize, 16 bales cotton, 350kgs groundnuts
Gardening
Incidental building piecework, selling water, knitting
-
1999 7 <Grade 7 12 acres Plough, harrow and scotch cart
3 cattle 90 1200kgs maize, 9 bales cotton, 300 kgs groundnuts
Gardening
Incidental building piecework, selling water, knitting
-
2000 7 <Grade 7 12 acres Plough, harrow and scotch cart
12 cattle 75 1200kgs maize, 5 bales cotton, 600 kgs groundnuts, 50 kgs sorghum
Gardening
Incidental building piecework, selling water, knitting
-
2001 7 <Grade 7 12 acres Plough, harrow and scotch cart
8 cattle 60 200kgs maize, 1 bale cotton, 100 kgs groundnuts
Gardening
Selling water, knitting Husband
working
2002 7 <Grade 7 12 acres Plough, harrow and scotch cart
8 cattle 58 200kgs maize, 1 bale cotton, 300 kgs
Gardening
Selling water, knitting Husband
working
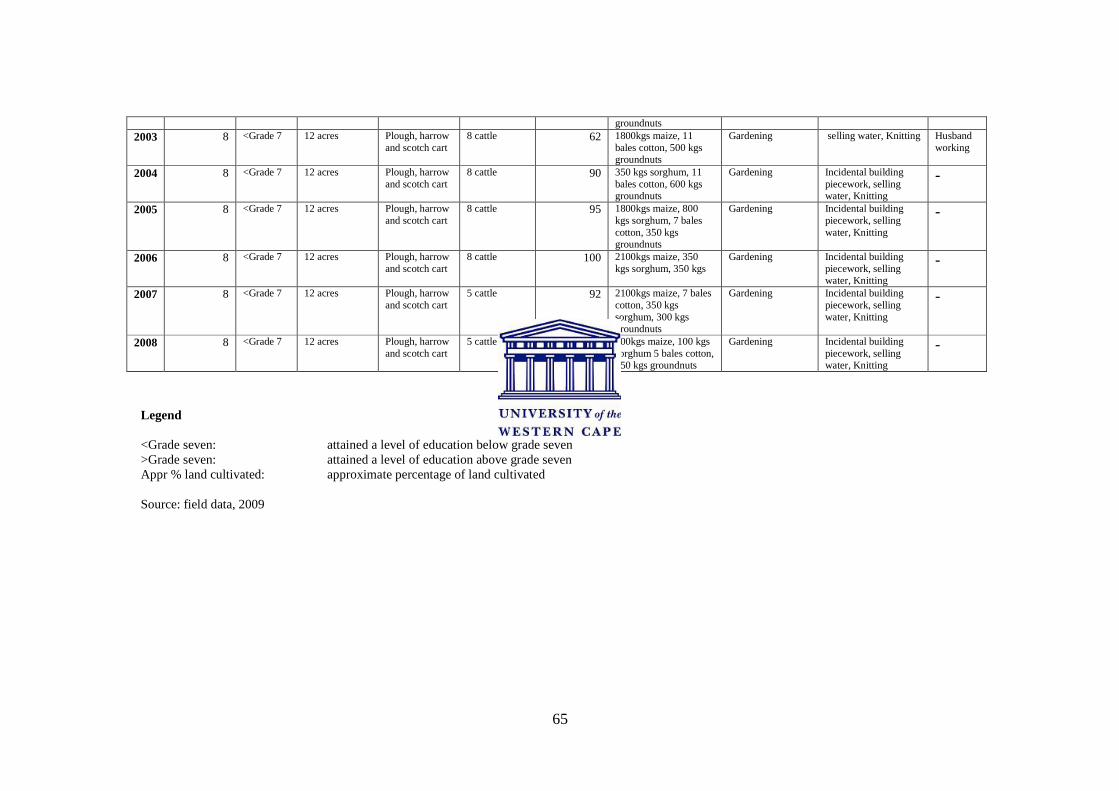
65
groundnuts 2003 8 <Grade 7 12 acres Plough, harrow
and scotch cart 8 cattle 62 1800kgs maize, 11
bales cotton, 500 kgs groundnuts
Gardening
selling water, Knitting Husband
working
2004 8 <Grade 7 12 acres Plough, harrow and scotch cart
8 cattle 90 350 kgs sorghum, 11 bales cotton, 600 kgs groundnuts
Gardening
Incidental building piecework, selling water, Knitting
-
2005 8 <Grade 7 12 acres Plough, harrow and scotch cart
8 cattle 95 1800kgs maize, 800 kgs sorghum, 7 bales cotton, 350 kgs groundnuts
Gardening
Incidental building piecework, selling water, Knitting
-
2006 8 <Grade 7 12 acres Plough, harrow and scotch cart
8 cattle 100 2100kgs maize, 350 kgs sorghum, 350 kgs
Gardening
Incidental building piecework, selling water, Knitting
-
2007 8 <Grade 7 12 acres Plough, harrow and scotch cart
5 cattle 92 2100kgs maize, 7 bales cotton, 350 kgs sorghum, 300 kgs groundnuts
Gardening
Incidental building piecework, selling water, Knitting
-
2008 8 <Grade 7 12 acres Plough, harrow and scotch cart
5 cattle 90 600kgs maize, 100 kgs sorghum 5 bales cotton, 250 kgs groundnuts
Gardening
Incidental building piecework, selling water, Knitting
-
Legend <Grade seven: attained a level of education below grade seven >Grade seven: attained a level of education above grade seven Appr % land cultivated: approximate percentage of land cultivated Source: field data, 2009
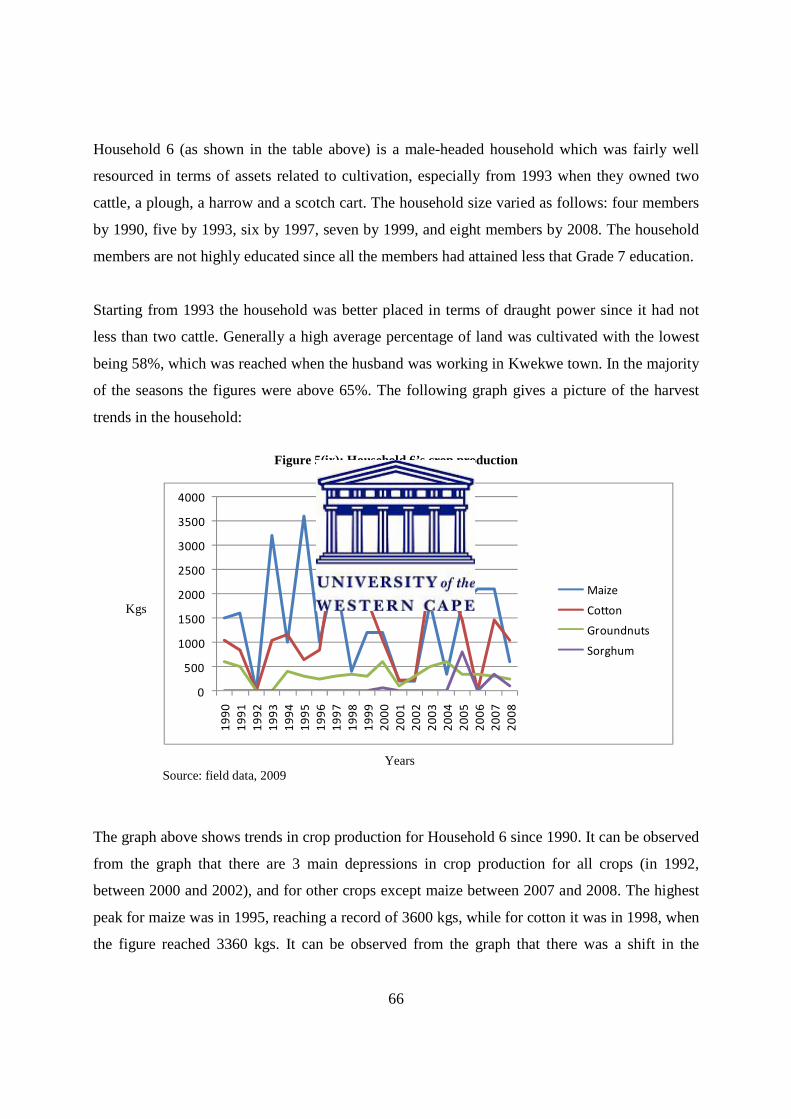
66
Household 6 (as shown in the table above) is a male-headed household which was fairly well
resourced in terms of assets related to cultivation, especially from 1993 when they owned two
cattle, a plough, a harrow and a scotch cart. The household size varied as follows: four members
by 1990, five by 1993, six by 1997, seven by 1999, and eight members by 2008. The household
members are not highly educated since all the members had attained less that Grade 7 education.
Starting from 1993 the household was better placed in terms of draught power since it had not
less than two cattle. Generally a high average percentage of land was cultivated with the lowest
being 58%, which was reached when the husband was working in Kwekwe town. In the majority
of the seasons the figures were above 65%. The following graph gives a picture of the harvest
trends in the household:
Figure 5(ix): Household 6’s crop production
Kgs Years
Source: field data, 2009
The graph above shows trends in crop production for Household 6 since 1990. It can be observed
from the graph that there are 3 main depressions in crop production for all crops (in 1992,
between 2000 and 2002), and for other crops except maize between 2007 and 2008. The highest
peak for maize was in 1995, reaching a record of 3600 kgs, while for cotton it was in 1998, when
the figure reached 3360 kgs. It can be observed from the graph that there was a shift in the
0
500
1000
1500
2000
2500
3000
3500
4000
1990
1991
1992
1993
1994
1995
1996
1997
1998
1999
2000
2001
2002
2003
2004
2005
2006
2007
2008
Maize
Cotton
Groundnuts
Sorghum
67
harvest of cotton to higher figures from 1996. The only depression was in 2006 when a zero
harvest was recorded.
The household was involved in gardening. The vegetables which they produced were basically
for household consumption (interview with key informant). The non-farm activities carried out
by the household are incidental construction piecework, selling water and knitting. According to
the household head, construction piecework was not an income source to be counted on since it
depends on the availability of people in need of the service. However, he highlighted that on the
few occasions he was contracted; it generated for the household a significant amount of money
which could be used in the payment of children’s school fees and even the buying of grain and
groceries. The household was also not much involved in the selling of water at the service centre
– they only participated when they wanted money for petty expenses like the grinding mill fee
(Mari yechigayo) and the buying of salt and soap. Knitting was profitable for the household
before 2000, when it was promoted by the government through competitions and exhibitions at
Madzivazvido business centre. However, the household members could not exactly remember
how much income they generated from knitting, though they did recall that it was sometimes
enough to pay school fees and buy kitchen utensils. On average a qualitative analysis of the
relationship between off-farm’ together with non-farm income, and farm income, suggests that
farm income is still the main source of the family livelihood, and increasingly so over the period.
From 2001-2003, the household head was working in a construction company in Kwekwe, about
200 kilometres away from home. This is the only period during which the household received
remittances. However, even during that period the household partially depended on farm
produce. Figures of salaries could not be recalled, but the income bailed the household out from
the impacts of the drought and managed to pay for children’s school fees – a situation different
in some respects to Household 7’s experience, to which we turn below.
Household 7
Household 7 presents quite a different scenario in that it had many household members, many
livestock, high asset ownership and high crop production levels from 1994-2001. The following
table 5(vii) represents socio-economic data for household seven:
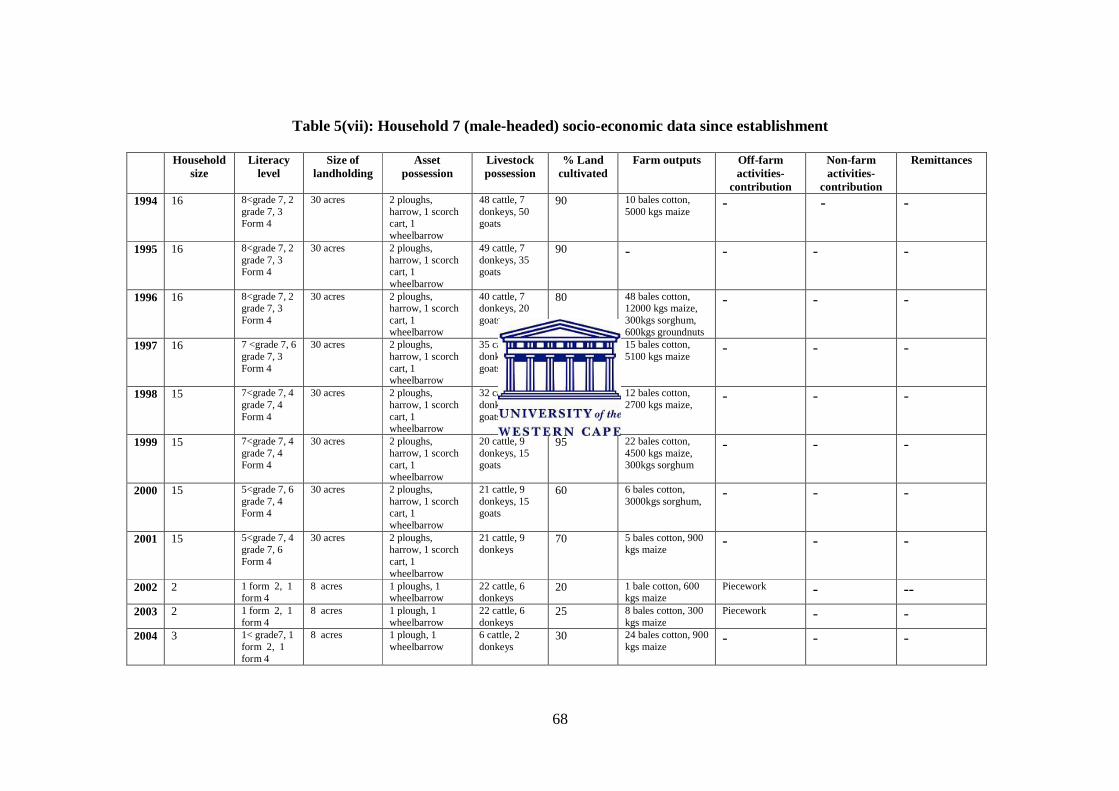
68
Table 5(vii): Household 7 (male-headed) socio-economic data since establishment
Household size
Literacy level
Size of landholding
Asset possession
Livestock possession
% Land cultivated
Farm outputs Off-farm activities-
contribution
Non-farm activities-
contribution
Remittances
1994 16 8<grade 7, 2 grade 7, 3 Form 4
30 acres 2 ploughs, harrow, 1 scorch cart, 1 wheelbarrow
48 cattle, 7 donkeys, 50 goats
90 10 bales cotton, 5000 kgs maize - - -
1995 16 8<grade 7, 2 grade 7, 3 Form 4
30 acres 2 ploughs, harrow, 1 scorch cart, 1 wheelbarrow
49 cattle, 7 donkeys, 35 goats
90 - - - -
1996 16 8<grade 7, 2 grade 7, 3 Form 4
30 acres 2 ploughs, harrow, 1 scorch cart, 1 wheelbarrow
40 cattle, 7 donkeys, 20 goats
80 48 bales cotton, 12000 kgs maize, 300kgs sorghum, 600kgs groundnuts
- - -
1997 16 7 <grade 7, 6 grade 7, 3 Form 4
30 acres 2 ploughs, harrow, 1 scorch cart, 1 wheelbarrow
35 cattle, 7 donkeys, 20 goats
90 15 bales cotton, 5100 kgs maize - - -
1998 15 7<grade 7, 4 grade 7, 4 Form 4
30 acres 2 ploughs, harrow, 1 scorch cart, 1 wheelbarrow
32 cattle, 8 donkeys, 18 goats
90 12 bales cotton, 2700 kgs maize, - - -
1999 15 7<grade 7, 4 grade 7, 4 Form 4
30 acres 2 ploughs, harrow, 1 scorch cart, 1 wheelbarrow
20 cattle, 9 donkeys, 15 goats
95 22 bales cotton, 4500 kgs maize, 300kgs sorghum
- - -
2000 15 5<grade 7, 6 grade 7, 4 Form 4
30 acres 2 ploughs, harrow, 1 scorch cart, 1 wheelbarrow
21 cattle, 9 donkeys, 15 goats
60 6 bales cotton, 3000kgs sorghum, - - -
2001 15 5<grade 7, 4 grade 7, 6 Form 4
30 acres 2 ploughs, harrow, 1 scorch cart, 1 wheelbarrow
21 cattle, 9 donkeys
70 5 bales cotton, 900 kgs maize - - -
2002 2 1 form 2, 1 form 4
8 acres 1 ploughs, 1 wheelbarrow
22 cattle, 6 donkeys
20 1 bale cotton, 600 kgs maize
Piecework - -- 2003 2 1 form 2, 1
form 4 8 acres 1 plough, 1
wheelbarrow 22 cattle, 6 donkeys
25 8 bales cotton, 300 kgs maize
Piecework - - 2004 3 1< grade7, 1
form 2, 1 form 4
8 acres 1 plough, 1 wheelbarrow
6 cattle, 2 donkeys
30 24 bales cotton, 900 kgs maize - - -
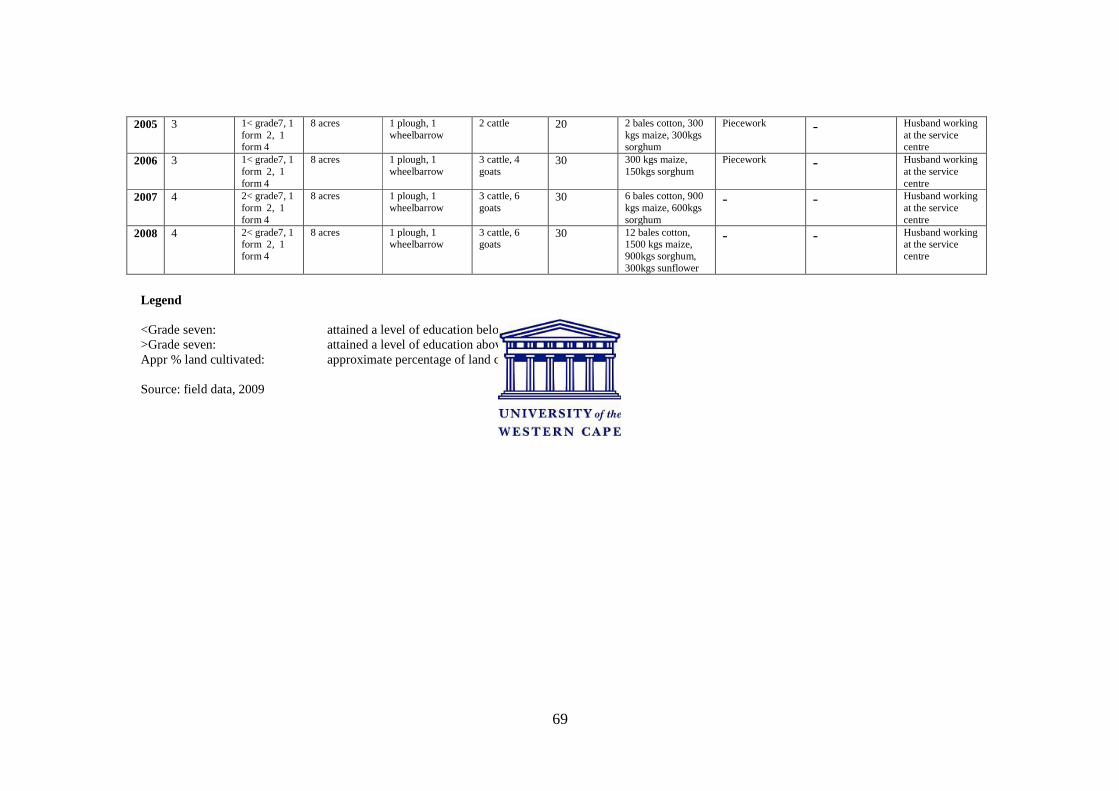
69
2005 3 1< grade7, 1 form 2, 1 form 4
8 acres 1 plough, 1 wheelbarrow
2 cattle 20 2 bales cotton, 300 kgs maize, 300kgs sorghum
Piecework - Husband working at the service centre
2006 3 1< grade7, 1 form 2, 1 form 4
8 acres 1 plough, 1 wheelbarrow
3 cattle, 4 goats
30 300 kgs maize, 150kgs sorghum
Piecework - Husband working at the service centre
2007 4 2< grade7, 1 form 2, 1 form 4
8 acres 1 plough, 1 wheelbarrow
3 cattle, 6 goats
30 6 bales cotton, 900 kgs maize, 600kgs sorghum
- - Husband working at the service centre
2008 4 2< grade7, 1 form 2, 1 form 4
8 acres 1 plough, 1 wheelbarrow
3 cattle, 6 goats
30 12 bales cotton, 1500 kgs maize, 900kgs sorghum, 300kgs sunflower
- - Husband working at the service centre
Legend <Grade seven: attained a level of education below grade seven >Grade seven: attained a level of education above grade seven Appr % land cultivated: approximate percentage of land cultivated Source: field data, 2009
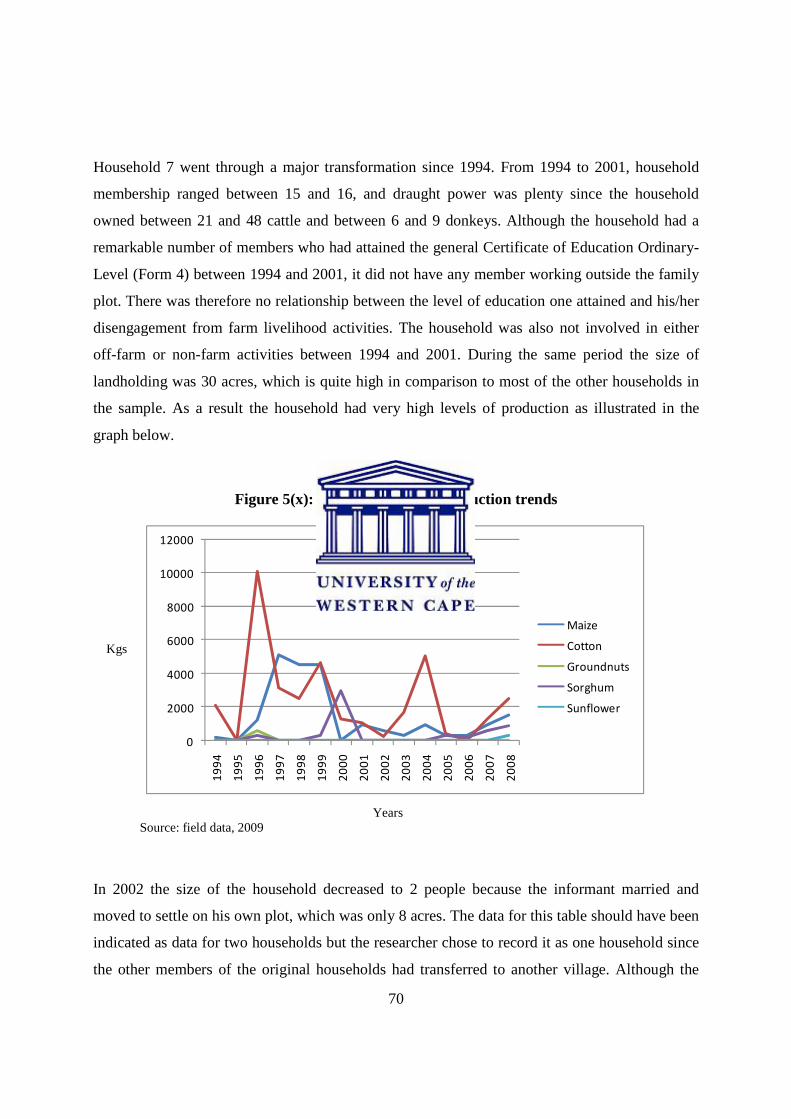
70
Household 7 went through a major transformation since 1994. From 1994 to 2001, household
membership ranged between 15 and 16, and draught power was plenty since the household
owned between 21 and 48 cattle and between 6 and 9 donkeys. Although the household had a
remarkable number of members who had attained the general Certificate of Education Ordinary-
Level (Form 4) between 1994 and 2001, it did not have any member working outside the family
plot. There was therefore no relationship between the level of education one attained and his/her
disengagement from farm livelihood activities. The household was also not involved in either
off-farm or non-farm activities between 1994 and 2001. During the same period the size of
landholding was 30 acres, which is quite high in comparison to most of the other households in
the sample. As a result the household had very high levels of production as illustrated in the
graph below.
Figure 5(x): Household 7 crop production trends
Kgs
Years Source: field data, 2009
In 2002 the size of the household decreased to 2 people because the informant married and
moved to settle on his own plot, which was only 8 acres. The data for this table should have been
indicated as data for two households but the researcher chose to record it as one household since
the other members of the original households had transferred to another village. Although the
0
2000
4000
6000
8000
10000
12000
1994
1995
1996
1997
1998
1999
2000
2001
2002
2003
2004
2005
2006
2007
2008
Maize
Cotton
Groundnuts
Sorghum
Sunflower
71
household still had much draught power until 2003, the 2002 and 2003 harvests were low
because of the combined effect of less labour and a draught spell as illustrated in figure 5.1. It is
during this period when the household was involved in off-farm activities. It was also involved in
non-farm activity in 2005-2006. From 2005 the household head was employed as a security
guard at the nearest business centre (Chitekete).
Household 8
In contrast to Household 7, Household 8 had no member working outside the family plot. Figure
4.15 below illustrates Household 8’s experience since its establishment in 1996:
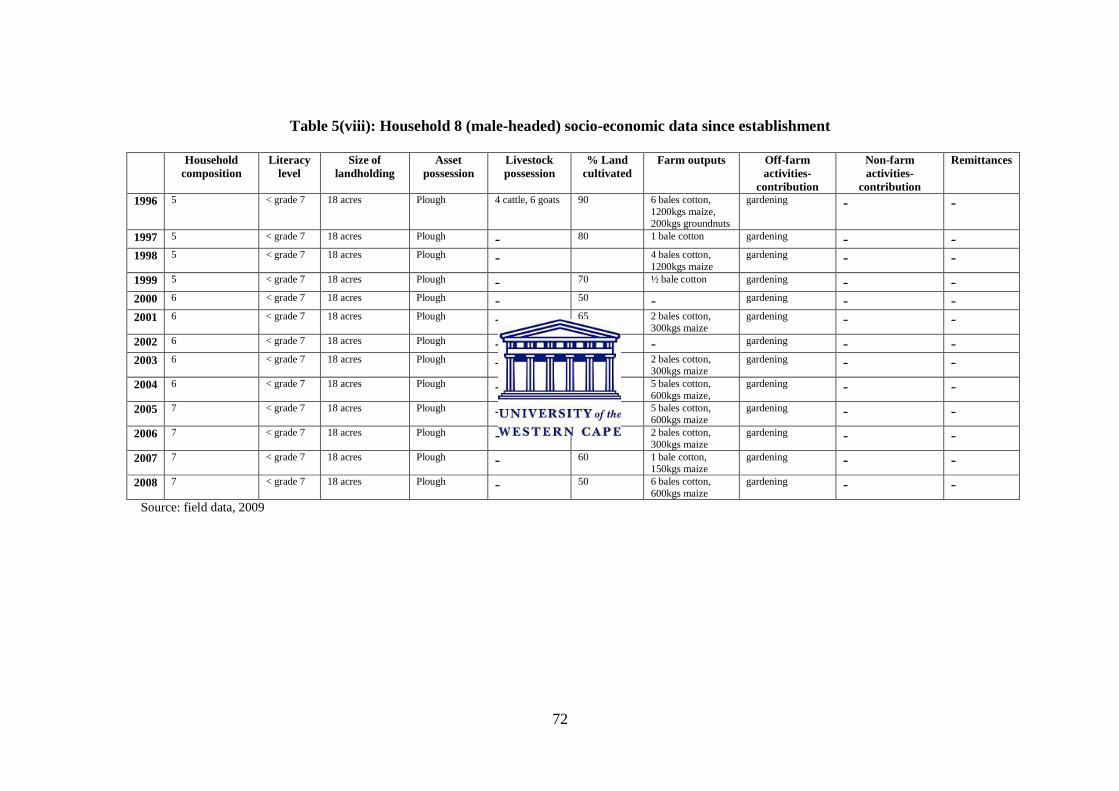
72
Table 5(viii): Household 8 (male-headed) socio-economic data since establishment
Household composition
Literacy level
Size of landholding
Asset possession
Livestock possession
% Land cultivated
Farm outputs Off-farm activities-
contribution
Non-farm activities-
contribution
Remittances
1996 5 < grade 7 18 acres Plough 4 cattle, 6 goats 90 6 bales cotton, 1200kgs maize, 200kgs groundnuts
gardening - -
1997 5 < grade 7 18 acres Plough - 80 1 bale cotton gardening - - 1998 5 < grade 7 18 acres Plough - 4 bales cotton,
1200kgs maize gardening - -
1999 5 < grade 7 18 acres Plough - 70 ½ bale cotton gardening - - 2000 6 < grade 7 18 acres Plough - 50 - gardening - - 2001 6 < grade 7 18 acres Plough - 65 2 bales cotton,
300kgs maize gardening - -
2002 6 < grade 7 18 acres Plough - 45 - gardening - - 2003 6 < grade 7 18 acres Plough - 60 2 bales cotton,
300kgs maize gardening - -
2004 6 < grade 7 18 acres Plough - 60 5 bales cotton, 600kgs maize,
gardening - - 2005 7 < grade 7 18 acres Plough - 50 5 bales cotton,
600kgs maize gardening - -
2006 7 < grade 7 18 acres Plough - 65 2 bales cotton, 300kgs maize
gardening - - 2007 7 < grade 7 18 acres Plough - 60 1 bale cotton,
150kgs maize gardening - -
2008 7 < grade 7 18 acres Plough - 50 6 bales cotton, 600kgs maize
gardening - -
Source: field data, 2009
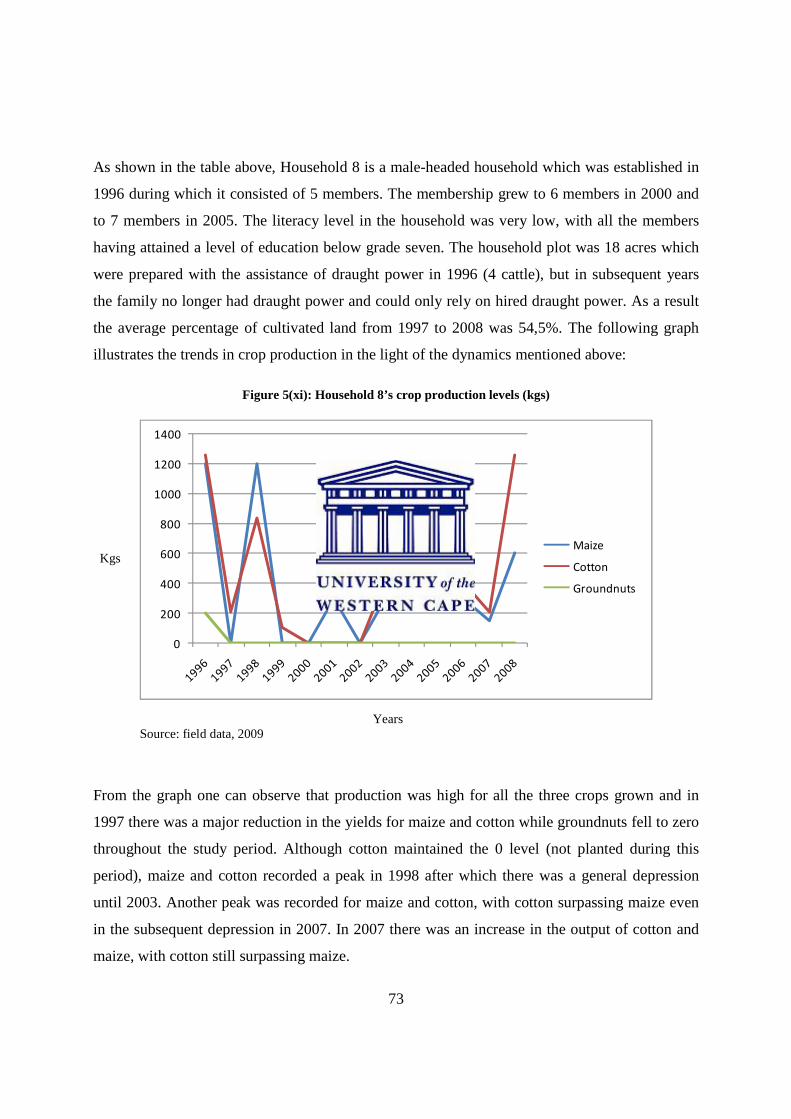
73
As shown in the table above, Household 8 is a male-headed household which was established in
1996 during which it consisted of 5 members. The membership grew to 6 members in 2000 and
to 7 members in 2005. The literacy level in the household was very low, with all the members
having attained a level of education below grade seven. The household plot was 18 acres which
were prepared with the assistance of draught power in 1996 (4 cattle), but in subsequent years
the family no longer had draught power and could only rely on hired draught power. As a result
the average percentage of cultivated land from 1997 to 2008 was 54,5%. The following graph
illustrates the trends in crop production in the light of the dynamics mentioned above:
Figure 5(xi): Household 8’s crop production levels (kgs)
Kgs
Years Source: field data, 2009
From the graph one can observe that production was high for all the three crops grown and in
1997 there was a major reduction in the yields for maize and cotton while groundnuts fell to zero
throughout the study period. Although cotton maintained the 0 level (not planted during this
period), maize and cotton recorded a peak in 1998 after which there was a general depression
until 2003. Another peak was recorded for maize and cotton, with cotton surpassing maize even
in the subsequent depression in 2007. In 2007 there was an increase in the output of cotton and
maize, with cotton still surpassing maize.
0
200
400
600
800
1000
1200
1400
Maize
Cotton
Groundnuts
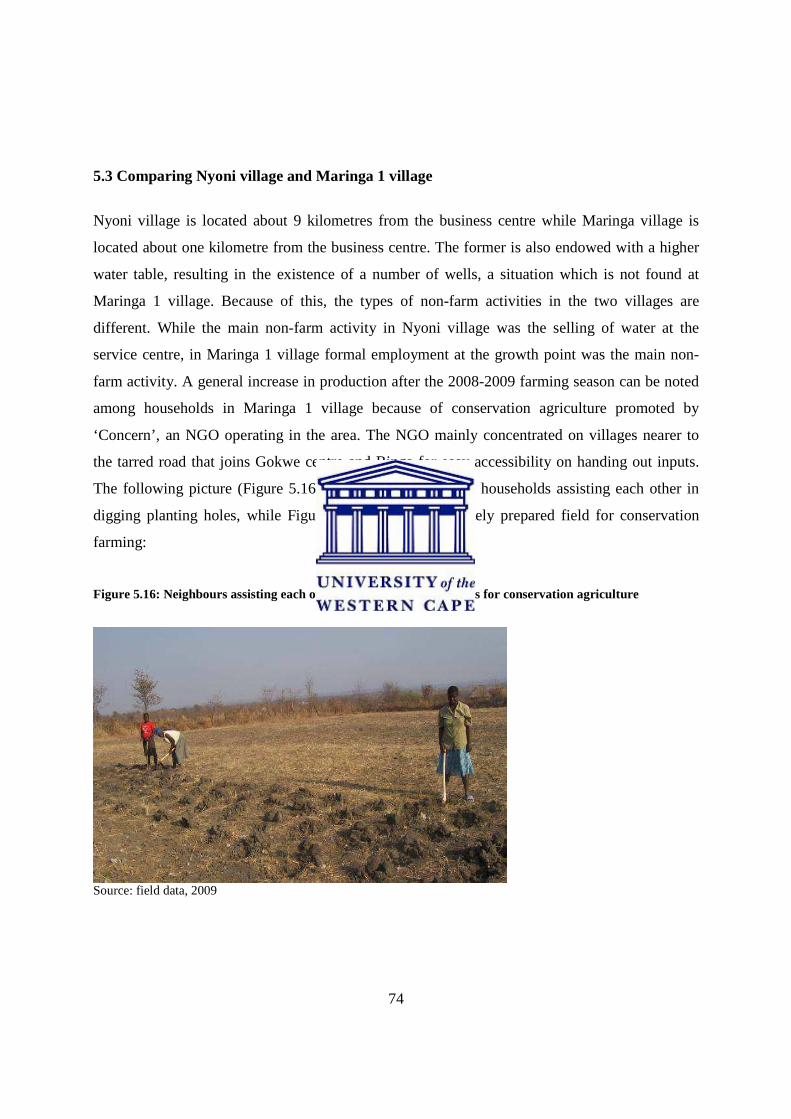
74
5.3 Comparing Nyoni village and Maringa 1 village
Nyoni village is located about 9 kilometres from the business centre while Maringa village is
located about one kilometre from the business centre. The former is also endowed with a higher
water table, resulting in the existence of a number of wells, a situation which is not found at
Maringa 1 village. Because of this, the types of non-farm activities in the two villages are
different. While the main non-farm activity in Nyoni village was the selling of water at the
service centre, in Maringa 1 village formal employment at the growth point was the main non-
farm activity. A general increase in production after the 2008-2009 farming season can be noted
among households in Maringa 1 village because of conservation agriculture promoted by
‘Concern’, an NGO operating in the area. The NGO mainly concentrated on villages nearer to
the tarred road that joins Gokwe centre and Binga for easy accessibility on handing out inputs.
The following picture (Figure 5.16) shows members of two households assisting each other in
digging planting holes, while Figure 5.17 shows a completely prepared field for conservation
farming:
Figure 5.16: Neighbours assisting each other to prepare planting holes for conservation agriculture
Source: field data, 2009
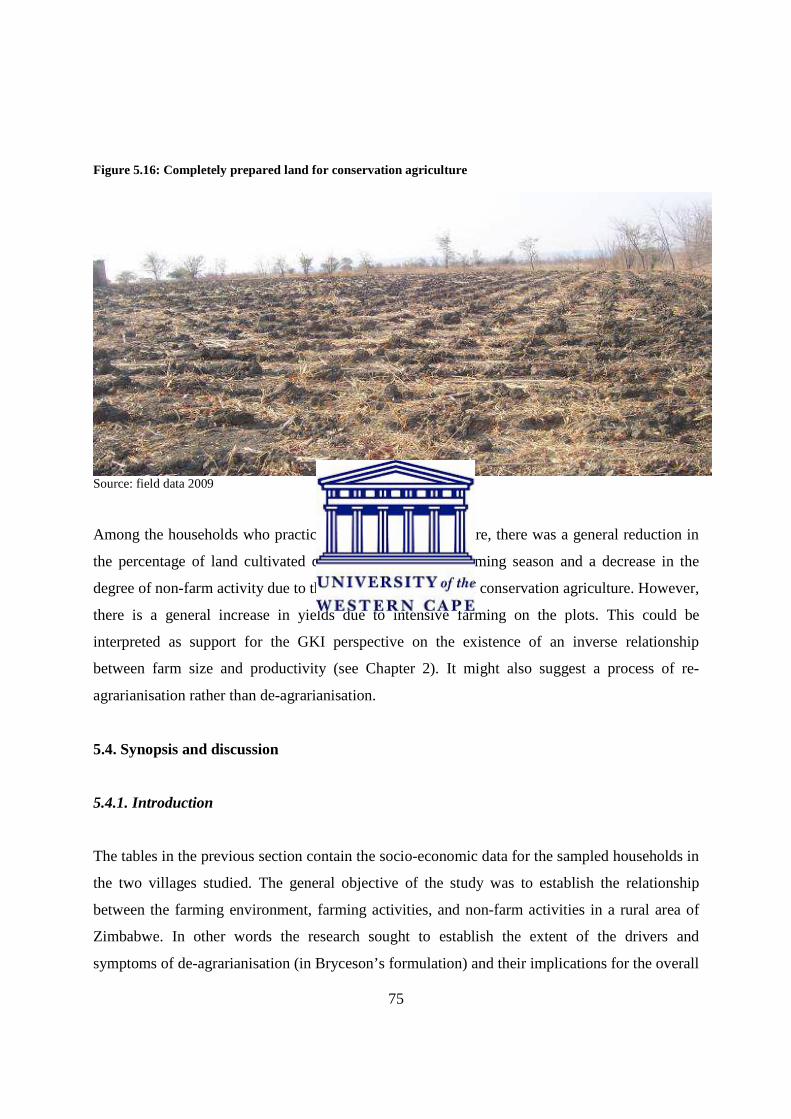
75
Figure 5.16: Completely prepared land for conservation agriculture
Source: field data 2009
Among the households who practiced conservation agriculture, there was a general reduction in
the percentage of land cultivated during the 2008-2009 farming season and a decrease in the
degree of non-farm activity due to the labour intensiveness of conservation agriculture. However,
there is a general increase in yields due to intensive farming on the plots. This could be
interpreted as support for the GKI perspective on the existence of an inverse relationship
between farm size and productivity (see Chapter 2). It might also suggest a process of re-
agrarianisation rather than de-agrarianisation.
5.4. Synopsis and discussion
5.4.1. Introduction
The tables in the previous section contain the socio-economic data for the sampled households in
the two villages studied. The general objective of the study was to establish the relationship
between the farming environment, farming activities, and non-farm activities in a rural area of
Zimbabwe. In other words the research sought to establish the extent of the drivers and
symptoms of de-agrarianisation (in Bryceson’s formulation) and their implications for the overall
76
livelihoods of households in the two villages. These drivers of de-agrarianisation are climate
change, Structural Adjustment (and economic change more broadly), changes in policy regimes
and population growth, and the characteristic symptoms are increasing of the significance of off-
farm and non farm activities for rural people’s livelihoods, an evolution in social identity from a
population which is much into farming to a population relying on employment, and spatial
relocation of people from peasant communities to other areas where they rely on alternative
means, for example; wage employment. The hypothesis explored is that the recent changes in the
farming environment have generated in Gokwe a combination of both de-agrarianisation and its
opposite, i.e. ‘re-agrarianisation’. The main focus of the data capturing exercise was to
understand changes in households’ circumstances over time and to appreciate differences
between households, with a focus on the following domains: household composition, literacy
levels of household members, occupation of household members, size of landholding, asset
possession, percentage of land cultivated, farm outputs, off-farm activity contribution, non-farm
activity contribution and remittances.
The summary table below conveys each household’s experiences in relation to the changes in the
farming environment (drivers of de-agrarianisation). In other words the previous section
examined how household livelihoods have been structured and restructured in relation to the
changes in the politico socio-economic environment. The second dimension of the study was to
observe adaptation strategies in relation to smallholder farming as a system with inputs,
processes and outputs. In this vein the idea was to observe the extent to which smallholder
farmers have been able to avoid and/or ameliorate the impacts of some of the drivers of agrarian
change in order to establish whether there is still light at the end of the tunnel (the agrarian
optimistic path) within the context of Zimbabwe’s special economic circumstances.
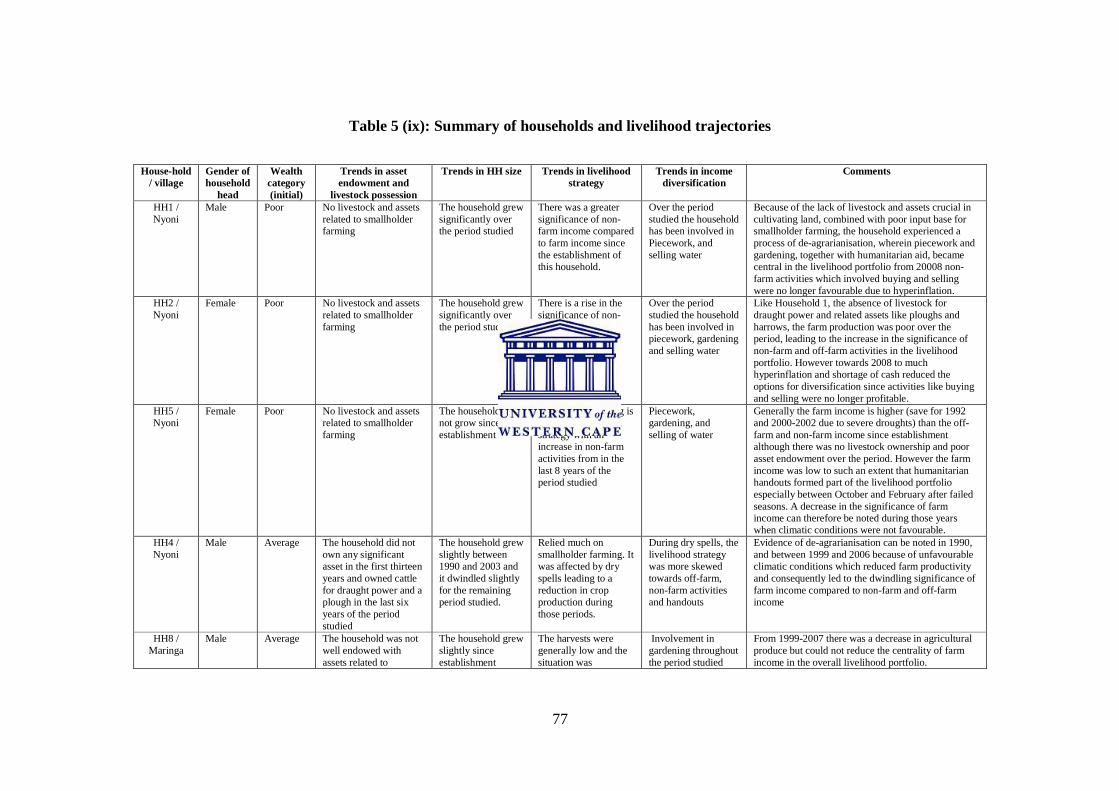
77
Table 5 (ix): Summary of households and livelihood trajectories House-hold
/ village Gender of household
head
Wealth category (initial)
Trends in asset endowment and
livestock possession
Trends in HH size Trends in livelihood strategy
Trends in income diversification
Comments
HH1 / Nyoni
Male Poor No livestock and assets related to smallholder farming
The household grew significantly over the period studied
There was a greater significance of non-farm income compared to farm income since the establishment of this household.
Over the period studied the household has been involved in Piecework, and selling water
Because of the lack of livestock and assets crucial in cultivating land, combined with poor input base for smallholder farming, the household experienced a process of de-agrarianisation, wherein piecework and gardening, together with humanitarian aid, became central in the livelihood portfolio from 20008 non-farm activities which involved buying and selling were no longer favourable due to hyperinflation.
HH2 / Nyoni
Female Poor No livestock and assets related to smallholder farming
The household grew significantly over the period studied
There is a rise in the significance of non-farm and off-farm activities in the livelihood portfolio.
Over the period studied the household has been involved in piecework, gardening and selling water
Like Household 1, the absence of livestock for draught power and related assets like ploughs and harrows, the farm production was poor over the period, leading to the increase in the significance of non-farm and off-farm activities in the livelihood portfolio. However towards 2008 to much hyperinflation and shortage of cash reduced the options for diversification since activities like buying and selling were no longer profitable.
HH5 / Nyoni
Female Poor No livestock and assets related to smallholder farming
The household did not grow since its establishment
Smallholder farming is the major livelihood strategy with an increase in non-farm activities from in the last 8 years of the period studied
Piecework, gardening, and selling of water
Generally the farm income is higher (save for 1992 and 2000-2002 due to severe droughts) than the off-farm and non-farm income since establishment although there was no livestock ownership and poor asset endowment over the period. However the farm income was low to such an extent that humanitarian handouts formed part of the livelihood portfolio especially between October and February after failed seasons. A decrease in the significance of farm income can therefore be noted during those years when climatic conditions were not favourable.
HH4 / Nyoni
Male Average The household did not own any significant asset in the first thirteen years and owned cattle for draught power and a plough in the last six years of the period studied
The household grew slightly between 1990 and 2003 and it dwindled slightly for the remaining period studied.
Relied much on smallholder farming. It was affected by dry spells leading to a reduction in crop production during those periods.
During dry spells, the livelihood strategy was more skewed towards off-farm, non-farm activities and handouts
Evidence of de-agrarianisation can be noted in 1990, and between 1999 and 2006 because of unfavourable climatic conditions which reduced farm productivity and consequently led to the dwindling significance of farm income compared to non-farm and off-farm income
HH8 / Maringa
Male Average The household was not well endowed with assets related to
The household grew slightly since establishment
The harvests were generally low and the situation was
Involvement in gardening throughout the period studied
From 1999-2007 there was a decrease in agricultural produce but could not reduce the centrality of farm income in the overall livelihood portfolio.
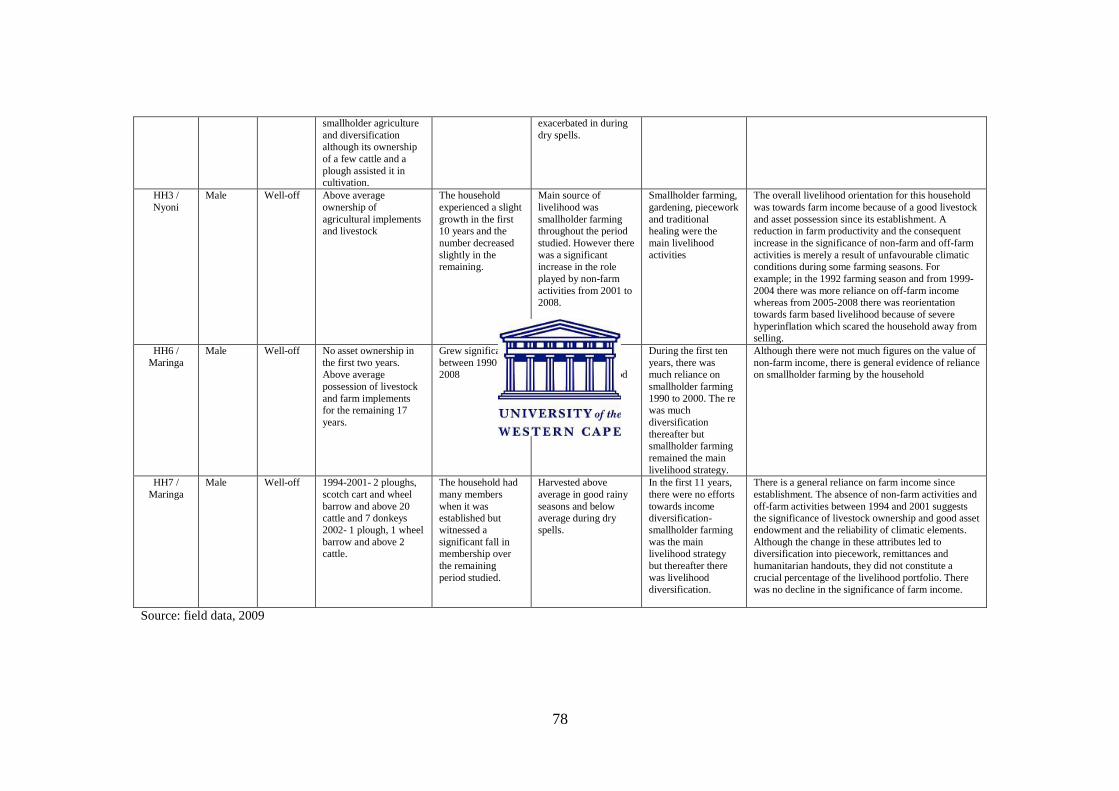
78
smallholder agriculture and diversification although its ownership of a few cattle and a plough assisted it in cultivation.
exacerbated in during dry spells.
HH3 / Nyoni
Male Well-off Above average ownership of agricultural implements and livestock
The household experienced a slight growth in the first 10 years and the number decreased slightly in the remaining.
Main source of livelihood was smallholder farming throughout the period studied. However there was a significant increase in the role played by non-farm activities from 2001 to 2008.
Smallholder farming, gardening, piecework and traditional healing were the main livelihood activities
The overall livelihood orientation for this household was towards farm income because of a good livestock and asset possession since its establishment. A reduction in farm productivity and the consequent increase in the significance of non-farm and off-farm activities is merely a result of unfavourable climatic conditions during some farming seasons. For example; in the 1992 farming season and from 1999-2004 there was more reliance on off-farm income whereas from 2005-2008 there was reorientation towards farm based livelihood because of severe hyperinflation which scared the household away from selling.
HH6 / Maringa
Male Well-off No asset ownership in the first two years. Above average possession of livestock and farm implements for the remaining 17 years.
Grew significantly between 1990 and 2008
The household got above average farm proceeds during good seasons and below average harvests during dry spells.
During the first ten years, there was much reliance on smallholder farming 1990 to 2000. The re was much diversification thereafter but smallholder farming remained the main livelihood strategy.
Although there were not much figures on the value of non-farm income, there is general evidence of reliance on smallholder farming by the household
HH7 / Maringa
Male Well-off 1994-2001- 2 ploughs, scotch cart and wheel barrow and above 20 cattle and 7 donkeys 2002- 1 plough, 1 wheel barrow and above 2 cattle.
The household had many members when it was established but witnessed a significant fall in membership over the remaining period studied.
Harvested above average in good rainy seasons and below average during dry spells.
In the first 11 years, there were no efforts towards income diversification-smallholder farming was the main livelihood strategy but thereafter there was livelihood diversification.
There is a general reliance on farm income since establishment. The absence of non-farm activities and off-farm activities between 1994 and 2001 suggests the significance of livestock ownership and good asset endowment and the reliability of climatic elements. Although the change in these attributes led to diversification into piecework, remittances and humanitarian handouts, they did not constitute a crucial percentage of the livelihood portfolio. There was no decline in the significance of farm income.
Source: field data, 2009
79
The above table demonstrates that the experiences of the eight households studied are dissimilar
depending on the structure of the household and livestock and asset endowment. Apart from
climate variability, farm capital and farm labour are crucial in determining the levels of farm
productivity. For example, it is in the households without draught power (Households 1, 2 and 5)
where there are low farm productivity levels, and for Households 1 and 2 there was a rise in the
significance of non-farm activities. Household 5 did not necessarily re-orient towards non-farm
and off-farm activities, but its production levels were so low that they were not sufficient to
sustain the household. This household mainly relied on humanitarian handouts from NGOs.
Although Household 4 did not have draught power from 1990 to 2001, its experience was a little
different from the other households mentioned above because of its composition – it had a lot of
able-bodied members who worked in the fields. Therefore their farm production levels were
nonetheless reasonably high, except for 1992 when there was a severe drought, and between
1999 and 2006, when there were unfavourable farming seasons. It can be established, however,
that those households without draught power are affected by climate variability more compared
to those households with draught power. For example the farm productivity levels for
Households 3, 6, 7, and 8 are better even during bad farming seasons. This is because of their
ability to have multiple planting dates since they have drought power (field data, 2009). This,
according to them, reduced the probability of overall crop failure.

80
5.4.2 Applicability of the de-agrarianisation thinking
From the findings, it has been established that de-agrarianisation (in Bryceson’s formulation) is
not entirely evident among the households studied. It is not a continuous process but it is an
element of an iterative/pendular process involving both de-agrarianisation and re-agrarianisation,
proving the hypothesis which guided this study correct. The only evidence which might confirm
the existence of the de-agrarianisation process is the reduction in household production during
the seasons in which there were unfavourable climatic conditions and the consequent increase in
the significance of rural non-farm and off-farm income relative to farm income. However, to
those households which had good asset ownership status there was much cultivation resilience
and good harvests.
There was no respective reduction in the time, labour and resources devoted to smallholder
farming in response to climate variability. A cultivation culture has been noted in the community
resulting in cultivation resilience which generates various coping strategies depending on natural
resource endowment and economic performance. In this vein five out of the eight households
sampled added sorghum – a drought resistant crop – to their crop portfolios to reduce risks of
drought spells, and one household shifted planting dates to early October since part of its plot
was wetland. The majority of the studied households in Nyoni village – 4 out of the 5 –
diversified their livelihood portfolios by selling water at the business centre (Chitekete) because
of the availability of wells in their area, while in Maringa 1 village only one out of the three
households studied were involved in this activity due to their location away from the area with
wells.
A qualitative analysis of the off-farm and non-farm activities in the area has suggested that about
80% of these activities provide petty income which is used for incidental uses. For example,
when a household needs some money to buy soap, cooking oil, go to the grinding mill
(Chigayo), buy salt, among others, while during the majority of the time they relied more on
farm activities (eating green produce, selling green produce and selling the dry produce. After
2000, non-farm activities were also limited to those activities that relied on one’s skill and/or
those which had a very small pay back period because of the hyperinflationary environment. As
81
the period drew closer to 2008, non-farm activities which involved buying and selling were not
evident among the smallholder farmers. Informal traders (cross border traders) came from other
areas like Harare and Bulawayo and sold food stuffs and other goods in foreign currency (field
data, 2009).
What this means is that Zimbabwe’s economy after 2000 presented a special situation which
reduced the number of non-farm activities that smallholder farmers could be involved in. HH2
shows the severe consequences of this – its diversification/de-agrarianisation strategy was
impaired by macro-economic circumstances. And this is a problem for those households who are
so poor and small that their level of agriculture remains very small. This is the reason why there
was cultivation resilience – smallholder farming during this period was the lifeblood for the
majority of the households, because at the very least they could generate in-kind income in the
form of direct consumption. The forced emphasis on agriculture in a sense represents a form of
re-agrarianisation.
5.4.3 Social differentiation/identification and the Gokwe-Kabiyuni area
Although it might not be easy to establish the impact of education among household members,
since literacy levels in general were very low, it can be noted that levels of education did not
completely disengage household members from farm-related activities. It was established that
higher unemployment rates due to the closing of industries reduced the employment
opportunities for the majority of the able-bodied household members. In some cases (in four
households) in which household members were formally employed outside the household plot,
they contributed money to improve the plot better than they would have done if they were at the
plot. This they did by sending remittances which were used to buy inputs for cultivation and
even to hire farm labour. On the other hand, they also benefited from the farm produce. This is
what has been observed by others (Dione 1989, Estudillo and Otsuka 1999, and Mohapatra et al
2005) (see Chapter 2). In this regard, rising of literacy levels and the spatial relocation of
household members were not necessarily driving or indicating a process of de-agrarianisation in
this area. It can be asserted that they contributed to the opposite, i.e. re-agrarianisation, because
the remittances sent assisted the remaining household members in terms of agricultural inputs
82
and gave them leverage in their efforts to diversify their farming activities. Alternatively, one
could say that the emerging importance of remittances repatriated from abroad did represent a
form of de-agrarianisation, but where the non-agricultural activities were by necessity located
outside of Zimbabwe’s borders; and yet, it was by virtue of the same economic processes that
compelled Zimbabweans to seek an economic footing further afield that guided the remittances
into agriculture, i.e. because the opportunities for rural off-farm economic activities were
increasingly compromised by the county’s economic crisis.
There was no noticeable improvement in the status of households which started poor: they
remained poor over the period, and ‘de-agrarianising manoeuvres’ did not necessarily help them
because of broader macro-economic problems. Those who started well-off generally prospered,
notwithstanding problems with weather fluctuations, and they did so largely through agriculture.
The reason is that the households which started better-off had an upper hand to resist the risks
posed by climatic change and the harsh economic environment, because their assets served as
safety nets, on the basis of which they were able to adapt and thrive. Does that mean that these
households managed even better than they would have in the absence of Zimbabwe’s macro-
economic situation?
5.4.4 Market structures and the de-agrarianisation thinking
The input and produce market both for livestock and crop production in the area was distorted
due to the combined impact of the location of the two villages away from Gokwe Town (the
nearest town) and the weaker negotiating position of the majority of the households, especially
after 2000. Smallholder farmers in this area did not have a strong voice to influence the trends of
the market- they were not organized in strong lobbying groups to negotiate for increase in the
selling price for their agricultural products. In fact prices were imposed upon them and because
of their position (lack of alternative markets especially for grains where the Grain Marketing
Board enjoys monopoly of the market), they accepted the terms. In addition to this, the
hyperinflationary environment meant that what was due to them when they sold their produce to
the Marketing Boards lost value in the time lag between delivery of produce and actual
83
processing of payment since processing took between one month and three months. This
confirms Freeman and Silim’s (2001) and Heinman’s (2002) observation of informational
constraints, organisational fuzziness and lack of negotiating power as the major challenges
facing smallholder agriculture. This further compromised the position of smallholder farmers
since they have to continuously dance to the tune of the market patrons, especially in the case of
contract farming. This is a clear manifestation of what the Marxists interpret as capitalist market
structures which are disadvantaging smallholder farmers in the area.
5.4.5 The livestock side of smallholder farming
Livestock is central to the livelihoods of smallholder farmers in the two villages since they
provide draught power for the fields and for those households which sell water, for milk, manure
for conservation agriculture, for generating income by providing draught power for other
households or by selling them, and for providing the household with meat. However in terms of
policy, this element of smallholder agriculture is often ignored or given little attention, evidenced
by the absence of support both from government and from the NGO sector. As mentioned in
earlier sections, this resulted in increased livestock mortality rates. Changes in climate variability
in the area do not necessarily affect the rearing of livestock, if livestock drugs and sprays were to
be provided. This is one element missing from Bryceson’s conceptualization.
84
CHAPTER 6: CONCLUSION AND RECOMMENDATIONS
This study has demonstrated that in the two villages in the Gokwe-Kabiyuni area that were
researched, namely Nyoni and Maringa 1, climate change, and spatial relocation away from
farming based livelihoods, population growth and improvement in literacy levels among
smallholder farmers in the area have not necessarily contributed to de-agrarianisation. The
following points can be distilled from the analysis:
(a) Although climate variability is evident and in some years affects crop yields in the area,
leading to an increase in the (relative) significance of off-farm and non-farm activities,
the incidences do not necessarily confirm the de-agrarianisation thinking. The evidence
reveals a process of agrarian resilience in which smallholder farmers adapt to climate
variability by diversifying into non-farm activity largely as a consequence of failure of
the farming season and/or failure of their crops to find favourable prices on the market. In
this regard, non-farm and off-farm income do not necessarily contribute a significant
percentage to the overall livelihood portfolios except during years of severe drought.
(b) Spatial relocation of people from the villages is not necessarily an indicator of de-
agrarianisation since it has been established that the members of the households studied
who moved to other places for employment do not completely disengage themselves
from the farm, but rather continue to support the system through the provision of seeds,
pesticides and cash to use for hiring labour in the fields.
(c) The non-farm activities in the area are limited and rely on the few natural resources
available in the area, for example the selling of water.
(d) Smallholder farming is diversified (i.e. crop farming mixed with livestock rearing) to
such an extent that if supported (for example by providing inputs, expert information,
providing animal drugs and improving market structures), it is able to resist effects of
climate variability.
(e) Conservation agriculture is reducing the time previously devoted to off-farm activities
and non-farm activities because of its labour intensiveness which requires early land
preparation.
85
Because of these observations, this mini-thesis recommends that rural development needs in
Sub-Saharan Africa should be viewed though a historical lens wherein experiences which shaped
the current extent of disadvantage of smallholder farmers are taken into consideration. For
example, unjust land tenure systems, unfair market regimes and inaccessibility of their areas
compromise the smallholder farmers’ ability to effectively cope with changes in the
environment. These issues should be addressed by both government and the NGO sector because
smallholder farming is still the lifeblood of the households in the area.
86
REFERENCES Arrighi, G., (1967), The Political Economy of Rhodesia, Mouton, The Hague, The Netherlands Barrett, C. B., M. Bezuneh, D. Clay, and T. Reardon. 2005. Heterogeneous constraints, Incentives and Income Diversification Strategies in Rural Africa. Quarterly Journal of International Agriculture 44 (1): 37-60 Bernstein, H., 1994, ‘Agrarian Classes in Capitalist development’, in L Sklair (ed.) Capitalism and development. Routledge, London and New York. Bernstein, H., (2004), ‘Changing before our very eyes: Agrarian Questions and the Politics of Land in Capitalism Today’ In Journal of Agrarian Change, vol 4 no 1 and 2. Bernstein, H., (2006) ‘Is there an Agrarian Question in the 21st century?’ Canadian Journal of Development Studies vol. 27, no. 4. Bryceson, D., 1997, ‘De-agrarianisation in Sub Saharan Africa: Acknowledging the inevitable,’ in D. Bryceson and V. Jamal (eds), Farewell to farms: De-agrarianisation and Employment in Africa, African Studies Center Research Series 1997/10, Ashgate: Aldershort. Byres, T., J., (2004) ‘Neo-classical Neo-populism 25 years on: Déjà vu and Deja Passe. Towards a critique’ Journal of Agrarian Change, vol 4, no. 1 and 2, 17-44. Chatora, N., 2003, ‘Ressettlement and Beneficiary Support- Settlement and Ressettlement Models in Zimbabwe’, In Delivering Land and Securing Rural Livelihoods: Post Independence Land reform and Resettlement in Zimbabwe, CASS and LTC- University of Wisconsin- Madison, USA. Cheater, A., P. (1984), Idioms of accumulation. Mambo press, Gweru, Zimbabwe. Cordell, D. D., Gregory J.W., and Peach, V., (1996), Hoe and Wage. A social History of a Circular Migration in West Africa, Boulder, CO: Westview Press. Cousins, B., Weiner, D., and Amin, N., (1992), Social Differentiation in the communal lands of Zimbabwe’, In Review of African Political Economy no 53, 5-24. Deane, D. N., 1997, climate, crops and cash: An investigation into the impact of EL NINO-SO Southern Oscillation (ENSO) forecasts on communal farmers in Zimbabwe. PhD Dissertation presented at William College, Williamstown, Massachusetts. Ellis, F., 2000, Rural Livelihoods and Diversity in Developing Countries, Oxford University Press.
87
Estudillo, J. P, A. R. Quisumbing, and K. Otsuka. 2001. ‘Income Distribution in Rice growing villages during the post green revolution periods: The Philippines case, 1985 and 1998,’ Agricultural Economics, 25:71-84. Freeman, H. A., and Silim, S. S., 2001, ‘Commercialization of smallholder irrigation: The case of Horticultural crops in the arid areas of Eastern Kenya’ in A. Sally and C. L. Abernethy (eds) Private irrigation in Sub Saharan Africa: Proceedings of regional seminar on private sector participation in irrigation expansion in Sub Saharan Africa, 22-26, Accra, Ghana, IMWI, FAO and CTA. Griffin, K., A.R. Khan and A Ickowitz, 2002, ‘Poverty and the Distribution of Land’ in Journal of Agrarian Change, 2 no 3. Gwimbi. P., (2009) Cotton farmers’ vulnerability to climate change in Gokwe District (Zimbabwe): Impact and influencing factors. JAMBA: Journal of Disaster and Risk Studies, Vol 2, no 2 November 2009: 81- 92. Hayami Y. and V. Rattan, 1985, Agricultural Development: an international perspective (revised and expanded edition) Baltimore and London: John Hopkins University Press. Heinemann, E., 2002, The role and limitations of Producer Associations: European forum for Rural Development cooperation, 4 September, Montpellier. Jansen, H. G. P., A. Rodriguez, A Damon, J. Pender, J. Chenier and R Schipper, 2006. Determinants of income earning strategies and adoption of conservation strategies in hillside communities in Rural Honduras,’ Agricultural Systems 88:92-110. Kinsey, B., H., (1999), ‘Land Reform, Growth and Equity: Emerging evidence from Zimbabwe’s,’ Journal of Southern African Studies, vol 25, no 2, 173-196. Kosim, B., (1977), ‘The Inyoka Tobacco Industry of the Shangwe people: The Displacement of the pre-colonial economy in Southern Rhodesia 1898-1938,’ In Palmer, R. and Parsons, N., (Eds) The Roots of Poverty in Central and Southern Africa, Heinemen, London. Lenin, V., I., (1973), ‘The Development of Capitalism in Russia’, vol 3 of Collected Works, Progress Publishers, Moscow, Russia. Lipton, M., F. Ellis and M. Lipton, 1996, ‘Introduction’ in M. Lipton, M. Deklerk and M. Lipton (Eds), ‘land, labor and livelihoods in Rural South Africa: Volume 1: Western Cape, Durban: Indicator Press. Marx K., 1976, Capital, vol 1, Harmondsworth: Penguin (first published 1867). Magingxa, L. and Kamara, A., 2003, Institutional perspectives of enhancing smallholder market access in South Africa, Paper presented at the 41st Annual conference of the Agricultural Economics Association of South Africa (AEASA), October 2-3, Pretoria, South Africa.
88
McAllister, P., 2000, Maize yields in the Transkei; How productive is subsistence cultivation? PLAAS occasional paper series no. 14. Cape Town: University of The Western Cape. Mohapatra, S.,S. Rozelle, and J. Huang, 2005. Climbing the Development ladder: Economic Development and the evolution of occupations in Rural China, UC Davies working paper. Moula, E. L., 2002, ‘Climate variability and farm level adaptation options: The challenges and implications for food security in Southern Cameroon’ in Environment and Development Economics 7; 529-545, Cambridge University press, UK. Neocosmos, M., 1986, Marx’s Third Class: Capitalist Landed Property and Capitalist Development. Journal of Peasant Studies, 13 (3): 5- 44. Pretorius, C.J., and Small M.M., 1992, Notes on the Macro-economic effects of the drought, Quarterly Bulletin of the Reserve Bank, June 1992:31-38. Reardon, T., J. Bedegue, Christopher B. Barret and Kostal Stamoulis, ‘Household Income Diversification unto rural nonfarm activities’, in S. Haggblade, P. Hazell and T. Reardon (Eds.), Transforming the rural non-farm economy .Baltimore: John Hopkins University Press. Rukuni, M., (2006), ‘The Evolution of Agricultural policy: 1890-1980,’ In Rukuni et al (Eds), Zimbabwe’s Agricultural Revolution Revisited (second edition), University of Zimbabwe Press, Harare. Sachikonye, L., M., (2003) ‘From Growth with Equity to Fast Track Reform: Zimbabwe’s Land Question’, Review of African Political Economy, no. 96, 227-240. Scoones, I., 1996, Crop Production in a Variable Environment: A case study from southern Zimbabwe, Development and Change, 26:67-88. Timmer C. P. 1998 ‘The Agrarian Transformation’, in C. Eicher and J. Staats (eds.), International Agricultural Development (third edition), Baltimore and London: John Hopkins University Press. Unganai, L.S., 1996, Historic and future climatic changes in Zimbabwe, Climate Research 6:137-145. UN-HABITAT 2009, Housing Finance Mechanisms in Zimbabwe. United Nations Human Settlement Programme. Nairobi. Van Seventer, DEN, Faux, CS and Van Zyl, J., 1992, An input output analysis of agribusiness in South Africa. Agrekon, 31(1):12-21. Van Zyl, J., and Vink, N., 1998, Employment and Growth in South Africa: an agrarian perspective, Development Southern Africa, 5:12-29.
89
Vink and Kirsten, 2000. Deregulation of Agricultural Marketing in South Africa: Lessons learned. The Free market Monograph no. 25, Sandton, South Africa. Wolpe, H., 1972, ‘Capitalism and cheap labour in South Africa: from Segregation to Apartheid’, Economy and society. Yaro, A. J. 2006, Is de-agrarianisation real? A study of livelihood activities in Northern Ghana: Cambridge University Press. Zimbabwe Human Development Report 2000, UNDP and Poverty Reduction Forum.
1
ANNEX: HOUSEHOLD QUESTIONNAIRE HOUSEHOLD QUESTIONAIRRE I am a student from the University of The Western Cape (Institute for Poverty, Land and Agrarian Studies), carrying out a study on smallholder farmers responses to changes in the farming environment. The study is done in partial fulfillment of the requirements of the Master of Philosophy Degree in Land and Agrarian Studies. It is therefore done solely for academic purposes. Your household has been selected to assist with information to this effect. I therefore, kindly request you to respond to the following questions. SECTION A: SOCIO-ECONOMIC DATA- Household structure over the years 1. Please indicate the status of your household in the appropriate box among the boxes provided below
(a) Father headed household 1 (b) Mother headed household 2 (c) Child headed household 3
(d) Other (Please
explain)………………………………………………………………………………………………………………………………………………………………….
2. How many people stay at this homestead? Please write your answer in the space provided below …………………………………………………………………………………………….. 3. How many members constituted your household during the time listed below? By 1990……………………………………………………………………………………. By 1995…………………………………………………………………………………….. By 2000…………………………………………………………………………………….. By 2005…………………………………………………………………………………….. By 2008…………………………………………………………………………………….. 4. Have you ever had members of your family who work outside the family farm/plot? Please indicate by filling in the appropriate box below. Yes
2
No If your answer to question 4 was no, please skip question 5 and 6 5. Please indicate the periods when you used to have a member/ members of your family working outside the family farm/ plot. ……………………………………………………………………………………………………………………………………………………………………………………………………………………………………………………………………………………………… 6. What type of jobs were they doing? Please fill in the space provided below. ……………………………………………………………………………………………………………………………………………………………………………………………………………………………………………………………………………………………………………………………………………………………………………………………………………………………………………………………………………………………… 7. What are their levels of education? ……………………………………………………………………………………………………………………………………………………………………………………………………………………………………………………………………………………………………………………………………………………………………………………………………………………………………………………………………………………………… 8. Please indicate the average number of big livestock you had at the following times in the past; By 1990…………………………………………………………………………………….. By 1995…………………………………………………………………………………….. By 2000…………………………………………………………………………………….. By 2005…………………………………………………………………………………….. By 2008…………………………………………………………………………………… 9. Are there other members of the family who stay outside the homestead? Please tick in the appropriate box below. (a)Yes 1 (b) No 2 If your answer to question 3 was ‘no’, please skip question 4

3
10. What is their occupation? Please fill in the space below (a).…………………………………………………………………………………………. (b) ………………………………………………………………………………………….. (c) ………………………………………………………………………………………….. (d) …………………………………………………………………………………………. (e) ………………………………………………………………………………………….. 11. Where do they stay? Please fill in the gape provided below (a).…………………………………………………………………………………………. (b) ………………………………………………………………………………………….. (c) ………………………………………………………………………………………….. (d) …………………………………………………………………………………………. (e) ………………………………………………………………………………………….. 12. Please list the activities which you carry out over a calendar year against the appropriate months below. For example land preparation, planting, weeding, harvesting etc. You are free to write more than one activity per month January……………………………………………………………………………………... February……………………………………………………………………………………. March………………………………………………………………………………………. April………………………………………………………………………………………... May………………………………………………………………………………………… June………………………………………………………………………………………… July…………………………………………………………………………………………. August……………………………………………………………………………………… September………………………………………………………………………………….. October…………………………………………………………………………………….. November………………………………………………………………………………….. December…………………………………………………………………………………... 13. Which activities do you carry out outside your farm area and homestead? Please list in the space provided below. (a) …………………………………………………………………………………………. (b)………………………………………………………………………………………….. (c)…………………………………………………………………………………………... 14. How do you rate your involvement in off-farm activities since 1990? Please indicate by writing the raking from 1-4 (with 1 representing the period when you were involved much in off-farm activities against the periods below 1990-1995 1996-2000
4
2001-2005 2006-2008 15. Do you receive any form of income from your relatives who are employed outside the family homestead? Please indicate your answer by ticking in the appropriate box below. Yes No 9. For what purposes do you usually use the money? Please fill in the appropriate space below Payment of school fees Buying food For medication Buying farm implements Buying clothes Hiring labor for the fields To start income generating projects To pay for a feast, burial etc SECTION B: TRENDS IN THE FARMING ENVIRONMENT 16. Please indicate the events which affected your operations on your arable land against the particular years indicated below. 1990-1995 …………………………………………………………………………………. Physical…………………………………………………………………………………………………………………………………………………………………………………………………………………………………………………………………………… Economic………………………………………………………………………………………………………………………………………………………………………………………………………………………………………………………………………… Social………………………………………………………………………………………………………………………………………………………………………………………………………………………………………………………………………………
5
Political…………………………………………………………………………………………………………………………………………………………………………………………………………………………………………………………………………… 1996- 1999………………………………………………………………………………….
Physical…………………………………………………………………………………………………………………………………………………………………………………………………………………………………………………………………………… Economic………………………………………………………………………………………………………………………………………………………………………………………………………………………………………………………………………… Social……………………………………………………………………………………………………………………………………………………………………………………………………………………………………………………………………………… Political…………………………………………………………………………………………………………………………………………………………………………………………………………………………………………………………………………… 2000-2005…………………………………………………………………………………..
Physical…………………………………………………………………………………………………………………………………………………………………………………………………………………………………………………………………………… Economic………………………………………………………………………………………………………………………………………………………………………………………………………………………………………………………………………… Social……………………………………………………………………………………………………………………………………………………………………………………………………………………………………………………………………………… Political…………………………………………………………………………………………………………………………………………………………………………………………………………………………………………………………………………… 2006-2008…………………………………………………………………………………..
Physical…………………………………………………………………………………………………………………………………………………………………………………………………………………………………………………………………………… Economic………………………………………………………………………………………………………………………………………………………………………………………………………………………………………………………………………… Social……………………………………………………………………………………………………………………………………………………………………………………………………………………………………………………………………………… Political……………………………………………………………………………………………………………………………………………………………………………………………………………………………………………………………………………
6
17. Please indicate how much of each crop you harvested (on average) per year during the following periods. Please write down the name of the crop and the quantity in bags, bales etc. 1990-1995 Crop no 1…………………………………………………………………………………… Crop no 2…………………………………………………………………………………… Crop no 3…………………………………………………………………………………… Crop no 4…………………………………………………………………………………… Crop no 5…………………………………………………………………………………… Crop no 6…………………………………………………………………………………… Crop no 7…………………………………………………………………………………… 1992-1999 Crop no 1…………………………………………………………………………………… Crop no 2…………………………………………………………………………………… Crop no 3…………………………………………………………………………………… Crop no 4…………………………………………………………………………………… Crop no 5…………………………………………………………………………………… Crop no 6…………………………………………………………………………………… Crop no 7…………………………………………………………………………………… 2000-2005 Crop no 1…………………………………………………………………………………… Crop no 2…………………………………………………………………………………… Crop no 3…………………………………………………………………………………… Crop no 4…………………………………………………………………………………… Crop no 5…………………………………………………………………………………… Crop no 6…………………………………………………………………………………… Crop no 7…………………………………………………………………………………… 2006-2008 Crop no 1…………………………………………………………………………………… Crop no 2…………………………………………………………………………………… Crop no 3…………………………………………………………………………………… Crop no 4…………………………………………………………………………………… Crop no 5…………………………………………………………………………………… Crop no 6…………………………………………………………………………………… Crop no 7…………………………………………………………………………………… 18. For each crop that you cultivate/cultivated, please indicate the distance between your homestead and the marketing depot. Crop no 1…………………………………………………………………………………… Crop no 2…………………………………………………………………………………… Crop no 3……………………………………………………………………………………

7
Crop no 4…………………………………………………………………………………… Crop no 5…………………………………………………………………………………… Crop no 6…………………………………………………………………………………… Crop no 7…………………………………………………………………………………… 19. When were the depots established? Please fill in the space provided below. ………………………………………………………………………………………………