smaller harvests: korea’s citrus industry continues to ... gain publications/citrus...citrus...
TRANSCRIPT

THIS REPORT CONTAINS ASSESSMENTS OF COMMODITY AND TRADE ISSUES MADE BY
USDA STAFF AND NOT NECESSARILY STATEMENTS OF OFFICIAL U.S. GOVERNMENT
POLICY
Date:
GAIN Report Number:
Approved By:
Prepared By:
Report Highlights:
Citrus production in Marketing Year (MY) 2017/2018 is projected to continue a multi-year decrease to 560,000 MT, the lowest production level for the past two decades. Although open field tangerines still make up 75% of the crop, the quantity grown in open fields is expected to decrease, while the number of late-grown and greenhouse grown varieties are anticipated to increase. Due to lower production numbers and increased competition from imported fruit, consumption of the domestic crop is also expected to decrease to 508,000 MT. Imports of oranges are also forecast to fall by 13,000 MT, to 130,000 MT due to lower production numbers in the United States.
Sunyoung Choi / Amanda F. Hinkle
Ronald P. Verdonk
Smaller Harvests: Korea’s citrus industry continues to decrease
in size
Citrus Annual
Korea - Republic of
KS1746
12/15/2017
Required Report - public distribution

Production
In Marketing Year (MY) 2017/18 (October – September), Korea’s total citrus production is forecast at 560,000
tons, about 6.7 percent lower than the 600,000 tons produced in MY 2016/17. The reduction is mainly due to 1)
lower estimated number of fruits per tree by a cyclical “high-low” production pattern of fresh tangerine in open
field area, which covers almost 75 percent of total citrus production in Korea and 2) the increase of damaged
fruit and fallen fruit caused by unfavorable weather during the fruit growing period. Unfavorable weather that
can affect production includes long hot days during the summer (with heat waves and tropical nights) and heavy
rainfall during the early fruit ripening period.
Open Field Tangerine
The Korean citrus industry forecasts the lowest production ever at 420,000 metric tons (MT) of open field
tangerines (also known as “Unshu” oranges) for MY 2017/18, which is about ten percent lower than the 466,817
MT in MY 2016/17. This decrease is projected based on findings of about a 20 percent reduction in the number
of fruits per tree during the final survey done by the Jeju citrus industry in the middle of November, right before
the main harvest season. The Jeju citrus industry accounts for more than 99 percent of fresh citrus production
in Korea, and thus, their findings are indicative of the entire industry. In addition, as a result of extremely hot
summer weather (with heat waves and tropical nights) during the tangerine growing season in July and August
and strong rainfall after the hot weather, many tangerine farms suffered from a high ratio of heat damaged
fruits and a high percentage of fallen fruit. However, the Jeju tangerine industry forecasts the quality of
2017/18 fruits will be better and will have a higher Brix level (sugar content) than the previous marketing year
because of ample sunshine during the main fruit ripening period through the harvest season into late November.
In general, Korea’s open field tangerines are harvested from early October through December and marketed by
the end of February. Meanwhile, the remainder of citrus products, including winter “Unshu” oranges, late
varieties and heated greenhouse tangerines are produced in quantities of about between 120,000 MT - 130,000
MT each year.
Late Varieties, winter “Unshu” and Greenhouse tangerine
In MY 2017/18, the remainder of citrus production (citrus that is not open field tangerine production) including
late variety citrus, heated greenhouse tangerines and winter “Unshu” oranges are forecast at 140,000 MT, about
5.4 percent higher from the previous marketing year mainly due to the increasing planted area for late varieties,
including winter “Unshu” oranges, which have had strong consumer demand in recent years. Late varieties are
marketed mainly during the January – March period and generally compete with U.S. navel oranges and
domestic fresh strawberries, since the marketing seasons overlap. In addition, more open field tangerine farms
switched their citrus production to protected facility farming, which is essential for late varieties and winter
“Unshu” orange production. Production of late varieties and winter “Unshu” oranges, which are recognized as

high value added fruits by Korean consumers, increased by 138 percent to 111,165 MT over the past decade,
while production of open field tangerines decreased by 31 percent to 466,817 MT.
To ensure some supply of Jeju tangerines year round, about 21,000 tons of fresh tangerines are produced in
heated greenhouses and are marketed mainly between May and early October, until the kick-off of the open
field tangerine season. In MY 2017/18, heated greenhouse tangerine production is forecast at 22,000 MT with a
slightly increased planted area.
Revision of Marketable Tangerine Category
As a result of increased tangerine quality in recent years (with a higher Brix (sugar) level than several years ago),
the Jeju citrus industry strongly pursued a revision to the marketable tangerine category, which had been
classified only by the size of fruits since 1997. The old provincial ordinance specified that if the size of a
tangerine was too small (less than 49 mm in diameter) or too big (bigger than 70 mm in diameter), they were
classified as non-marketable fruit and were prohibited for sale outside of Jeju island to maintain the proper
quality of Jeju tangerines. However, the Jeju provincial government revised its provincial ordinance in June 2017
to allow any tangerines to be sold if they reach a level of 10 or higher on the Brix (sugar) scale, regardless of size.
Planted Area
In MY 2017/18, Korea’s total planted area for citrus is forecast at 20,333 hectares (ha), about 0.8 percent lower
from the previous marketing year, attributable to alternative land use, especially commercial and residential
development, as well as an aging farmer population. Meanwhile, the planted area for winter “Unshu” oranges
and other late varieties is forecast to increase consistently under a provincial FTA facility support program. The
FTA facility support program was introduced in 2004 to support citrus growers by reducing production costs and
increasing productivity. The Jeju citrus industry also determined that in order to meet the increased consumer
demand for high quality citrus, more open field farm should switch to more value-added citrus production by
using protected facility farming to grow late varieties and winter “Unshu” oranges.
Total tangerine planted area continues to decline since it peaked at 26,500 ha in MY 1999/2000. Planted area
has declined in response to a decrease in demand following increased competition from other fruits as a result
of many FTAs. Consumer demand has also shifted toward imported tropical and subtropical fruits after
consumers have been able to sample and taste new types of fruit during overseas travel. In MY 2016/17, about
31,000 Jeju farms were involved in tangerine farming on 20,491 ha and of that total area, about 82 percent
(16,784 ha) is open field tangerine area.
In MY 2016/17, planted area for open field tangerines decreased 1.4 percent to 16,376 ha due to a shift to
protected facility farming of winter “Unshu” or later varieties for better agricultural income. Furthermore, the
reduced yield rate in MY 2017/18 due to unfavorable weather conditions such as a longer hot weather in
summer season and above average rainfall during the ripening period caused a high ratio of fruit drop and heat
damaged fruits.
Consumption
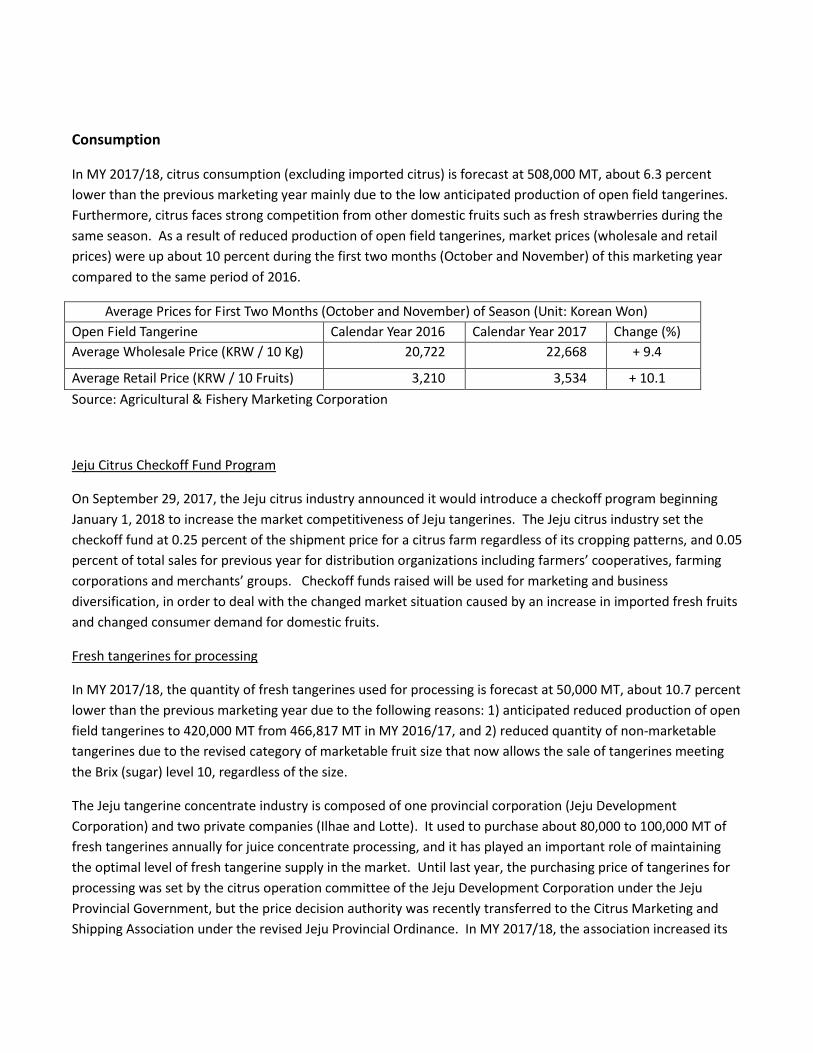
In MY 2017/18, citrus consumption (excluding imported citrus) is forecast at 508,000 MT, about 6.3 percent
lower than the previous marketing year mainly due to the low anticipated production of open field tangerines.
Furthermore, citrus faces strong competition from other domestic fruits such as fresh strawberries during the
same season. As a result of reduced production of open field tangerines, market prices (wholesale and retail
prices) were up about 10 percent during the first two months (October and November) of this marketing year
compared to the same period of 2016.
Average Prices for First Two Months (October and November) of Season (Unit: Korean Won)
Open Field Tangerine Calendar Year 2016 Calendar Year 2017 Change (%)
Average Wholesale Price (KRW / 10 Kg) 20,722 22,668 + 9.4
Average Retail Price (KRW / 10 Fruits) 3,210 3,534 + 10.1
Source: Agricultural & Fishery Marketing Corporation
Jeju Citrus Checkoff Fund Program
On September 29, 2017, the Jeju citrus industry announced it would introduce a checkoff program beginning
January 1, 2018 to increase the market competitiveness of Jeju tangerines. The Jeju citrus industry set the
checkoff fund at 0.25 percent of the shipment price for a citrus farm regardless of its cropping patterns, and 0.05
percent of total sales for previous year for distribution organizations including farmers’ cooperatives, farming
corporations and merchants’ groups. Checkoff funds raised will be used for marketing and business
diversification, in order to deal with the changed market situation caused by an increase in imported fresh fruits
and changed consumer demand for domestic fruits.
Fresh tangerines for processing
In MY 2017/18, the quantity of fresh tangerines used for processing is forecast at 50,000 MT, about 10.7 percent
lower than the previous marketing year due to the following reasons: 1) anticipated reduced production of open
field tangerines to 420,000 MT from 466,817 MT in MY 2016/17, and 2) reduced quantity of non-marketable
tangerines due to the revised category of marketable fruit size that now allows the sale of tangerines meeting
the Brix (sugar) level 10, regardless of the size.
The Jeju tangerine concentrate industry is composed of one provincial corporation (Jeju Development
Corporation) and two private companies (Ilhae and Lotte). It used to purchase about 80,000 to 100,000 MT of
fresh tangerines annually for juice concentrate processing, and it has played an important role of maintaining
the optimal level of fresh tangerine supply in the market. Until last year, the purchasing price of tangerines for
processing was set by the citrus operation committee of the Jeju Development Corporation under the Jeju
Provincial Government, but the price decision authority was recently transferred to the Citrus Marketing and
Shipping Association under the revised Jeju Provincial Ordinance. In MY 2017/18, the association increased its
purchasing price to 180 Korean won per kilogram, which consists of 120 Korean won from processors and 60
Korean won from a subsidy from the Jeju provincial government. The purchasing price has been 160 Korean
won for the past five years, since MY 2012/13.
Trade
Orange
In Marketing Year (MY) 2017/18, Korea’s orange imports are forecast to be 130,000 MT, which amounts to an
approximately 13,000 MT decrease from the previous marketing year. An anticipated reduction of orange
production in California will be the main cause for the decline. In MY 2016/17, U.S. oranges, which have a
favorable FTA duty rate and a consistent quality, dominated the Korean orange market with 93.4 percent share,
followed by South African (2.5 percent) and Spanish (1.8 percent) fruits. Korean orange importers estimate
more than 60 percent of imported oranges (navels) have a high sugar content that appealed strongly to Korean
consumers to be eaten as dessert fruits. High sugar content is one of the main factors used by Korean
consumers in recent years in choosing fruit.
In general, Korea imports the majority of fresh oranges (about 88 percent) during the February to May period,
mainly due to the FTA seasonal duty rate (five percent in 2017 and zero percent in 2018) for California navel
oranges under the KOREA-US FTA, which applies during the March 1 – August 31 period. A 50 percent duty rate
is applied for the rest of the year (September 1 – February 28). The Korean fruit industry asserts that U.S. navel
oranges compete with various domestically produced fruits, such as strawberries, winter “Unshu” oranges, late
variety tangerines, and imported table grapes from Chile during this period.
Lemon & Grapefruit
As a result of the increasing size of the squeezed juice market for the past several years in Korea due to the
concern of many Korean consumers about their health, U.S. fresh lemons also gained ground in the Korean
market with 78.2 percent share in MY 2016/17, followed by Chile with 21 percent. However, U.S. grapefruit
imports declined 20 percent to 10,597 MT in MY 2016/17 from MY 2015/16 at 13,224 MT due to reduced
production in Florida caused by citrus greening and the damage by hurricane “Irma” in September 2017.
Damage from “Irma” is expected to continue to influence Florida grapefruit production in coming years.
Exports
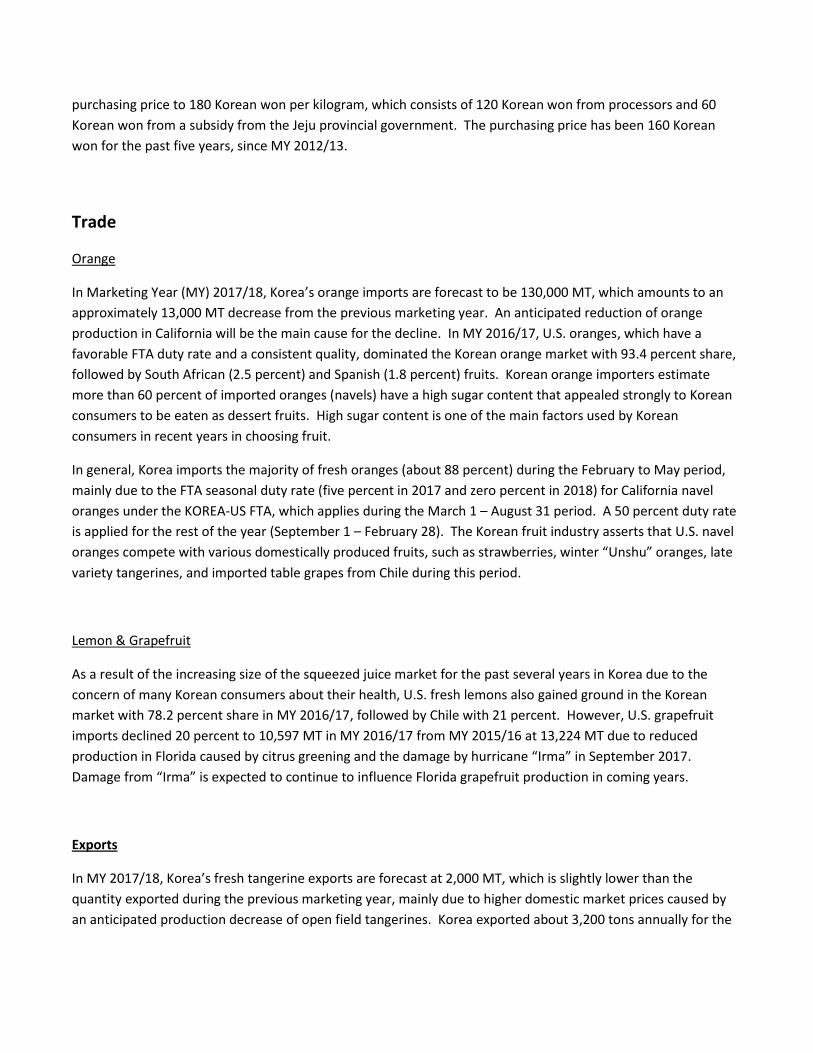
In MY 2017/18, Korea’s fresh tangerine exports are forecast at 2,000 MT, which is slightly lower than the
quantity exported during the previous marketing year, mainly due to higher domestic market prices caused by
an anticipated production decrease of open field tangerines. Korea exported about 3,200 tons annually for the
past three years, but exports in the current marketing year are expected to decline to around 2,000 tons as a
result of reduced production and higher domestic market prices than export prices.
Every year, 99.5 percent of Korea’s fresh tangerines are consumed through the markets (island and mainland),
direct sales, and through supplies for the military service. The remaining 0.5 percent is exported. However, not
many tangerine farms are interested in the export market for a couple of reasons, including: 1) lower export
price than domestic price, and 2) the difficulty of exporting product with skins that are perishable during a long
shipment period and because the product requires extra care to meet import requirements of importing
countries.
Unit Price Comparison Between Domestic Wholesale Price and Export Price (Unit: US Dollar)
Open Field Tangerine CY 2014 CY 2015 CY 2016
Domestic Wholesale Price (USD) per 1 Kilogram 1.94 1.66 1.83
Export Price (USD) per 1 Kilogram (FOB Price) 1.34 1.20 1.16
Source: Agricultural & Fishery Marketing Corporation
Revised Tangerine Export Protocol for European Union
On August 15, 2017, the Korean Animal and Plant Quarantine Agency (APQA) announced guideline export
requirements for Korean citrus sent to the European Union. The guideline will enable Korean citrus to be
exported to European Union member countries with a unified export requirement that specifies the
management of export fruit packing centers, citrus farm quarantine for exports, disinfection of fruit after the
harvest, and export quarantine inspection by Korean government quarantine officers.
Frozen Concentrated Orange Juice (FCOJ)
As a result of increased consumer demand for health-oriented foods for the past several years, the processed
fruit juice market has declined gradually. The market popularity of orange juice, which is recognized as a
representative fruit juice drink, demonstrates an overall downward trend over the past five to six years.
However, squeezed fruit juices, including fresh lemons and grapefruits are increasingly in demand. Korea’s fruit

juice drink market has been struggling in recent years mainly due to increased coffee specialty shops and fresh
fruit juice shops. Meanwhile, various functional drinks including ginseng, sports drinks and vitamin drinks
showed sales increases in MY 2016/17. Diversified consumer demand for fruit juice other than conventional
fruit juice (orange, grape and apple) led to increased imports of grapefruit and lemons in recent years.
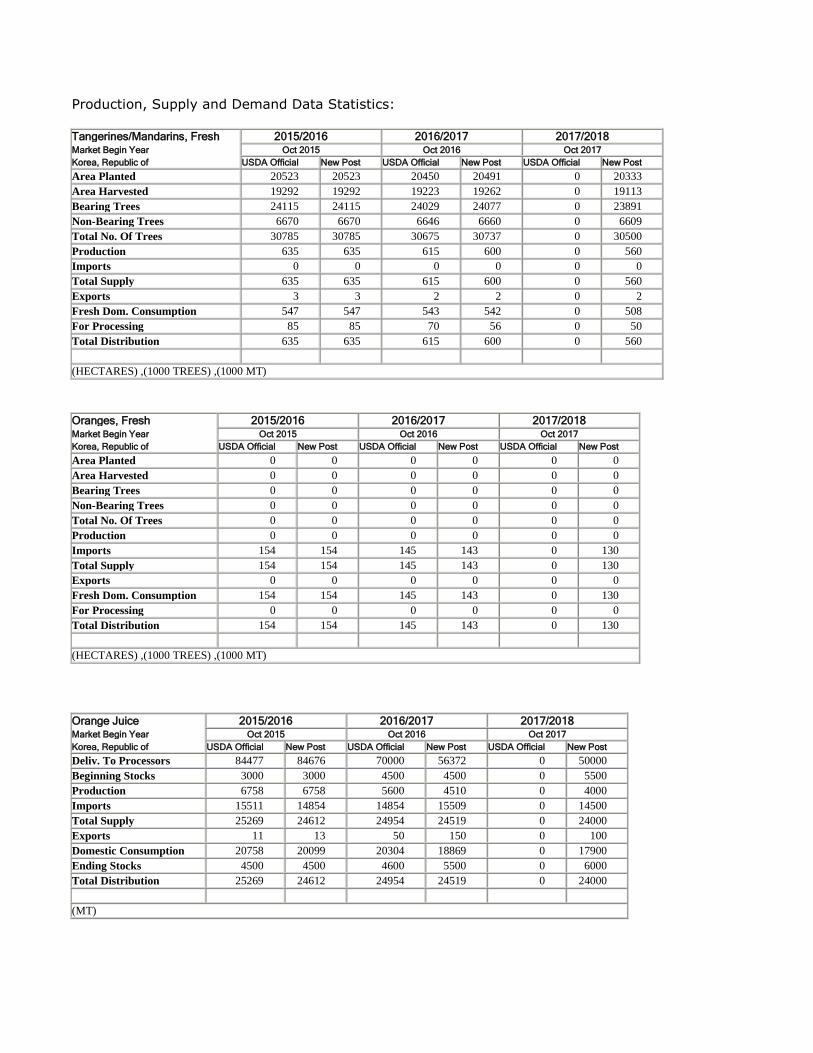
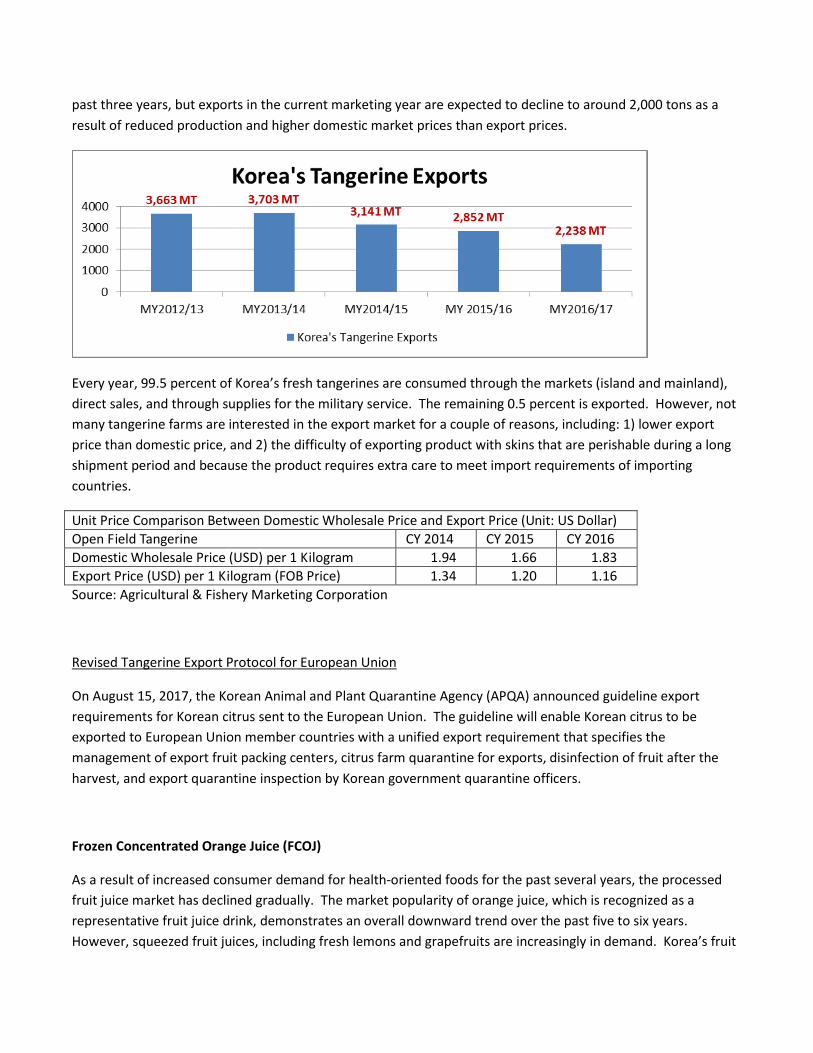
Production, Supply and Demand Data Statistics:
Tangerines/Mandarins, Fresh 2015/2016 2016/2017 2017/2018 Market Begin Year Oct 2015 Oct 2016 Oct 2017
Korea, Republic of USDA Official New Post USDA Official New Post USDA Official New Post
Area Planted 20523 20523 20450 20491 0 20333
Area Harvested 19292 19292 19223 19262 0 19113
Bearing Trees 24115 24115 24029 24077 0 23891
Non-Bearing Trees 6670 6670 6646 6660 0 6609
Total No. Of Trees 30785 30785 30675 30737 0 30500
Production 635 635 615 600 0 560
Imports 0 0 0 0 0 0
Total Supply 635 635 615 600 0 560
Exports 3 3 2 2 0 2
Fresh Dom. Consumption 547 547 543 542 0 508
For Processing 85 85 70 56 0 50
Total Distribution 635 635 615 600 0 560
(HECTARES) ,(1000 TREES) ,(1000 MT)
Oranges, Fresh 2015/2016 2016/2017 2017/2018 Market Begin Year Oct 2015 Oct 2016 Oct 2017
Korea, Republic of USDA Official New Post USDA Official New Post USDA Official New Post
Area Planted 0 0 0 0 0 0
Area Harvested 0 0 0 0 0 0
Bearing Trees 0 0 0 0 0 0
Non-Bearing Trees 0 0 0 0 0 0
Total No. Of Trees 0 0 0 0 0 0
Production 0 0 0 0 0 0
Imports 154 154 145 143 0 130
Total Supply 154 154 145 143 0 130
Exports 0 0 0 0 0 0
Fresh Dom. Consumption 154 154 145 143 0 130
For Processing 0 0 0 0 0 0
Total Distribution 154 154 145 143 0 130
(HECTARES) ,(1000 TREES) ,(1000 MT)
Orange Juice 2015/2016 2016/2017 2017/2018 Market Begin Year Oct 2015 Oct 2016 Oct 2017
Korea, Republic of USDA Official New Post USDA Official New Post USDA Official New Post
Deliv. To Processors 84477 84676 70000 56372 0 50000
Beginning Stocks 3000 3000 4500 4500 0 5500
Production 6758 6758 5600 4510 0 4000
Imports 15511 14854 14854 15509 0 14500
Total Supply 25269 24612 24954 24519 0 24000
Exports 11 13 50 150 0 100
Domestic Consumption 20758 20099 20304 18869 0 17900
Ending Stocks 4500 4500 4600 5500 0 6000
Total Distribution 25269 24612 24954 24519 0 24000
(MT)
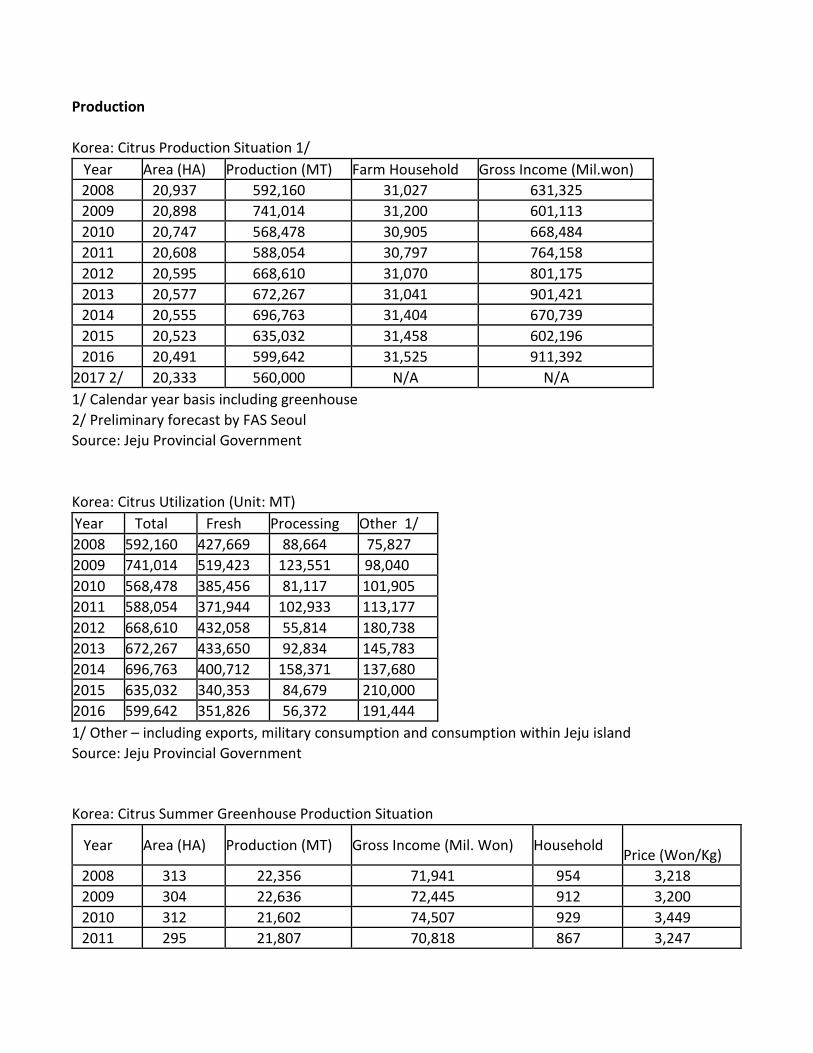
Production
Korea: Citrus Production Situation 1/
Year Area (HA) Production (MT) Farm Household Gross Income (Mil.won)
2008 20,937 592,160 31,027 631,325
2009 20,898 741,014 31,200 601,113
2010 20,747 568,478 30,905 668,484
2011 20,608 588,054 30,797 764,158
2012 20,595 668,610 31,070 801,175
2013 20,577 672,267 31,041 901,421
2014 20,555 696,763 31,404 670,739
2015 20,523 635,032 31,458 602,196
2016 20,491 599,642 31,525 911,392
2017 2/ 20,333 560,000 N/A N/A
1/ Calendar year basis including greenhouse
2/ Preliminary forecast by FAS Seoul
Source: Jeju Provincial Government
Korea: Citrus Utilization (Unit: MT)
Year Total Fresh Processing Other 1/
2008 592,160 427,669 88,664 75,827
2009 741,014 519,423 123,551 98,040
2010 568,478 385,456 81,117 101,905
2011 588,054 371,944 102,933 113,177
2012 668,610 432,058 55,814 180,738
2013 672,267 433,650 92,834 145,783
2014 696,763 400,712 158,371 137,680
2015 635,032 340,353 84,679 210,000
2016 599,642 351,826 56,372 191,444
1/ Other – including exports, military consumption and consumption within Jeju island
Source: Jeju Provincial Government
Korea: Citrus Summer Greenhouse Production Situation
Year Area (HA) Production (MT) Gross Income (Mil. Won) Household
Price (Won/Kg)
2008 313 22,356 71,941 954 3,218
2009 304 22,636 72,445 912 3,200
2010 312 21,602 74,507 929 3,449
2011 295 21,807 70,818 867 3,247
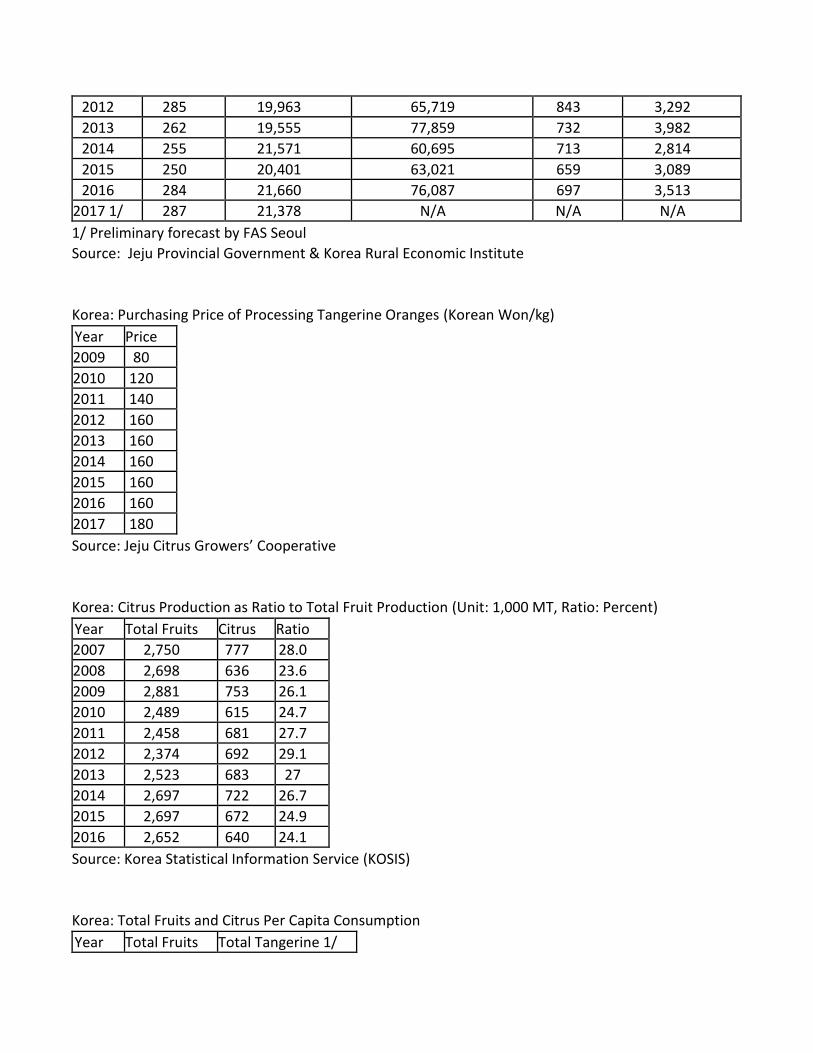
2012 285 19,963 65,719 843 3,292
2013 262 19,555 77,859 732 3,982
2014 255 21,571 60,695 713 2,814
2015 250 20,401 63,021 659 3,089
2016 284 21,660 76,087 697 3,513
2017 1/ 287 21,378 N/A N/A N/A
1/ Preliminary forecast by FAS Seoul
Source: Jeju Provincial Government & Korea Rural Economic Institute
Korea: Purchasing Price of Processing Tangerine Oranges (Korean Won/kg)
Year Price
2009 80
2010 120
2011 140
2012 160
2013 160
2014 160
2015 160
2016 160
2017 180
Source: Jeju Citrus Growers’ Cooperative
Korea: Citrus Production as Ratio to Total Fruit Production (Unit: 1,000 MT, Ratio: Percent)
Year Total Fruits Citrus Ratio
2007 2,750 777 28.0
2008 2,698 636 23.6
2009 2,881 753 26.1
2010 2,489 615 24.7
2011 2,458 681 27.7
2012 2,374 692 29.1
2013 2,523 683 27
2014 2,697 722 26.7
2015 2,697 672 24.9
2016 2,652 640 24.1
Source: Korea Statistical Information Service (KOSIS)
Korea: Total Fruits and Citrus Per Capita Consumption
Year Total Fruits Total Tangerine 1/

2008 65.5 Kg 13.0 Kg
2009 67.7 Kg 15.4 Kg
2010 62.4 Kg 12.6 Kg
2011 62.4 Kg 13.6 kg
2012 61.8 Kg 13.8 Kg
2013 63.2 Kg 13.5 Kg
2014 66.5 Kg 14.3 Kg
2015 66.7 Kg 13.2 Kg
2016 63.6 Kg 13 Kg
1/Including imported oranges
Source: Ministry for Food, Agriculture, Forestry, and Fisheries
Tariff
Korea: Import Quota and Tariff for Fresh Orange (Unit: MT, %)
Year Quota In-quota Tariff Out-quota Tariff
2004 57,017 50 50
2015 57,017 50 50
2016 57,017 50 50
2017 57,017 50 50
2018 57,017 50 50
Korea: Import Quota and Tariff for Other Citrus (Unit: MT, %)
Year Quota In-quota Tariff Out-quota Tariff
2004 2,097 50 144
2015 2,097 50 144
2016 2,097 50 144
2017 2,097 50 144
2018 2,097 50 144
1/ HS 0805.20.1000, HS 0805.20.9000, HS0805.50.2020, HS 0805.90.0000
Import Quota under the KORUS FTA (Unit: MT, %)
HSK 10 Description Base Rate 2016 2017 2018
0805100000
Oranges
March1 – end Aug 50 10 5 Zero
Sept 1 – end Feb
TRQ (MT) 2,814 2,898 2,985
In-quota Rate 0 0 0
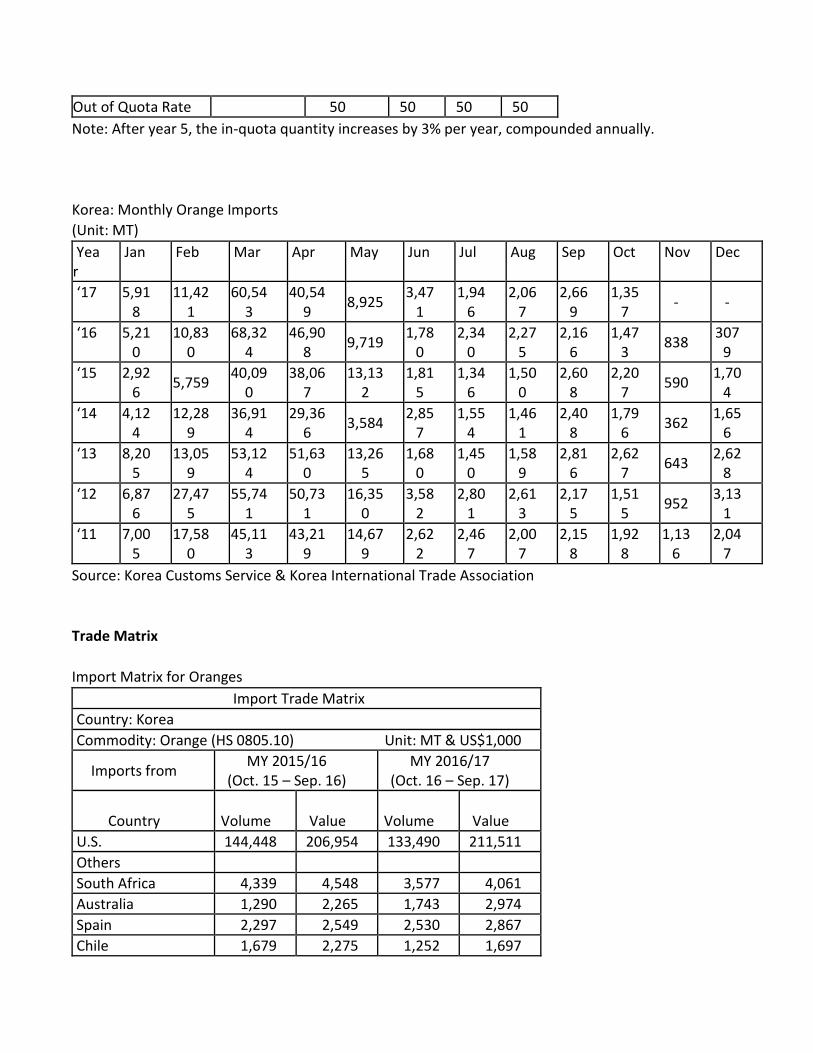
Out of Quota Rate 50 50 50 50
Note: After year 5, the in-quota quantity increases by 3% per year, compounded annually.
Korea: Monthly Orange Imports
(Unit: MT)
Year
Jan Feb Mar Apr May Jun Jul Aug Sep Oct Nov Dec
‘17 5,918
11,421
60,543
40,549
8,925 3,47
1 1,94
6 2,06
7 2,66
9 1,35
7 - -
‘16 5,210
10,830
68,324
46,908
9,719 1,78
0 2,34
0 2,27
5 2,16
6 1,47
3 838
3079
‘15 2,926
5,759 40,09
0 38,06
7 13,13
2 1,81
5 1,34
6 1,50
0 2,60
8 2,20
7 590
1,704
‘14 4,124
12,289
36,914
29,366
3,584 2,85
7 1,55
4 1,46
1 2,40
8 1,79
6 362
1,656
‘13 8,205
13,059
53,124
51,630
13,265
1,680
1,450
1,589
2,816
2,627
643 2,62
8
‘12 6,876
27,475
55,741
50,731
16,350
3,582
2,801
2,613
2,175
1,515
952 3,13
1
‘11 7,005
17,580
45,113
43,219
14,679
2,622
2,467
2,007
2,158
1,928
1,136
2,047
Source: Korea Customs Service & Korea International Trade Association
Trade Matrix
Import Matrix for Oranges
Import Trade Matrix
Country: Korea
Commodity: Orange (HS 0805.10) Unit: MT & US$1,000
Imports from MY 2015/16
(Oct. 15 – Sep. 16) MY 2016/17
(Oct. 16 – Sep. 17)
Country
Volume
Value
Volume
Value
U.S. 144,448 206,954 133,490 211,511
Others
South Africa 4,339 4,548 3,577 4,061
Australia 1,290 2,265 1,743 2,974
Spain 2,297 2,549 2,530 2,867
Chile 1,679 2,275 1,252 1,697

Other
308 309
Total for Others 9,605 11,637 9,410 11,908
Grand Total 154,043 218,591 142,900 223,419
Source: Korea International Trade Association
Import Matrix for Lemon
Import Trade Matrix
Country: Korea
Commodity: Lemon (0805.50.10) Unit: MT & US$1,000
Imports from MY 2015/16 (Oct. 15 – Sep. 16)
MY 2016/17 (Oct. 16 – Sep. 17)
Country Volume Value Volume Value
U.S. 12,006 28,134 12,427 31,064
Others
Chile 1,994 4,246 3,452 7,857
Other 3 30 11 23
Total for Others 1,997 4,277 3,463 7,880
Grand Total 14,003 32,410 15,890 38,944
Source: Korea International Trade Association
Import Matrix for Grapefruit
Import Trade Matrix
Country: Korea
Commodity: Grapefruit (0805.40) Unit: MT & US$1,000
Imports from MY 2015/16 (Oct. 15 – Sep. 16)
MY 2016/17 (Oct. 16 – Sep. 17)
Country Volume Value Volume Value
U.S. 13,224 18,369 10,597 15,630
Others
Israel 3,223 3,595 2,573 3,019
S. Africa 8,662 10,583 9,428 11,255
Mexico 11 15 0 0
Total for Others 11,896 14,193 12,001 14,274

Grand Total 25,119 32,562 22,598 29,904
Source: Korea International Trade Association
Export Matrix for Korean Tangerines
Export Trade Matrix
Country: Korea
Commodity: Tangerine (HS 0805.20.10/20/90) Unit: MT & US$1,000
Exports to MY 2015/16 (Oct. 15 – Sep. 16)
MY 2016/17 (Oct. 16 – Sep. 17)
Country Volume Value Volume Value
U.S. 491 685 412 582
Others
Russia 412 339 481 333
Canada 953 815 740 645
Japan 0 0 0 0
Hong Kong 149 270 149 228
Guam 90 181 62 96
Indonesia 12 27 0 2
Malaysia 3 16 60 61
United Kingdom 342 545 0 0
Mongolia 157 179 71 78
Singapore 185 277 186 259
Others 58 135 77 85
Total for Others 2,361 2,784 1,826 1,787
Grand Total 2,852 3,469 2,238 2,369
Source: Korea International Trade Association
Import Matrix for FOJC
Import Trade Matrix
Country: Korea
Commodity: FOJC (2009.11/12/19) Unit: MT & US$1,000
Imports from MY 2015/16 (Oct. 15 – Sep. 16)
MY 2016/17 (Oct. 17 – Sep. 17)
Country Volume Value Volume Value
U.S. 6,561 16,475 8,099 26,592
Others

Spain 1,826 2,724 4,103 9,180
Turkey 160 555 155 498
Brazil 4,333 8,042 1,021 2,041
Australia 812 1,199 642 1,080
Israel 69 133 99 220
Greece 230 290 350 422
Canada 18 74 0 0
U.K. 8 18 0 0
Taiwan 45 145 170 449
Italy 84 200 54 167
Other 708 1,144 816 1,430
Total for Others 8,293 14,524 7,410 15,487
Grand Total 14,854 30,999 15,509 42,079
Source: Korea International Trade Association
Export Matrix for FOJC
Export Trade Matrix
Country: Korea
Commodity: FOJC (2009.11/12/19) Unit: MT & US$1,000
Exports to MY 2015/16 (Oct. 15 – Sep. 16)
MY 2016/17 (Oct. 16 – Sep. 17)
Country Volume Value Volume Value
U.S. 2 2 19 19
Others
Japan 0 0 0 0
Netherland 0 0 0 0
Israel 0 0 0 0
PRC 1 3 54 58
Denmark 0 0 0 0
Singapore 0 0 0 0
Hong Kong 4 6 12 12
Canada 0 0 0 0
Philippines 0 0 0 0
Mongolia 2 6 45 98
Greece 0 0 0 0
Other 4 5 1 40
Total for Others 11 20 131 226
Grand Total 13 22 150 245
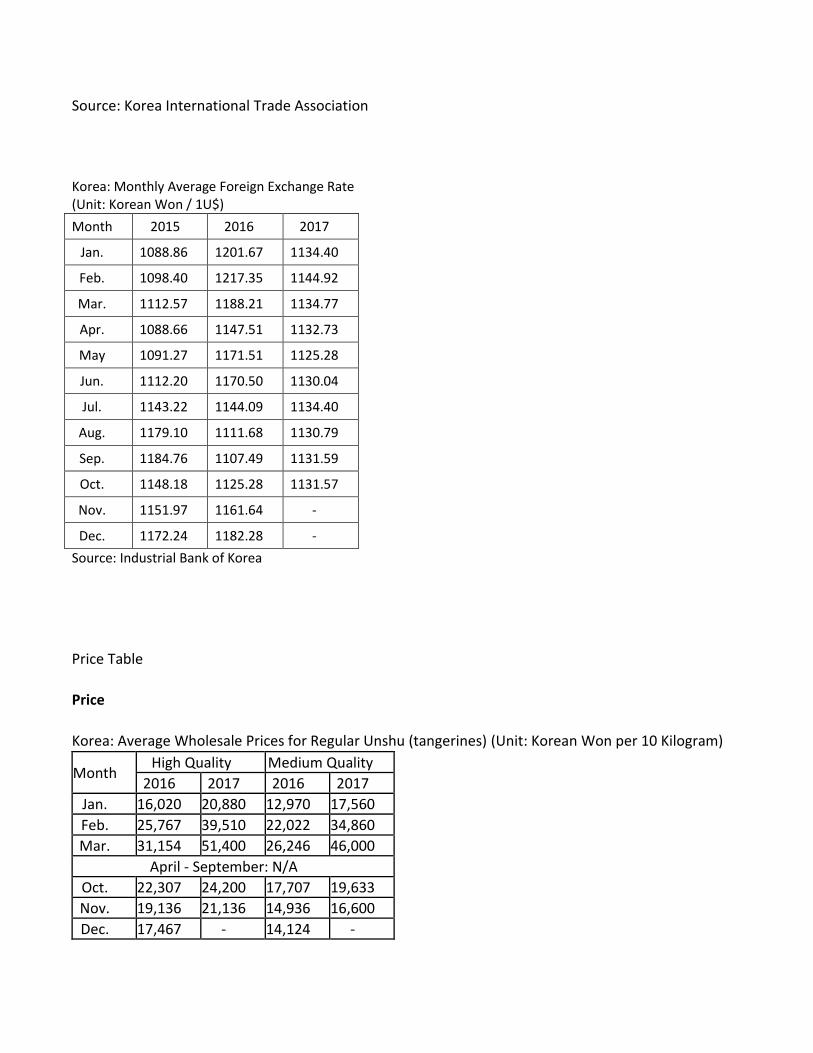
Source: Korea International Trade Association
Korea: Monthly Average Foreign Exchange Rate (Unit: Korean Won / 1U$)
Month 2015 2016 2017
Jan. 1088.86 1201.67 1134.40
Feb. 1098.40 1217.35 1144.92
Mar. 1112.57 1188.21 1134.77
Apr. 1088.66 1147.51 1132.73
May 1091.27 1171.51 1125.28
Jun. 1112.20 1170.50 1130.04
Jul. 1143.22 1144.09 1134.40
Aug. 1179.10 1111.68 1130.79
Sep. 1184.76 1107.49 1131.59
Oct. 1148.18 1125.28 1131.57
Nov. 1151.97 1161.64 -
Dec. 1172.24 1182.28 -
Source: Industrial Bank of Korea
Price Table
Price
Korea: Average Wholesale Prices for Regular Unshu (tangerines) (Unit: Korean Won per 10 Kilogram)
Month High Quality Medium Quality
2016 2017 2016 2017
Jan. 16,020 20,880 12,970 17,560
Feb. 25,767 39,510 22,022 34,860
Mar. 31,154 51,400 26,246 46,000
April - September: N/A
Oct. 22,307 24,200 17,707 19,633
Nov. 19,136 21,136 14,936 16,600
Dec. 17,467 - 14,124 -
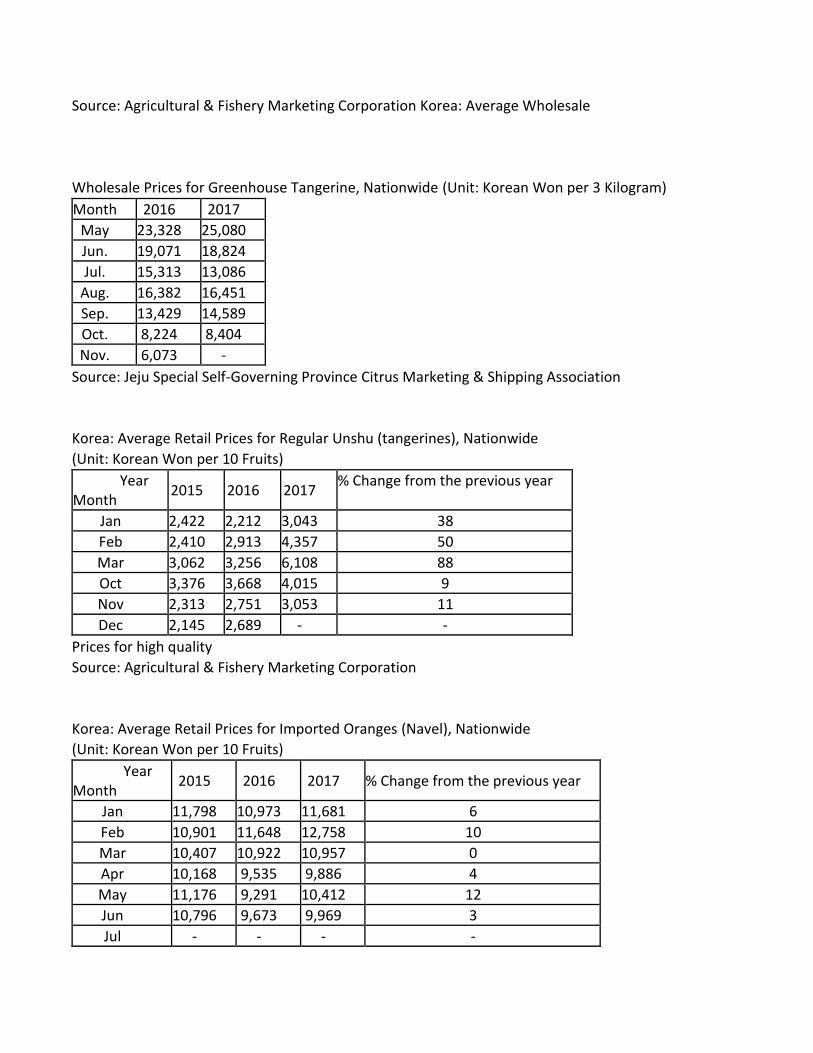
Source: Agricultural & Fishery Marketing Corporation Korea: Average Wholesale
Wholesale Prices for Greenhouse Tangerine, Nationwide (Unit: Korean Won per 3 Kilogram)
Month 2016 2017
May 23,328 25,080
Jun. 19,071 18,824
Jul. 15,313 13,086
Aug. 16,382 16,451
Sep. 13,429 14,589
Oct. 8,224 8,404
Nov. 6,073 -
Source: Jeju Special Self-Governing Province Citrus Marketing & Shipping Association
Korea: Average Retail Prices for Regular Unshu (tangerines), Nationwide
(Unit: Korean Won per 10 Fruits)
Year Month
2015 2016 2017 % Change from the previous year
Jan 2,422 2,212 3,043 38
Feb 2,410 2,913 4,357 50
Mar 3,062 3,256 6,108 88
Oct 3,376 3,668 4,015 9
Nov 2,313 2,751 3,053 11
Dec 2,145 2,689 - -
Prices for high quality
Source: Agricultural & Fishery Marketing Corporation
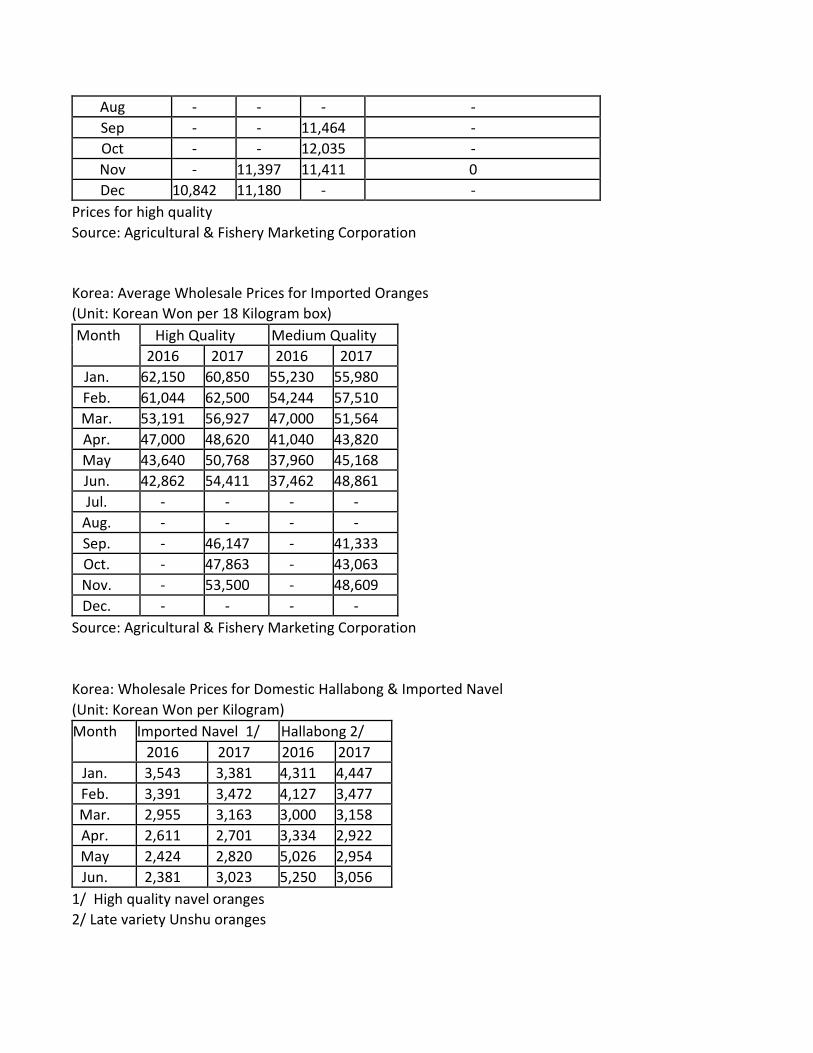
Korea: Average Retail Prices for Imported Oranges (Navel), Nationwide
(Unit: Korean Won per 10 Fruits)
Year Month
2015 2016 2017 % Change from the previous year
Jan 11,798 10,973 11,681 6
Feb 10,901 11,648 12,758 10
Mar 10,407 10,922 10,957 0
Apr 10,168 9,535 9,886 4
May 11,176 9,291 10,412 12
Jun 10,796 9,673 9,969 3
Jul - - - -
Aug - - - -
Sep - - 11,464 -
Oct - - 12,035 -
Nov - 11,397 11,411 0
Dec 10,842 11,180 - -
Prices for high quality
Source: Agricultural & Fishery Marketing Corporation
Korea: Average Wholesale Prices for Imported Oranges
(Unit: Korean Won per 18 Kilogram box)
Month High Quality Medium Quality
2016 2017 2016 2017
Jan. 62,150 60,850 55,230 55,980
Feb. 61,044 62,500 54,244 57,510
Mar. 53,191 56,927 47,000 51,564
Apr. 47,000 48,620 41,040 43,820
May 43,640 50,768 37,960 45,168
Jun. 42,862 54,411 37,462 48,861
Jul. - - - -
Aug. - - - -
Sep. - 46,147 - 41,333
Oct. - 47,863 - 43,063
Nov. - 53,500 - 48,609
Dec. - - - -
Source: Agricultural & Fishery Marketing Corporation
Korea: Wholesale Prices for Domestic Hallabong & Imported Navel
(Unit: Korean Won per Kilogram)
Month Imported Navel 1/ Hallabong 2/
2016 2017 2016 2017
Jan. 3,543 3,381 4,311 4,447
Feb. 3,391 3,472 4,127 3,477
Mar. 2,955 3,163 3,000 3,158
Apr. 2,611 2,701 3,334 2,922
May 2,424 2,820 5,026 2,954
Jun. 2,381 3,023 5,250 3,056
1/ High quality navel oranges
2/ Late variety Unshu oranges
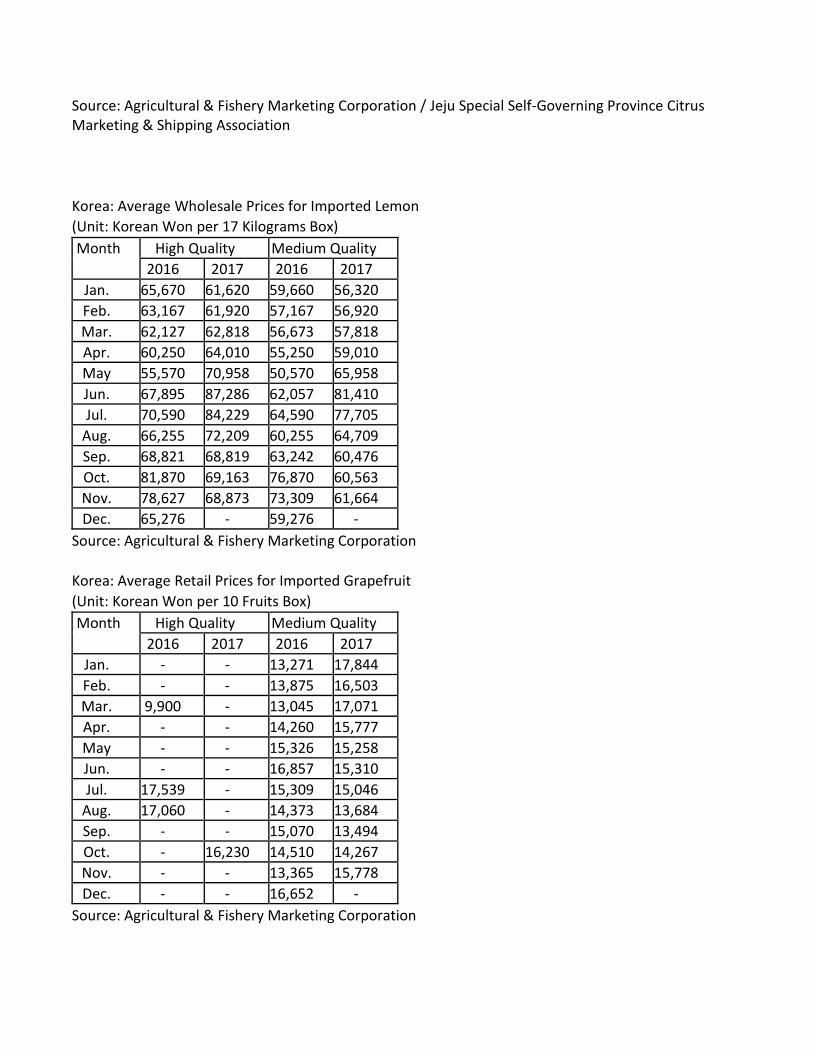
Source: Agricultural & Fishery Marketing Corporation / Jeju Special Self-Governing Province Citrus Marketing & Shipping Association
Korea: Average Wholesale Prices for Imported Lemon
(Unit: Korean Won per 17 Kilograms Box)
Month High Quality Medium Quality
2016 2017 2016 2017
Jan. 65,670 61,620 59,660 56,320
Feb. 63,167 61,920 57,167 56,920
Mar. 62,127 62,818 56,673 57,818
Apr. 60,250 64,010 55,250 59,010
May 55,570 70,958 50,570 65,958
Jun. 67,895 87,286 62,057 81,410
Jul. 70,590 84,229 64,590 77,705
Aug. 66,255 72,209 60,255 64,709
Sep. 68,821 68,819 63,242 60,476
Oct. 81,870 69,163 76,870 60,563
Nov. 78,627 68,873 73,309 61,664
Dec. 65,276 - 59,276 -
Source: Agricultural & Fishery Marketing Corporation
Korea: Average Retail Prices for Imported Grapefruit
(Unit: Korean Won per 10 Fruits Box)
Month High Quality Medium Quality
2016 2017 2016 2017
Jan. - - 13,271 17,844
Feb. - - 13,875 16,503
Mar. 9,900 - 13,045 17,071
Apr. - - 14,260 15,777
May - - 15,326 15,258
Jun. - - 16,857 15,310
Jul. 17,539 - 15,309 15,046
Aug. 17,060 - 14,373 13,684
Sep. - - 15,070 13,494
Oct. - 16,230 14,510 14,267
Nov. - - 13,365 15,778
Dec. - - 16,652 -
Source: Agricultural & Fishery Marketing Corporation
