small water harvesting and artificial recharge ...are singoda, somat and sagavadi located in amreli...
TRANSCRIPT

IJART- Vol-1, Issue-2, December, 2016 Available online at http://www.ijart.info/ IMPACT FACTOR- 1.625
90 Niranjan and Srinivasu, 2016
@IJART-2016, All Rights Reserved
INTERNATIONAL JOURNAL OF APPLIED RESEARCH AND TECHNOLOGY ISSN 2519-5115
RESEARCH ARTICLE
SMALL WATER HARVESTING AND ARTIFICIAL RECHARGE INTERVENTIONS
IN SINGODA RIVER BASIN COASTAL SAURASHTRA: HYDROLOGICAL AND
SOCIO ECONOMIC IMPACTS
1V. Niranjan
2 V.K. Srinivasu
1Environmental Engineer,
Engineering & Research
International LLC, Abu
Dhabi, UAE 2Remote Sensing and GIS
Consultant, Bangalore,
Karnataka, India
Corresponding author:
V. Niranjan
Received: November 14, 2016 Revised: December 02, 2016 Published: December 31, 2016
ABSTRACT
Coastal Saurashtra in Gujarat, India is characterized by highly erratic
rainfall, aridity, and seawater intrusion resulting from excessive withdrawal of
groundwater from coastal aquifers for irrigation. Under such conditions, water
resources needs to be judiciously managed to ensure crop production and
domestic water-security. Ambuja Cement Foundation (ACF), a philanthropic
organization, is engaged in basin-level water harvesting interventions in this
region. This research study highlights the hydrological and socio-economic
impacts of these interventions in the three river basins of coastal Saurashtra.
The interventions considered for the study include check dams; and reservoirs
in mined out areas. In order to estimate the impacts of these interventions,
simple hydrological models and statistical tools were used.
Analysis shows that there was a significant impact on groundwater regime,
as indicated by higher pre-post monsoon average rise in water levels in the
wells) near the check dams (9.63 m) as compared to those wells located
away from the check dam (7.64 m). Further, the well yields have improved
significantly, 3 to 7.35 litre per second higher for wells located in the
influence area. It was estimated that as a result of these water impounding
systems, water spread area in the basins increased by 3,024 hectares during
monsoon of 2010. Further, a larger proportion of the cropped area was
allocated to water intensive sugarcane after the interventions. As a result, there
was a substantial increase (by Rs. 22,248) in farm income per ha of land.
Apart from contributing to agricultural economy, harvested water was also being
used by women and children for domestic and recreational purposes. The major
environmental benefit of these water harvesting structures is the creation of
many small lakes in streams of different orders. Thus, there has been
significant positive impact of these water harvesting structures, both on the
local hydrology and rural livelihoods. The rates given in this paper are as
per the research done during the year 2011.
Keywords- Artificial recharge, hydrological interventions, socio economic
impacts
IJART- Vol-1, Issue-2, December, 2016 Available online at http://www.ijart.info/ IMPACT FACTOR- 1.625
INTRODUCTION
Systematic studies dealing with physical and
socio-economic impacts of water management
interventions at the basin scale are very few in
India. In the case of small and un-gauged river
basins, while many studies of hydrological and
socio-economic impacts of water harvesting and
watershed development interventions are available,
there is hardly any study available on the
comprehensive impact of water harvesting and
recharge interventions. There are several reasons
for this. First: it is often very hard to obtain data on
stream-flows, silt load and other hydrological
parameters like groundwater levels at various
control points in the drainage system. The
interventions are confined to a small river or sub-
tributary in the basin, which is not gauged by the
official agencies concerned (Kumar et al., 2006).
Second: the interventions are not basin-wide, and
are concentrated in a few watersheds in the upper
catchments, making it even more difficult to
capture the impacts at the basin level. Third: even
when there is large concentration of structures
across the basin, as noted by Kumar and others
(2006), the cost of monitoring and analysis is often
prohibitive, making it difficult for the myriad of s
mall agencies, which undertake the interventions at
the scale of villages and watersheds (Kumar et al.,
2006).
The available research in the past highlights
the downstream hydrological, socio-economic
impacts (Bachelor et al., 2002; Kumar et al., 2006;
Kumar et al., 2008), (Kumar and Amarasinghe,
2009; Ray and Bijarnia, 2006) and social & ecological
(Kumar et al., 2008) impacts when intensive water
harvesting is carried out in naturally water scarce
regions. The empirical studies mentioned here
were also from naturally water-scarce regions. In
this context, the work done by Ambuja Cement
Foundation is an exception. The foundations water
resource development and water harvesting
activities are spread over three river basins in
coastal Saurashtra.
COASTAL SAURASHTRA: A Bird’s Eye
View :Hydrology and Geo-hydrology
Saurashtra has a geographical area of 64,339
sq. km, with 32 percent of the total geographical
area of the State. Rainfall in the region is highly
erratic. Detailed analyses carried out by the Gujarat
Agricultural University using district-wise rainfall
figures showed that the mean annual rainy days vary
from a minimum of 22 for Rajkot district to a
maximum of 29 in Amreli. The mean annual rainfall
over the period, 1901-1990, varied from a minimum
of about 493 mm in Surendranagar to a maximum of
about 701 mm in Junagadh. There are also
significant variations in the annual rainfall and the
inter-annual variability across the region. The
highest variance (46%) was found in Amreli and
Junagadh, and lowest (3 9%) in Rajkot district.
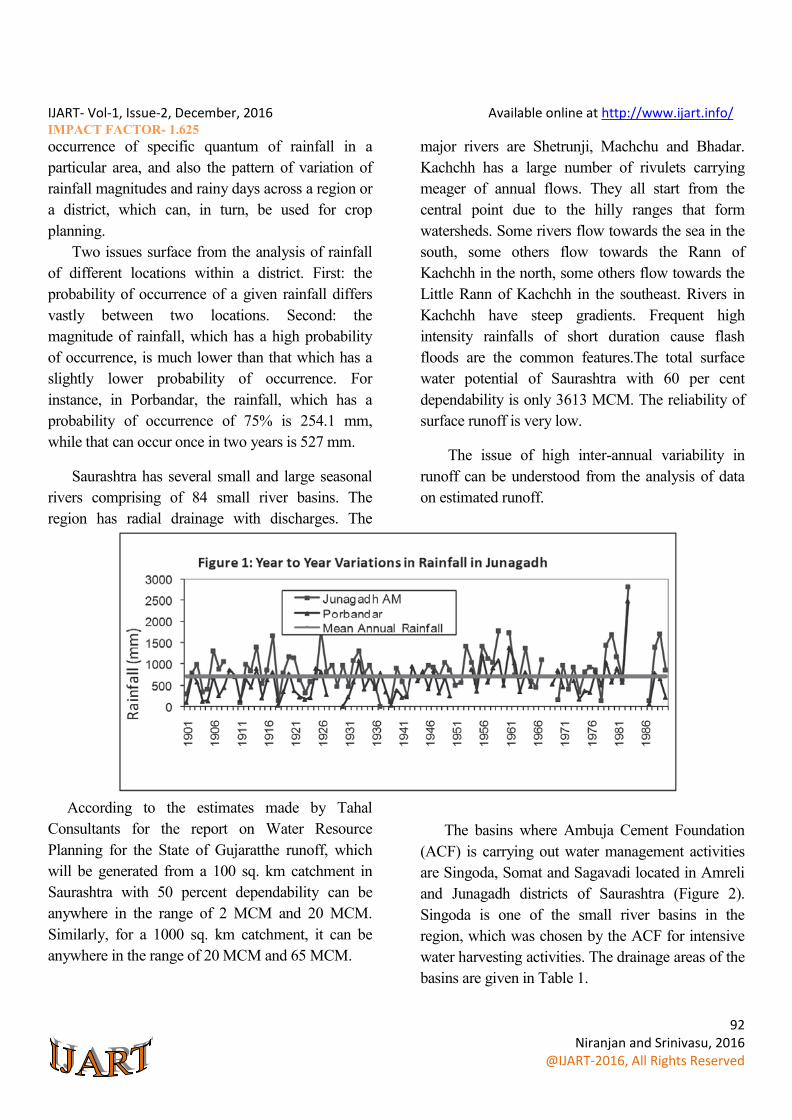
Analysis of point rainfall for a large number of
rain gauge stations in the region was carried out
using long-duration data of 68 to 78 years for the
study. It showed that there are significant variations
in the rainfall even within districts. In Junagadh, the
difference in mean value of rainfall is 299 mm.
Further, it was found that while it rains for 37 days
in Junagadh (AM), it rains only for 24 days in
Porbandar. Rainfall is lowest in the area, which
receive highest rainfall (here Junagadh AM) and
highest in one of the low rainfall. Figure 1 shows the
rainfall of two Locations in Junagadh, viz.,
Junagadh and Porbandar for the period from 1901 to
1990.
Given the high year-to-year variations in the
rainfall and number of rainy days, no meaningful
inference can be drawn in terms of water resource
potential and water management implications
examining the mean values. On the other hand, due
to the vast spatial variation in the magnitude of
rainfall and number of rainy days, district-level
average of rainfall and rainy days does not uniform
anything. What matters more is the probability of
IJART- Vol-1, Issue-2, December, 2016 Available online at http://www.ijart.info/ IMPACT FACTOR- 1.625
92 Niranjan and Srinivasu, 2016
@IJART-2016, All Rights Reserved
occurrence of specific quantum of rainfall in a
particular area, and also the pattern of variation of
rainfall magnitudes and rainy days across a region or
a district, which can, in turn, be used for crop
planning.
Two issues surface from the analysis of rainfall
of different locations within a district. First: the
probability of occurrence of a given rainfall differs
vastly between two locations. Second: the
magnitude of rainfall, which has a high probability
of occurrence, is much lower than that which has a
slightly lower probability of occurrence. For
instance, in Porbandar, the rainfall, which has a
probability of occurrence of 75% is 254.1 mm,
while that can occur once in two years is 527 mm.
Saurashtra has several small and large seasonal
rivers comprising of 84 small river basins. The
region has radial drainage with discharges. The
major rivers are Shetrunji, Machchu and Bhadar.
Kachchh has a large number of rivulets carrying
meager of annual flows. They all start from the
central point due to the hilly ranges that form
watersheds. Some rivers flow towards the sea in the
south, some others flow towards the Rann of
Kachchh in the north, some others flow towards the
Little Rann of Kachchh in the southeast. Rivers in
Kachchh have steep gradients. Frequent high
intensity rainfalls of short duration cause flash
floods are the common features.The total surface
water potential of Saurashtra with 60 per cent
dependability is only 3613 MCM. The reliability of
surface runoff is very low.
The issue of high inter-annual variability in
runoff can be understood from the analysis of data
on estimated runoff.
According to the estimates made by Tahal
Consultants for the report on Water Resource
Planning for the State of Gujaratthe runoff, which
will be generated from a 100 sq. km catchment in
Saurashtra with 50 percent dependability can be
anywhere in the range of 2 MCM and 20 MCM.
Similarly, for a 1000 sq. km catchment, it can be
anywhere in the range of 20 MCM and 65 MCM.
The basins where Ambuja Cement Foundation
(ACF) is carrying out water management activities
are Singoda, Somat and Sagavadi located in Amreli
and Junagadh districts of Saurashtra (Figure 2).
Singoda is one of the small river basins in the
region, which was chosen by the ACF for intensive
water harvesting activities. The drainage areas of the
basins are given in Table 1.

IJART- Vol-1, Issue-2, December, 2016 Available online at http://www.ijart.info/ IMPACT FACTOR- 1.625
93 Niranjan and Srinivasu, 2016
@IJART-2016, All Rights Reserved
Regional models developed by the National
Institute of Hydrology, Roorkee for estimating
runoff from rainfall for un-gauged basins of
Saurashtra shows that the best fit model to represent
the rainfall-runoff relationship of the region is a bi-
variate non-linear model with the parameter value of
0.757. But, these regression values do not seem to
be quite robust in the sense that higher rainfall in
Saurashtra produces disproportionately higher
runoff, meaning that the value of the coefficient
should be more than one, whereas, it is less than one
as per the estimates provided by National Institute of
Hydrology.
The analysis of rainfall data for Kodinar
available from IMD (only for 9 years from 1989 to
1997) shows that the number of rainy days varies
from 22 days in 1991 to 39 days in 1994. The total
amount of annual rainfall varied from as low as
524mm in 1993 to 1190mm in 1994.
Source: Indian Meteorological Department (IMD) Data
The mean annual rainfall was only 817.3mm. In
the case of Talala, a rain-gauge station upstream of
Kodinar, the mean annual rainy days for the period
from 1989 to 1998 is 40.5 and the mean annual
rainfall was 937.8mm. In 1994, it rained for 60 days
with a total rainfall of 1680mm, the highest rainfall
during the reporting period. Based on the data for
the two locations, it can be inferred that the upper
catchment of basins in the area receive higher
rainfall, distributed over larger number of wet days.
The entire peninsular region of Saurashtra (except
the coastal strip and parts of Surendranagar district),
are underlain by hard rock basalt of the Deccan Trap
formation. It has no primary porosity but fractures,
weathered zones and fissures present in it provide
secondary porosity. The coastal tract has recent
alluvium, and gaj formations. Part of Surendranagar
district has sandstone aquifers. Brackish water is
often found in the coastal alluvial tract, while the gaj
limestone and clay have inherent salinity due to the
marine environment. The aquifers in the entire
Saurashtra region (except the coastal region and
most parts of Surendranagar district) are shallow and
unconfined. Groundwater occurs in fractures and
weathered zones. The hydraulic conductivity and
specific yield are very low in the basalt. The
cavernous limestone in coastal Saurashtra has very
high hydraulic conductivity.
Soils and Climate
The coastal region of Junagadh has different
soil types. The coastal strip has deep alluvial sand.
These soils have a high infiltration capacity.

IJART- Vol-1, Issue-2, December, 2016 Available online at http://www.ijart.info/ IMPACT FACTOR- 1.625
94 Niranjan and Srinivasu, 2016
@IJART-2016, All Rights Reserved
Water saline partly because of ingress of
seawater (from high tides and entry of seawater
through coastal creeks), and partly because of using
groundwater containing excessive salts for
irrigation. The other parts of the coastal area have
heavy and medium black soils. These sticky clay
soils have high initial infiltration which reduces
highly with increasing moisture content. These
soils shrink and develop cracks on losing the
moisture, and therefore pose a big challenge in
irrigation water management. The area is semi-
arid, with high relative humidity.
The nearest location in which data on climate
related parameters are available is Meghal. The
data on min and max temperatures in different
months, the no. of hours of sunshine, wind speed &
wind direction and humidity (%) are provided in
Table 1. The highest temperature is generally
observed during March (40.5oC) and May (40
oC),
and lowest is observed during January and February.
The relative humidity is highest during the months
of July and August, when the monsoon peaks. The
potential evaporation values are highest during the
month of May, followed by April with average
daily values of 8.22mm and 7.84, respectively.
What is important to note is that even during the
monsoon months, the potential evaporation rates are
quite high, owing to relatively higher wind speed,
in spite of lowering of daily temperature and
increasing of atmospheric humidity (June, July
and September).
Table 1: Climate Parameters from Meghal Weather Station, Junagadh
Sr. No Month Evaporation
(mm)
Temperature
(oC)
Sunshine Hours Wind
Directio
n
Wind Speed Humidity
(%)
Total Average Max Min Total Avg 8:30am 5:30pm
1 January 180.1 5.809 33.0 7.0 279.4 9.01 NNW 8.54 8.55 44.45
2 February 192.5 6.875 36.5 7.0 259.5 9.26 WNW 9.83 9.89 40.79
3 March 233.5 7.530 40.5 14.0 290.8 9.38 WNW 10.19 10.23 52.75
4 April 235.3 7.843 38.5 18.5 308.7 10.29 WNW 11.85 11.82 62.93
5 May 254.8 8.219 40.0 22.5 309.7 9.99 WSW 13.78 13.81 69.62
6 June 225.4 7.513 37.0 24.8 205.7 6.86 WSW 15.01 15.00 73.47
7 July 214.9 6.932 33.0 24.1 101.2 3.26 WSW 18.60 18.57 77.18
8 August 190.4 6.141 31.0 23.8 59.1 1.91 WSW 14.12 14.21 81.36
9 September 222.3 7.410 33.5 22.5 265.3 8.84 WNW 10.42 10.43 74.17
10 October 247.3 7.977 41.0 18.8 280.6 9.05 WSW 7.19 7.10 56.57
11 November 238.1 7.936 37.0 15.1 255.4 8.51 WSW 6.68 6.73 45.77
12 December 212.2 6.845 36.0 11.5 262.4 8.46 WNW 7.20 7.27 49.37
Source: Data from Meghal Weather Station, Meghal
Stream-flows in Kodinar Basins
The success of water harvesting interventions
in any area depends on the uncommitted stream-
flows available from rivers and streams in the area,
the flow characteristics and the inter-annual
variability. Singoda is one of the most important
river basins where ACF had undertaken intensive
water harvesting and recharge activities. Stream-
flow data available for a medium reservoir located
upstream shows that out of the 27 years, in 15

IJART- Vol-1, Issue-2, December, 2016 Available online at http://www.ijart.info/ IMPACT FACTOR- 1.625
95 Niranjan and Srinivasu, 2016
@IJART-2016, All Rights Reserved
years, there were excess flows. In one of the years
(1994-95), the excess flow was in the order of
380.97MCM. What is interesting to note is that for
four consecutive years starting from 2003-04, runoff
from the catchment was excessively high, causing
huge reservoir overflows. This excess flow, added
to the runoff generated in the residual catchment of
the basin in the lower reaches, would determine the
hydrological opportunity for water harvesting and
recharge interventions.
A rainfall runoff relationship for the upper
catchment of the basin was estimated on the
basis of the rainfall observed in the reservoir
catchment, and the estimated values of inflows.
The inflow was estimated by summing up the
gross storage in the reservoir, the outflows from
the reservoir and the lake losses. It shows that the
relationship is exponential (Figure 3), whichmeans
that with increase in rainfall, the runoff rate also
would increase. The rainfall-runoff relationship is
defined by the mathematical equation,
Y=0.0004*(X) 2.289
Socioeconomic Characteristics of the Coastal
Junagadh
Junagadh district lies between 21º 10' and 21
o 40'
north latitude and 70º 18' and 71
º 15' west longitude
region, in the state of Gujarat India. This district is
bounded by the Rajkot district in North, Amreli
district in East, Arabian Sea in South and by the
Arabian Sea and Porbandar district in the West.
Total geographical area of Junagadh district is
6,996,011.21 ha.
Coastal Saurashtra has unique socio-economic
characteristics, which are distinctly different from
Saurashtra mainland by virtue of the coastal
climate, the soils and the exposure of the
communities living in this area to several outside
cultures. The region’s farming systems,
characterize this. The area is known for rich
mango orchards. The Kesar mangoes of Talala in
Junagadh are famous all over the country. The
area in and around Kodinar is also known for
cultivation of sugarcane. The crop gives very high
yield in the area. The other major crops grown in
the region are groundnut in kharif and wheat in
winter. Dairying is also quite extensive in the
region. The Kankreji cows and Jafrabadi buffaloes
are well known breeds. Besides this, goat, sheep
and bullocks are also reared. The region is also
known for coconut plantations in the coastal strip.
The relatively higher rainfall and shallow
groundwater triggered agricultural revolution in
this region in the late 50s and 60s. The open wells,
IJART- Vol-1, Issue-2, December, 2016 Available online at http://www.ijart.info/ IMPACT FACTOR- 1.625
96 Niranjan and Srinivasu, 2016
@IJART-2016, All Rights Reserved
which were energized using diesel engines and
electric pump sets, gave very good yields, and the
industrious farmers in this region took 2- 3 crops,
apart from the annual and perennial crops. But,
this prosperity did not last long. Excessive
withdrawal of groundwater for irrigation resulted
in intrusion of seawater into the coastal aquifers.
Increased salinity in groundwater even made
water for drinking and cooking scarce. Estimates
made by GWRDC as far back as 1997 showed
Kodinar taluka as “over-exploited”, with the total
groundwater draft (131 .5MCM per annum) far
exceeding the utilizable recharge of 82.6MCM per
annum (as Cited in CSPC, 2008)
Today, the ability of farmers to use water from
these wells depends mostly on the monsoon. If the
rainfall is good, the salinity of ground water
reduces and the farmers would be able to provide
supplementary irrigation for the kharif crops, and
sometimes irrigate winter crops. The level of
salinity in groundwater is high towards the coastal
strip, which reduces gradually towards inland. In
the inland aquifers, which are basalt formations,
are not extensions of the coastal aquifers, which
consist of coastal alluvium followed by cavernous
limestone. The wells in basalt formation still
provide water of good quality. High degree of
salinity is encountered in the wells tapping the
coastal alluvium, cavernous limestone and the
marine gaj formations1 which are inherently
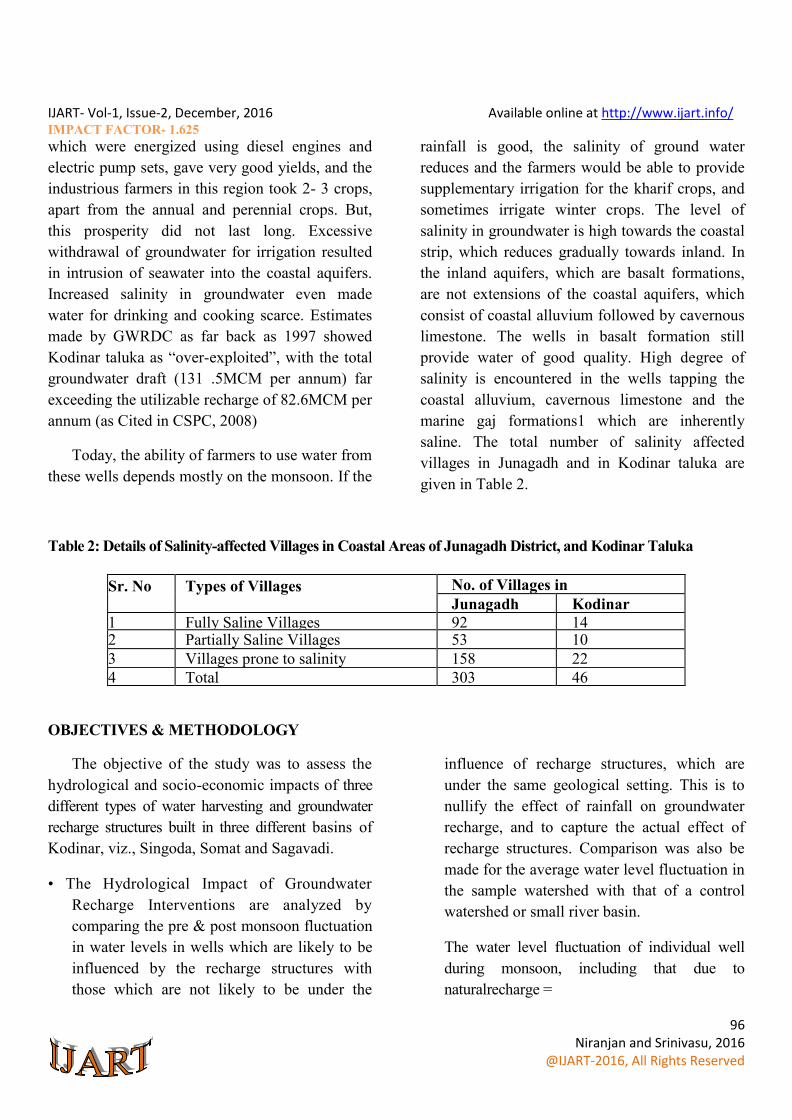
saline. The total number of salinity affected
villages in Junagadh and in Kodinar taluka are
given in Table 2.
Table 2: Details of Salinity-affected Villages in Coastal Areas of Junagadh District, and Kodinar Taluka
Sr. No Types of Villages No. of Villages in
Junagadh Kodinar
1 Fully Saline Villages 92 14 2 Partially Saline Villages 53 10
3 Villages prone to salinity 158 22
4 Total 303 46
OBJECTIVES & METHODOLOGY
The objective of the study was to assess the
hydrological and socio-economic impacts of three
different types of water harvesting and groundwater
recharge structures built in three different basins of
Kodinar, viz., Singoda, Somat and Sagavadi.
• The Hydrological Impact of Groundwater
Recharge Interventions are analyzed by
comparing the pre & post monsoon fluctuation
in water levels in wells which are likely to be
influenced by the recharge structures with
those which are not likely to be under the
influence of recharge structures, which are
under the same geological setting. This is to
nullify the effect of rainfall on groundwater
recharge, and to capture the actual effect of
recharge structures. Comparison was also be
made for the average water level fluctuation in
the sample watershed with that of a control
watershed or small river basin.
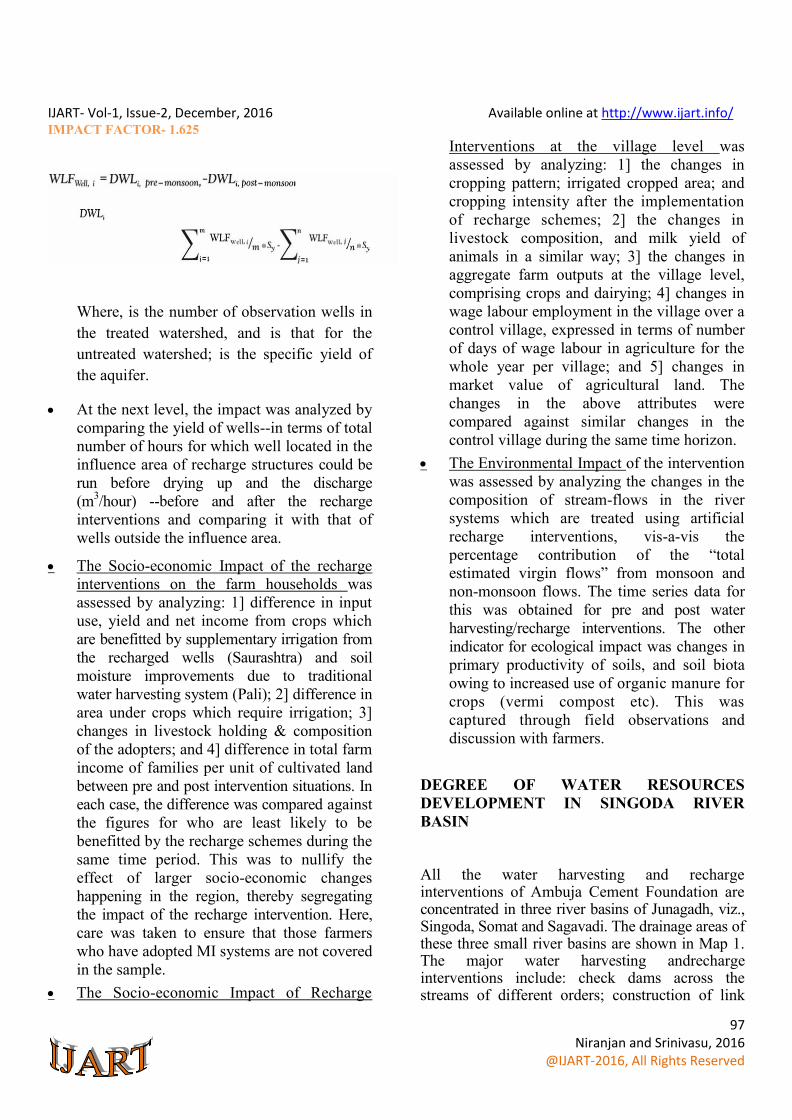
The water level fluctuation of individual well
during monsoon, including that due to
naturalrecharge =
IJART- Vol-1, Issue-2, December, 2016 Available online at http://www.ijart.info/ IMPACT FACTOR- 1.625
97 Niranjan and Srinivasu, 2016
@IJART-2016, All Rights Reserved
Where, is the number of observation wells in
the treated watershed, and is that for the
untreated watershed; is the specific yield of
the aquifer.
At the next level, the impact was analyzed by
comparing the yield of wells--in terms of total
number of hours for which well located in the
influence area of recharge structures could be
run before drying up and the discharge
(m3/hour) --before and after the recharge
interventions and comparing it with that of
wells outside the influence area.
The Socio-economic Impact of the recharge
interventions on the farm households was
assessed by analyzing: 1] difference in input
use, yield and net income from crops which
are benefitted by supplementary irrigation from
the recharged wells (Saurashtra) and soil
moisture improvements due to traditional
water harvesting system (Pali); 2] difference in
area under crops which require irrigation; 3]
changes in livestock holding & composition
of the adopters; and 4] difference in total farm
income of families per unit of cultivated land
between pre and post intervention situations. In
each case, the difference was compared against
the figures for who are least likely to be
benefitted by the recharge schemes during the
same time period. This was to nullify the
effect of larger socio-economic changes
happening in the region, thereby segregating
the impact of the recharge intervention. Here,
care was taken to ensure that those farmers
who have adopted MI systems are not covered
in the sample.
The Socio-economic Impact of Recharge
Interventions at the village level was
assessed by analyzing: 1] the changes in
cropping pattern; irrigated cropped area; and
cropping intensity after the implementation
of recharge schemes; 2] the changes in
livestock composition, and milk yield of
animals in a similar way; 3] the changes in
aggregate farm outputs at the village level,
comprising crops and dairying; 4] changes in
wage labour employment in the village over a
control village, expressed in terms of number
of days of wage labour in agriculture for the
whole year per village; and 5] changes in
market value of agricultural land. The
changes in the above attributes were
compared against similar changes in the
control village during the same time horizon.
The Environmental Impact of the intervention
was assessed by analyzing the changes in the
composition of stream-flows in the river
systems which are treated using artificial
recharge interventions, vis-a-vis the
percentage contribution of the “total
estimated virgin flows” from monsoon and
non-monsoon flows. The time series data for
this was obtained for pre and post water
harvesting/recharge interventions. The other
indicator for ecological impact was changes in
primary productivity of soils, and soil biota
owing to increased use of organic manure for
crops (vermi compost etc). This was
captured through field observations and
discussion with farmers.
DEGREE OF WATER RESOURCES
DEVELOPMENT IN SINGODA RIVER
BASIN
All the water harvesting and recharge interventions of Ambuja Cement Foundation are concentrated in three river basins of Junagadh, viz., Singoda, Somat and Sagavadi. The drainage areas of these three small river basins are shown in Map 1. The major water harvesting andrecharge interventions include: check dams across the streams of different orders; construction of link

IJART- Vol-1, Issue-2, December, 2016 Available online at http://www.ijart.info/ IMPACT FACTOR- 1.625
98 Niranjan and Srinivasu, 2016
@IJART-2016, All Rights Reserved
canals for connecting two rivers when flow regimes are different; feeding mined out areas with runoff from distant streams for creating large reservoirs; building of roof water collection tanks; promotion of drip irrigation systems amongst orchard and sugarcane growers; rejuvenation of
drinking water wells, which have become saline due to seawater intrusion and ingress, through well sealing; and dug well recharging. Table 4 gives the scale of water harvesting and groundwater recharge and drinking water supply interventions carried out by ACF in the two project areas.
Table 4: Details of Various Water Harvesting Structures
Sr. No Structure Number of Structures/ Size of the Structure
Location: Kodinar 1 Construction/ Renovation of Check Dam 153
2 Dug Well Recharge 902
3 Percolation Tank 96 4 Percolation Well 100
5 Construction of Farm Ponds 717
6 Construction of Link Channels (km) 56.75
7 Roof rainwater harvesting structures constructed 2103
8 Rejuvenation of saline wells (well sealing) 40
Source: Water Resource Management in Junagadh, Ambuja Cement Foundation, 2009
While many such water harvesting and
groundwater recharge techniques were attempted
by NGOs and government agencies alike in
Gujarat and many other water stressed regions of
India, the uniqueness of the strategy of Ambuja
Cement Foundation is that many of the
interventions are designed with due
consideration to the peculiar hydrological and
geohydrological environment of the region.
For instance, river linking work was
undertaken in view of the fact that there is
substantial spatial variation in the rainfall and
runoff in small basins of the coastal area which are
adjacent. At the same time, topography and geo-
hydrology induce severe constraints on storing all
the water through engineering interventions within
the same basin. On the other hand, because of high
rainfall occurrence, the demand for water within
the basin during the times of inflow will also be
high. They together reduce the utilization potential
of the flood water within the basin. Diverting this
water to the adjoining basins, which experience
rainfall deficit, would increase the effective water
storage and diversion capacity, and also utilization
potential for this water. While it is understood that
water harvesting & recharge structures are quite
expensive (in terms of cost per cubic metre of
water stored or recharged) in regions of low to
medium rainfall with high inter-annual variability,
and which is erratic in nature (Kumar et al., 2008),
one way to increase the cost effectiveness of these
structures is to keep the effective utilization far
above the storage capacity.
HYDROLOGICAL IMPACT OF WATER
HARVESTING STRUCTURES IN KODINAR
AREA
A. Impact of Check Dams
Over the past few years, it has almost
become common belief in western India that
construction of check dams in small streams and
rivers would increase water availability in a
locality through groundwater recharge,

IJART- Vol-1, Issue-2, December, 2016 Available online at http://www.ijart.info/ IMPACT FACTOR- 1.625
99 Niranjan and Srinivasu, 2016
@IJART-2016, All Rights Reserved
irrespective of the hydrological regime,
topography and the geological setting and that such
structures can be built with lowest investment. The
State of Gujarat had witnessed unscrupulous
building of check dams without any consideration
to the rainfall, the catchment area availability, the
topography and the underlying geology, with the
result that the number of such structures
sometimes exceeds even 100 within just one
village. It goes without saying that scientific
prudence needs to be exercised in building such
structures, though they are very small in size.
While the issues of upstream Vs downstream and
overall impact of these structures on the basin
water balance are quite crucial (Kumar et al., 2006;
Raj and Bijarnia, 2006; Kumar et al., 2008), serious
concerns are being raised about the local impacts of
these structures on hydrological regime, the life of
the system and their costs.
Whether a check dam can produce the intended
benefits of augmenting surface water, augment
recharge to groundwater depend and how cost
effective it is depends on many factors. Some of
them are: pattern of occurrence of rainfall and
runoff; catchment area; terrain conditions;
underlying geology, and geo-hydrology; potential
evaporation; and the pattern of use of water. We
would discuss the influence of each on the potential
impacts of check dams. Occurrence of high
intensity rainfalls of short duration in the local
catchment can reduce the effective storage of
water in a reservoir created by a check dam as the
opportunity time available for water to infiltrate
would be less. More importantly, during times of
inflow, as the local groundwater table would be high
due to natural recharge from rainfall (Saurashtra),
the percolation will be negligible. Also, the damage
such high intensity rainfalls can cause on the
structure through high intensity runoff and flash
flood, through bank erosion is quite high.
Whereas, when rainfall is evenly distributed over
long time periods can increase the effective storage
of water for the same reservoir capacity. Further,
when there are continuous inflows from the upper
catchment even after the withdrawal of monsoon
(due to base-flows), the check dams down below are
likely to be quite effective, as the time for
infiltration would be high, and there would be
more space in the underlying geological formation
for storage of water.
As regards, terrain conditions, hilly (slopping)
terrains the check dams are least likely to augment
groundwater recharge effectively. This is because of
steep groundwater gradients which cause the
percolating water to flow out of the formations
(Mayya, 2005).
In the context of catchments, it is important to
make sure that there is sufficient residual
catchment upstream of the proposed check dam
site. Intensive water harvesting within a basin
means that there is very little residual catchment
left in the basin for harnessing. Potential
evaporation is a major hydrological variable which
determines the effectiveness of small water
harvesting structures, including check dams and
small dams.
If the evaporation rates are high during the
monsoon, this can become a major factor which
can negatively influence the performance of the
reservoirs created by check dams and small dams.
In the case of Junagadh, the potential evaporation
rates during the monsoon are high. This
means that the water spread area should be reduced and the structures should be cited at places where the recharge rates would be high due to the presence of geological structures such as lineaments. Finally, in open basins (see Seckler, 1996 for discussions), the benefits of building check dams would be high. It is important to note here that the small river basins of Junagadh
IJART- Vol-1, Issue-2, December, 2016 Available online at http://www.ijart.info/ IMPACT FACTOR- 1.625
100 Niranjan and Srinivasu, 2016
@IJART-2016, All Rights Reserved
district, which are originating from the Gir forest, are open basins, with the reservoirs built upstream still overflowing. The Gir forest area not only receives high rainfall (above 900mm), but also has the terrain that is rocky which provides high runoff rates. Lean season flows, which are contributed by the base-flow in the upper catchment, are also significant in these basins. When basins are closed, the building of new water impounding structures only result in redistribution of water within the basin, rather than augmenting the utilizable runoff.
Hydrological impacts of water harvesting included monitoring fluctuation in water levels of wells around the check dams and which are likely to be influenced by them between pre and post monsoon, and comparison with wells outside the influence area of check dams. Earlier it was planned to compare the water level fluctuations before and after the interventions. But, due to lack of data, this was not done. In the current comparison, it is assumed that the two areas have similar geological setting (top soil and specific yield) so that the same quantum of rainfall would cause the same degree of impact vis-à-vis recharge and water level fluctuations. Hence, the difference in pre & post monsoon water level fluctuations between the two areas would show the effect of the water harvesting structures. By doing this, the effect of natural recharge on water level fluctuations can be nullified.
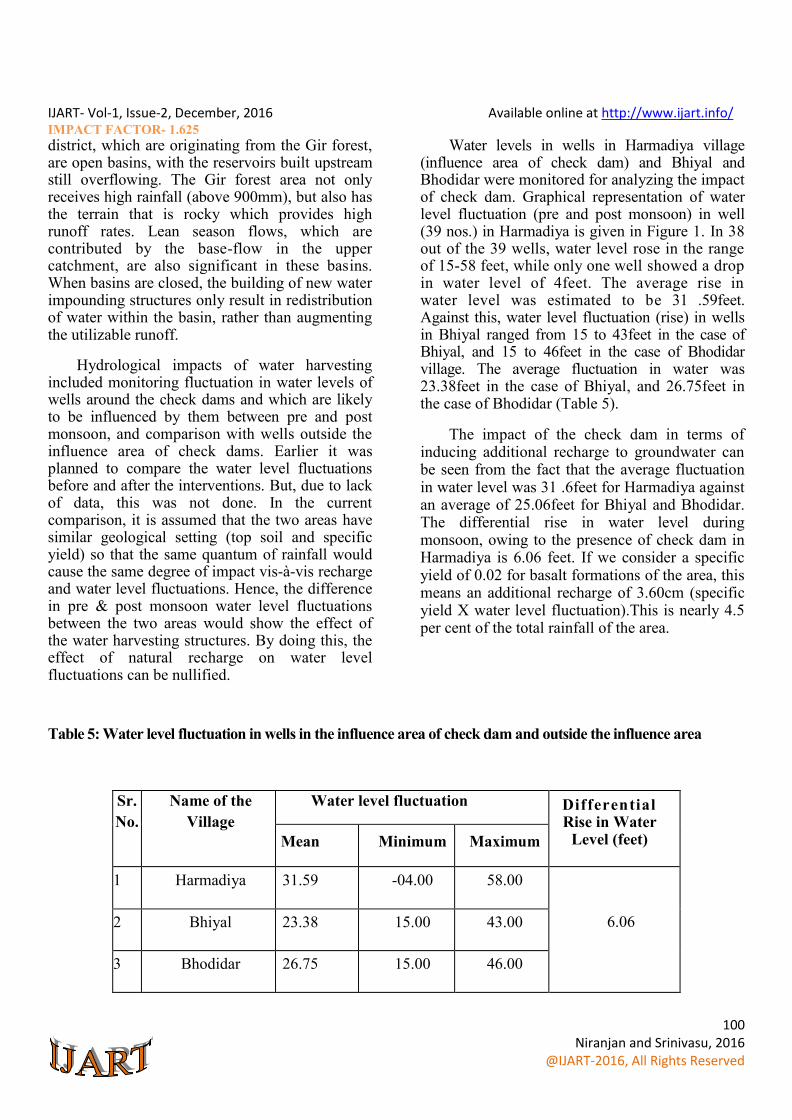
Water levels in wells in Harmadiya village (influence area of check dam) and Bhiyal and Bhodidar were monitored for analyzing the impact of check dam. Graphical representation of water level fluctuation (pre and post monsoon) in well (39 nos.) in Harmadiya is given in Figure 1. In 38 out of the 39 wells, water level rose in the range of 15-58 feet, while only one well showed a drop in water level of 4feet. The average rise in water level was estimated to be 31 .59feet. Against this, water level fluctuation (rise) in wells in Bhiyal ranged from 15 to 43feet in the case of Bhiyal, and 15 to 46feet in the case of Bhodidar village. The average fluctuation in water was 23.38feet in the case of Bhiyal, and 26.75feet in the case of Bhodidar (Table 5).
The impact of the check dam in terms of inducing additional recharge to groundwater can be seen from the fact that the average fluctuation in water level was 31 .6feet for Harmadiya against an average of 25.06feet for Bhiyal and Bhodidar. The differential rise in water level during monsoon, owing to the presence of check dam in Harmadiya is 6.06 feet. If we consider a specific yield of 0.02 for basalt formations of the area, this means an additional recharge of 3.60cm (specific yield X water level fluctuation).This is nearly 4.5 per cent of the total rainfall of the area.
Table 5: Water level fluctuation in wells in the influence area of check dam and outside the influence area
Sr.
No.
Name of the
Village
Water level fluctuation Differential Rise in Water
Level (feet) Mean Minimum Maximum
1 Harmadiya 31.59 -04.00 58.00
6.06 2 Bhiyal 23.38 15.00 43.00
3 Bhodidar 26.75 15.00 46.00
IJART- Vol-1, Issue-2, December, 2016 Available online at http://www.ijart.info/ IMPACT FACTOR- 1.625
101 Niranjan and Srinivasu, 2016
@IJART-2016, All Rights Reserved
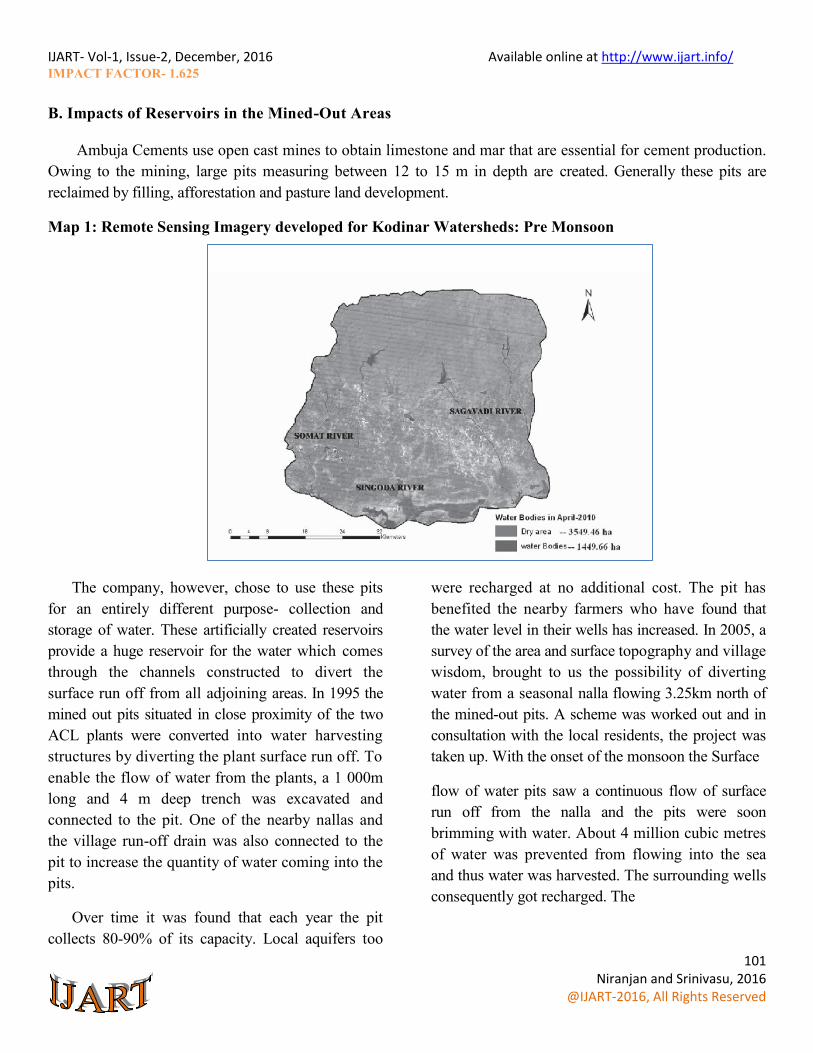
B. Impacts of Reservoirs in the Mined-Out Areas
Ambuja Cements use open cast mines to obtain limestone and mar that are essential for cement production.
Owing to the mining, large pits measuring between 12 to 15 m in depth are created. Generally these pits are
reclaimed by filling, afforestation and pasture land development.
Map 1: Remote Sensing Imagery developed for Kodinar Watersheds: Pre Monsoon
The company, however, chose to use these pits
for an entirely different purpose- collection and
storage of water. These artificially created reservoirs
provide a huge reservoir for the water which comes
through the channels constructed to divert the
surface run off from all adjoining areas. In 1995 the
mined out pits situated in close proximity of the two
ACL plants were converted into water harvesting
structures by diverting the plant surface run off. To
enable the flow of water from the plants, a 1 000m
long and 4 m deep trench was excavated and
connected to the pit. One of the nearby nallas and
the village run-off drain was also connected to the
pit to increase the quantity of water coming into the
pits.
Over time it was found that each year the pit
collects 80-90% of its capacity. Local aquifers too
were recharged at no additional cost. The pit has
benefited the nearby farmers who have found that
the water level in their wells has increased. In 2005, a
survey of the area and surface topography and village
wisdom, brought to us the possibility of diverting
water from a seasonal nalla flowing 3.25km north of
the mined-out pits. A scheme was worked out and in
consultation with the local residents, the project was
taken up. With the onset of the monsoon the Surface
flow of water pits saw a continuous flow of surface
run off from the nalla and the pits were soon
brimming with water. About 4 million cubic metres
of water was prevented from flowing into the sea
and thus water was harvested. The surrounding wells
consequently got recharged. The

IJART- Vol-1, Issue-2, December, 2016 Available online at http://www.ijart.info/ IMPACT FACTOR- 1.625
102 Niranjan and Srinivasu, 2016
@IJART-2016, All Rights Reserved
success of this experiment propelled us to further
inter-linking pits so as to transfer the excess water in
the case of heavy rains from one pit to another.
Over all 5.5 million cubic meters of water got
collected through the diversion canal in 2006.
Map 2: Remote Sensing Imagery developed for Kodinar watersheds: Post Monsoon
SOCIO-ECONOMIC IMPACTS OF WATER HARVESTING & RECHARGE STRUCTURES IN KODINAR AREA
Increased recharge to groundwater would mean
raised water levels in wells, and increased well
yields. This will increase the irrigation potential of
the wells. With this, farmers can expand the area
under irrigated crops during winter and summer
months. Also, in certain situations, the farmers can
also provide supplementary irrigation to kharif
crops, thereby raising crop yields. But, this normally
does not happen because of the fact that the years of
good groundwater recharge from check dam would
coincide with the years of good monsoon, wherein
the kharif crops would not require supplementary
irrigation.
In order to analyze the changes in agricultural
production resulting from improved recharge of
wells, primary data were collected from farmers in
the influence area of the check dam ontheir farming
enterprise. The data included those prior to the
construction of check dam as well as those after the
construction of the check dams. The various attributes
considered for analyzing the farm level impact are:
area under different crops; the yield and net return
from crops; and water productivity of crops both in
physical and economic terms. In addition, data on
livestock holding were also analyzed. The various
structures considered for the analysis included:
check dams; link canals and mined out areas.

IJART- Vol-1, Issue-2, December, 2016 Available online at http://www.ijart.info/ IMPACT FACTOR- 1.625
103 Niranjan and Srinivasu, 2016
@IJART-2016, All Rights Reserved
A. Impact of Check Dams
Comparative analysis of data on the farms
benefited by the check dams in terms of improved
recharge to groundwater, pre and post check dam
construction showed the following. First: the
percentage area under high valued crops such as
sugarcane, summer bajra and cotton, which are also
far more water intensive as compared to kharif
groundnut and bajra, increased. Among these,
sugarcane is a highly water intensive perennial crop,
which requires 30-50 watering over the entire crop
cycle. Therefore, such a shift in cropping pattern
could be possible only because the farmers were
assured of sufficient water in their wells. Second:
the proportion of the area under kharif crops, such as
kharif bajra and kharif groundnut, got substantially
reduced. Overall, the total area under irrigated crops
(sugarcane, cotton, til, summer groundnut, winter,
fodder crops and summer bajra and wheat) reduced
only marginally through the aggregate area under
crops reduced significantly during the period from
403 to 352bigha.
The impact of check dams on the farmers
choice of crops is explicit from the fact that in the
control farms of the area, which were not influenced
by the check dams of Harmadiya, had totally
different cropping pattern (Column 3 and 6 of Table
6). The percentage area under sugarcane was less
than eight, whereas kharif groundnut occupied
nearly 13 per cent of the gross cropped area.
Moreover, only 72.6 per cent of the gross cropped
area was irrigated while 80 per cent of the area
cropped by farmers in the influence area of check
dams was irrigated.
Table 6: Change in Cropping Pattern Post Check Dam Construction
Source: authors’ own analysis using primary data
Further analysis using data on irrigation
dosage, yield and net return from crops are as
follows. Irrigation dosage for all the crops, estimated
as the depth of irrigation, increased post check dam
Sr.
No
Name of Crop Before Check dam After Check dam Control Farm
Area
(bigha)
% Area Area
(bigha) % Area
Area
(bigha)
% Area
1 Kharif Groundnut 52.00 12.9 24.00 6.5 41.5 12.8
2 Summer Groundnut 22.00 5.5 9.00 2.4 0.0 0.0
3 Sugarcane 33.50 8.3 73.00 19.8 25.5 7.9
4 Kharif Bajra 19.50 4.8 13.50 3.7 22.0 6.8 5 Winter Bajra 18.00 4.5 15.00 4.1 0.0 0.0
6 Summer Bajra 39.00 9 . 7 34.00 9.2 17.5 5.4
7 Cotton 68.00 16.9 77.00 20.9 88.5 27.4
8 Wheat 84.00 3.6 57.00 3.1 0.0 0.0
9 Black Gram 23.50 5.8 16.00 4.3 14.0 4.3
10 Fodder 12.50 20.8 9.50 15.4 103.0 31.9
11 Til 27.00 6.7 34.00 9.2 0.0 0.0
12 Chick pea 4.00 1.0 5.00 1.4 0.0 0.0
13 Kharif Jowar 0.00 0.0 0.00 0.0 11.0 3.4
14 Total Area 403.00 100.00 352.00 100.00 323.00 100.00

IJART- Vol-1, Issue-2, December, 2016 Available online at http://www.ijart.info/ IMPACT FACTOR- 1.625
104 Niranjan and Srinivasu, 2016
@IJART-2016, All Rights Reserved
construction for all the winter and summer crops,
except for sugarcane. The crop yield did not record
any increase, except for wheat. One reason could
be that most of these crops are grown during rainy
season, and their yield will have effect of rainfall
pattern. But, the net returns for all the crops
increased significantly post check dam
construction. Also, as we have seen earlier, the
proportion of area under sugarcane which gives the
highest return per unit area of land, is highest after
check dam construction, resulting in overall increase
in farm returns. Water productivity in physical terms
reduced for all crops except sugarcane owing to
increased water application. In the case of sugarcane,
though the yield hasn’t increased post check dam
construction, the water dosage reduced substantially.
This can be attributed to the effect of rainfall
occurrence. Reduction in physical productivity of
water means that the yield had not increased in
proportion to the increase in irrigation water dosage.
As regards water productivity in economic terms, it
has increased for all the crops, either because of
disproportionately higher increase in net income in
relation to the increase in water application rate. It
is important to note that sugarcane, which is
replacing crops such as kharif bajra and groundnut
and winter wheat, has much lower water productivity
in economic terms as compared to these crops (only
Rs.3.6/m3against Rs.7.6/m
3 and Rs.5. 1/m
3 for
cotton and wheat respectively even under the
improved water application scenario). This is a
matter of great concern, as investments for
constructing the water harvesting structures are
quite large.
Table 7: Crop Economics, Pre Check Dam Construction
Sr.
No
Name of Crop Depth
of
Irrigation
Yield
(kg/bigha)
Net
Return
(Rs/bigha)
Water productivity
(Kg/m3) (Rs/m
3)
1 Kharif Groundnut 315.15 945.0 2 Summer Groundnut 233.33 602.0 0.34 0.35
3 Cotton 0.98 547.67 5535.5 3.3 33.4
4 Sugarcane 3.65 22250.0 9954.0 4.20 1.80
5 Kharif Bajra 0.02 591.67 1845.8 6.25 17.85 6 Winter Bajra 0.68 1000.00 3500.0 1.02 3.46
7 Summer Bajra 0.81 816.67 2698.0 0.83 2.64
8 Wheat 0.75 858.33 4399.1 0.96 4.75
Source: Author’s own analysis using primary data
Table 8: Crop Economics, Post Check Dam Construction
Sr.
No
Name of Crop Depth of
Irrigatio
n
Yield
(kg/bigha
)
Net
Return
(Rs/bigha)
Applied Water Productivity
(Kg/m3) (Rs/m
3)
1 Kharif Groundnut 200.00 1937.5 2 Summer Groundnut 240.00 2525.0 0.14 1.36
3 Cotton 1.09 464.54 8189.3 0.41 7.29
4 Sugarcane 3.28 21702.4 16315.9 4.96 3.63
5 Kharif Bajra 0.14 646.67 2601.0 0.89 N.A. 6 Winter Bajra 1.31 850.00 3825.0 0.60 2.27
7 Summer Bajra 1.58 932.14 5537.5 0.99 5.50
8 Wheat 1.10 900.00 7529.6 0.64 5.12
Source: Author’s own analysis using primary data

IJART- Vol-1, Issue-2, December, 2016 Available online at http://www.ijart.info/ IMPACT FACTOR- 1.625
105 Niranjan and Srinivasu, 2016
@IJART-2016, All Rights Reserved
Due to the shift in cropping pattern towards high valued crops, the overall farm income increased by nearly
Rs.3700 per bigha of land, when we considered only seven of the crops, with the current cropping pattern
(Figure 6).
B. Impact of Mined Out Areas on Crops and
Income
Analysis similar to what has been done in the case of
check dam was carried out for farms, which were
likely to be benefited by the mined out areas. The
results are presented in Table 9. Comparison of net
income from crops viz., groundnut, bajra, sugarcane
and wheat shows that during the post water
impoundment period, the sample farmers secured
much higher income as compared to pre intervention
period. But, the yield was higher only for
sugarcane, whereas in the case of kharif groundnut
and summer groundnut, the yield was actually lower
after water was introduced in the reservoir. But, not
less important is the fact significant differences in
cropping pattern exist between pre and post reservoir
scenarios. The cropping pattern during thepost
reservoir period is dominated water intensive
sugarcane with 34 per cent of the gross cropped area
under this crop. In contrast to this, the cropping
pattern during the pre reservoir period was dominated
by wheat and kharif groundnut. This essentially
means that for the crops for which farmers are
allocating more land, there are able to secure much
higher yields.
Table 9: Irrigation Depth, Yield, Net Return and Water Productivity of Crops in the Mined Out Area
during Pre and Post Reservoir Periods
Sr.
No
Crop Name Before Reservoir After Reservoir
Yield
(kg/bigha)
Net Return
(Rs/bigha)
Y i e l d
(Kg/bigha)
Net Return
(Rs/bigha)
1 Kharif Groundnut 603.8 5141 495 5562.5
2 Summer Groundnut 900 9375 600 9250
5 Sugarcane 30357 16438 31224 27207

IJART- Vol-1, Issue-2, December, 2016 Available online at http://www.ijart.info/ IMPACT FACTOR- 1.625
106 Niranjan and Srinivasu, 2016
@IJART-2016, All Rights Reserved
Source: Author’s own analysis using primary data
Table 10: Cropping Pattern in the Mined Out Area during Pre and Post Reservoir Periods
Sr.
No
Crop Pre Mined Out Post Mined Out
Area (Bigha) % Area Area (bigha) % Area
1 Kharif Groundnut 25 27.55 18 24.16
2 Summer groundnut 16 17.63 8 10.74
3 Kharif Bajra 4 4.41 2 2.68
4 Winter Bajra 4 4.41 4 5.37
5 Summer Bajra 0 0.00 2 2.68
6 Sugarcane 13.5 14.88 25.5 34.23
7 Wheat 27.25 30.03 15 20.13
8 Jowar 1 1.10 0 0.00
Total Area 90.75 74.5
Source: Author’s own analysis using primary data
C. Impact of Link Canal in the Coastal Area
Interlinking of small rivers and rivulets of Junagadh
draining into the ocean was an innovative measure by
Ambuja Cement Foundation in Kodinar area. When
one area or basin receives good rainfall, another area
or basin next to it experiences rainfall deficit.
Excessive runoff in the high rainfall areas often
causes flash floods, and at the same time, there are
significant constraints induced by the topography on
harvesting this flood runoff using impoundments
and utilizing it within the same basin including
recharging of aquifers. Therefore, link canals were
dug to connect these rivers. There are three such link
canals in Kodinar area. These canals have three
hydraulic functions. First: the water stored in these
canals creates a hydraulic barrier for the saline water
from intruding into the freshwater aquifers by
exerting hydrostatic pressure. Second: the water
stored in these link canals provide opportunity for
the farmers located on their banks to lift the water
and use for crop production. Third: they also
recharge the aquifers in those areas where the
rainfall hasn’t been adequate.
A survey of farmers whose farms are located on
the banks of the link canal was carried out to
understand the impact of this intervention on the
farming enterprise. Data on area cropped, area
irrigated, inputs, including irrigation dosages, crop
yields, and prices were collected from these farmers
for one (crop) year during both pre and post
intervention periods. They were analyzed and the
results are presented in Table 11 and Table 12
respectively for pre and post intervention periods.
Comparing the results for pre and post
interventions, it appears that the average net income
from all the four irrigated crops, viz. kharif bajra,
summer bajra and wheat went up after the
introduction of the link canal. But, the yield was
higher only for wheat. Here, again, a shift in cropping
pattern towards sugarcane was seen, though reliable
data on the yield and net income from this crop was
not available.

IJART- Vol-1, Issue-2, December, 2016 Available online at http://www.ijart.info/ IMPACT FACTOR- 1.625
107 Niranjan and Srinivasu, 2016
@IJART-2016, All Rights Reserved
Table 11: Irrigation Depth, Yield, Net Return and Water Productivity of Crops in the Link Canal Area
during Pre Construction
Sr.
No
Crop Name Depth of
Irrigation
(m)
(Mean)
Y i e l d
(Kg/Bigha)
Net Return
(Rs/Bigha)
Water Productivity Physical
(Kg/m3)
Mean
Economic
(Rs/m3)
Mean 1 Kharif Bajra 614.8 1686
2 Summer Bajra 0.92 800 2450 0.53 1.63
3 Wheat 0.9 580 2260 0.398 1.14
Source: authors’ own analysis using primary data
Table 12: Irrigation Depth, Yield, Net Return and Water Productivity of Crops in the Link Canal Area
during Post Link Canal Construction
Sr.
No.
Crop Name Depth of
Irrigation (m)
(Mean)
Yield
(Kg/Big
ha)
Net Return
(Rs/Bigha)
Water Productivity Physical
(Kg/m3)
M e a n
Economic
(Rs/m3)
Mean
1 Kharif Bajra 900 4550
2 Summer Bajra 0.48 700 2728 0.587 2.29 3 Wheat 0.81 752 6100 0.58 4.6
Source: authors’ own analysis using primary data
7. ENVIRONMENTAL IMPERATIVES
Intensive water harvesting in watersheds located in
the upper catchments of basins located in semi-arid
and arid regions of India can cause ecological
damages in the downstream areas (Kumar et al.,
2006; 2008a). One of the reasons is that the basin
could experience years of lowrainfall, which
produce very low volumes of runoff. In fact, in such
regions, in years of lowrainfall, the runoff would be
disproportionately lower than that in high rainfall
years, as evident from the rainfall-runoff
relationship estimated for the basin. These are years
which require a lot of attention in basin-wide water
resource, from ecological health point of view. Care
should be taken to see that water harvesting
systems that are being built do not capture the
committed flows.
In the case of check dams built in Harmadiya
and other villages in Singoda basin, the runoff
water which is being tapped, is actually the
outflows from a medium reservoir, built upstream
for Singoda irrigation scheme of the government of
Gujarat, and the runoff generated in the residual
catchment of the basin. Hence, the issue of
downstream impact is not major in this case.
Nevertheless, stretch of the rivers in the coastal belt
could still suffer from environmental water stress in
years of low rainfall, owing to the water
impoundment happening upstream due to the water
harvesting structures such as the check dams. The
Chart below (Figure 7) shows that in a little less

IJART- Vol-1, Issue-2, December, 2016 Available online at http://www.ijart.info/ IMPACT FACTOR- 1.625
108 Niranjan and Srinivasu, 2016
@IJART-2016, All Rights Reserved
than 50 per cent of the years, there is no excess flow
from the reservoir upstream. Therefore, future
building of water harvesting systems should take this
aspect into consideration. The total water
impounding capacity of the structures in the basin
should not exceed the outflows which occur at 60 per
cent dependability and the runoff from the residual
catchment.
Because of the heavy overflow from the upper
catchment, in years of good rainfall, the water
harvesting structures, which are built in a series,
create large lakes in the coastal areas, which remain
till the end of winter and sometimes even during
summer. The water from these reservoirs is being
used by villagers for a variety of purposes.
MAJOR FINDINGS
• The basins in Kodinar are characterized by
flows with high variability. The runoff increases
exponentially with the rainfall, as suggested by
the rainfall-runoff relationship estimated for
Singoda basin. The mean annual rainfall in the
area is around 830mm. In nearly 50 per cent of
the years, the river has huge outflows.
Therefore, the strategy to transfer water from
the rivers and streams through link canals to
adjacent basins and store in mined out areas, in
addition to building water harvesting and
recharge structures such as check dams, is
sound. It helps improve the cost effectiveness of
water harvesting as the utilization potential of the
runoff is increased without much increase in the
storage capacity of the reservoirs.
Analysis of hydrological impact of check dams
in Harmadiya shows huge impact on
groundwater regime, as indicated by higher
average pre-post monsoon rise in water levels in
the influence area of check dams, as compared
to those outside the influence area. While the
average increase in water level rise in the wells
(due to monsoon rains) surrounding the check
dam post intervention was 31.60, it was only
25.06 feet for the wells located outside the
influence area of the check dam. This is quite
different from the conventional approach of
looking at the rise in water level between pre
and post monsoon of the wells located in the
vicinity of the water harvesting structure, and
nullify the effect of during monsoon rainfall and
likelihood of occurrence of greater rainfall in the
locality during the year of observation and its
effect on recharge of groundwater.

IJART- Vol-1, Issue-2, December, 2016 Available online at http://www.ijart.info/ IMPACT FACTOR- 1.625
109 Niranjan and Srinivasu, 2016
@IJART-2016, All Rights Reserved
The average recharge induced by the check dams
in Harmadiya village was estimated to be 3.6cm,
which is about 4.5 per cent of the rainfall. For a
region with such hydrological, topographical
and geo-hydrological features, the artificial
recharge contribution, over and above the natural
recharge from monsoon rainfall, is quite
significant.
The extent of water harvesting interventions
undertaken by the Foundation and the local
hydrological benefits they generate is evident
from the fact that the increase in water spread
area created by these impounding systems was
around 3024ha, during the monsoon of 2010.
High water table also meant high well yields, in
view of the fact that the thickness of the aquifer
increases. Higher depth to water table also
means the farmers have to use less amount of
energy available from electric motors for
pumping groundwater. Higher well yields
reduced the time spent in irrigating unit area of
the crops. Greater well output also meant larger
area of the farm under irrigation, increasing the
overall farm outputs.
Though no increase in area under irrigation was
observed, a larger proportion of the cropped
area was allocated to water intensive irrigated
crops after the intervention, particularly
sugarcane that give the highest returns per unit
area of land amongst all the crops grown in that
area. The same trend was found in the influence
area of link canals and the farms surrounding
the reservoir created by the mined out area.
The overall increase in farm income per bigha
of land, for the existing cropping pattern was
estimated to be Rs. 3708, when only the area
under seven important crops within that unit
area was considered. Similar trend in cropping
pattern shift was seen in the case of The farmers
allocated greater proportion of their land to
irrigated sugarcane after the interventions. But, a
worrisome trend is the tendency among the
farmers to shift to highly water intensive
sugarcane, which earns them high returns per
every unit of land, but gives very low water
productivity in economic terms (Rs.3 .6/m3) as
compared to wheat (Rs.5.1/ m3) and cotton
(Rs.7.3/m3).
The environmental impact of the water
harvesting structures built in a series in Singoda
basin is positive, as they create many lakes in
streams of different orders. They change the
micro climate through evaporation. The water
is also being used by women and children for
bathing, washing clothes, animal drinking and
recreational purpose. However, care should be
exercised while building more structures in
future in this basin, and should be limited by the
excess flows from the medium reservoir
upstream and the total residual catchments.
BEYOND WATER HARVESTING: HOW
BEST TO IMPROVE THE ECONOMIC
RETURNS FROM WATER HARVESTING?
The check dams and other water harvesting
/recharge structures built by ACF create impact
on the farm economy of the area in several ways.
First: the continuous recharge from the reservoir
created by the structure keeps the water level in
the influence area high. But, it is important to
note that the effectiveness of the intervention lies
in making water available in the reservoirs when
water levels in the aquifer starts drawing down.
As noted by Kumar et al. (2006) and (2008), in
the content of hard rock areas of Saurashtra,
during years of good rainfall, the aquifers
overflow leaving no space for the incoming
flows from the reservoirs.
In the case of Singoda River, in good rainfall
years, continuous stream-flow is available from
IJART- Vol-1, Issue-2, December, 2016 Available online at http://www.ijart.info/ IMPACT FACTOR- 1.625
110 Niranjan and Srinivasu, 2016
@IJART-2016, All Rights Reserved
the hilly, forested upper catchment, providing
continuous inflow into the reservoirs created by
the check dams, while water is drawn from the
underlying aquifers, creating storage space for
the impounded water. The contribution of check
dam in providing additional recharge is evident
from the higher, post-pre monsoon rise in water
levels in the wells near the check dams as
compared to those located away from the check
dams.
But, there are limits to water harvesting in these
basins, imposed by the hydrology and stream-flows.
The next generation of interventions in the area should
focus on improving the productivity of use of water.
As the study shows, with improved recharge from
the water harvesting/recharge structures, the farmers
are increasingly using the water from their wells to
highly water intensive sugarcane, merely because it
gives high return per unit of land cultivated. Water
productivity of this crop in relation to the irrigation
water applied is very low under the traditional method
of irrigation. Hence the attempt should be to promote
water efficient irrigation among sugarcane growers
or introduce new crops which yield high returns, but
consume less amount of water.
ACKNOWLEDGEMENT
This paper is based on a study “Study of natural
resources management for strengthening Agro -
based rural livelihoods in ecologically fragile
regions of Gujarat and Rajastan”, supported by
Ambuja Cement Foundation (ACF), Mumbai. We are
thankful to officials of ACF Mr. Chandrakant
Kumbhani and Dalsukh Vaghasiya for their
cooperation and suggestions. We are thankful to Dr.
M. Dinesh Kumar, Executive Director, Institute for
Resource Analysis and Policy, who supervised and
guided us in all our pursuits. We are also thankful to
Dr. MVK Sivamohan, Principal Consultant,
Institute for Resource Analysis and Policy, who
provided suggestions and guidance in bringing out
this paper.
REFERENCES
Bachelor, Charles, Ashok Singh, MS Rama Mohan
Rao and Johan Butterworth (2002) Mitigation the
Potential Unintended Impacts of Water Harvesting,
paper presented at the IWRA International Regional
Symposium ‘Water for Human Survival’, 26-29
November, 2002, Hotel Taj Palace, New Delhi.
Coastal Salinity Prevention Cell (2008), Baseline
Study of Coastal Villages affected by Salinity
Ingress in Junagadh District, CSPC, Gujarat
Kumar, M. Dinesh (2000) Dug-well Recharging in
Saurashtra: Are the Benefits and Impacts Over-
stretched? Journal of Indian Water Resources
Society, July, Roorkee.
Kumar, M. Dinesh et al (2006) Rainwater
Harvesting in India: Some Critical Issues for Basin
Planning and Research, land use and water
resources research, 6 (1): 1-17.
Kumar, M. Dinesh et al (2008) Chasing a Mirage:
Water harvesting and Artificial Recharge in
Naturally Water-Scarce Regions, Economic and
Political Weekly, August, 2008.
Kumar, M. Dinesh, Hugh Turral, Bharat Sharma,
Upali Amarasinghe and O. P. Singh (2008a) “Water
Saving and Yield Enhancing Micro Irrigation
Technologies in India: When and where can they
become best bet technologies?” paper presented at
the 7th Annual Partners’ Meet of IWMI-Tata Water
Policy Research program, ICRISAT, Hyderabad.
Kumar, M. Dinesh and Upali Amarasinghe (Eds)
(2009) Water Productivity Improvements in Indian
IJART- Vol-1, Issue-2, December, 2016 Available online at http://www.ijart.info/ IMPACT FACTOR- 1.625
111 Niranjan and Srinivasu, 2016
@IJART-2016, All Rights Reserved
Agriculture: Potentials, Constraints and Prospects,
Strategic Analysis of the National River Linking
Project (NRLP) Series 4, Colombo: International
Water Management Institute.
Mayya, G S (2005): ‘Water Harvesting and
Groundwater Recharge in the West Coast of India –
The Myth and the Truth’, 4th IWMI Tata Annual
Partners’ Meet, Institute of Rural Management
Anand, February 24-2 6.
Ray, Sunil and Mahesh Bijarnia (2006): ‘Upstream vs
Downstream: Groundwater Management and
Rainwater Harvesting’, Economic & Political
Weekly, July 1.
Seckler, D (1996): ‘The new era of water resources
management: From “Dry” to “Wet” water
savings’, Research report 1. Colombo: International
Irrigation Management Institute.