small hvac problems and potential savings reports the “small hvac problems and potential savings...
TRANSCRIPT
CALIFORNIA ENERGY
COMMISSION
Small HVAC Problems and Potential Savings Reports
Summary of Problems in Each Building (product 4.5.1) Statewide Energy Impact (product 4.5.3)
TE
CH
NIC
AL
REP
OR
T
October 2003 P500-03-082-A-25
Gray Davis, Governor


CALIFORNIA
ENERGY
COMMISSION
Prepared By: Architectural Energy Corporation Pete Jacobs, Lead Author Boulder, Colorado Managed By: New Buildings Institute Cathy Higgins, Program Director White Salmon, Washington CEC Contract No. 400-99-013 Prepared For: Donald Aumann, Contract Manager Nancy Jenkins, PIER Buildings Program Manager Terry Surles, PIER Program Director Robert L. Therkelsen Executive Director DISCLAIMER This report was prepared as the result of work sponsored by the
California Energy Commission. It does not necessarily represent the views of the Energy Commission, its employees or the State of California. The Energy Commission, the State of California, its employees, contractors and subcontractors make no warrant, express or implied, and assume no legal liability for the information in this report; nor does any party represent that the uses of this information will not infringe upon privately owned rights. This report has not been approved or disapproved by the California Energy Commission nor has the California Energy Commission passed upon the accuracy or adequacy of the information in this report.


ACKNOWLEDGEMENTS The products and outcomes presented in this report are part of the Integrated Design of Small Commercial HVAC Systems research project. The reports are a result of funding provided by the California Energy Commission’s Public Interest Energy Research (PIER) program on behalf of the citizens of California. Architectural Energy Corporation would like to acknowledge the support and contributions of the individuals below:
Program and Contract Management: Cathy Higgins, New Buildings Institute; Don Aumann, California Energy Commission.
Technical Advisory Group (TAG): Tudi Hassl of Portland Energy Conservation, Inc. (PECI), Jan Johnson of Southern California Edison, John Proctor of Proctor Engineering Group, Richard Lord of Carrier Corporation, Dr. Mark Modera of Carrier Aeroseal.
Architectural Energy Corporation Project Team: Pete Jacobs led the project, with AEC staff support from Dave Roberts, Tracy Phillips, Erik Jeanette, John Wood, Matthew Potts, Kosol Kiatreungwattana, Pablo Calderon-Rodriguez and Judie Porter. RLW Analytics as a subcontractor provided field testing and engineering support and statistical analysis, including contributions from Roger Wright, Matt Brost, Jeff Staller, Eric Swan, Amber Watkins and Stacia Okura. Eskinder Berhanu, Principal of Eskinder Berhanu Associates also provided field testing and engineering support.
Additional Support: Alan Cowan and Jeff Johnson of New Buildings Institute, project technical review and Design Guide review; Darren Goody of PECI, Design Guide Review.
PREFACE The Public Interest Energy Research (PIER) Program supports public interest energy research and development that will help improve the quality of life in California by bringing environmentally safe, affordable, and reliable energy services and products to the marketplace.
This document is one of 33 technical attachments to the final report of a larger research effort called Integrated Energy Systems: Productivity and Building Science Program (Program) as part of the PIER Program funded by the California Energy Commission (Commission) and managed by the New Buildings Institute.
As the name suggests, it is not individual building components, equipment, or materials that optimize energy efficiency. Instead, energy efficiency is improved through the integrated design, construction, and operation of building systems. The Integrated Energy Systems: Productivity and Building Science Program research addressed six areas:
Productivity and Interior Environments
Integrated Design of Large Commercial HVAC Systems
Integrated Design of Small Commercial HVAC Systems
Integrated Design of Commercial Building Ceiling Systems
Integrated Design of Residential Ducting & Air Flow Systems
Outdoor Lighting Baseline Assessment The Program’s final report (Commission publication #P500-03-082) and its attachments are intended to provide a complete record of the objectives, methods, findings and accomplishments of the Integrated Energy Systems: Productivity and Building Science Program. The final report and attachments are highly applicable to architects, designers, contractors, building owners and operators, manufacturers, researchers, and the energy efficiency community.
This attachment, “Small HVAC Problems and Potential Savings Reports” (Attachment A-25), provides supplemental information to the program’s final report within the Integrated Design of Small Commercial HVAC Systems research area. It includes the following reports:
1. Summary of Problems in Each Building. This report describes the underlying causes of faults or suboptimum performance in the small package HVAC units in each monitored building, along with appendices.
2. Statewide Energy Impact. The focus of the Integrated Design of Small Commercial HVAC Systems project was system-integration issues affecting the installed efficiency of small packaged HVAC systems, defined as single package rooftop air conditioners and heat pumps with cooling capacity of 10 tons or less. This report provides estimates of the statewide energy-savings impacts of correcting the performance problems uncovered during this research project, along with appendices.
The Buildings Program Area within the Public Interest Energy Research (PIER) Program produced these documents as part of a multi-project programmatic contract (#400-99-413). The Buildings Program includes new and existing buildings in both the residential and the non-residential sectors.
The program seeks to decrease building energy use through research that will develop or improve energy efficient technologies, strategies, tools, and building performance evaluation methods.
For other reports produced within this contract or to obtain more information on the PIER Program, please visit www.energy.ca.gov/pier/buildings or contact the Commission’s Publications Unit at 916-654-5200. All reports, guidelines and attachments are also publicly available at www.newbuildings.org/pier.
ABSTRACT The “Small HVAC Problems and Potential Savings Reports” consists of two reports produced by the Integrated Design of Small Commercial HVAC Systems project. This was one of six research projects within the Integrated Energy Systems: Productivity and Building Science Program, funded by the California Energy Commission’s Public Interest Energy Research (PIER) Program.
This project conducted short-term monitoring of packaged HVAC systems up to 10 tons per unit, identified problems that lead to poor system performance, and recommended solutions. A total of 215 units at 75 sites were monitored. This attachment consists of two documents:
Summary of Problems in Each Building. Describes the causes of suboptimum performance in the small package HVAC units in each monitored building
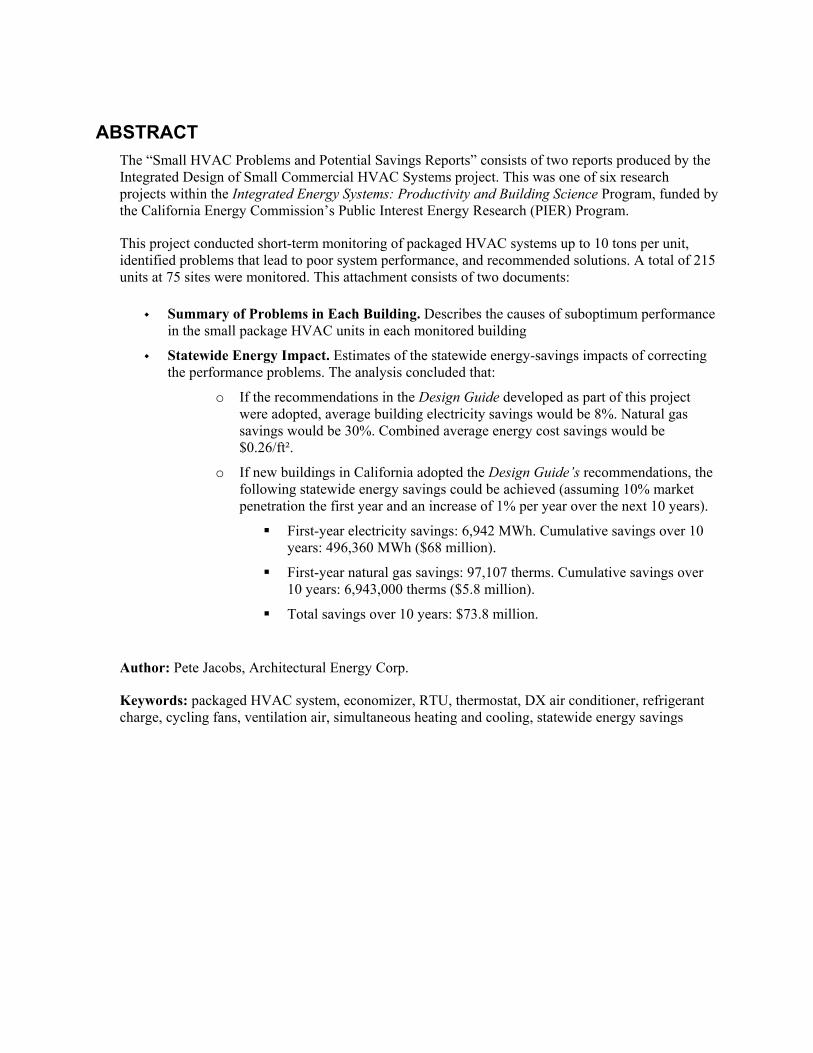
Statewide Energy Impact. Estimates of the statewide energy-savings impacts of correcting the performance problems. The analysis concluded that:
o If the recommendations in the Design Guide developed as part of this project were adopted, average building electricity savings would be 8%. Natural gas savings would be 30%. Combined average energy cost savings would be $0.26/ft².
o If new buildings in California adopted the Design Guide’s recommendations, the following statewide energy savings could be achieved (assuming 10% market penetration the first year and an increase of 1% per year over the next 10 years).
First-year electricity savings: 6,942 MWh. Cumulative savings over 10 years: 496,360 MWh ($68 million).
First-year natural gas savings: 97,107 therms. Cumulative savings over 10 years: 6,943,000 therms ($5.8 million).
Total savings over 10 years: $73.8 million.
Author: Pete Jacobs, Architectural Energy Corp.
Keywords: packaged HVAC system, economizer, RTU, thermostat, DX air conditioner, refrigerant charge, cycling fans, ventilation air, simultaneous heating and cooling, statewide energy savings

Integrated Energy Systems
Productivity & Building Science Program
A project of the State of California PIER Program
Element Four – Integrated Design of Small Commercial HVAC Systems
Summary of Problems Observed in Field Studies of Small HVAC Units
Deliverable for Task 4.5.1

Summary of Problems - Small HVAC Units
Architectural Energy Corporation 1
INTRODUCTION
This document presents a summary of the results of the field studies conducted for Element 4 of the New Buildings Institute Integrated Energy Systems - Productivity & Building Science Program. The focus of Element 4 is system integration issues affecting the installed efficiency of small packaged HVAC systems. For the purposes of this project, small systems are defined as single package rooftop air conditioners and heat pumps with cooling capacity of 10 tons or less.
FIELD TESTING To conduct this research, teams of engineers visited 75 newly constructed commercial buildings throughout California. A total of 215 rooftop units were surveyed. Units were subjected to a physical inspection, a series of one-time tests, and/or short-term monitoring of unit performance. Up to four units per building were selected for study. Sites were selected at random to represent a cross-section of statewide new construction activity. The population was defined using a listing of new construction projects obtained from F. W. Dodge. The Dodge database seeks to list all new construction projects that are valued over $200,000 and are expected to start within 60 days. The data include renovations and expansions as well as entirely new buildings.1 These data were filtered to exclude projects not in the scope of this study, such as roads, bridges, public works, and so on. New construction, as defined in this study, included buildings that were “green field” new construction, additions or major “gut” renovations. Projects four years old or newer were included in the study. A sample of projects representative of California non-residential new construction was selected based on a sample size of 82 total projects. The actual study sample compared with the original sample design is shown in Figure 1. A list of the sites in the study is shown in Appendix A.
1 The data are thought to cover over 95% of all projects that are competitively bid.

Summary of Problems - Small HVAC Units
Architectural Energy Corporation 2
0
5
10
15
20
25
Assem
bly
Grocery
Office
Other
Restau
rant
Retail
Schoo
l
Ware
hous
e
ActualTarget
Figure 1. Sample design and Actual Building Sample The initial study design called for all sites to be completed during the summer and fall of 2001. Difficulty in scheduling on-site surveys in the wake of the September 11, 2001 terrorist attacks delayed the project, forcing a second round of site studies during the summer of 2002. The sample was completed for most building types except for offices, which were difficult to identify and recruit. The reduced sample size is not expected to impact the statistical validity of the results, since the frequency of the problems observed is quite high and independent of building type. Lessons learned during round one lead to a revision in the field testing and data analysis protocol for round two sites. Initially, the impacts of problems observed were to be calculated for each of the 82 buildings in the study, and the results of the impacts for this sample would be projected to the statewide level. The focus in round two was shifted from studying the entire building, including the HVAC system to a more detailed study of the HVAC system alone. The field work was used to estimate the frequency of problems in the field, and the impact of these problems across a wide variety of building types and sizes was estimated using the Statewide Non-Residential New Construction (NRNC) database (RLW, 1999). The statewide estimates of energy impacts from avoiding the problems was estimated by applying the study statistics across a sample of 990 new commercial buildings in the NRNC database. This approach allowed for a more detailed study of the HVAC systems and a more robust estimate of the statewide impacts than the original study design. See the Impact Analysis report (AEC, 2003) for more information on the statewide impact estimation process.
Summary of Problems - Small HVAC Units
Architectural Energy Corporation 3
Field Testing for Round One.
Field testing was conducted in two rounds. The first round procedures are described as follows:
Onsite survey The on-site survey gathered information on building shell, lighting, internal loads, operating schedules, and so on, sufficient to develop a DOE-2 model of each space served by the treated units. Building characteristics data were entered into a Microsoft Access database by the surveyor.
One-time tests The second level of data collection involved a series of one-time tests conducted on the units selected for study. These tests included:
Fan Power. The unit was cycled through each mode of operation (standby, fan-only, cooling stage one, and cooling stage two, if applicable) and the true electric power and current of the unit were measured during each mode using a portable wattmeter.
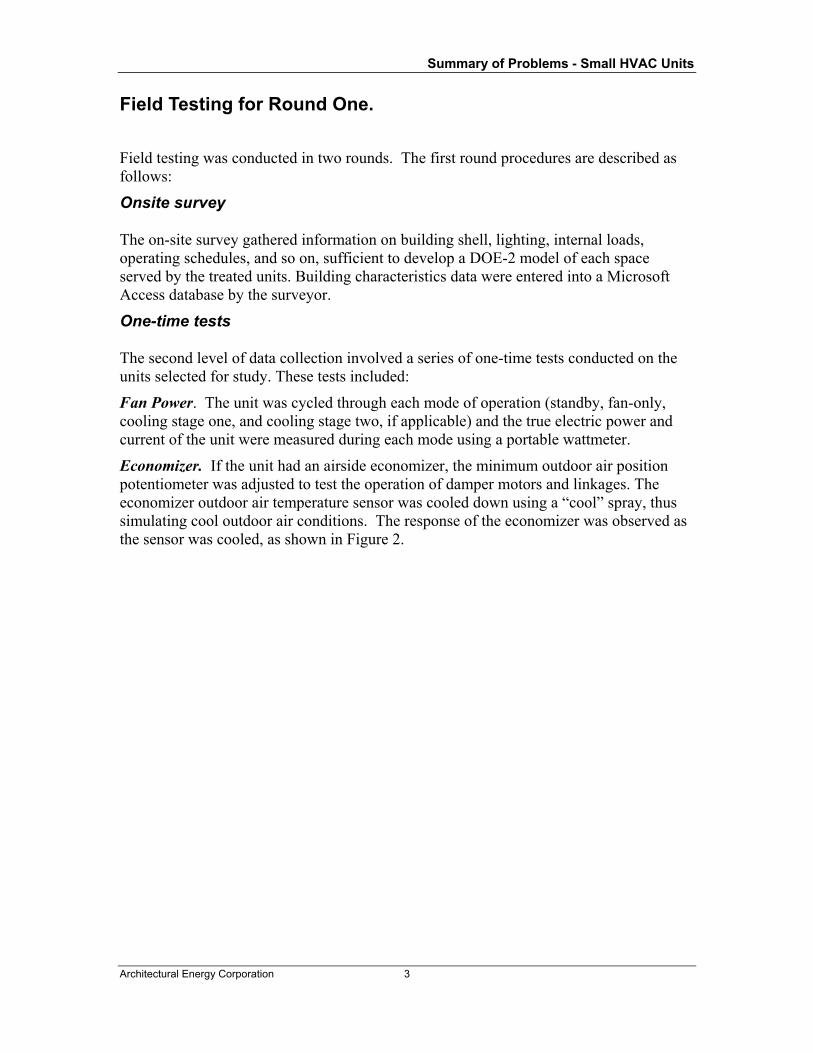
Economizer. If the unit had an airside economizer, the minimum outdoor air position potentiometer was adjusted to test the operation of damper motors and linkages. The economizer outdoor air temperature sensor was cooled down using a “cool” spray, thus simulating cool outdoor air conditions. The response of the economizer was observed as the sensor was cooled, as shown in Figure 2.
Summary of Problems - Small HVAC Units
Architectural Energy Corporation 4
Figure 2. Cool spray (see red tube to left of “D” on damper assembly) used to cool down outdoor temperature sensor
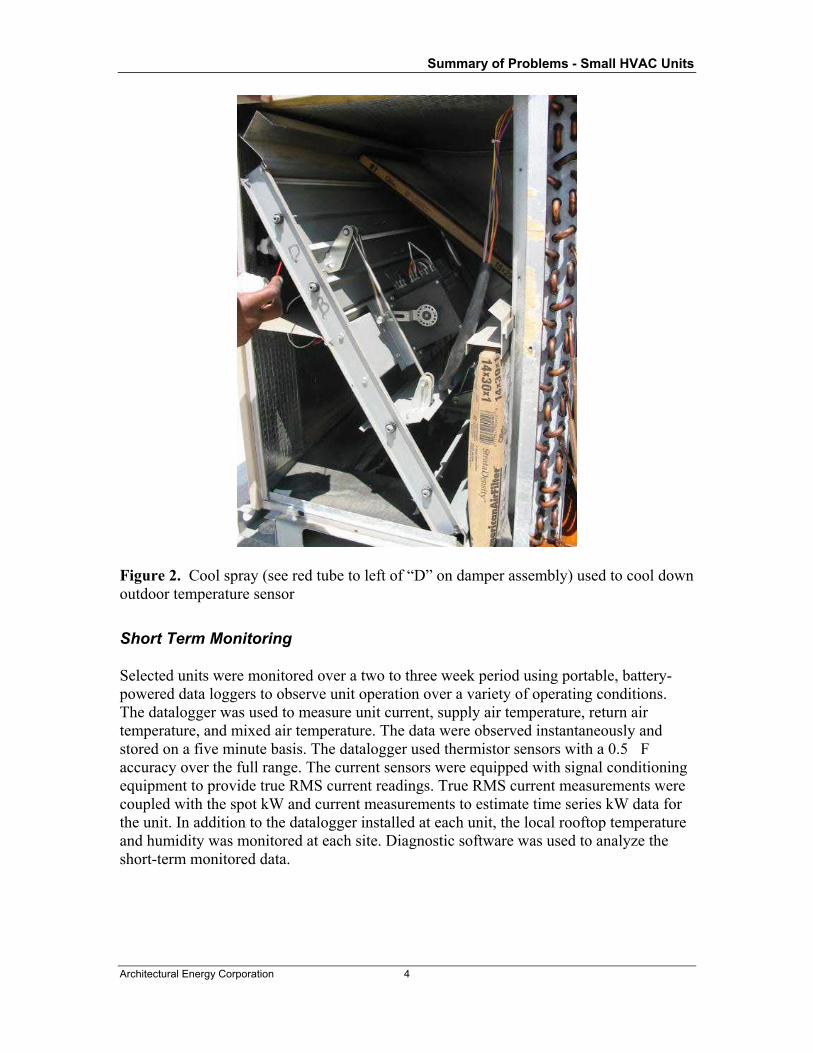
Short Term Monitoring Selected units were monitored over a two to three week period using portable, battery-powered data loggers to observe unit operation over a variety of operating conditions. The datalogger was used to measure unit current, supply air temperature, return air temperature, and mixed air temperature. The data were observed instantaneously and stored on a five minute basis. The datalogger used thermistor sensors with a 0.5�F accuracy over the full range. The current sensors were equipped with signal conditioning equipment to provide true RMS current readings. True RMS current measurements were coupled with the spot kW and current measurements to estimate time series kW data for the unit. In addition to the datalogger installed at each unit, the local rooftop temperature and humidity was monitored at each site. Diagnostic software was used to analyze the short-term monitored data.
Summary of Problems - Small HVAC Units
Architectural Energy Corporation 5
Figure 3. Unit prepared for short term monitoring using battery powered datalogger.
Field Testing for Round 2 The second round of testing focused less on the building characteristics and more on the quantitative nature of the problems with the systems. A series of new diagnostic tests were introduced in lieu of a full on-site survey of the building. An interview with the site contact on building operations and maintenance procedures was conducted. Thermostat make and model numbers were collected to see if the thermostats were appropriate for commercial building applications. The thermostat control settings were observed and the calibration of the thermostat sensor was checked. Thermostat location was noted and compared to the spaces served by the system.
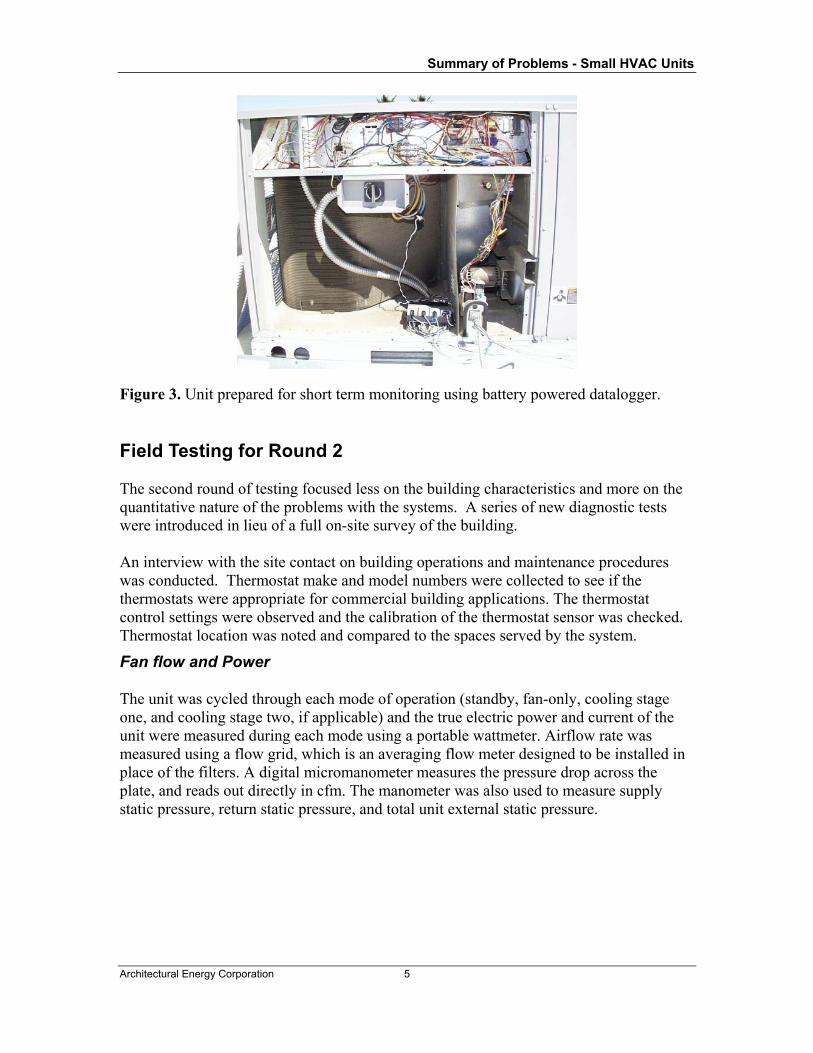
Fan flow and Power The unit was cycled through each mode of operation (standby, fan-only, cooling stage one, and cooling stage two, if applicable) and the true electric power and current of the unit were measured during each mode using a portable wattmeter. Airflow rate was measured using a flow grid, which is an averaging flow meter designed to be installed in place of the filters. A digital micromanometer measures the pressure drop across the plate, and reads out directly in cfm. The manometer was also used to measure supply static pressure, return static pressure, and total unit external static pressure.
Summary of Problems - Small HVAC Units
Architectural Energy Corporation 6
Figure 4. Flow Grids used to measure unit flow rate. Flow grid assembly and digital micromanometer are shown on the left. Flowgrid installation in place of unit filters is shown on the right.
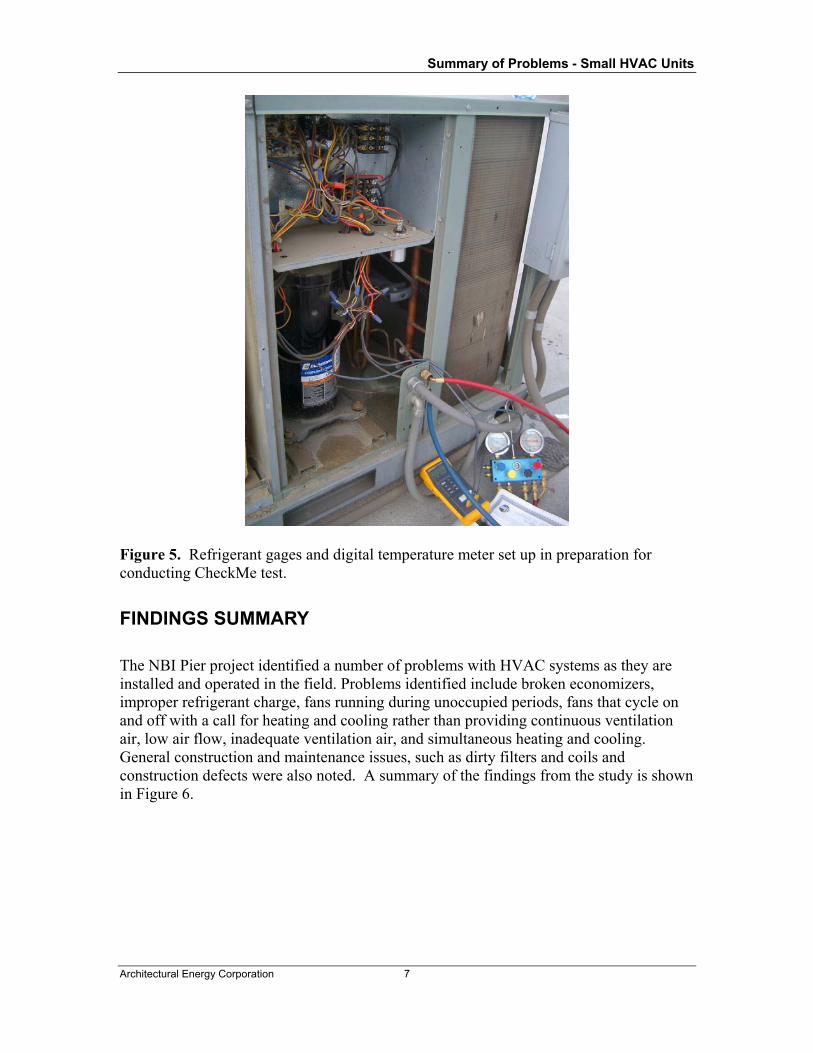
Refrigerant charge
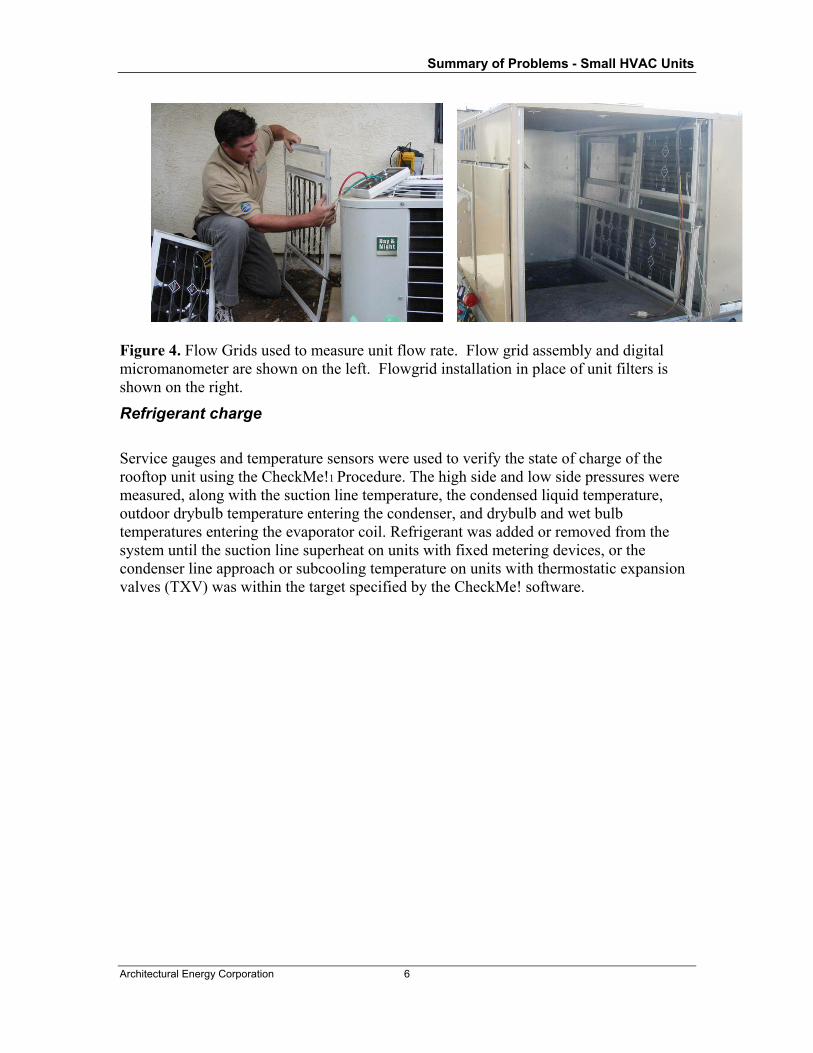
Service gauges and temperature sensors were used to verify the state of charge of the rooftop unit using the CheckMe!1 Procedure. The high side and low side pressures were measured, along with the suction line temperature, the condensed liquid temperature, outdoor drybulb temperature entering the condenser, and drybulb and wet bulb temperatures entering the evaporator coil. Refrigerant was added or removed from the system until the suction line superheat on units with fixed metering devices, or the condenser line approach or subcooling temperature on units with thermostatic expansion valves (TXV) was within the target specified by the CheckMe! software.
Summary of Problems - Small HVAC Units
Architectural Energy Corporation 7
Figure 5. Refrigerant gages and digital temperature meter set up in preparation for conducting CheckMe test.
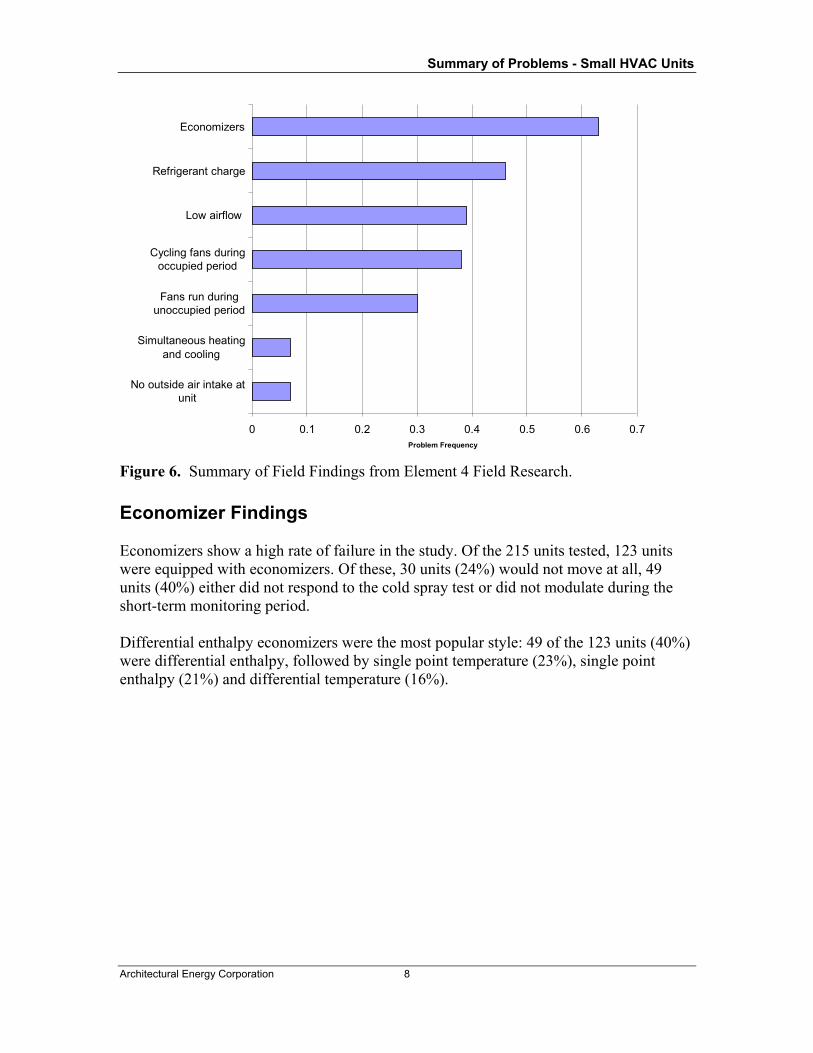
FINDINGS SUMMARY The NBI Pier project identified a number of problems with HVAC systems as they are installed and operated in the field. Problems identified include broken economizers, improper refrigerant charge, fans running during unoccupied periods, fans that cycle on and off with a call for heating and cooling rather than providing continuous ventilation air, low air flow, inadequate ventilation air, and simultaneous heating and cooling. General construction and maintenance issues, such as dirty filters and coils and construction defects were also noted. A summary of the findings from the study is shown in Figure 6.
Summary of Problems - Small HVAC Units
Architectural Energy Corporation 8
0 0.1 0.2 0.3 0.4 0.5 0.6 0.7
No outside air intake atunit
Simultaneous heating and cooling
Fans run during unoccupied period
Cycling fans during occupied period
Low airflow
Refrigerant charge
Economizers
Problem Frequency
Figure 6. Summary of Field Findings from Element 4 Field Research.
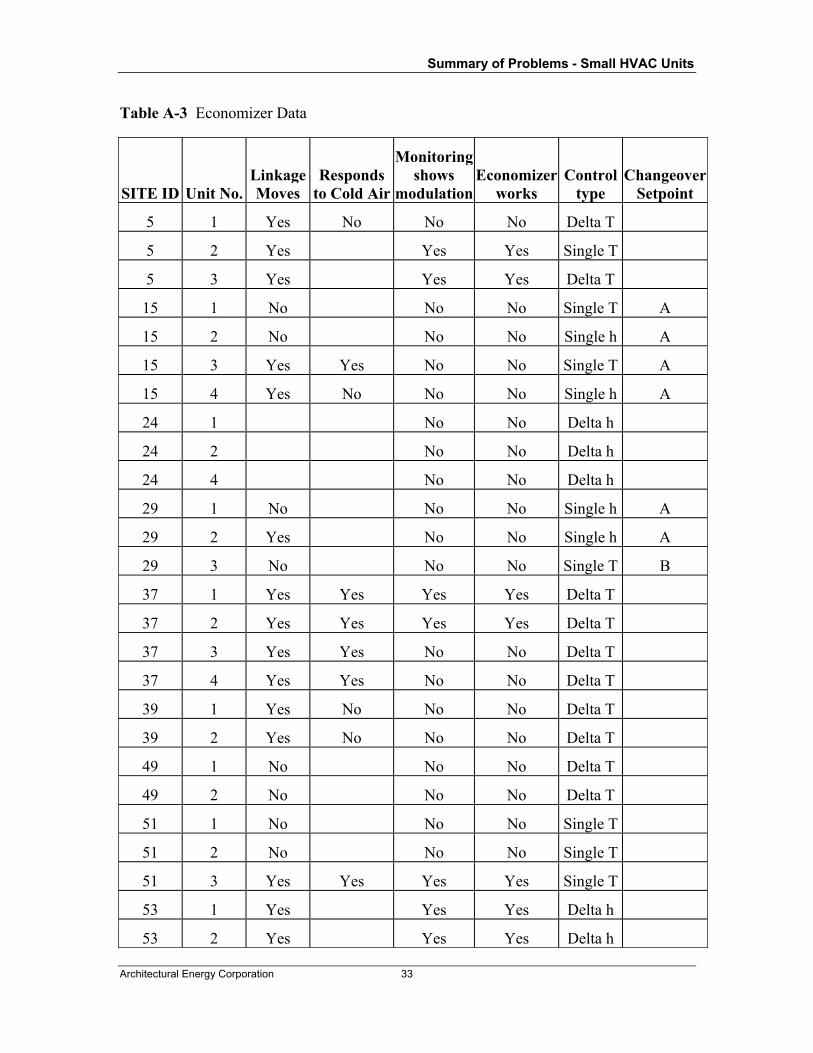
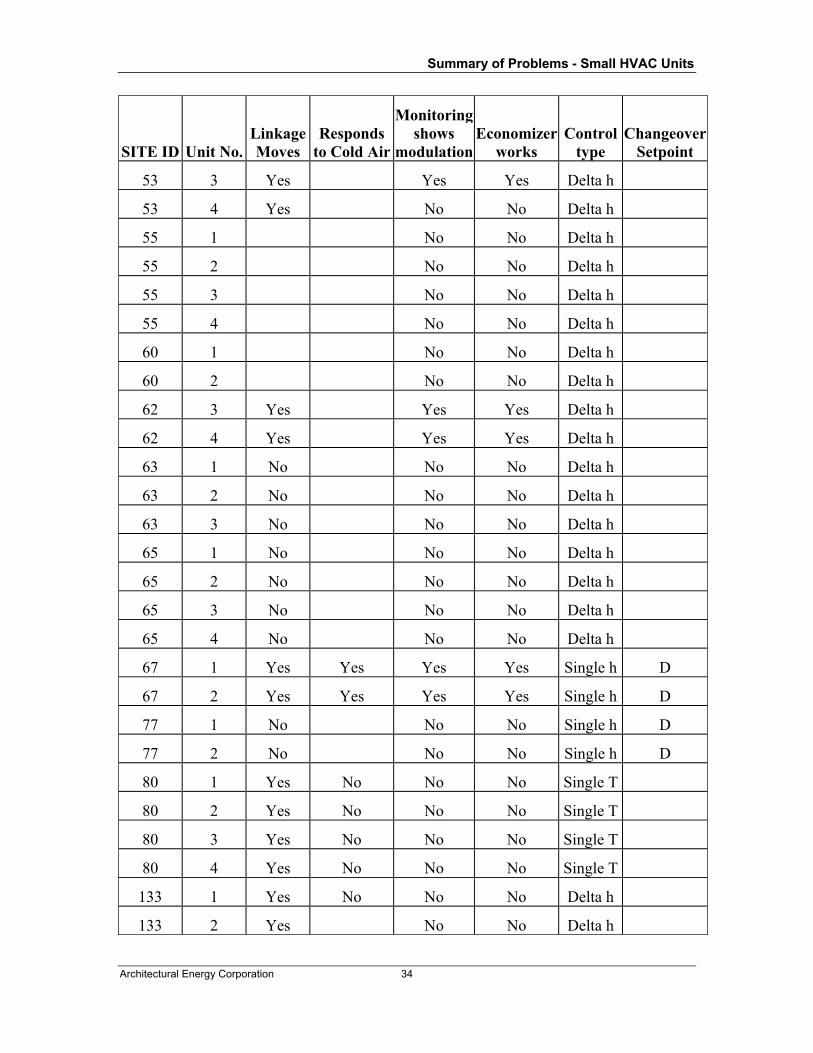
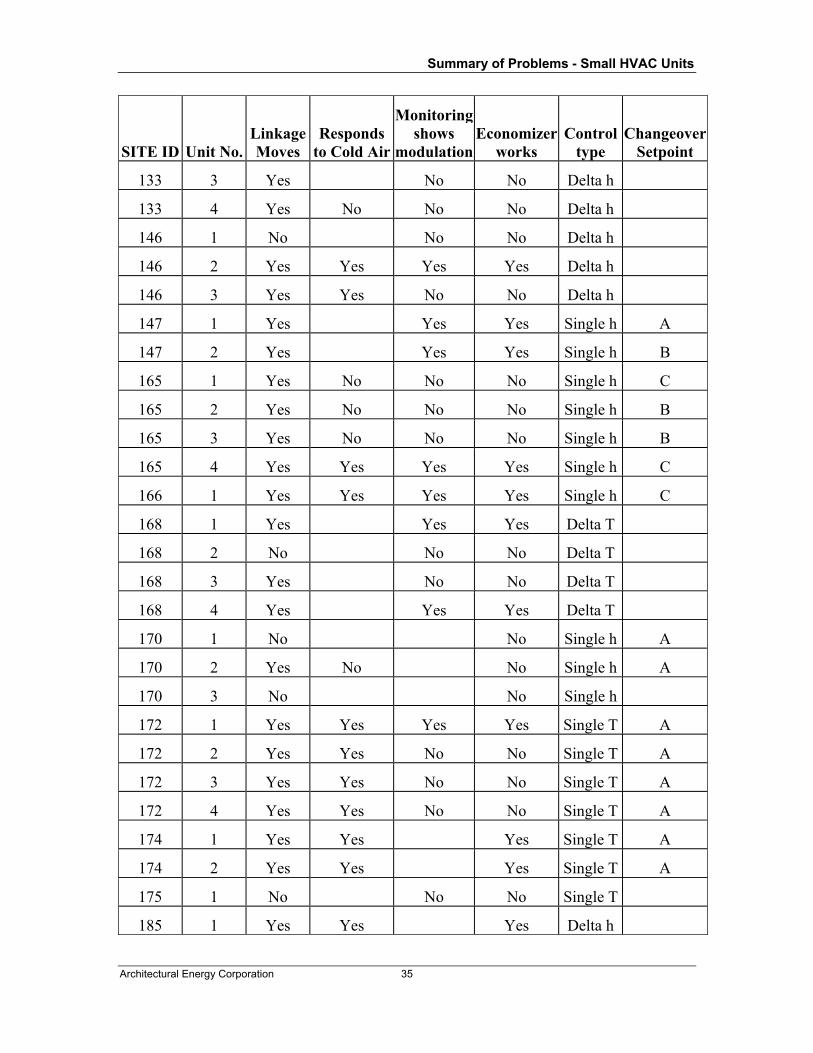
Economizer Findings Economizers show a high rate of failure in the study. Of the 215 units tested, 123 units were equipped with economizers. Of these, 30 units (24%) would not move at all, 49 units (40%) either did not respond to the cold spray test or did not modulate during the short-term monitoring period. Differential enthalpy economizers were the most popular style: 49 of the 123 units (40%) were differential enthalpy, followed by single point temperature (23%), single point enthalpy (21%) and differential temperature (16%).

Summary of Problems - Small HVAC Units
Architectural Energy Corporation 9
Differential Temperature
16%
Differential Enthalpy
40%
Single Point Temperature
23%
Single Point Enthalpy
21%
Figure 7. Economizer Control Type Distribution According to the Title 24 Energy Standards, single point enthalpy economizers should use the “A” changeover setpoint, but the “D” setpoint was most common. The D setpoint was used in 10 of the 25 (40%) single point enthalpy systems. The D setting causes the economizer to change from outdoor air cooling to compressor cooling at the lowest outdoor air enthalpy of the A – D settings, thus limiting the economizer hours of operation and energy savings potential.
Changeover setpoint = A
28%
Changeover setpoint = B
12%
Changeover setpoint = C
20%
Changeover setpoint = D
40%
Figure 8. Distribution of Changeover Setpoints on Single Point Enthalpy Economizer Controllers

Summary of Problems - Small HVAC Units
Architectural Energy Corporation 10
Refrigerant Charge Target superheat, subcooling or approach temperatures were tested using the CheckMe! procedure. Any test not meeting the target temperature within five degrees failed the screening test. Of the 74 refrigerant tests, 33 (46%) did not pass the screening test. Refrigerant was added or removed from the system until the target value was reached. The charge variation was calculated based on the weight of refrigerant adjustment compared to the total refrigerant charge. A frequency distribution of the charge levels observed in the study is shown in Figure 9.
0.0%
10.0%
20.0%
30.0%
40.0%
50.0%
60.0%
70.0%
"dog" -25% -20% -15% -10% -5% 0% 5% 10% 15% 20% 25% 30% 35%
Percent under or overcharge
Freq
uenc
y
Figure 9. Frequency Distribution of Refrigerant Charge Levels The energy impact of the charge variation was calculated according to Proctor (2002). The average energy impact (not including units that were fully discharged and obviously leaking) was about 5% of the annual cooling energy.
Summary of Problems - Small HVAC Units
Architectural Energy Corporation 11
0
0.2
0.4
0.6
0.8
1
1.2
50% 60% 70% 80% 90% 100% 110% 120% 130% 140%
% Factory Charge
Nor
mal
ized
Effi
cien
cy
TXVShort orifice
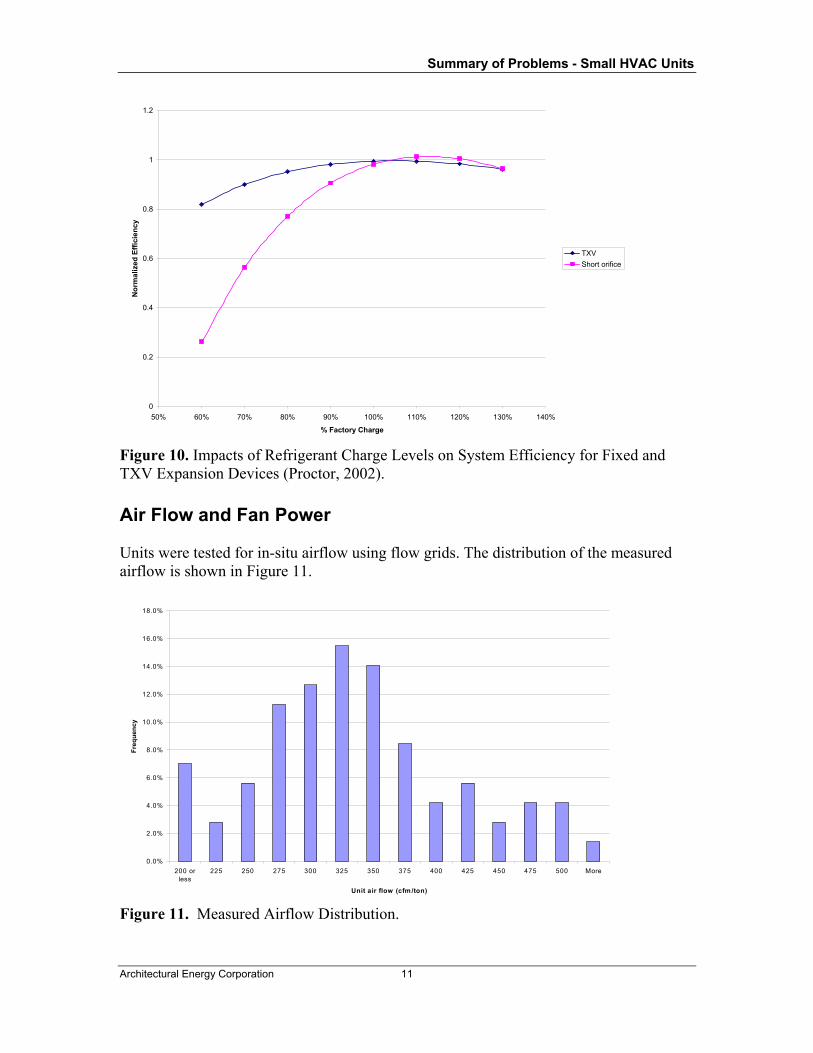
Figure 10. Impacts of Refrigerant Charge Levels on System Efficiency for Fixed and TXV Expansion Devices (Proctor, 2002).
Air Flow and Fan Power Units were tested for in-situ airflow using flow grids. The distribution of the measured airflow is shown in Figure 11.
0.0%
2.0%
4.0%
6.0%
8.0%
10.0%
12.0%
14.0%
16.0%
18.0%
200 orless
225 250 275 300 325 350 375 400 425 450 475 500 More
Unit air flow (cfm/ton)
Freq
uenc
y
Figure 11. Measured Airflow Distribution.

Summary of Problems - Small HVAC Units
Architectural Energy Corporation 12
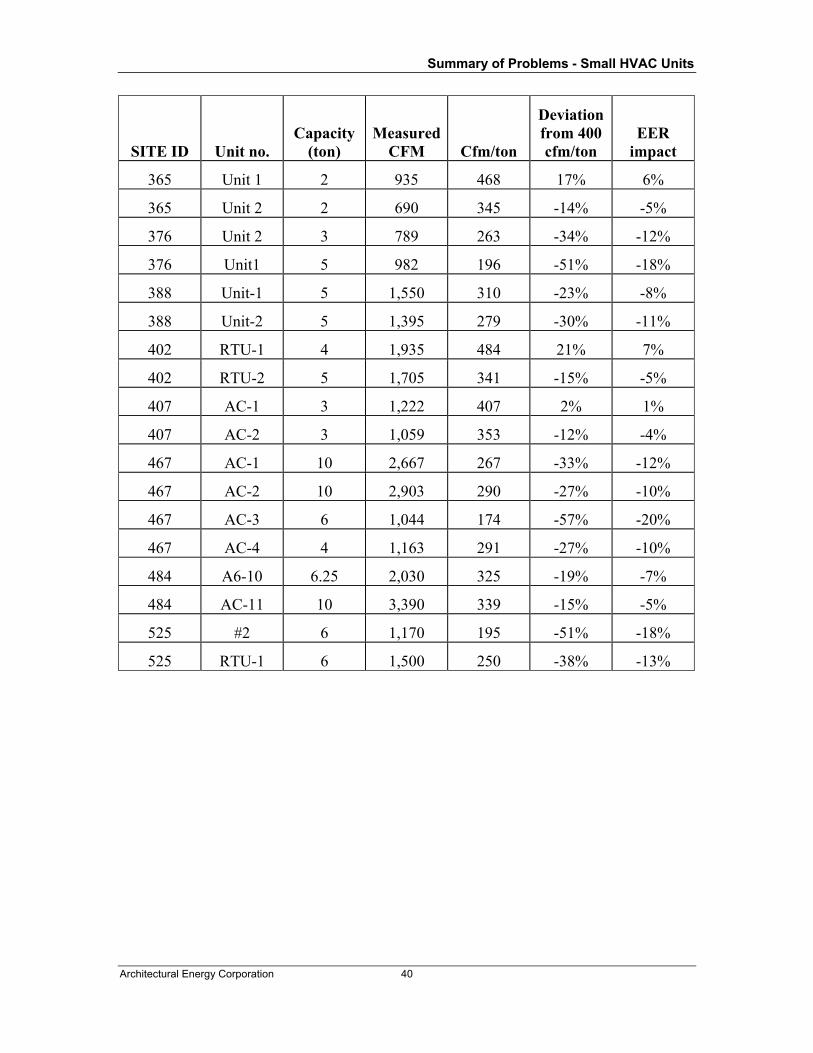
Overall, of the 79 units tested for airflow, 28 (39%) had airflow less than 300 cfm/ton. The average airflow rate was 325 cfm/ton. ARI standards are based on airflow rates of 400 cfm/ton. The annual energy impact of low airflow on cooling efficiency was projected across the sample of units using the relationship in Figure 12 (Proctor, 2002). Overall the impact of low air flow is about 9% of the annual cooling energy.
0.5
0.6
0.7
0.8
0.9
1
1.1
200 250 300 350 400 450
Air flow (cfm/ton)
Nor
mal
ized
Effi
cien
cy
Figure 12 Impact of Supply Air Flowrate on Unit Efficiency (Proctor, 2002). The average measured fan power for all units in the study was 0.18 kW per nomimal cooling ton, which is about 20% higher than the fan power assumed in the Title 24 energy standards (0.365 W/cfm @ 400 cfm/ton or 0.146 kW/ton). If the fan flow is increased to 400 cfm/ton, the fan power will increase to 0.34 kW/ton. This increase effectively drops the efficiency of a 10.3 EER unit to 9.1. The combination of high fan power and low flow rate is due largely to excessive pressure drop in the duct systems. The frequency distribution of unit external static pressure at the measured flow rate is shown in Figure 13. The average duct system pressure drop was 0.48 in WC. ARI efficiency ratings assume a duct system pressure drop of 0.1 to 0.25 in WC, depending on the system size. The average duct system pressure drop corrected to 400 cfm/ton would equal 0.625 in W.C.

Summary of Problems - Small HVAC Units
Architectural Energy Corporation 13
0.0%
2.0%
4.0%
6.0%
8.0%
10.0%
12.0%
14.0%
0.05 0.1 0.15 0.2 0.25 0.3 0.35 0.4 0.45 0.5 0.55 0.6 0.65 0.7 0.75 0.8 0.85 More
Unit external static pressure @ installed air flow
Freq
uenc
y
Figure 13. Distribution of Unit External Static Pressure
Thermostats System fans were found to be cycling on and off with a call for heating or cooling in 82 (38%) of the units tested. The Title 24 Energy Standards require that all buildings not naturally ventilated with operable windows or other openings be mechanically ventilated. Mechanical ventilation is required to occur at least 55 minutes out of every hour that the building is occupied. Building outdoor ventilation air is typically supplied during fan operation, with the minimum quantity of outdoor air determined by the outdoor air damper minimum position. The supply of continuous fresh air during occupied hours relies on continuous operation of the HVAC unit supply fan. The Standards further require operation of the ventilation system at least one hour before normal building occupancy in order to purge potential build-up of pollutants and out gassing from furniture, carpets, paint, etc. Most (86%) of the thermostats surveyed were observed to be “commercial” type thermostats capable of controlling the systems according to the Title 24 and ASHRAE standards. These units can be set up to program fan schedule and mode independent of thermostat schedule.
Other Issues/Findings A list of additional issues and findings from the field surveys and testing is summarized in Appendix A. Several of these issues are described in more detail as follows.
Duct Systems

Summary of Problems - Small HVAC Units
Architectural Energy Corporation 14
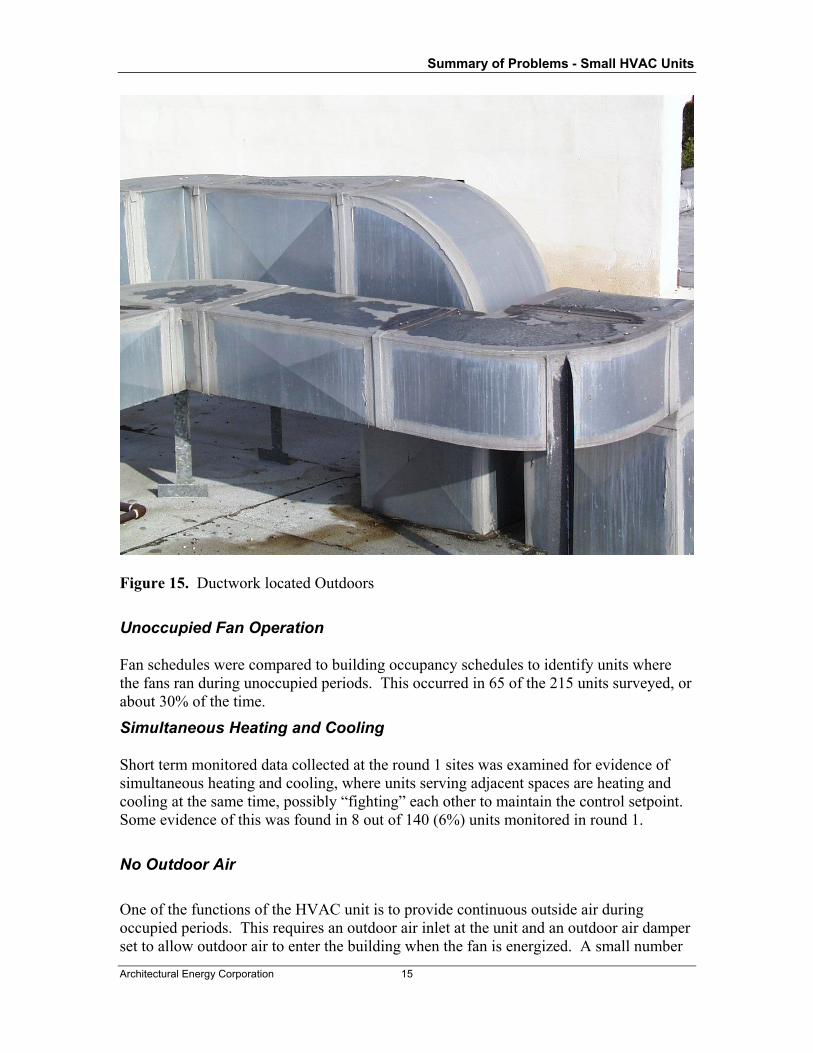
16% of systems had ductwork running through unconditioned spaces. Of those, 60% were in unconditioned plenums; the rest were outdoors. A common building construction practice is to install a dropped ceiling in an unconditioned, high-bay warehouse to create conditioned office space. Ductwork is run from the rooftop units through a large unconditioned area to serve the offices below. This ductwork should be well-insulated and sealed against leakage to minimize duct losses to the unconditioned space. The photo below shows ductwork located in an unconditioned space, and lay-in insulation placed over the dropped ceiling tiles. Note the poor insulation coverage and the extensive use of flex duct in the distribution system.
Figure 14. Lay-in insulation and ductwork in an unconditioned space serving the conditioned office area of a high-bay unconditioned warehouse. Several sites were also observed with ductwork running across the roof surface. Although this practice is allowed under the Title 24 Energy Standards, the ductwork should be well-insulated, weather-proofed, and sealed against duct leakage to minimize distribution system losses.
Summary of Problems - Small HVAC Units
Architectural Energy Corporation 15
Figure 15. Ductwork located Outdoors
Unoccupied Fan Operation Fan schedules were compared to building occupancy schedules to identify units where the fans ran during unoccupied periods. This occurred in 65 of the 215 units surveyed, or about 30% of the time.
Simultaneous Heating and Cooling Short term monitored data collected at the round 1 sites was examined for evidence of simultaneous heating and cooling, where units serving adjacent spaces are heating and cooling at the same time, possibly “fighting” each other to maintain the control setpoint. Some evidence of this was found in 8 out of 140 (6%) units monitored in round 1.
No Outdoor Air
One of the functions of the HVAC unit is to provide continuous outside air during occupied periods. This requires an outdoor air inlet at the unit and an outdoor air damper set to allow outdoor air to enter the building when the fan is energized. A small number

Summary of Problems - Small HVAC Units
Architectural Energy Corporation 16
of units survey (9 out of 215) had either no provision for outdoor air, or the outdoor air dampers were completely closed.
Poor Maintenance Practices.
One of the casual observations made at each site was to identify and record evidence of poor maintenance practices. The following section describes a few of the issues observed during the field study.
The following photos were taken at a newly constructed restaurant soon after a visit by the HVAC service contractor. The roof was littered with old, filthy filters and bent and discarded “bird screens” intended to protect the unit’s outdoor air opening.
Figure 16. Poor Maintenance Practices.
A closer inspection revealed several instances of missing filters and filthy cooling coils.

Summary of Problems - Small HVAC Units
Architectural Energy Corporation 17
Figure 17. Dirty Evaporator Coil Due to Lack of Maintenance
This fan motor fell off its mounting and into the evaporator coil. Although refrigerant wasn’t lost, there was no airflow. Comfort complaints that went on for weeks were blamed on a thermostat problem. A simple check of the system would have discovered this problem much earlier.
Figure 18. Fan Motor Mount Failure
Design and Construction Faults

Summary of Problems - Small HVAC Units
Architectural Energy Corporation 18
Several design and construction faults were also observed during the field inspections. Although these faults were isolated, they indicate a lack of inspection and/or verification of correct design and/or unit installation.
Faulty Wiring. The NEC requires a fused disconnect at the unit to allow for shutting off power during unit service. This unit was directly wired to the main panelboard, with unit connections made using wirenuts.
Figure 19. Poor Wiring Installation
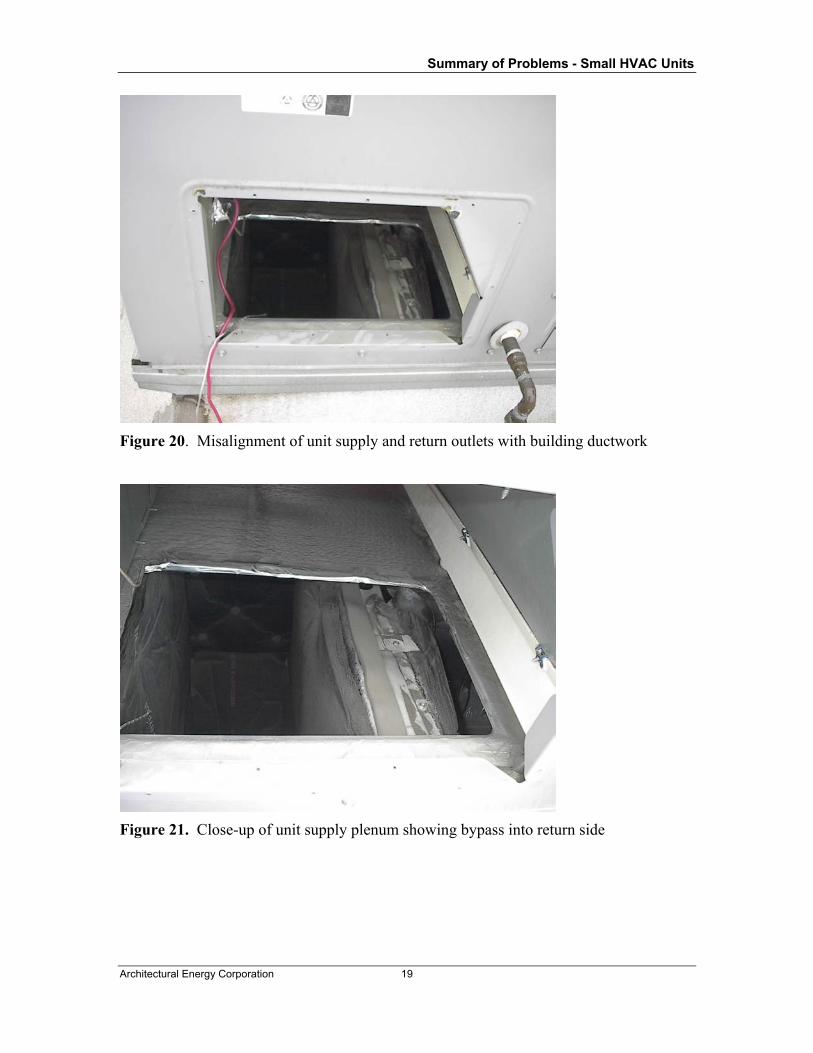
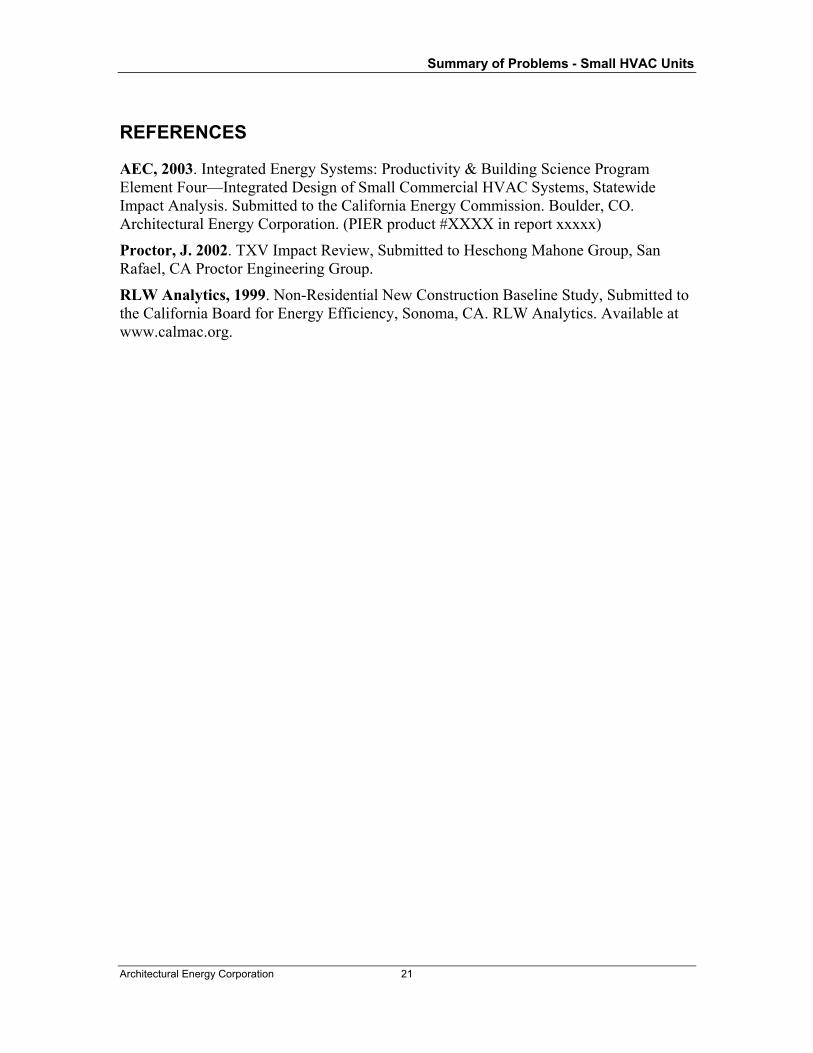
Incompatible unit and curb design. All units observed at this site were set on an incompatible curb, where the supply and return duct connections did not line up with the unit supply and return compartments. Significant supply air bypass into the unit return was the result. The bypassed supply air reduces unit capacity and efficiency.
Summary of Problems - Small HVAC Units
Architectural Energy Corporation 19
Figure 20. Misalignment of unit supply and return outlets with building ductwork
Figure 21. Close-up of unit supply plenum showing bypass into return side

Summary of Problems - Small HVAC Units
Architectural Energy Corporation 20
Outdoor Air Intake Adjacent to Exhaust Fan. This toilet exhaust fan was discharging directly into the outdoor air intake of a rooftop unit. Ventilation air contamination and odor problems result from this design flaw.
Figure 22. Exhaust Fan Discharge Into Outside Air Intake
Summary of Problems - Small HVAC Units
Architectural Energy Corporation 21
REFERENCES
AEC, 2003. Integrated Energy Systems: Productivity & Building Science Program Element Four—Integrated Design of Small Commercial HVAC Systems, Statewide Impact Analysis. Submitted to the California Energy Commission. Boulder, CO. Architectural Energy Corporation. (PIER product #XXXX in report xxxxx)
Proctor, J. 2002. TXV Impact Review, Submitted to Heschong Mahone Group, San Rafael, CA Proctor Engineering Group.
RLW Analytics, 1999. Non-Residential New Construction Baseline Study, Submitted to the California Board for Energy Efficiency, Sonoma, CA. RLW Analytics. Available at www.calmac.org.
Summary of Problems - Small HVAC Units
Architectural Energy Corporation 22
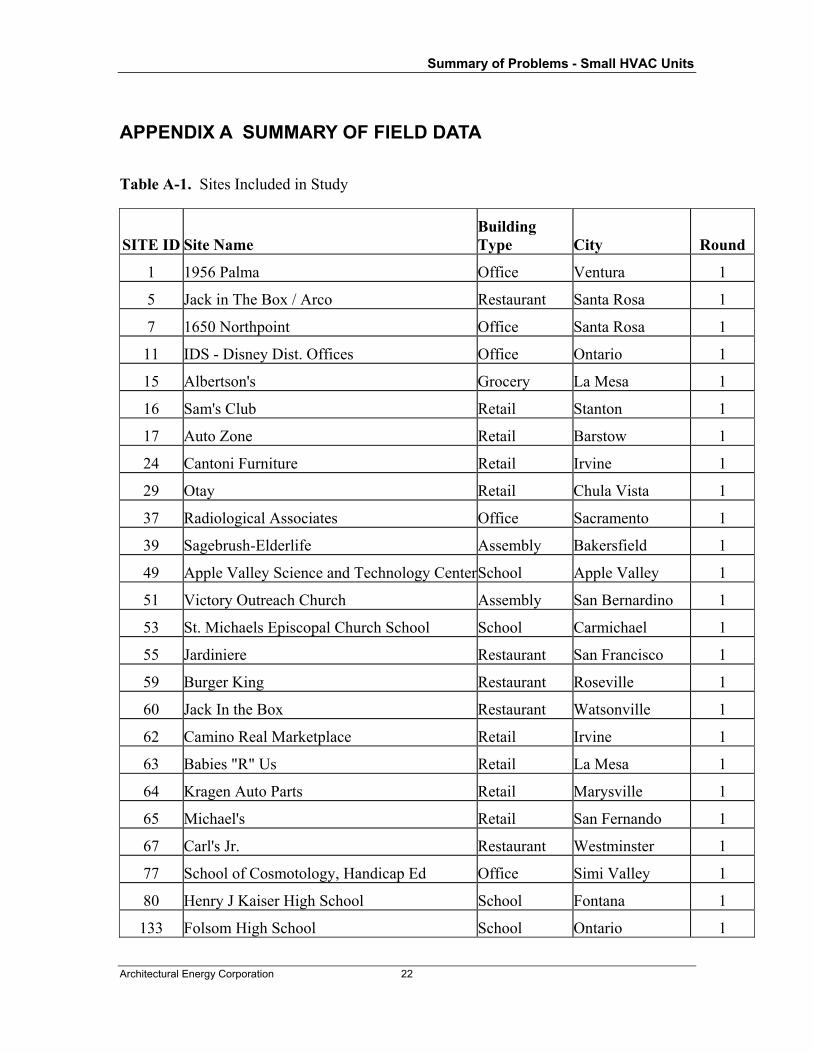
APPENDIX A SUMMARY OF FIELD DATA
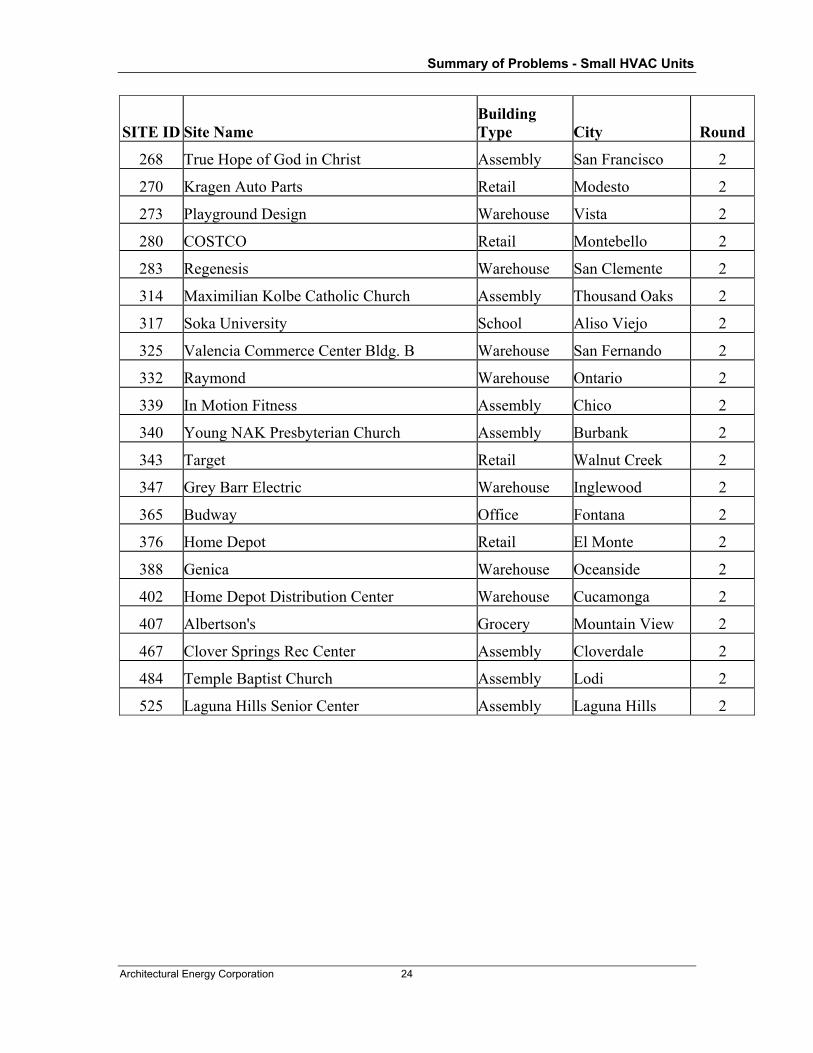
Table A-1. Sites Included in Study
SITE ID Site Name Building Type City Round
1 1956 Palma Office Ventura 1
5 Jack in The Box / Arco Restaurant Santa Rosa 1
7 1650 Northpoint Office Santa Rosa 1
11 IDS - Disney Dist. Offices Office Ontario 1
15 Albertson's Grocery La Mesa 1
16 Sam's Club Retail Stanton 1
17 Auto Zone Retail Barstow 1
24 Cantoni Furniture Retail Irvine 1
29 Otay Retail Chula Vista 1
37 Radiological Associates Office Sacramento 1
39 Sagebrush-Elderlife Assembly Bakersfield 1
49 Apple Valley Science and Technology CenterSchool Apple Valley 1
51 Victory Outreach Church Assembly San Bernardino 1
53 St. Michaels Episcopal Church School School Carmichael 1
55 Jardiniere Restaurant San Francisco 1
59 Burger King Restaurant Roseville 1
60 Jack In the Box Restaurant Watsonville 1
62 Camino Real Marketplace Retail Irvine 1
63 Babies "R" Us Retail La Mesa 1
64 Kragen Auto Parts Retail Marysville 1
65 Michael's Retail San Fernando 1
67 Carl's Jr. Restaurant Westminster 1
77 School of Cosmotology, Handicap Ed Office Simi Valley 1
80 Henry J Kaiser High School School Fontana 1
133 Folsom High School School Ontario 1
Summary of Problems - Small HVAC Units
Architectural Energy Corporation 23
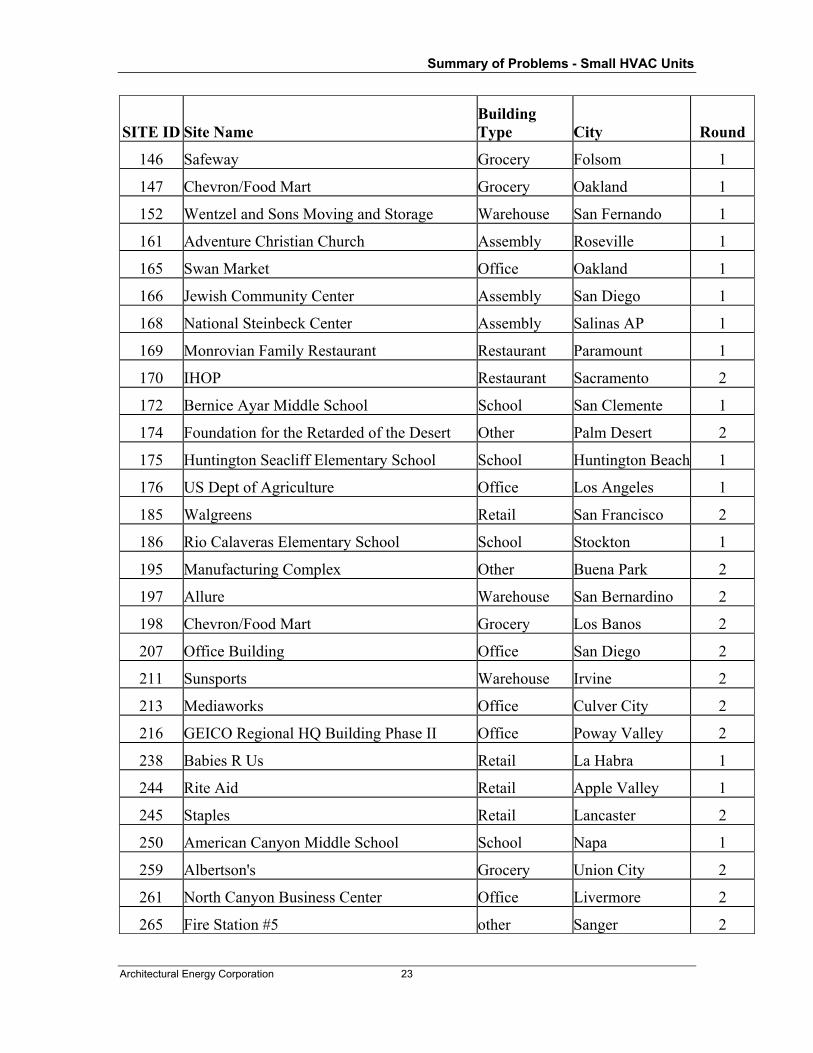
SITE ID Site Name Building Type City Round
146 Safeway Grocery Folsom 1
147 Chevron/Food Mart Grocery Oakland 1
152 Wentzel and Sons Moving and Storage Warehouse San Fernando 1
161 Adventure Christian Church Assembly Roseville 1
165 Swan Market Office Oakland 1
166 Jewish Community Center Assembly San Diego 1
168 National Steinbeck Center Assembly Salinas AP 1
169 Monrovian Family Restaurant Restaurant Paramount 1
170 IHOP Restaurant Sacramento 2
172 Bernice Ayar Middle School School San Clemente 1
174 Foundation for the Retarded of the Desert Other Palm Desert 2
175 Huntington Seacliff Elementary School School Huntington Beach 1
176 US Dept of Agriculture Office Los Angeles 1
185 Walgreens Retail San Francisco 2
186 Rio Calaveras Elementary School School Stockton 1
195 Manufacturing Complex Other Buena Park 2
197 Allure Warehouse San Bernardino 2
198 Chevron/Food Mart Grocery Los Banos 2
207 Office Building Office San Diego 2
211 Sunsports Warehouse Irvine 2
213 Mediaworks Office Culver City 2
216 GEICO Regional HQ Building Phase II Office Poway Valley 2
238 Babies R Us Retail La Habra 1
244 Rite Aid Retail Apple Valley 1
245 Staples Retail Lancaster 2
250 American Canyon Middle School School Napa 1
259 Albertson's Grocery Union City 2
261 North Canyon Business Center Office Livermore 2
265 Fire Station #5 other Sanger 2
Summary of Problems - Small HVAC Units
Architectural Energy Corporation 24
SITE ID Site Name Building Type City Round
268 True Hope of God in Christ Assembly San Francisco 2
270 Kragen Auto Parts Retail Modesto 2
273 Playground Design Warehouse Vista 2
280 COSTCO Retail Montebello 2
283 Regenesis Warehouse San Clemente 2
314 Maximilian Kolbe Catholic Church Assembly Thousand Oaks 2
317 Soka University School Aliso Viejo 2
325 Valencia Commerce Center Bldg. B Warehouse San Fernando 2
332 Raymond Warehouse Ontario 2
339 In Motion Fitness Assembly Chico 2
340 Young NAK Presbyterian Church Assembly Burbank 2
343 Target Retail Walnut Creek 2
347 Grey Barr Electric Warehouse Inglewood 2
365 Budway Office Fontana 2
376 Home Depot Retail El Monte 2
388 Genica Warehouse Oceanside 2
402 Home Depot Distribution Center Warehouse Cucamonga 2
407 Albertson's Grocery Mountain View 2
467 Clover Springs Rec Center Assembly Cloverdale 2
484 Temple Baptist Church Assembly Lodi 2
525 Laguna Hills Senior Center Assembly Laguna Hills 2
Summary of Problems - Small HVAC Units
Architectural Energy Corporation 25
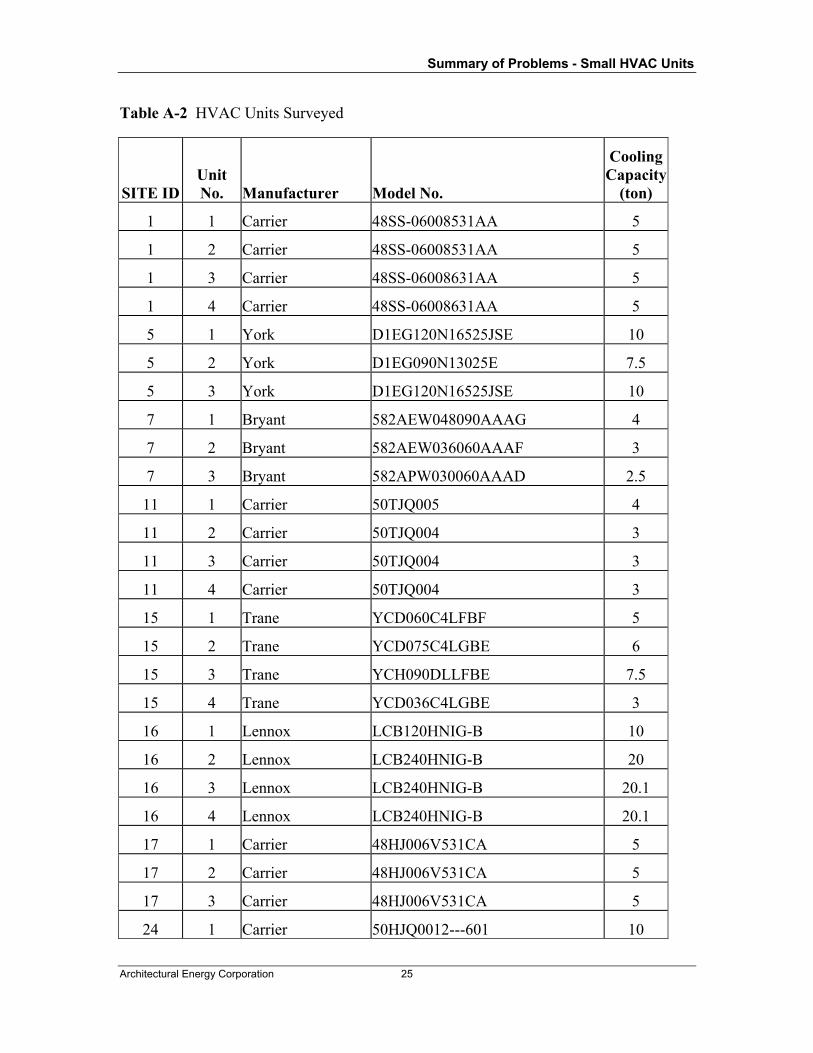
Table A-2 HVAC Units Surveyed
SITE ID Unit No. Manufacturer Model No.
Cooling Capacity
(ton)
1 1 Carrier 48SS-06008531AA 5
1 2 Carrier 48SS-06008531AA 5
1 3 Carrier 48SS-06008631AA 5
1 4 Carrier 48SS-06008631AA 5
5 1 York D1EG120N16525JSE 10
5 2 York D1EG090N13025E 7.5
5 3 York D1EG120N16525JSE 10
7 1 Bryant 582AEW048090AAAG 4
7 2 Bryant 582AEW036060AAAF 3
7 3 Bryant 582APW030060AAAD 2.5
11 1 Carrier 50TJQ005 4
11 2 Carrier 50TJQ004 3
11 3 Carrier 50TJQ004 3
11 4 Carrier 50TJQ004 3
15 1 Trane YCD060C4LFBF 5
15 2 Trane YCD075C4LGBE 6
15 3 Trane YCH090DLLFBE 7.5
15 4 Trane YCD036C4LGBE 3
16 1 Lennox LCB120HNIG-B 10
16 2 Lennox LCB240HNIG-B 20
16 3 Lennox LCB240HNIG-B 20.1
16 4 Lennox LCB240HNIG-B 20.1
17 1 Carrier 48HJ006V531CA 5
17 2 Carrier 48HJ006V531CA 5
17 3 Carrier 48HJ006V531CA 5
24 1 Carrier 50HJQ0012---601 10

Summary of Problems - Small HVAC Units
Architectural Energy Corporation 26
SITE ID Unit No. Manufacturer Model No.
Cooling Capacity
(ton)
24 2 Carrier 50HJQ0012---601 10
24 3 Carrier 50HS-060---601AB 5
24 4 Carrier 50HJQ005---601 4
29 1 Rheem RRKA-A048CK08E 4
29 2 Rheem RRKA-A036CK06E 3
29 3 Rheem RKKB-A090CM1SE 7.5
37 1 Trane YCD060C4LOBF 5
37 2 Trane YCD060C4LOBF 5
37 3 Trane YCD048C4LOBF 5
37 4 Trane YCD090C4LOBE 7
39 1 Trane YCD049C3C0BF 4
39 2 Trane YCD037C3L 3
39 3 Day & Night 581BEV060072AAAA 5
49 1 trane YCD 075 6.5
49 2 trane ycd 075 6.5
49 3 trane ycc 018F 2
49 4 trane YCC 024F 2.5
51 1 york B3CH120A46B 10
51 2 york B3CH120A46B 10
51 3 york B3CH090A46A 7.5
53 1 CARRIER 48HJD006 5
53 2 CARRIER 48HJD006 5
53 3 CARRIER 48HJD007 6
53 4 CARRIER 48HJD007 6
55 1 York D1eg090N13625E 7.5
55 2 York d1eg09013625e 7.5
55 3 York D1EG120N16525JSE 10
55 4 York D1EG120N16525JSE 10
Summary of Problems - Small HVAC Units
Architectural Energy Corporation 27
SITE ID Unit No. Manufacturer Model No.
Cooling Capacity
(ton)
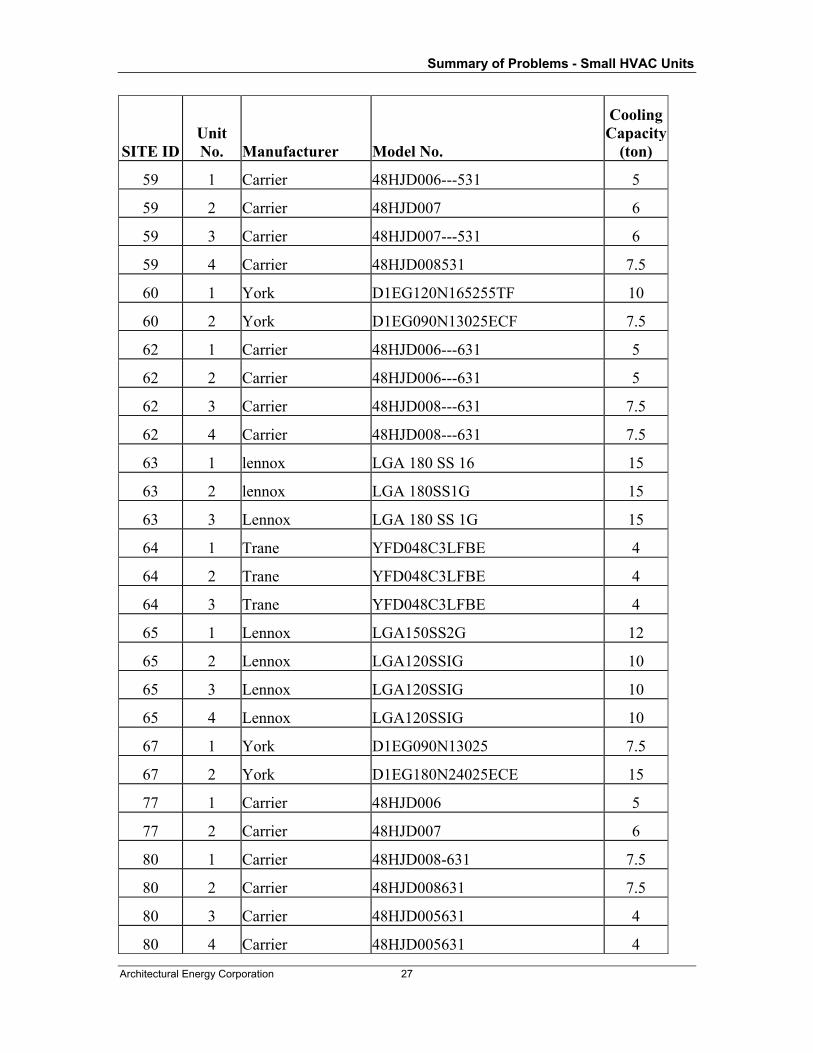
59 1 Carrier 48HJD006---531 5
59 2 Carrier 48HJD007 6
59 3 Carrier 48HJD007---531 6
59 4 Carrier 48HJD008531 7.5
60 1 York D1EG120N165255TF 10
60 2 York D1EG090N13025ECF 7.5
62 1 Carrier 48HJD006---631 5
62 2 Carrier 48HJD006---631 5
62 3 Carrier 48HJD008---631 7.5
62 4 Carrier 48HJD008---631 7.5
63 1 lennox LGA 180 SS 16 15
63 2 lennox LGA 180SS1G 15
63 3 Lennox LGA 180 SS 1G 15
64 1 Trane YFD048C3LFBE 4
64 2 Trane YFD048C3LFBE 4
64 3 Trane YFD048C3LFBE 4
65 1 Lennox LGA150SS2G 12
65 2 Lennox LGA120SSIG 10
65 3 Lennox LGA120SSIG 10
65 4 Lennox LGA120SSIG 10
67 1 York D1EG090N13025 7.5
67 2 York D1EG180N24025ECE 15
77 1 Carrier 48HJD006 5
77 2 Carrier 48HJD007 6
80 1 Carrier 48HJD008-631 7.5
80 2 Carrier 48HJD008631 7.5
80 3 Carrier 48HJD005631 4
80 4 Carrier 48HJD005631 4
Summary of Problems - Small HVAC Units
Architectural Energy Corporation 28
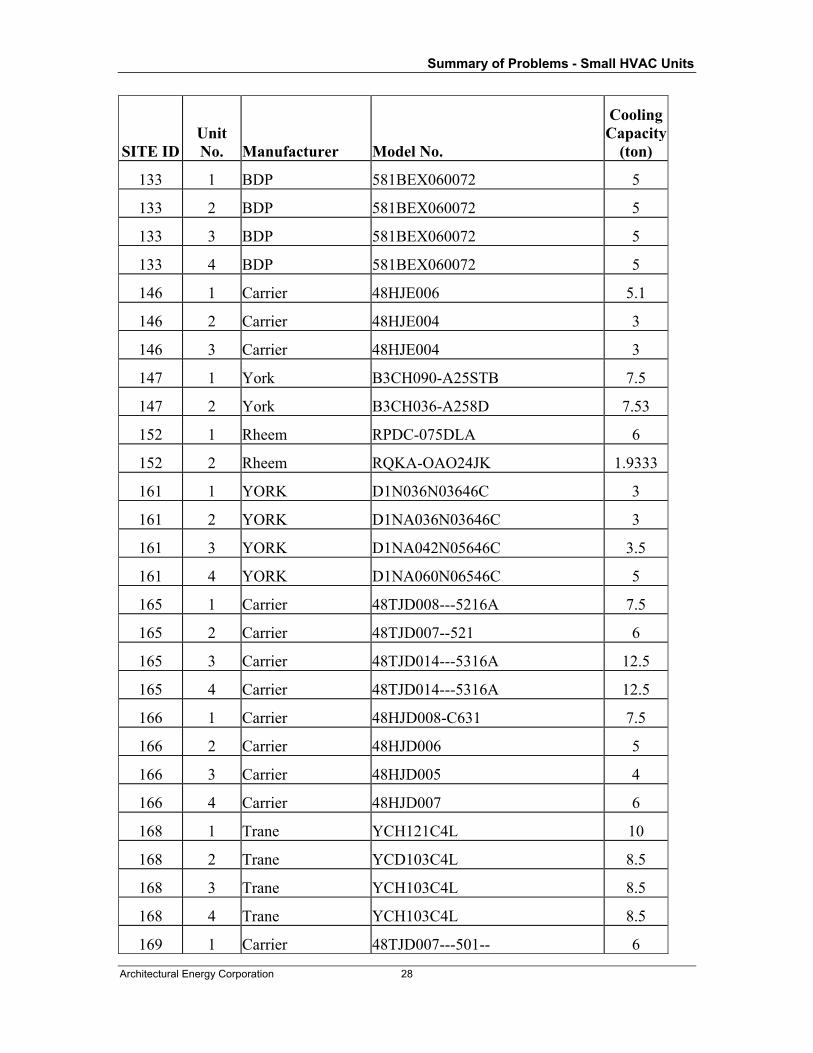
SITE ID Unit No. Manufacturer Model No.
Cooling Capacity
(ton)
133 1 BDP 581BEX060072 5
133 2 BDP 581BEX060072 5
133 3 BDP 581BEX060072 5
133 4 BDP 581BEX060072 5
146 1 Carrier 48HJE006 5.1
146 2 Carrier 48HJE004 3
146 3 Carrier 48HJE004 3
147 1 York B3CH090-A25STB 7.5
147 2 York B3CH036-A258D 7.53
152 1 Rheem RPDC-075DLA 6
152 2 Rheem RQKA-OAO24JK 1.9333
161 1 YORK D1N036N03646C 3
161 2 YORK D1NA036N03646C 3
161 3 YORK D1NA042N05646C 3.5
161 4 YORK D1NA060N06546C 5
165 1 Carrier 48TJD008---5216A 7.5
165 2 Carrier 48TJD007--521 6
165 3 Carrier 48TJD014---5316A 12.5
165 4 Carrier 48TJD014---5316A 12.5
166 1 Carrier 48HJD008-C631 7.5
166 2 Carrier 48HJD006 5
166 3 Carrier 48HJD005 4
166 4 Carrier 48HJD007 6
168 1 Trane YCH121C4L 10
168 2 Trane YCD103C4L 8.5
168 3 Trane YCH103C4L 8.5
168 4 Trane YCH103C4L 8.5
169 1 Carrier 48TJD007---501-- 6

Summary of Problems - Small HVAC Units
Architectural Energy Corporation 29
SITE ID Unit No. Manufacturer Model No.
Cooling Capacity
(ton)
169 2 Carrier 48HJD007---531-- 6
170 1 York D1EG090N13025ECE 7.5
170 2 York D2EG048N06025 4
170 3 York D1EG090N13025ECE 7.5
172 1 Trane YCD103C4LBAA 8.5
172 2 Trane YCD049C4LBBE 4
172 3 Trane YCD049C4LBBE 4
172 4 Trane YCC024F1LOBE 2
174 1 Trane YCD091D4LOBE 7.5
174 2 Trane YCD091D4LOBE 7.5
175 1 Trane YCH 103C4LPA3 8.5
175 2 trane YCD 061 C4 LCBI 5
175 3 Trane YCD 091 D4 L6Be 7
176 1 Carrier 50TJQ004-501GA 3
176 2 Carrier 50HS-024-311AB 2
176 3 Carrier 50TJQ004-501GA 3
176 4 Carrier 50HS-018-301AB 1.5
185 1 Trane YCD091D4LABE 7.5
185 2 Trane YCD091D4LABE 7.5
185 3 Trane YCD091D4LABE 7.5
185 4 Trane YCD061C4LABF 5
186 1 Trane YCD049C4LCBE 4.125
186 2 Trane YCD049C4LCBE 4.125
186 3 Trane YCD049C4LCBE 4.125
186 4 Trane YCD074C4LCBE 5.67
195 1 York B1HA024A06B 2
195 2 York B1HA024A06B 2
195 3 York B1HA024A06B 2

Summary of Problems - Small HVAC Units
Architectural Energy Corporation 30
SITE ID Unit No. Manufacturer Model No.
Cooling Capacity
(ton)
197 1 Carrier 50TJQ004---601GA 3
197 2 Carrier 50TJQ004---601GA 3
197 3 Carrier 50TJQ006-601GA 5
197 4 Carrier 50TJQ006---601GA 5
198 1 Bryant 501BPU031072APAA 3
198 2 Bryant 581PU060072ADAA 5
207 1 Carrier 50TJQ005 4
207 2 Carrier 50TJQ005 4
211 1 Trane WCD090C400BC 7.5
211 2 Can't Read Can't Read
213 1 Lennox LGA120SH19 10
216 1 Carrier 50TJQ006 5
238 1 Lennox LGA180HSIG 15.67
238 2 Lennox LGA180HSIG 15.7
238 3 Lennox LGA180HSIG 15.67
238 4 Lennox LGA180HSIG 15
244 1 York D2EG150N20025EAD 12
244 2 York D2EG150N20025EAD 12
244 3 York D2EG150N20025EAD 12
244 4 York D2EG150N20025EAD 12
245 1 Carrier 48DJB012530 10
245 2 Carrier 48DJD008530 7.5
245 3 Carrier 48LJE006520 5
250 1 CARRIER 48HJD007 6
250 2 CARRIER 48HJD008 7.5
250 3 CARRIER 48HJD006 5
250 4 CARRIER 48HJD008 7.5
259 1 Trane YCD036C4LGBE 3

Summary of Problems - Small HVAC Units
Architectural Energy Corporation 31
SITE ID Unit No. Manufacturer Model No.
Cooling Capacity
(ton)
259 2 Trane YCD036C4LGBE 3
259 3 Trane YCD060C4LC13F 5
261 1 Bryant 580DEV120180ACAA 10
261 2 Bryant 580DEU120180ACAA 10
265 1 York D2CG072N0792SEBA 6
265 2 York D7CG060N07925DBA 5
268 1 Trane YCD06DC3LOBT 5
268 2 Carrier 48TJF008 7.5
270 1 Trane YSC036A3RLA01D0012A 3
270 2 Trane YSC036A3RLA01D0012A 3
270 3 Trane YSC036A3RLA01D0012A 3
273 1 Trane WC0048F400BF 4
273 2 Trane WCCO48F400BF 4
280 1 Carrier 50NQ030321 2.5
280 2 Carrier 50NQ024-311 2
283 1 Carrier 50TJQ006 5
283 2 Carrier 50TJQ005 4
283 3 Carrier 50TJQ004 3
314 1 Carrier 50SX-042-601-AA 3.5
317 1 Trane WCH1508400EA 12.5
325 1 Carrier 5DTJQ006-601GA 5
332 1 Carrier 50JS-036-601 3
332 2 Carrier 50JS-036-601 3
339 1 Carrier 48HJD008 7.5
340 1 Carrier 50JTJQ012-501GA 10
340 2 Carrier 50TJQ005-501GA 4
343 1 Aaon RR08-3-PO-212 8
343 2 Aaon RK063E0222 6

Summary of Problems - Small HVAC Units
Architectural Energy Corporation 32
SITE ID Unit No. Manufacturer Model No.
Cooling Capacity
(ton)
347 1 Trane YFD075C4LCBE 6.25
365 1 Carrier 50HS-024031146 2
365 2 Carrier 50HS-0240311AB 2
376 1 Carrier 48HJD006---631-- 5
376 2 Carrier 48HJE004---631 3
388 1 ICP PHF060L000A 5
388 2 ICP PHF060L00A 5
402 1 Rheem RJKA-A048DM 4
402 2 Rheem RJKA-A060DM 5
407 1 Trane YCD036C4LGBE 3
407 2 Trane YCD036C4LGBE 3
467 1 York D3CG120N16525D 10
467 2 York D7CG048N06025A 4
467 3 York D3C6120N16525D 10
467 4 York D2C6072N07925A 6
484 1 Trane YCD074C4CABE 6.25
484 2 Trane YCD121C4LAAA 10
525 1 Carrier 48TJD007-521 6
525 2 Carrier 48TJD007-521 6
Summary of Problems - Small HVAC Units
Architectural Energy Corporation 33
Table A-3 Economizer Data
SITE ID Unit No. Linkage Moves
Responds to Cold Air
Monitoring shows
modulationEconomizer
works Control
type Changeover
Setpoint
5 1 Yes No No No Delta T
5 2 Yes Yes Yes Single T
5 3 Yes Yes Yes Delta T
15 1 No No No Single T A
15 2 No No No Single h A
15 3 Yes Yes No No Single T A
15 4 Yes No No No Single h A
24 1 No No Delta h
24 2 No No Delta h
24 4 No No Delta h
29 1 No No No Single h A
29 2 Yes No No Single h A
29 3 No No No Single T B
37 1 Yes Yes Yes Yes Delta T
37 2 Yes Yes Yes Yes Delta T
37 3 Yes Yes No No Delta T
37 4 Yes Yes No No Delta T
39 1 Yes No No No Delta T
39 2 Yes No No No Delta T
49 1 No No No Delta T
49 2 No No No Delta T
51 1 No No No Single T
51 2 No No No Single T
51 3 Yes Yes Yes Yes Single T
53 1 Yes Yes Yes Delta h
53 2 Yes Yes Yes Delta h
Summary of Problems - Small HVAC Units
Architectural Energy Corporation 34
SITE ID Unit No. Linkage Moves
Responds to Cold Air
Monitoring shows
modulationEconomizer
works Control
type Changeover
Setpoint
53 3 Yes Yes Yes Delta h
53 4 Yes No No Delta h
55 1 No No Delta h
55 2 No No Delta h
55 3 No No Delta h
55 4 No No Delta h
60 1 No No Delta h
60 2 No No Delta h
62 3 Yes Yes Yes Delta h
62 4 Yes Yes Yes Delta h
63 1 No No No Delta h
63 2 No No No Delta h
63 3 No No No Delta h
65 1 No No No Delta h
65 2 No No No Delta h
65 3 No No No Delta h
65 4 No No No Delta h
67 1 Yes Yes Yes Yes Single h D
67 2 Yes Yes Yes Yes Single h D
77 1 No No No Single h D
77 2 No No No Single h D
80 1 Yes No No No Single T
80 2 Yes No No No Single T
80 3 Yes No No No Single T
80 4 Yes No No No Single T
133 1 Yes No No No Delta h
133 2 Yes No No Delta h
Summary of Problems - Small HVAC Units
Architectural Energy Corporation 35
SITE ID Unit No. Linkage Moves
Responds to Cold Air
Monitoring shows
modulationEconomizer
works Control
type Changeover
Setpoint
133 3 Yes No No Delta h
133 4 Yes No No No Delta h
146 1 No No No Delta h
146 2 Yes Yes Yes Yes Delta h
146 3 Yes Yes No No Delta h
147 1 Yes Yes Yes Single h A
147 2 Yes Yes Yes Single h B
165 1 Yes No No No Single h C
165 2 Yes No No No Single h B
165 3 Yes No No No Single h B
165 4 Yes Yes Yes Yes Single h C
166 1 Yes Yes Yes Yes Single h C
168 1 Yes Yes Yes Delta T
168 2 No No No Delta T
168 3 Yes No No Delta T
168 4 Yes Yes Yes Delta T
170 1 No No Single h A
170 2 Yes No No Single h A
170 3 No No Single h
172 1 Yes Yes Yes Yes Single T A
172 2 Yes Yes No No Single T A
172 3 Yes Yes No No Single T A
172 4 Yes Yes No No Single T A
174 1 Yes Yes Yes Single T A
174 2 Yes Yes Yes Single T A
175 1 No No No Single T
185 1 Yes Yes Yes Delta h

Summary of Problems - Small HVAC Units
Architectural Energy Corporation 36
SITE ID Unit No. Linkage Moves
Responds to Cold Air
Monitoring shows
modulationEconomizer
works Control
type Changeover
Setpoint
185 2 Yes No No Delta h
185 3 Yes Yes Yes Delta h
185 4 Yes Yes Yes Delta h
186 1 Yes Yes Yes Delta T
186 2 Yes No No Delta T
186 3 Yes No No Delta T
186 4 Yes No No Delta T
216 1 Yes No No Delta h
238 1 Yes Yes Yes Delta h
238 2 Yes Yes Yes Delta h
238 3 Yes Yes Yes Delta h
238 4 Yes Yes Yes Delta h
244 1 Yes Yes No No Single h D
244 2 Yes Yes No No Single h D
244 3 Yes Yes No No Single h D
244 4 Yes Yes No No Single h D
245 1 Yes Yes Yes Single h C
245 2 No No Delta h
259 1 No No Delta h
259 2 Yes Yes Yes Delta h
259 3 Yes Yes Yes Delta h
261 1 Yes No No Delta h
261 2 No No Delta h
265 1 Yes No No Single h C
265 2 Yes Yes Yes Delta h
268 1 Yes No No Single T A
268 2 Yes Yes Yes Single h D

Summary of Problems - Small HVAC Units
Architectural Energy Corporation 37
SITE ID Unit No. Linkage Moves
Responds to Cold Air
Monitoring shows
modulationEconomizer
works Control
type Changeover
Setpoint
270 1 Yes Yes Single T D
270 2 Yes Yes Single T D
270 3 Yes Yes Single T D
280 1 No No Delta h
280 2 No No Delta h
317 1 Yes No No Single T A
339 1 Yes Yes Yes Single h D
340 1 No No Single T B
343 1 Yes Yes Yes Single T
343 2 Yes Yes Yes Single T
376 1 Yes No No Single T
376 2 No No Single T C
407 1 No No Delta h
407 2 Yes Yes Yes Delta h
484 1 Yes Yes Delta T
484 2 Yes Yes Delta T

Summary of Problems - Small HVAC Units
Architectural Energy Corporation 38
Table A-4. Air Flow and Fan Power Test Results
SITE ID Unit no. Capacity
(ton) Measured
CFM Cfm/ton
Deviation from 400 cfm/ton
EER impact
170 AC-1 7.5 684 91 -77% -27%
170 RTU-2 4 1,010 253 -37% -13%
170 RTU-3 7.5 1,850 247 -38% -13%
174 AC-1 7.5 1,935 258 -36% -12%
174 AC-2 7.5 2,017 269 -33% -11%
185 AC-3 7.5 2,890 385 -4% -1%
185 AC-4 7.5 2,704 361 -10% -3%
185 AC-5 5 1,977 395 -1% 0%
195 AC2 2 707 354 -12% -4%
195 AC3 2 650 325 -19% -7%
195 AC4 2 1,065 533 33% 12%
197 RTU#1 5 1,190 238 -41% -14%
197 Unit #3 3 924 308 -23% -8%
197 Unit #4 3 990 330 -18% -6%
197 Unit#2 5 1,290 258 -36% -12%
198 AC1 3 872 291 -27% -10%
198 AC2 5 1,307 261 -35% -12%
207 AC-1 4 1,840 460 15% 5%
207 AC-2 4 1,495 374 -7% -2%
211 AC-1 7.5 2,076 277 -31% -11%
211 AC-3 4 1,364 341 -15% -5%
213 AC30 10 3,117 312 -22% -8%
216 RTU-09 5 1,437 287 -28% -10%
245 AC12 7.5 2,565 342 -15% -5%
259 RTU-1 5 1,702 340 -15% -5%
259 RTU-2 3 820 273 -32% -11%

Summary of Problems - Small HVAC Units
Architectural Energy Corporation 39
SITE ID Unit no. Capacity
(ton) Measured
CFM Cfm/ton
Deviation from 400 cfm/ton
EER impact
259 RTU-3 3 960 320 -20% -7%
261 AC-1 10 3,611 361 -10% -3%
261 AC-2 10 3,310 331 -17% -6%
265 AC-1 5 1,626 325 -19% -7%
265 AC-2 6 1,173 196 -51% -18%
268 AC-1 5 1,870 374 -7% -2%
268 RTU-2 7.5 1,650 220 -45% -16%
270 AC-1 3 1,445 482 20% 7%
270 AC-2 3 1,360 453 13% 5%
270 AC-3 3 1,350 450 13% 4%
273 A/C South 4 1,330 333 -17% -6%
273 N1 4 1,390 348 -13% -5%
280 AC2 2 872 436 9% 3%
280 AC4 2.5 1,021 408 2% 1%
283 AC-1.1 4 1,210 303 -24% -9%
283 AC-1.2 3 860 287 -28% -10%
283 AC-1.6 5 1,020 204 -49% -17%
314 AC-7 3.5 790 226 -44% -15%
317 AC1 12.5 3,632 291 -27% -10%
325 RTU-1 5 1,480 296 -26% -9%
332 E-2 3 960 320 -20% -7%
332 East 1 3 950 317 -21% -7%
339 AC-11 7.5 2,399 320 -20% -7%
340 RTU-3 10 3,760 376 -6% -2%
340 Unit 1 4 1,300 325 -19% -7%
343 RTU-1 6 2,403 401 0% 0%
343 RTU-5 8 3,991 499 25% 9%
347 RTU-4 6.25 2,590 414 4% 1%
Summary of Problems - Small HVAC Units
Architectural Energy Corporation 40
SITE ID Unit no. Capacity
(ton) Measured
CFM Cfm/ton
Deviation from 400 cfm/ton
EER impact
365 Unit 1 2 935 468 17% 6%
365 Unit 2 2 690 345 -14% -5%
376 Unit 2 3 789 263 -34% -12%
376 Unit1 5 982 196 -51% -18%
388 Unit-1 5 1,550 310 -23% -8%
388 Unit-2 5 1,395 279 -30% -11%
402 RTU-1 4 1,935 484 21% 7%
402 RTU-2 5 1,705 341 -15% -5%
407 AC-1 3 1,222 407 2% 1%
407 AC-2 3 1,059 353 -12% -4%
467 AC-1 10 2,667 267 -33% -12%
467 AC-2 10 2,903 290 -27% -10%
467 AC-3 6 1,044 174 -57% -20%
467 AC-4 4 1,163 291 -27% -10%
484 A6-10 6.25 2,030 325 -19% -7%
484 AC-11 10 3,390 339 -15% -5%
525 #2 6 1,170 195 -51% -18%
525 RTU-1 6 1,500 250 -38% -13%

Summary of Problems - Small HVAC Units
Architectural Energy Corporation 41
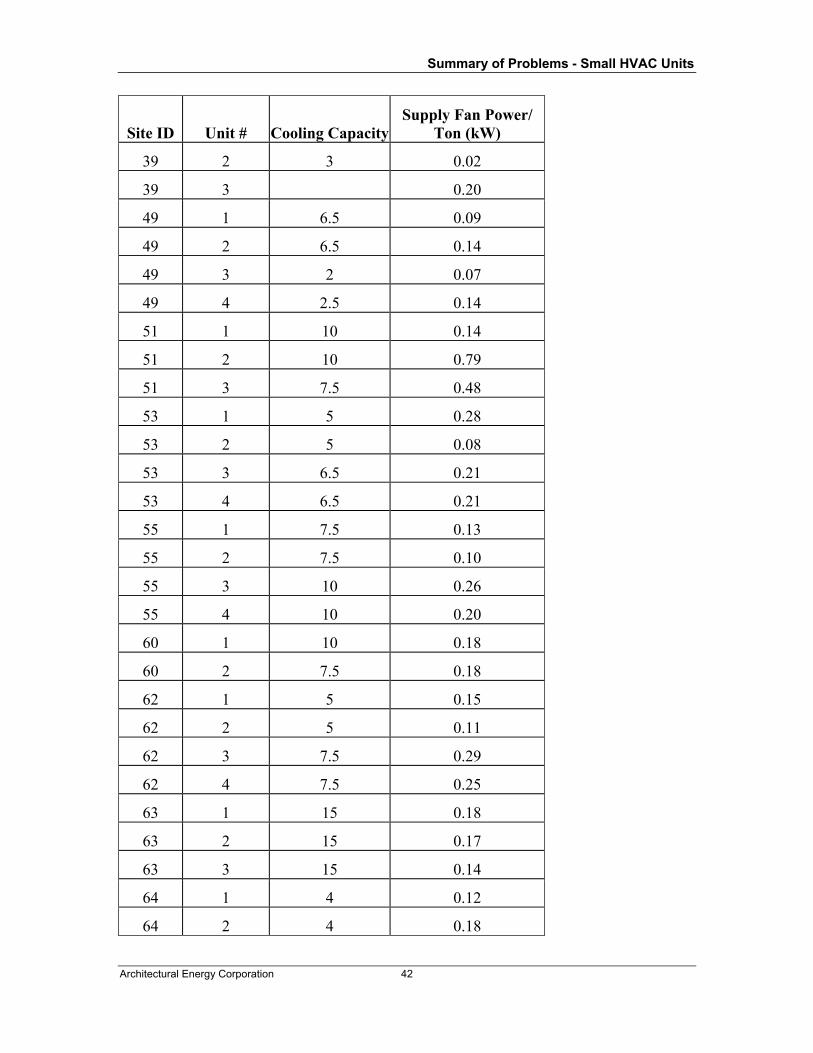
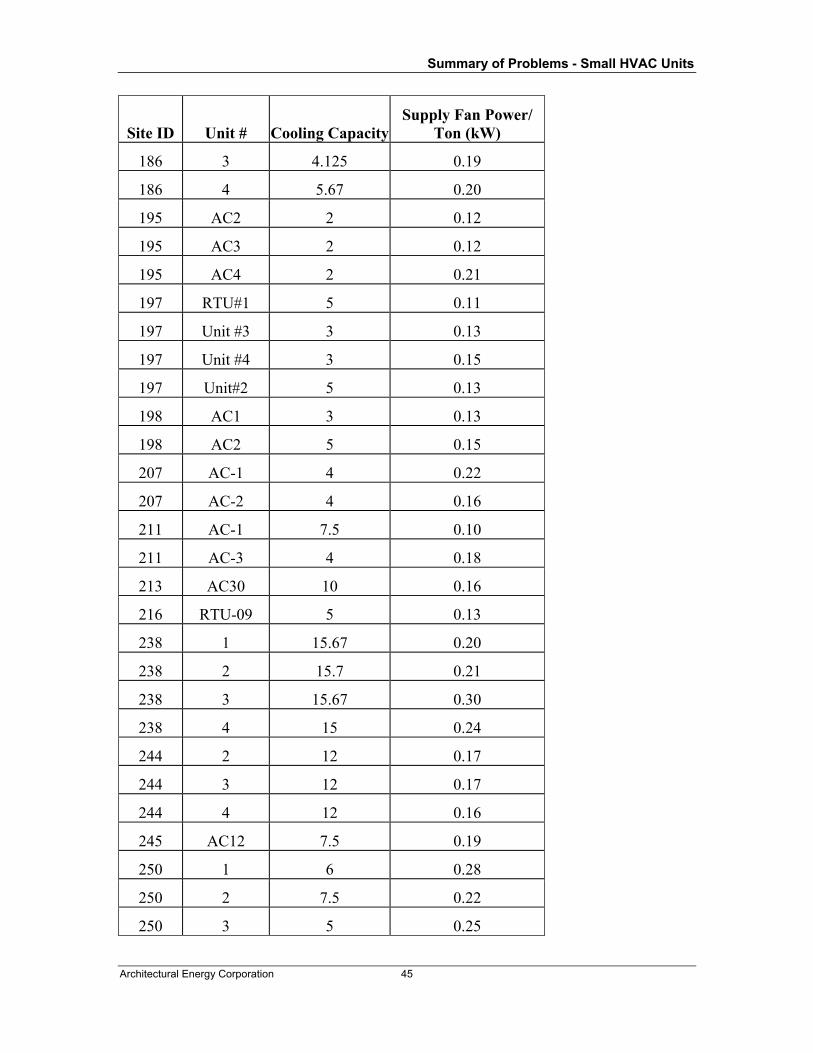
Table A-5. Fan Power Normalized to Nominal Capacity
Site ID Unit # Cooling CapacitySupply Fan Power/
Ton (kW)
1 1 5 0.16
1 2 5 0.16
1 3 5 0.12
1 4 5 0.12
5 3 10 0.26
7 1 4 0.15
7 2 3 0.05
7 3 2.5 0.05
11 1 4 0.14
11 2 3 0.16
11 3 3 0.16
11 4 3 0.15
15 1 5 0.13
15 2 6 0.12
15 3 7.5 0.16
15 4 3 0.22
17 1 5 0.09
17 2 5 0.27
17 3 5 0.12
29 1 4 0.09
29 2 3 0.33
29 3 7.5 0.03
37 1 5 0.16
37 2 5 0.17
37 3 5 0.20
37 4 7 0.18
39 1 4 0.08
Summary of Problems - Small HVAC Units
Architectural Energy Corporation 42
Site ID Unit # Cooling CapacitySupply Fan Power/
Ton (kW)
39 2 3 0.02
39 3 0.20
49 1 6.5 0.09
49 2 6.5 0.14
49 3 2 0.07
49 4 2.5 0.14
51 1 10 0.14
51 2 10 0.79
51 3 7.5 0.48
53 1 5 0.28
53 2 5 0.08
53 3 6.5 0.21
53 4 6.5 0.21
55 1 7.5 0.13
55 2 7.5 0.10
55 3 10 0.26
55 4 10 0.20
60 1 10 0.18
60 2 7.5 0.18
62 1 5 0.15
62 2 5 0.11
62 3 7.5 0.29
62 4 7.5 0.25
63 1 15 0.18
63 2 15 0.17
63 3 15 0.14
64 1 4 0.12
64 2 4 0.18

Summary of Problems - Small HVAC Units
Architectural Energy Corporation 43
Site ID Unit # Cooling CapacitySupply Fan Power/
Ton (kW)
64 3 4 0.13
65 1 12 0.18
65 2 10 0.19
65 3 10 0.28
65 4 10 0.13
67 1 7.5 0.39
67 2 15 0.39
77 1 5 0.17
77 2 6 0.24
80 1 7 0.23
80 2 7 0.15
80 3 4 0.22
80 4 4 0.22
133 1 5 0.16
133 2 5 0.14
133 3 5 0.20
133 4 5 0.19
146 1 5.1 0.67
146 2 3 0.22
146 3 3 0.28
147 1 7.5 0.65
147 2 7.53 0.70
152 1 7.5 0.11
161 1 3 0.22
161 2 3 0.37
161 3 3.5 0.15
161 4 5 0.17
166 1 7.5 0.39

Summary of Problems - Small HVAC Units
Architectural Energy Corporation 44
Site ID Unit # Cooling CapacitySupply Fan Power/
Ton (kW)
166 2 5 0.09
166 3 4 0.20
166 4 6 0.29
168 1 10 0.14
168 2 8.5 0.15
168 3 8.5 0.13
168 4 8.5 0.22
170 AC-1 7.5 0.05
170 RTU-2 4 0.00
172 1 8.5 0.14
172 2 4 0.27
172 3 4 0.26
172 4 2 0.11
174 AC-1 7.5 0.09
174 AC-2 7.5 0.12
175 1 8.5 0.21
175 2 5 0.14
175 3 7 0.11
176 1 3 0.04
176 2 2 0.02
176 3 3 0.04
176 4 1.5 0.02
185 AC-1 7.5 0.19
185 AC-3 7.5 0.19
185 AC-4 7.5 0.18
185 AC-5 5 0.15
186 1 4.125 0.26
186 2 4.125 0.30
Summary of Problems - Small HVAC Units
Architectural Energy Corporation 45
Site ID Unit # Cooling CapacitySupply Fan Power/
Ton (kW)
186 3 4.125 0.19
186 4 5.67 0.20
195 AC2 2 0.12
195 AC3 2 0.12
195 AC4 2 0.21
197 RTU#1 5 0.11
197 Unit #3 3 0.13
197 Unit #4 3 0.15
197 Unit#2 5 0.13
198 AC1 3 0.13
198 AC2 5 0.15
207 AC-1 4 0.22
207 AC-2 4 0.16
211 AC-1 7.5 0.10
211 AC-3 4 0.18
213 AC30 10 0.16
216 RTU-09 5 0.13
238 1 15.67 0.20
238 2 15.7 0.21
238 3 15.67 0.30
238 4 15 0.24
244 2 12 0.17
244 3 12 0.17
244 4 12 0.16
245 AC12 7.5 0.19
250 1 6 0.28
250 2 7.5 0.22
250 3 5 0.25

Summary of Problems - Small HVAC Units
Architectural Energy Corporation 46
Site ID Unit # Cooling CapacitySupply Fan Power/
Ton (kW)
250 4 7.5 0.19
259 RTU-1 5 0.20
259 RTU-2 3 0.11
259 RTU-3 3 0.10
265 AC-1 5 0.18
265 AC-2 6 0.09
268 AC-1 5 0.15
268 RTU-2 7.5 0.20
270 AC-1 3 0.09
270 AC-2 3 0.12
270 AC-3 3 0.15
273 A/C South 4 0.16
273 N1 4 0.29
280 AC2 2 0.18
280 AC4 2.5 0.16
283 AC-1.1 4 0.11
283 AC-1.2 3 0.12
283 AC-1.6 5 0.09
314 AC-7 3.5 0.12
317 AC1 12.5 0.13
325 RTU-1 5 0.15
332 E-2 3 0.20
332 East 1 3 0.20
339 AC-11 7.5 0.20
340 RTU-3 10 0.19
340 Unit 1 4 0.13
343 RTU-1 6 0.27
343 RTU-5 8 0.16

Summary of Problems - Small HVAC Units
Architectural Energy Corporation 47
Site ID Unit # Cooling CapacitySupply Fan Power/
Ton (kW)
365 Unit 1 2 0.18
365 Unit 2 2 0.16
376 Unit 2 3 0.15
376 Unit1 5 0.11
388 Unit-1 5 0.16
388 Unit-2 5 0.13
402 RTU-1 4 0.24
402 RTU-2 5 0.15
407 AC-1 3 0.15
407 AC-2 3 0.11
467 AC-1 10 0.16
467 AC-2 10 0.18
467 AC-3 6 0.13
467 AC-4 4 0.16
484 A6-10 6.25 0.14
484 AC-11 10 0.16
525 #2 6 0.09
525 RTU-1 6 0.15
Average 0.18
Summary of Problems - Small HVAC Units
Architectural Energy Corporation 48
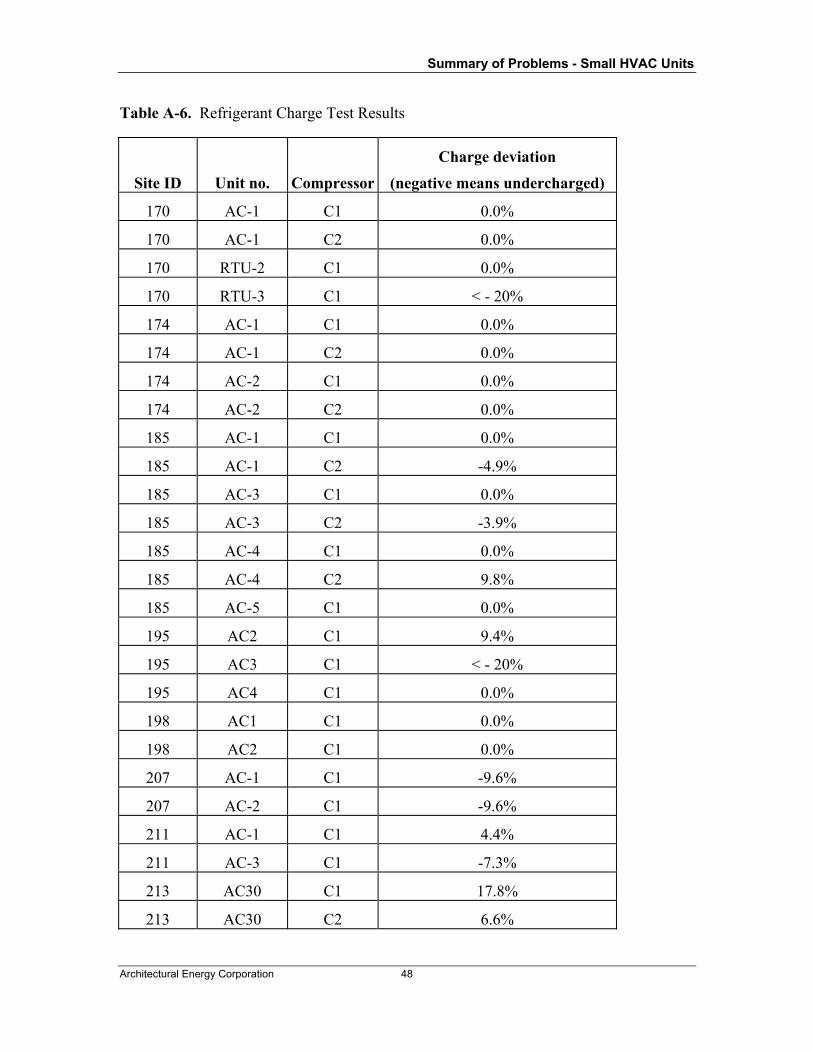
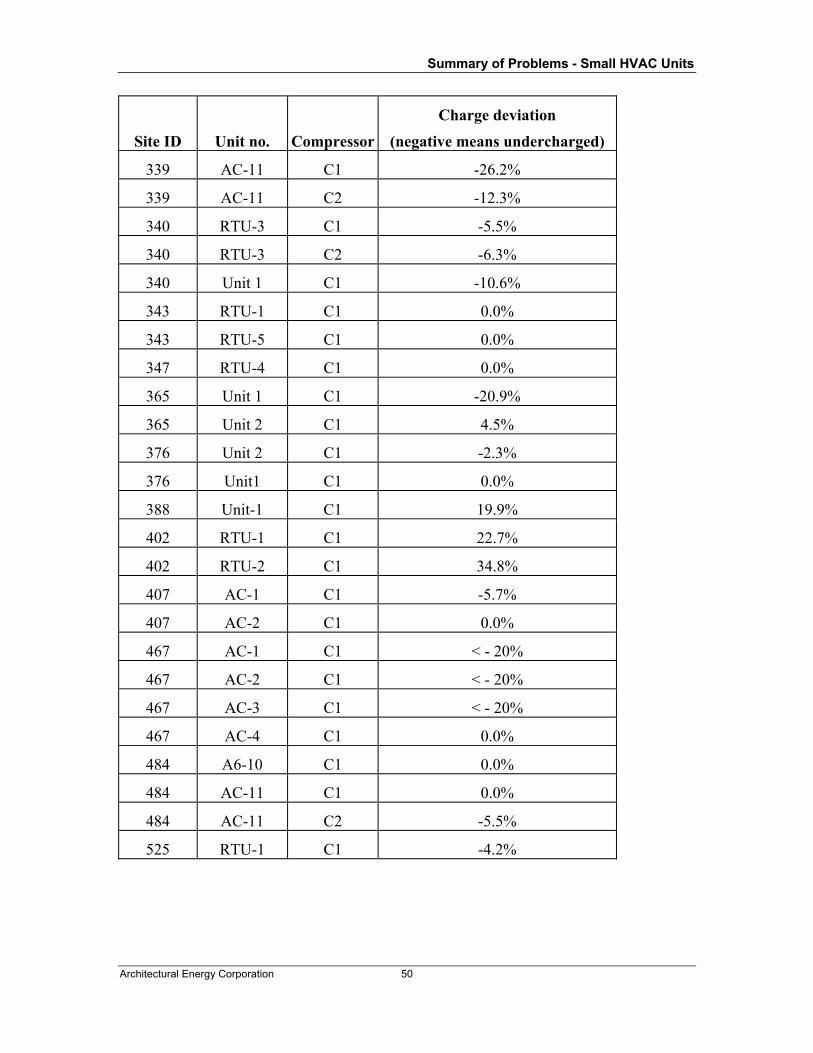
Table A-6. Refrigerant Charge Test Results
Site ID Unit no. Compressor
Charge deviation
(negative means undercharged)
170 AC-1 C1 0.0%
170 AC-1 C2 0.0%
170 RTU-2 C1 0.0%
170 RTU-3 C1 < - 20%
174 AC-1 C1 0.0%
174 AC-1 C2 0.0%
174 AC-2 C1 0.0%
174 AC-2 C2 0.0%
185 AC-1 C1 0.0%
185 AC-1 C2 -4.9%
185 AC-3 C1 0.0%
185 AC-3 C2 -3.9%
185 AC-4 C1 0.0%
185 AC-4 C2 9.8%
185 AC-5 C1 0.0%
195 AC2 C1 9.4%
195 AC3 C1 < - 20%
195 AC4 C1 0.0%
198 AC1 C1 0.0%
198 AC2 C1 0.0%
207 AC-1 C1 -9.6%
207 AC-2 C1 -9.6%
211 AC-1 C1 4.4%
211 AC-3 C1 -7.3%
213 AC30 C1 17.8%
213 AC30 C2 6.6%

Summary of Problems - Small HVAC Units
Architectural Energy Corporation 49
Site ID Unit no. Compressor
Charge deviation
(negative means undercharged)
216 RTU-09 C1 -4.7%
245 AC12 C1 0.0%
245 AC12 C2 < - 20%
259 RTU-1 C1 0.0%
259 RTU-2 C1 0.0%
259 RTU-3 C1 0.0%
261 AC-2 C1 0.0%
261 AC-2 C2 0.0%
265 AC-1 C1 0.0%
265 AC-2 C1 0.0%
268 AC-1 C1 0.0%
268 RTU-2 C1 0.0%
268 RTU-2 C2 -2.5%
270 AC-1 C1 -7.8%
270 AC-2 C1 0.0%
270 AC-3 C1 -3.1%
273 A/C South C1 0.0%
273 N1 C1 0.0%
280 AC2 C1 -7.5%
280 AC4 C1 -7.3%
283 AC-1.1 C1 -10.6%
283 AC-1.2 C1 -9.8%
283 AC-1.6 C1 0.0%
314 AC-7 C1 0.0%
317 AC1 C1 0.0%
317 AC1 C2 0.0%
325 RTU-1 C1 -5.5%
332 E-2 C1 -1.8%
Summary of Problems - Small HVAC Units
Architectural Energy Corporation 50
Site ID Unit no. Compressor
Charge deviation
(negative means undercharged)
339 AC-11 C1 -26.2%
339 AC-11 C2 -12.3%
340 RTU-3 C1 -5.5%
340 RTU-3 C2 -6.3%
340 Unit 1 C1 -10.6%
343 RTU-1 C1 0.0%
343 RTU-5 C1 0.0%
347 RTU-4 C1 0.0%
365 Unit 1 C1 -20.9%
365 Unit 2 C1 4.5%
376 Unit 2 C1 -2.3%
376 Unit1 C1 0.0%
388 Unit-1 C1 19.9%
402 RTU-1 C1 22.7%
402 RTU-2 C1 34.8%
407 AC-1 C1 -5.7%
407 AC-2 C1 0.0%
467 AC-1 C1 < - 20%
467 AC-2 C1 < - 20%
467 AC-3 C1 < - 20%
467 AC-4 C1 0.0%
484 A6-10 C1 0.0%
484 AC-11 C1 0.0%
484 AC-11 C2 -5.5%
525 RTU-1 C1 -4.2%
Summary of Problems - Small HVAC Units
Architectural Energy Corporation 51
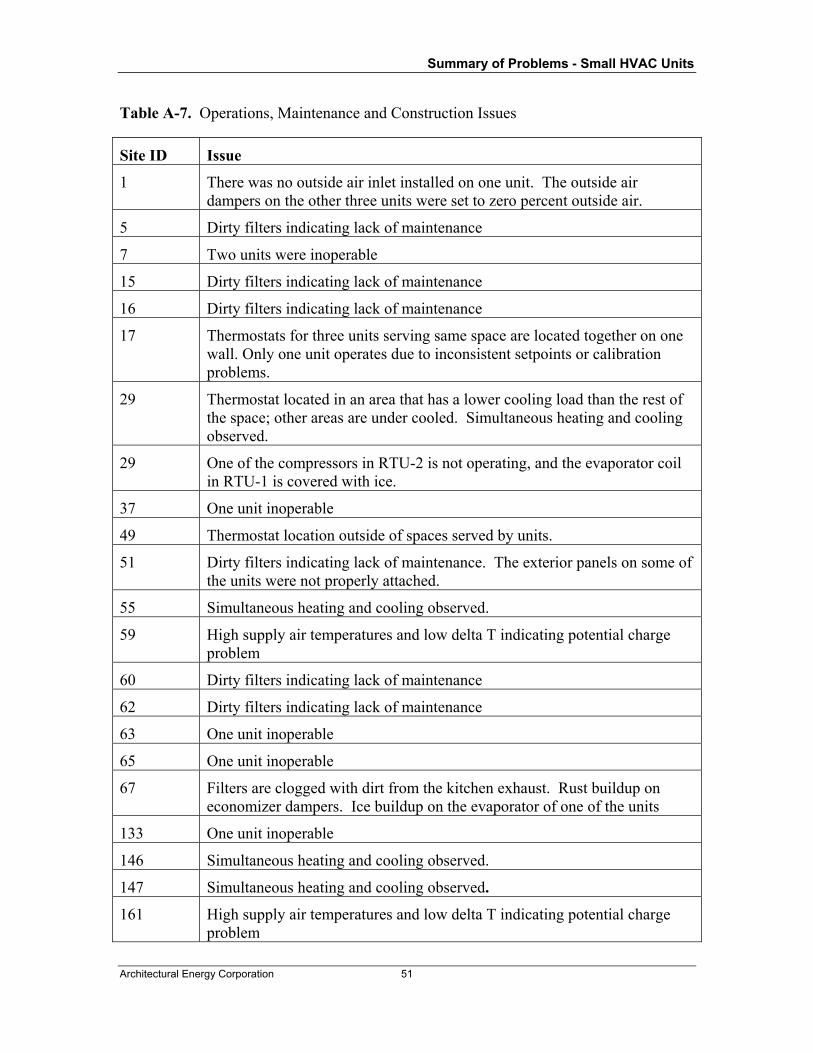
Table A-7. Operations, Maintenance and Construction Issues
Site ID Issue
1 There was no outside air inlet installed on one unit. The outside air dampers on the other three units were set to zero percent outside air.
5 Dirty filters indicating lack of maintenance
7 Two units were inoperable
15 Dirty filters indicating lack of maintenance
16 Dirty filters indicating lack of maintenance
17 Thermostats for three units serving same space are located together on one wall. Only one unit operates due to inconsistent setpoints or calibration problems.
29 Thermostat located in an area that has a lower cooling load than the rest of the space; other areas are under cooled. Simultaneous heating and cooling observed.
29 One of the compressors in RTU-2 is not operating, and the evaporator coil in RTU-1 is covered with ice.
37 One unit inoperable
49 Thermostat location outside of spaces served by units.
51 Dirty filters indicating lack of maintenance. The exterior panels on some of the units were not properly attached.
55 Simultaneous heating and cooling observed.
59 High supply air temperatures and low delta T indicating potential charge problem
60 Dirty filters indicating lack of maintenance
62 Dirty filters indicating lack of maintenance
63 One unit inoperable
65 One unit inoperable
67 Filters are clogged with dirt from the kitchen exhaust. Rust buildup on economizer dampers. Ice buildup on the evaporator of one of the units
133 One unit inoperable
146 Simultaneous heating and cooling observed.
147 Simultaneous heating and cooling observed.
161 High supply air temperatures and low delta T indicating potential charge problem

Summary of Problems - Small HVAC Units
Architectural Energy Corporation 52
Site ID Issue
165 Dirty filters indicating lack of maintenance
169 Maintenance access panels were welded on. The wiring of one of the units was unsafe because of poor installation.
170 Dirty iced coils, loose fan belt, no vibration dampers on replaced compressor, OA intake near exhaust
174 Restricted maintenance access due to parapet wall
175 High supply air temperatures and low delta T indicating potential charge problem
185 Bad schrader valve on compressor leaking refrigerant.
198 Units provide no outside air
213 Units provide no outside air
250 Units connected to wrong zones due to mislabeling.
270 Units provide no outside air

Summary of Problems - Small HVAC Units – Appendix B
1
APPENDX B - SITE FINDINGS
This Appendix summarizes the results of the field testing for each site in the study. The sites in Round 1 (Summer/Fall 2001) are described first, followed by the sites in Round 2 (Summer/Fall 2002). The site conditions are described, along with an estimate of the energy impacts of the conditions observed.
1 ROUND ONE SITES
The results of the site inspections in Round 1 are described in this section. The diagnostic testing process used in Round 1 included on-site auditing, spot-testing of equipment, and short-term monitoring using battery-powered dataloggers.
During the on-site audit, a sample of HVAC units was selected for study. Information on the energy use characteristics of the spaces served by the selected units was collected, including wall and roof areas and insulation levels, window type and size, electric lighting systems and controls and miscellaneous plug loads. Building personnel were interviewed to obtain an understanding of existing O&M procedures.
Spot-checking equipment with hand-held instruments was done to provide a glimpse of the system performance during the survey. Fan power, compressor power and economizer functional testing was conducted. The economizer functional tests consisted of a mechanical check of the dampers and actuators, followed by a cold spray test to observe the functioning of the economizer controller and sensors.
Short-term dynamic diagnostic monitoring was utilized to develop an in-depth understanding of the rooftop system operation. Short-term diagnostic testing is the application of specialized software and hardware tools to gather and analyze data for the evaluation of the performance of building energy systems. A maximum of four rooftop units were monitored at each site. Portable, battery-powered dataloggers were used to collect the following data:
• Ambient temperature
• Relative humidity on selected sites
• Rooftop unit current
• Return air temperature
• Supply air temperature
• Mixed air temperature
• Room temperature
Data were collected every three minutes for approximately fourteen days. At the end of the monitoring period, the dataloggers were removed and the data were downloaded and
Summary of Problems - Small HVAC Units – Appendix B
2
analyzed. Time series plots of unit kW were used to look at fan power, fan control, and compressor operation. Diagnostic plots of temperatures were used to observe economizer operation, supply temperatures and cooling coil temperature drop under various load scenarios. Economizer diagnostic plots were used to determine if the economizers were responding properly over a range of operating conditions. Supply temperature and coil temperature drop were used to screen units for potential refrigerant charge and/or air flow problems.
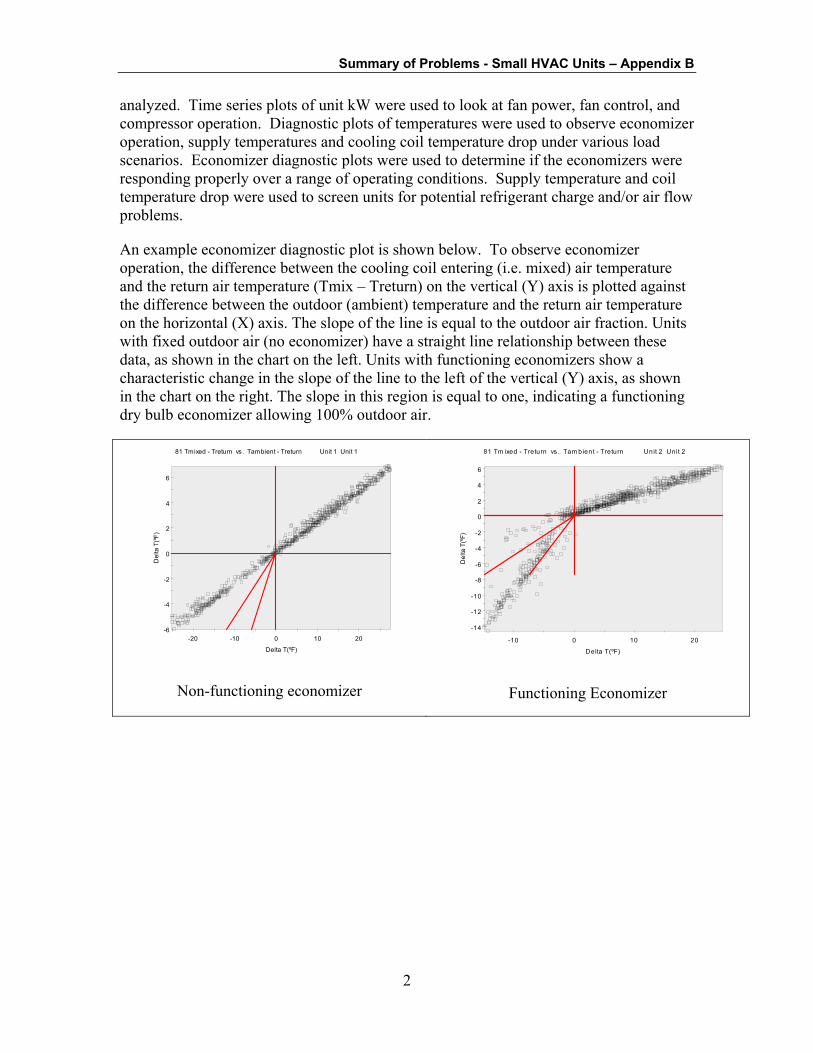
An example economizer diagnostic plot is shown below. To observe economizer operation, the difference between the cooling coil entering (i.e. mixed) air temperature and the return air temperature (Tmix – Treturn) on the vertical (Y) axis is plotted against the difference between the outdoor (ambient) temperature and the return air temperature on the horizontal (X) axis. The slope of the line is equal to the outdoor air fraction. Units with fixed outdoor air (no economizer) have a straight line relationship between these data, as shown in the chart on the left. Units with functioning economizers show a characteristic change in the slope of the line to the left of the vertical (Y) axis, as shown in the chart on the right. The slope in this region is equal to one, indicating a functioning dry bulb economizer allowing 100% outdoor air.
-6
-4
-2
0
2
4
6
-20 -10 0 10 20
Del
ta T
(ºF)
Delta T(ºF)
81 Tmixed - Treturn vs. Tambient - Treturn Unit 1 Unit 1
Non-functioning economizer
-14
-12
-10
-8
-6
-4
-2
0
2
4
6
-10 0 10 20
Del
ta T
(ºF)
Delta T(ºF)
81 Tm ixed - Treturn vs . Tam bient - Treturn Unit 2 Unit 2
Functioning Economizer
Summary of Problems - Small HVAC Units – Appendix B
3
Site 1 - 1956 Palma Office Building
The Office at 1956 Palma is approximately18,500 square foot in size. The space divided between conditioned offices and unconditioned storage.
Heating and cooling for the building is provided by five-ton Carrier packaged air conditioners. None of the units are equipped with economizers. Honeywell thermostats are used to control space temperatures.
Monitoring Configuration
Short term diagnostic monitoring was performed on four of the units at this site. The units are classified by the following serial numbers: 1997G10051, 3497G10023, 2398g10044, and 3098G10041.
Economizer Operation
None of the units surveyed had economizers.
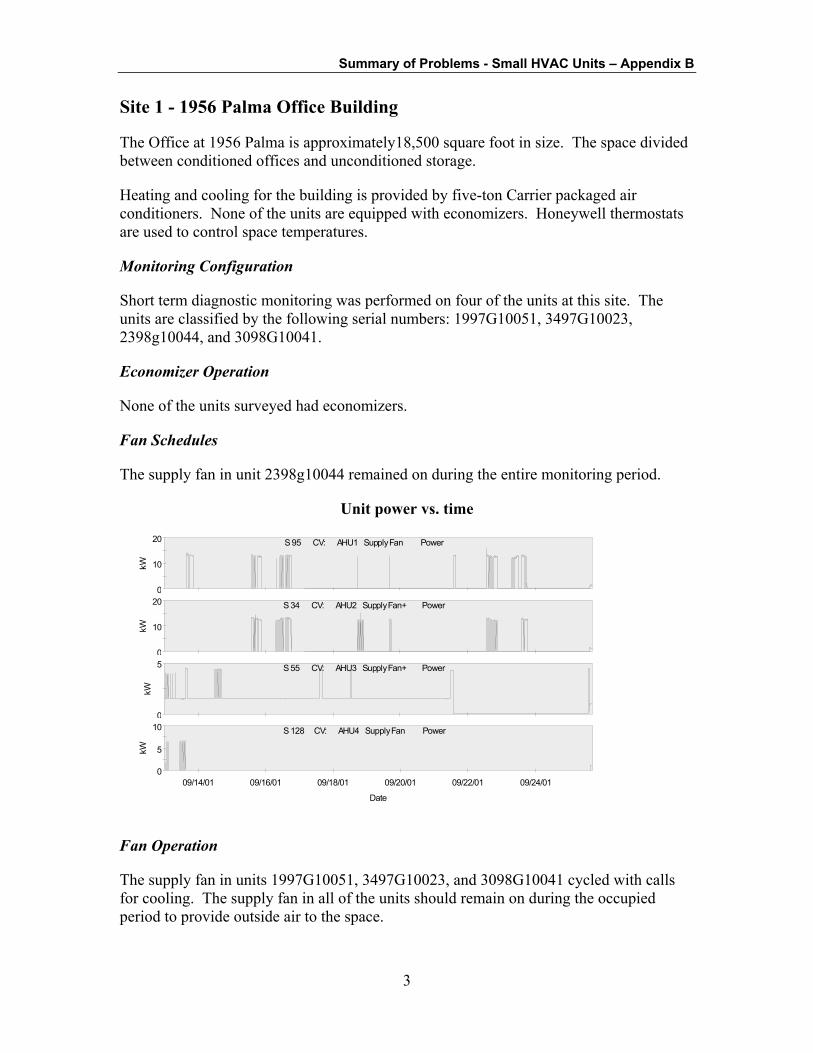
Fan Schedules
The supply fan in unit 2398g10044 remained on during the entire monitoring period.
Unit power vs. time
0
10
20
kW
S 95 CV: AHU1 Supply Fan Power
0
10
20
kW
S 34 CV: AHU2 Supply Fan+ Power
0
5
kW
S 55 CV: AHU3 Supply Fan+ Power
0
5
10
09/14/01 09/16/01 09/18/01 09/20/01 09/22/01 09/24/01
kW
Date
S 128 CV: AHU4 Supply Fan Power
Fan Operation
The supply fan in units 1997G10051, 3497G10023, and 3098G10041 cycled with calls for cooling. The supply fan in all of the units should remain on during the occupied period to provide outside air to the space.
Summary of Problems - Small HVAC Units – Appendix B
4
Fan Power
ARI ratings are based on a supply fan power of 365W/1000 cfm. On site testing showed an average of 355W/1000 cfm for the three units monitored.
Simultaneous Heating and Cooling
During the monitoring period none of the units operated in heating mode. It is possible that simultaneous heating and cooling may occur during the more mild months.
Maintenance Condition
All of the units appeared to be in good condition.
Other Issues
There was no outside air inlet installed on unit 2398g10044. The outside air dampers on the other three units were set to zero percent outside air.

Summary of Problems - Small HVAC Units – Appendix B
5
Site 5 - Jack In the Box Rancho Cordova
The Jack In the Box at 9680 Business Park Road in Sacramento is a 4,596 square foot building. The space is conditioned and used as a quick service restaurant. Heating and cooling for the building is provided by York packaged air conditioners. All of the units are equipped with either differential temperature or single point temperature economizers, which modulate outside air proportions and provide free cooling when conditions permit.
Monitoring Configuration
Short term diagnostic monitoring was performed on three of the units at this site. The units are classified by the following numbers: AC-2, AC-1 and AC-3. AC-2 and AC-3 are ten ton units equipped with differential temperature economizers. AC-2 is seven and one-half tons and has a single-point temperature economizer.
Economizer Operations
The results of diagnostic monitoring show that the economizer dampers in AC-1 did not modulate during the monitoring period. The economizer in AC-2 and AC-3 responded appropriately to changes in climatic conditions.
Fan Schedules
The supply fans in all of the units ran continuously during the monitoring period. In order to maintain a good indoor air quality it is necessary for the supply fans to remain on while the building is occupied. If portions of the building are unoccupied during portions of the evening and night the units should be scheduled off.
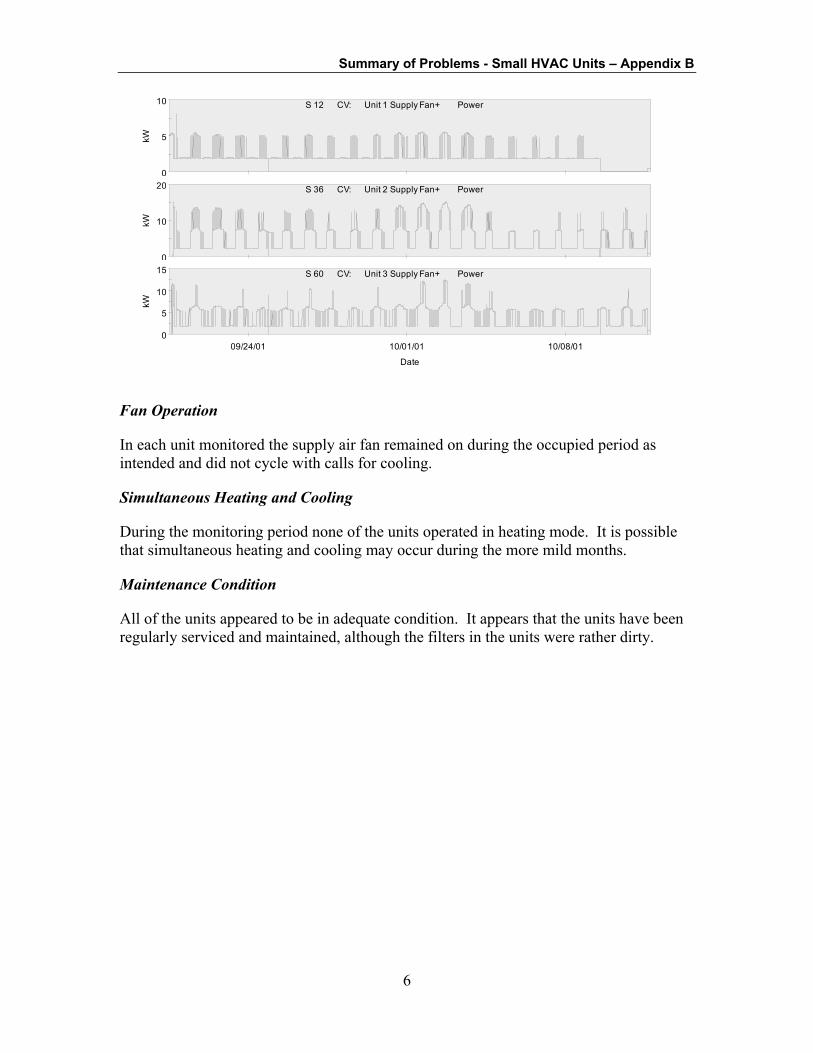
This figure displays the kW for each of the units over time. Each series of data (from top to bottom) represents a different unit. The kW is labeled to the left of each time series plot. The date and time are labeled at the bottom. Each unit is labeled in the center of the top of each series.
Summary of Problems - Small HVAC Units – Appendix B
6
0
5
10
kW
S 12 CV: Unit 1 Supply Fan+ Power
0
10
20
kW
S 36 CV: Unit 2 Supply Fan+ Power
0
5
10
15
09/24/01 10/01/01 10/08/01
kW
Date
S 60 CV: Unit 3 Supply Fan+ Power
Fan Operation
In each unit monitored the supply air fan remained on during the occupied period as intended and did not cycle with calls for cooling.
Simultaneous Heating and Cooling
During the monitoring period none of the units operated in heating mode. It is possible that simultaneous heating and cooling may occur during the more mild months.
Maintenance Condition
All of the units appeared to be in adequate condition. It appears that the units have been regularly serviced and maintained, although the filters in the units were rather dirty.

Summary of Problems - Small HVAC Units – Appendix B
7
Site 7 - Northpoint Offices
The Office at 1650 Northpoint Parkway in Santa Rosa is a 7,137 square foot building. The entire space is conditioned and used for offices.
Heating and cooling for the building is provided by Bryant packaged air conditioners. None of the units are equipped with economizers, which modulate outside air proportions and provide free cooling when conditions permit.
Monitoring Configuration
Short term diagnostic monitoring was performed on three of the units at this site. The units are classified by the following model numbers: 582AEW048090AAAG, 582AEW036060AAAF and 582APW030060AAAD. The on site name for these units are Unit 1, Unit 2 and Unit 3 respectively.
Fan Schedules
The operation of the three units monitored does not follow the occupancy schedule of the building. Unit 582AEW048090AAAG cycled from off to cooling at an average rate of two times per hour at all hours of the day. The other two units remained off during the entire monitoring period.
This figure displays the current for each of the units over time. Each series of data, from top to bottom represents a different unit. The amperage is labeled to the left of each time series plot. The date and time are labeled at the bottom. Each unit is labeled in the center of the top of each series.
0
10
20
amps
S 123 CV: Unit 1 Supply Fan Current
0.0
0.5
1.0
amps
H 719 CV: Unit 2 Supply Fan Current
0.0
1.0
2.0
3.0
09/17/01 09/24/01 10/01/01
amps
Date
S 721 CV: Unit 3 Supply Fan Current:2
Summary of Problems - Small HVAC Units – Appendix B
8
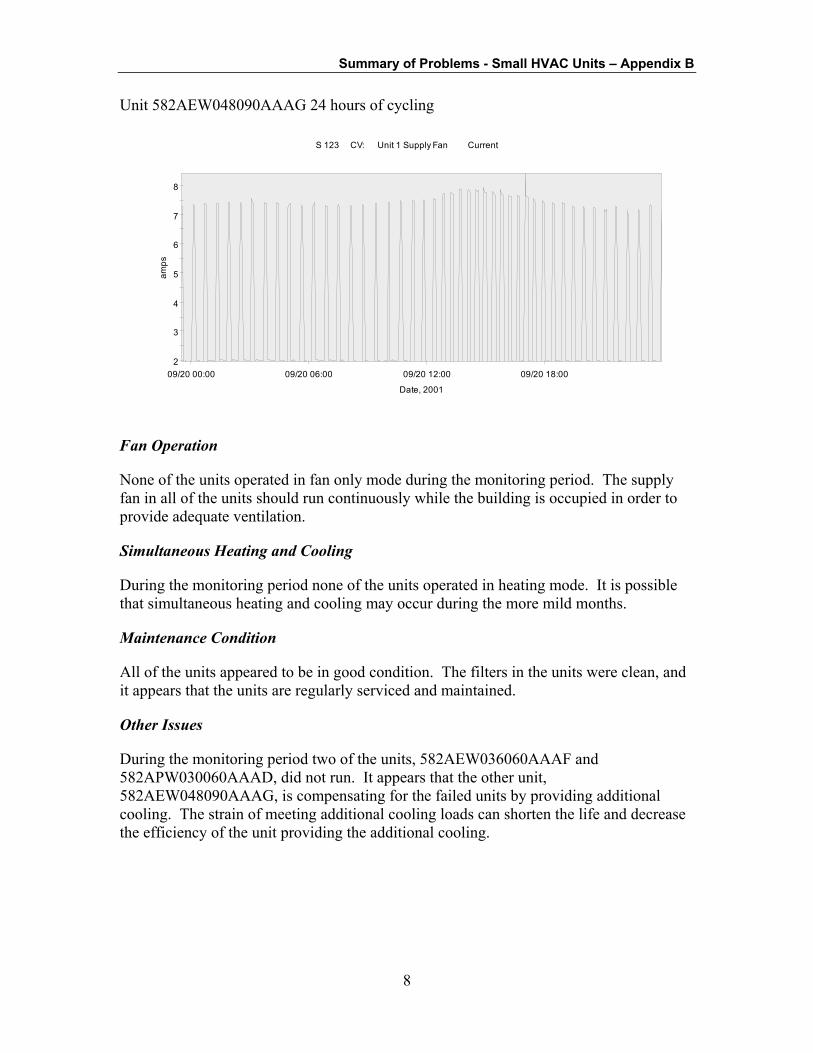
Unit 582AEW048090AAAG 24 hours of cycling
2
3
4
5
6
7
8
09/20 00:00 09/20 06:00 09/20 12:00 09/20 18:00
amps
Date, 2001
S 123 CV: Unit 1 Supply Fan Current
Fan Operation
None of the units operated in fan only mode during the monitoring period. The supply fan in all of the units should run continuously while the building is occupied in order to provide adequate ventilation.
Simultaneous Heating and Cooling
During the monitoring period none of the units operated in heating mode. It is possible that simultaneous heating and cooling may occur during the more mild months.
Maintenance Condition
All of the units appeared to be in good condition. The filters in the units were clean, and it appears that the units are regularly serviced and maintained.
Other Issues
During the monitoring period two of the units, 582AEW036060AAAF and 582APW030060AAAD, did not run. It appears that the other unit, 582AEW048090AAAG, is compensating for the failed units by providing additional cooling. The strain of meeting additional cooling loads can shorten the life and decrease the efficiency of the unit providing the additional cooling.

Summary of Problems - Small HVAC Units – Appendix B
9
Site 11 - IDS - Disney Offices
The IDS - Disney Office at 2250 South Sequoia is a single story 610,000 square foot building. The majority of the space is used for unconditioned storage; a small portion is conditioned office space.
Heating and cooling for the building is provided by three- and four-ton Carrier packaged air conditioners. None of the units are equipped with economizers, which modulate outside air proportions and provide free cooling when conditions permit. Carrier thermostats control the HVAC system.
Monitoring Configuration
Short-term diagnostic monitoring was performed on three of the units at this site. The units are classified by the following serial numbers: 0600G20154, 0600G20170, and 1200G20169. The on-site names for these units are AC-2, AC-3 and AC-6 respectively.
Economizer Operations
None of the units monitored had economizers.
Fan Schedules
The supply fan in unit 0600G20170 ran continuously during the monitoring period. The supply fan in units 1200G20074 and 1200G20169 cycled with compressor operation.
This figure displays the kW for each of the units over time. Each series of data (from top to bottom) represents a different unit. The kW is labeled to the left of each time series plot. The date and time are labeled at the bottom. Each unit is labeled in the center of the top of each series.

Summary of Problems - Small HVAC Units – Appendix B
10
Fan Power vs. Time
2kWS 36 CV: Unit 2 Supply Fan+ Power
2
4
kW
S 148 CV: Unit 3 Supply Fan Power
2
4
6
10/29/01 11/05/01
kW
Date
S 84 CV: Unit 4 Supply Fan+ Power
Fan Power
ARI ratings are based on a supply fan power of 365W/1000 cfm. On-site testing showed an average of 376W/1000 cfm for the three units monitored.
Simultaneous Heating and Cooling
During the monitoring period each of the units had the opportunity to run in both heating and cooling mode. No simultaneous heating and cooling occurred.
Maintenance Condition
All of the units appeared to be in good condition. At the time of the monitoring period the filters in the units were clean and it appeared that the units were regularly serviced and well cared for.
Summary of Problems - Small HVAC Units – Appendix B
11
Site 15 - Lucky Savon Supermarket La Mesa
The Lucky Savon Supermarket at 8920 Fletcher Parkway in La Mesa is a 55,000 square foot building. The space is divided between conditioned sales and unconditioned storage.
Heating and cooling for the building is provided by Trane packaged air conditioners. The units are equipped with either single point enthalpy or single point temperature economizers, which modulate outside air proportions and provide free cooling when conditions permit.
Monitoring Configuration
Short-term diagnostic monitoring was performed on four of the units at this site. The unit serial numbers are: N48102900D, N48102869D, N48102901D, and N48102869D. The on-site numbers for these units are RTU-1, RTU-2, RTU-3, and RTU-4 respectively.
Economizer Operations
The results of diagnostic monitoring show that the economizer dampers did not modulate during the monitoring period.
Fan Operation
In all of the units the supply fan ran continuously during the monitoring period.
This figure displays the current for each of the units over time. Each series of data (from top to bottom) represents a different unit. The current is labeled to the left of each time series plot. The date and time are labeled at the bottom. Each unit is labeled in the center of the top of each series.

Summary of Problems - Small HVAC Units – Appendix B
12
Supply Fan Power vs. Time
0
10
20am
psS 196 CV: AHU1 Supply Fan Current:2
0
10
amps
S 220 CV: AHU2 Supply Fan Current:2
0
10
20
amps
S 230 CV: AHU3 Supply Fan Current:5
0
5
10
10/08/01 10/15/01 10/22/01
amps
Date
H 240 CV: AHU4 Supply Fan Current:2
Simultaneous Heating and Cooling
During the monitoring period none of the units operated in heating mode. It is possible that simultaneous heating and cooling may occur during milder months.
Maintenance Condition
At the time of the site visit it appeared that the units were in need of scheduled maintenance and cleaning.
Other Issues
During the monitoring period, unit N48102869D never ran in cooling mode. The other three units cycled in and out of cooling mode in a regular pattern.

Summary of Problems - Small HVAC Units – Appendix B
13
Sam’s Club
The Sam’s Club at 12540 Beach Blvd in Stanton is a 90,000 square foot building. The majority of the space is conditioned and used for retail sales. Heating and cooling for the building is provided by ten- and fifteen-ton Lennox packaged air conditioners. None of the units are equipped with economizers to modulate outside air proportions and provide free cooling when conditions permit.
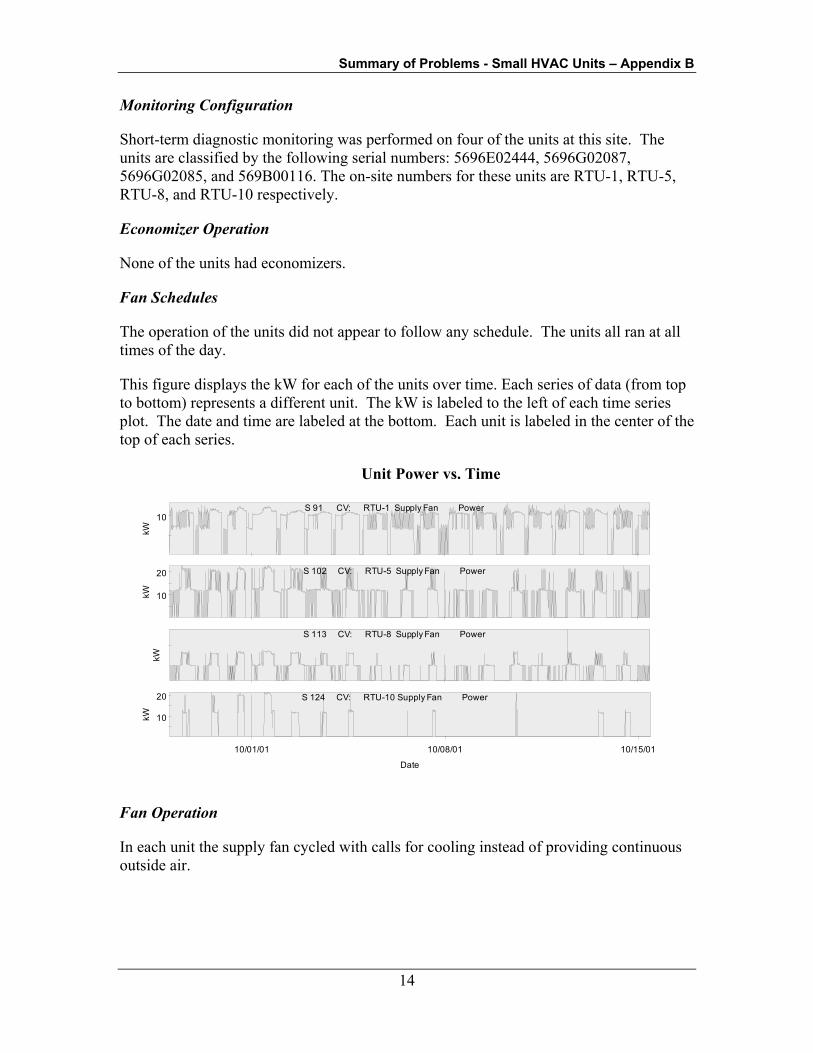
Summary of Problems - Small HVAC Units – Appendix B
14
Monitoring Configuration
Short-term diagnostic monitoring was performed on four of the units at this site. The units are classified by the following serial numbers: 5696E02444, 5696G02087, 5696G02085, and 569B00116. The on-site numbers for these units are RTU-1, RTU-5, RTU-8, and RTU-10 respectively.
Economizer Operation
None of the units had economizers.
Fan Schedules
The operation of the units did not appear to follow any schedule. The units all ran at all times of the day.
This figure displays the kW for each of the units over time. Each series of data (from top to bottom) represents a different unit. The kW is labeled to the left of each time series plot. The date and time are labeled at the bottom. Each unit is labeled in the center of the top of each series.
Unit Power vs. Time
10
kW
S 91 CV: RTU-1 Supply Fan Power
10
20
kW
S 102 CV: RTU-5 Supply Fan Power
kW
S 113 CV: RTU-8 Supply Fan Power
10
20
10/01/01 10/08/01 10/15/01
kW
Date
S 124 CV: RTU-10 Supply Fan Power
Fan Operation
In each unit the supply fan cycled with calls for cooling instead of providing continuous outside air.
Summary of Problems - Small HVAC Units – Appendix B
15
Simultaneous Heating and Cooling
During the monitoring period none of the units operated in heating mode. It is possible that simultaneous heating and cooling may occur during milder months.
Maintenance Condition
All of the units appeared to be in good condition. The filters in the units appeared dirty. At the time of the site visit it appeared that the units were in need of maintenance and cleaning.
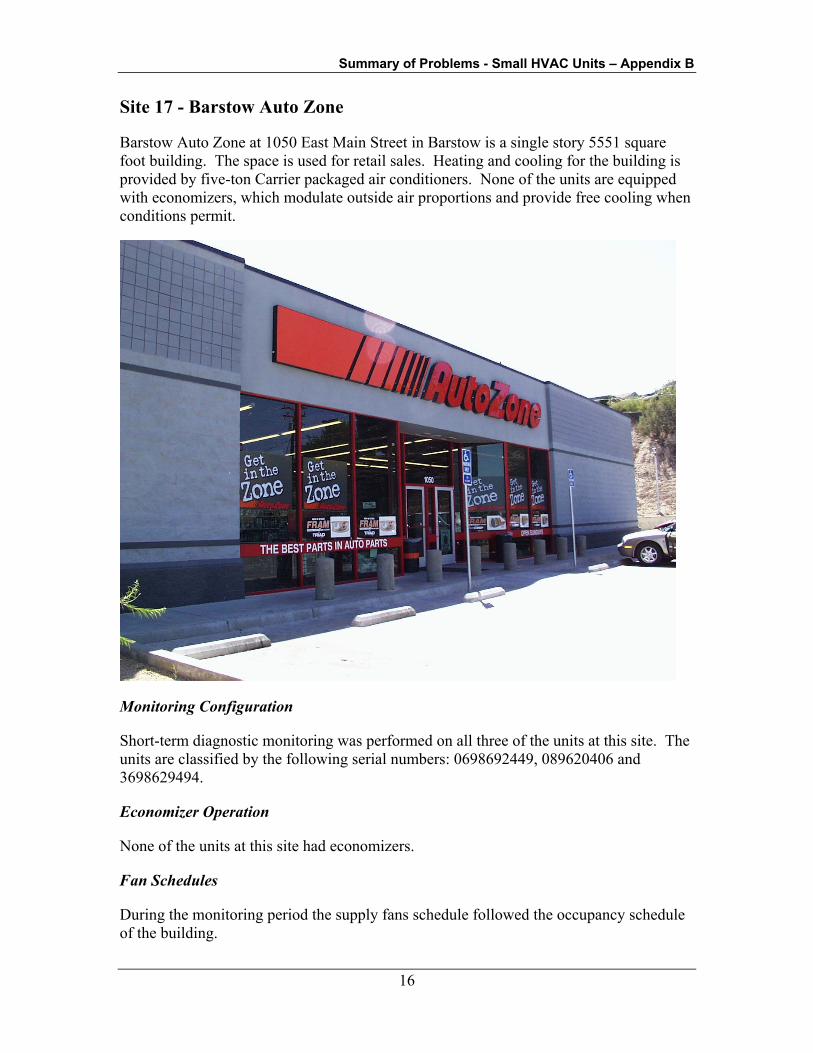
Summary of Problems - Small HVAC Units – Appendix B
16
Site 17 - Barstow Auto Zone
Barstow Auto Zone at 1050 East Main Street in Barstow is a single story 5551 square foot building. The space is used for retail sales. Heating and cooling for the building is provided by five-ton Carrier packaged air conditioners. None of the units are equipped with economizers, which modulate outside air proportions and provide free cooling when conditions permit.
Monitoring Configuration
Short-term diagnostic monitoring was performed on all three of the units at this site. The units are classified by the following serial numbers: 0698692449, 089620406 and 3698629494.
Economizer Operation
None of the units at this site had economizers.
Fan Schedules
During the monitoring period the supply fans schedule followed the occupancy schedule of the building.
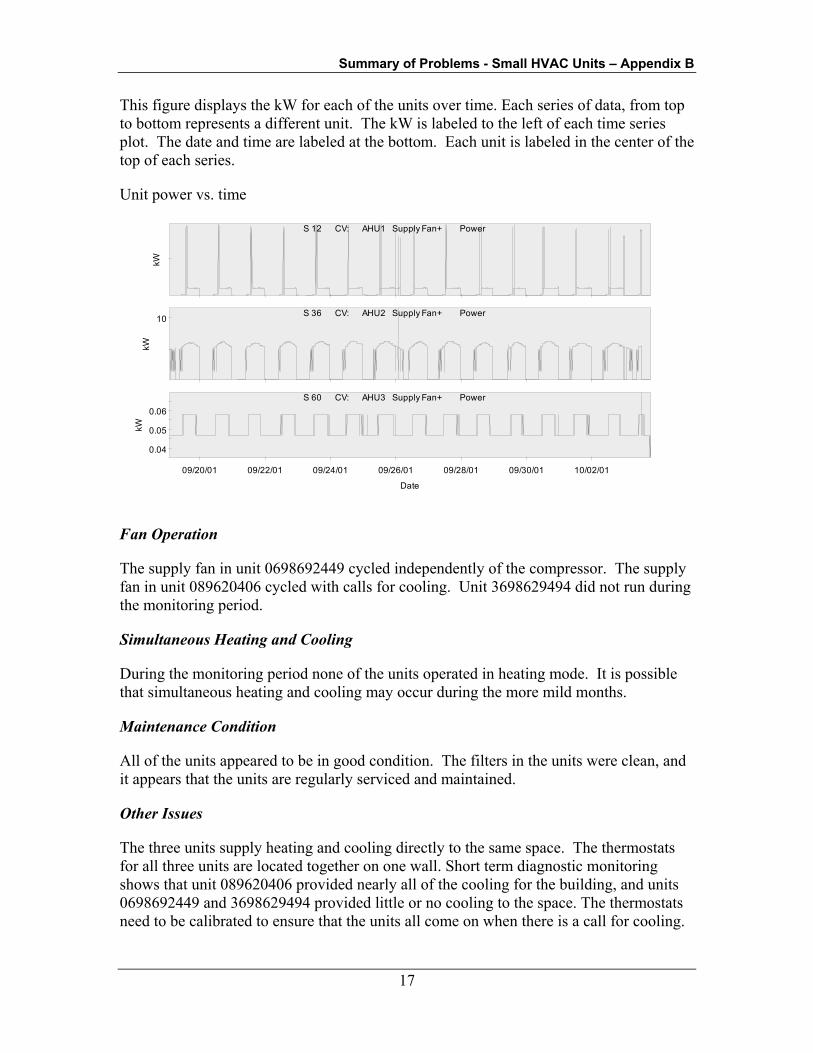
Summary of Problems - Small HVAC Units – Appendix B
17
This figure displays the kW for each of the units over time. Each series of data, from top to bottom represents a different unit. The kW is labeled to the left of each time series plot. The date and time are labeled at the bottom. Each unit is labeled in the center of the top of each series.
Unit power vs. time
kW
S 12 CV: AHU1 Supply Fan+ Power
10
kW
S 36 CV: AHU2 Supply Fan+ Power
0.04
0.05
0.06
09/20/01 09/22/01 09/24/01 09/26/01 09/28/01 09/30/01 10/02/01
kW
Date
S 60 CV: AHU3 Supply Fan+ Power
Fan Operation
The supply fan in unit 0698692449 cycled independently of the compressor. The supply fan in unit 089620406 cycled with calls for cooling. Unit 3698629494 did not run during the monitoring period.
Simultaneous Heating and Cooling
During the monitoring period none of the units operated in heating mode. It is possible that simultaneous heating and cooling may occur during the more mild months.
Maintenance Condition
All of the units appeared to be in good condition. The filters in the units were clean, and it appears that the units are regularly serviced and maintained.
Other Issues
The three units supply heating and cooling directly to the same space. The thermostats for all three units are located together on one wall. Short term diagnostic monitoring shows that unit 089620406 provided nearly all of the cooling for the building, and units 0698692449 and 3698629494 provided little or no cooling to the space. The thermostats need to be calibrated to ensure that the units all come on when there is a call for cooling.
Summary of Problems - Small HVAC Units – Appendix B
18
By relying on a single unit to supply the majority of cooling for the building you shorten the life span and decrease the efficiency of the unit.
Unit 3698629494 did not run at all during the monitoring period. It is possible that this is the result of a malfunction in the unit.
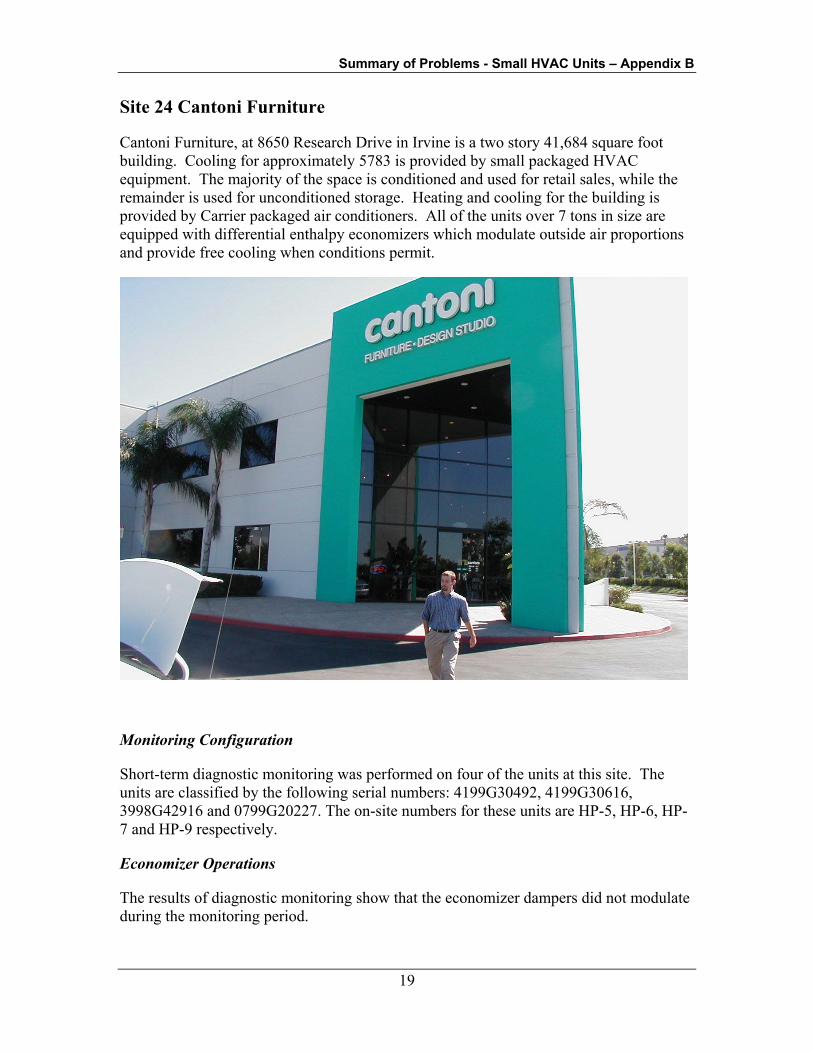
Summary of Problems - Small HVAC Units – Appendix B
19
Site 24 Cantoni Furniture
Cantoni Furniture, at 8650 Research Drive in Irvine is a two story 41,684 square foot building. Cooling for approximately 5783 is provided by small packaged HVAC equipment. The majority of the space is conditioned and used for retail sales, while the remainder is used for unconditioned storage. Heating and cooling for the building is provided by Carrier packaged air conditioners. All of the units over 7 tons in size are equipped with differential enthalpy economizers which modulate outside air proportions and provide free cooling when conditions permit.
Monitoring Configuration
Short-term diagnostic monitoring was performed on four of the units at this site. The units are classified by the following serial numbers: 4199G30492, 4199G30616, 3998G42916 and 0799G20227. The on-site numbers for these units are HP-5, HP-6, HP-7 and HP-9 respectively.
Economizer Operations
The results of diagnostic monitoring show that the economizer dampers did not modulate during the monitoring period.
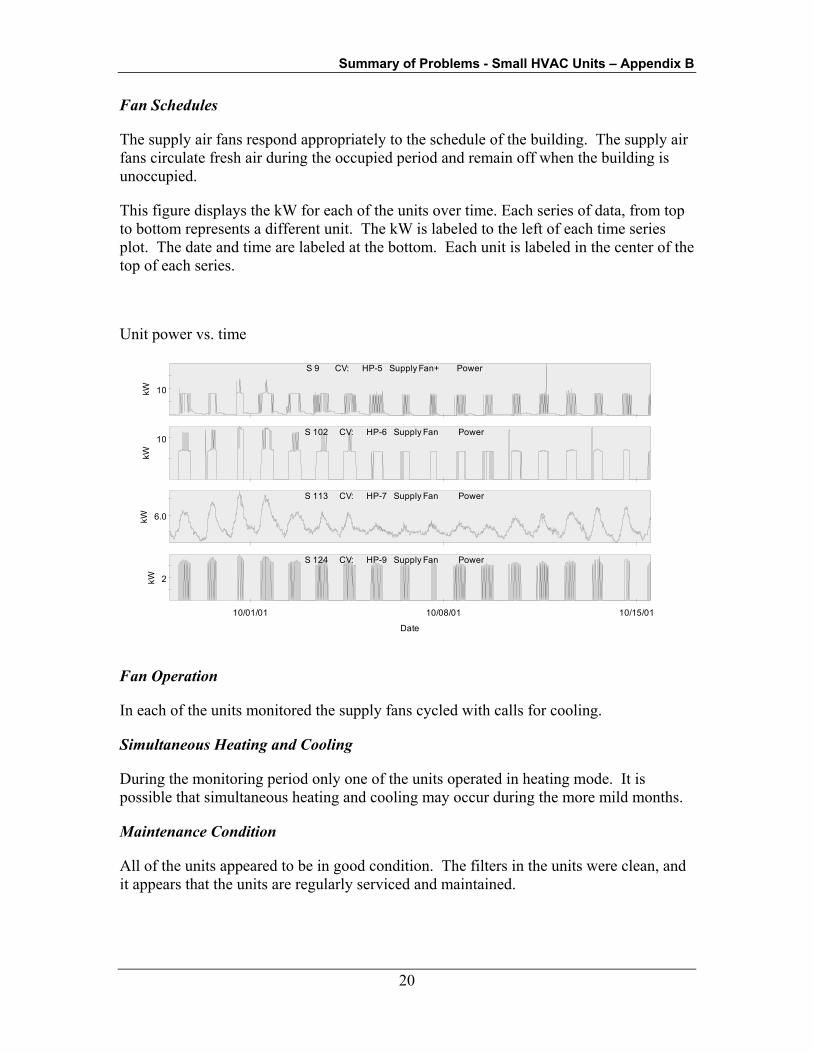
Summary of Problems - Small HVAC Units – Appendix B
20
Fan Schedules
The supply air fans respond appropriately to the schedule of the building. The supply air fans circulate fresh air during the occupied period and remain off when the building is unoccupied.
This figure displays the kW for each of the units over time. Each series of data, from top to bottom represents a different unit. The kW is labeled to the left of each time series plot. The date and time are labeled at the bottom. Each unit is labeled in the center of the top of each series.
Unit power vs. time
10kW
S 9 CV: HP-5 Supply Fan+ Power
10
kW
S 102 CV: HP-6 Supply Fan Power
6.0kW
S 113 CV: HP-7 Supply Fan Power
2
10/01/01 10/08/01 10/15/01
kW
Date
S 124 CV: HP-9 Supply Fan Power
Fan Operation
In each of the units monitored the supply fans cycled with calls for cooling.
Simultaneous Heating and Cooling
During the monitoring period only one of the units operated in heating mode. It is possible that simultaneous heating and cooling may occur during the more mild months.
Maintenance Condition
All of the units appeared to be in good condition. The filters in the units were clean, and it appears that the units are regularly serviced and maintained.

Summary of Problems - Small HVAC Units – Appendix B
21
Site 29 - Otay Offices
The Otay Offices building at 8490 Avenida de la Fuente is a 7,947 square foot building. Heating and cooling for 5,542 square feet of the building is provided by Rheem packaged air conditioners. All of the units are equipped with either single-point temperature or single-point enthalpy economizers, which modulate outside air proportions and provide free cooling when conditions permit.
Monitoring Configuration
Short-term diagnostic monitoring was performed on three of the units at this site. The units are classified by the following serial numbers: 1R6021ADAAF110028771, 1R5813ADAAF439905942, and 2B6329ADAAF110030922. The on-site numbers for these units are RTU-5, RTU-1, and RTU-2 respectively.
Economizer Operations
The results of diagnostic monitoring show that the economizer dampers did not modulate during the monitoring period. The current percentage of outside air for all of the units varies from plan specifications.
Fan Schedules
Monitoring shows that none of the units follow an operation schedule. The units should be scheduled off when the building is unoccupied.
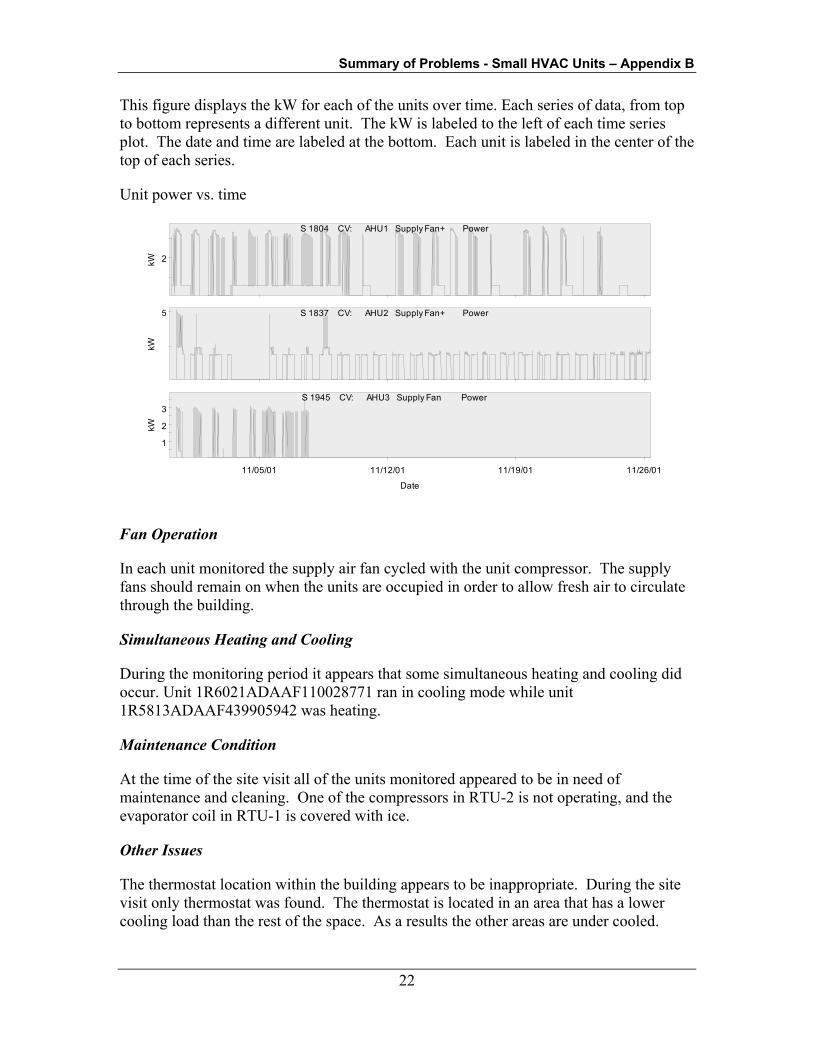
Summary of Problems - Small HVAC Units – Appendix B
22
This figure displays the kW for each of the units over time. Each series of data, from top to bottom represents a different unit. The kW is labeled to the left of each time series plot. The date and time are labeled at the bottom. Each unit is labeled in the center of the top of each series.
Unit power vs. time
2kW
S 1804 CV: AHU1 Supply Fan+ Power
5
kW
S 1837 CV: AHU2 Supply Fan+ Power
1
2
3
11/05/01 11/12/01 11/19/01 11/26/01
kW
Date
S 1945 CV: AHU3 Supply Fan Power
Fan Operation
In each unit monitored the supply air fan cycled with the unit compressor. The supply fans should remain on when the units are occupied in order to allow fresh air to circulate through the building.
Simultaneous Heating and Cooling
During the monitoring period it appears that some simultaneous heating and cooling did occur. Unit 1R6021ADAAF110028771 ran in cooling mode while unit 1R5813ADAAF439905942 was heating.
Maintenance Condition
At the time of the site visit all of the units monitored appeared to be in need of maintenance and cleaning. One of the compressors in RTU-2 is not operating, and the evaporator coil in RTU-1 is covered with ice.
Other Issues
The thermostat location within the building appears to be inappropriate. During the site visit only thermostat was found. The thermostat is located in an area that has a lower cooling load than the rest of the space. As a results the other areas are under cooled.
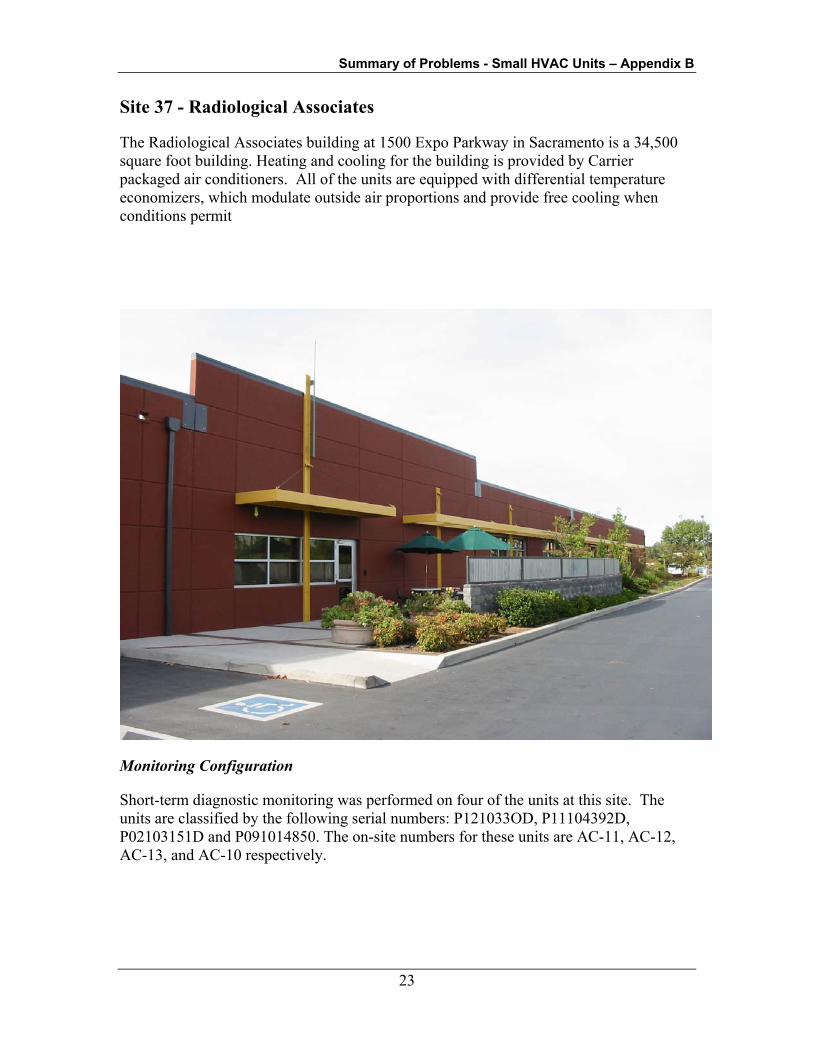
Summary of Problems - Small HVAC Units – Appendix B
23
Site 37 - Radiological Associates
The Radiological Associates building at 1500 Expo Parkway in Sacramento is a 34,500 square foot building. Heating and cooling for the building is provided by Carrier packaged air conditioners. All of the units are equipped with differential temperature economizers, which modulate outside air proportions and provide free cooling when conditions permit
Monitoring Configuration
Short-term diagnostic monitoring was performed on four of the units at this site. The units are classified by the following serial numbers: P121033OD, P11104392D, P02103151D and P091014850. The on-site numbers for these units are AC-11, AC-12, AC-13, and AC-10 respectively.

Summary of Problems - Small HVAC Units – Appendix B
24
Economizer Operations
The results of diagnostic monitoring show that the economizer dampers in units P121033OD and P11104392D failed to modulate during the monitoring period. The economizers in the other units operated properly.
Fan Schedules
The supply fans in units P121033OD and P02103151D remained on during the entire monitoring period. The supply fans do not follow any building setback schedule.
This figure displays the kW for each of the units over time. Each series of data, from top to bottom represents a different unit. The kW is labeled to the left of each time series plot. The date and time are labeled at the bottom. Each unit is labeled in the center of the top of each series.
Unit power vs. time
10
kW
S 9 CV: AHU1 Supply Fan+ Power
kW
S 42 CV: AHU2 Supply Fan+ Power
1.0
kW
S 183 CV: AHU3 Supply Fan Power
5
10/14/01 10/16/01 10/18/01 10/20/01 10/22/01 10/24/01 10/26/01
kW
Date
S 195 CV: AHU4 Supply Fan Power
Fan Operation
The supply fans in units P11104392D and P091014850 cycled with the compressors. The fans should run continuously while the building is occupied to provide continuous outside air to the space.
Simultaneous Heating and Cooling
During the monitoring period none of the units operated in heating mode. It is possible that simultaneous heating and cooling may occur during the more mild months.

Summary of Problems - Small HVAC Units – Appendix B
25
Maintenance Condition
All of the units appeared to be in good condition. The filters in the units were clean, and it appears that the units are regularly serviced and maintained.
Other Issues
During the monitoring period the compressor in one of the units, P02103151D, did not run. It appears that the other units are compensating for the failed unit by providing additional cooling. The strain of meeting additional cooling loads can shorten the life and decrease the efficiency of the units providing the additional cooling.
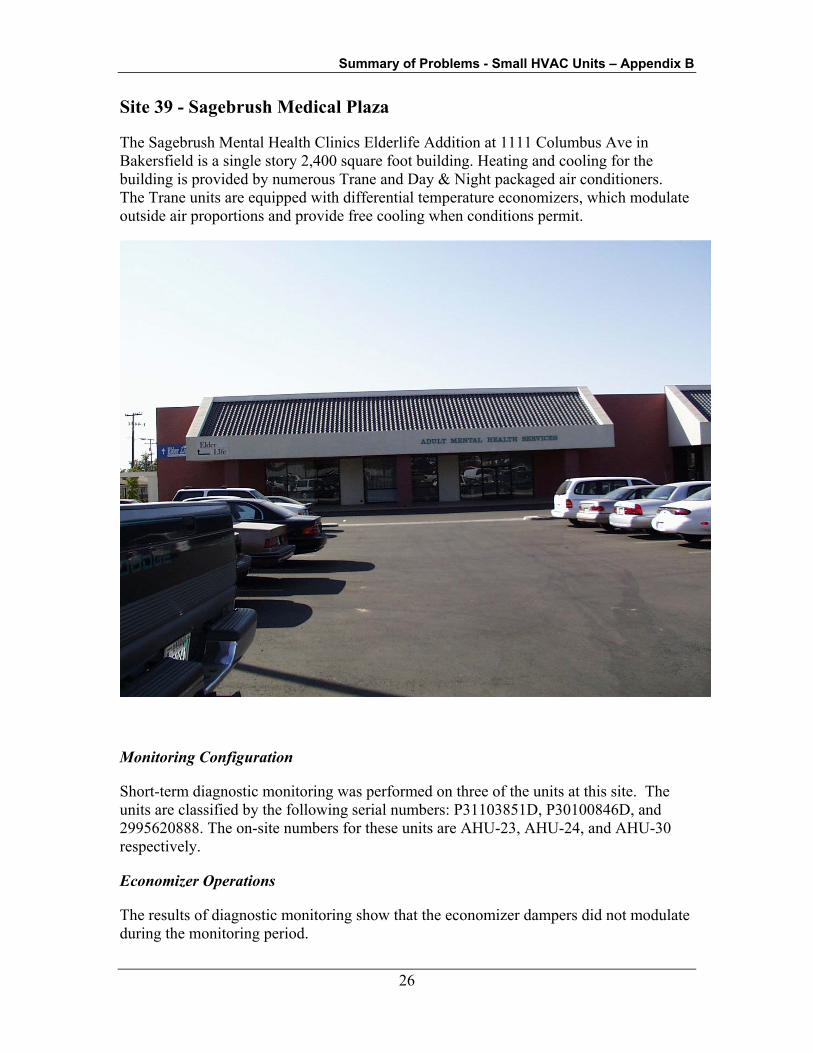
Summary of Problems - Small HVAC Units – Appendix B
26
Site 39 - Sagebrush Medical Plaza
The Sagebrush Mental Health Clinics Elderlife Addition at 1111 Columbus Ave in Bakersfield is a single story 2,400 square foot building. Heating and cooling for the building is provided by numerous Trane and Day & Night packaged air conditioners. The Trane units are equipped with differential temperature economizers, which modulate outside air proportions and provide free cooling when conditions permit.
Monitoring Configuration
Short-term diagnostic monitoring was performed on three of the units at this site. The units are classified by the following serial numbers: P31103851D, P30100846D, and 2995620888. The on-site numbers for these units are AHU-23, AHU-24, and AHU-30 respectively.
Economizer Operations
The results of diagnostic monitoring show that the economizer dampers did not modulate during the monitoring period.

Summary of Problems - Small HVAC Units – Appendix B
27
Operation Schedules
The units do not follow an operation schedule. All of the units monitored ran at all hours of the day every day of the week. Unit 2995620888 did not turn off during the monitoring period.
This figure displays the kW for each of the units over time. Each series of data, from top to bottom represents a different unit. The kW is labeled to the left of each time series plot. The date and time are labeled at the bottom. Each unit is labeled in the center of the top of each series.
Unit power vs. time
0.50
0.60
kW
S 675 VAV: AHU24 Supply Fan+ Power
0
2
4
kW
S 832 VAV: ahu 23 Supply Fan Power
0
5
10
10/02/01 10/04/01 10/06/01 10/08/01 10/10/01 10/12/01 10/14/01 10/16/01
kW
Date
S 749 VAV: AHU30 Supply Fan+ Power
Fan Operation
In each of the units the supply fan cycled with the compressor. The supply fans should run independently of the compressors to allow outside air to circulate continuously throughout the building.
Simultaneous Heating and Cooling
During the monitoring period none of the units operated in heating mode. It is possible that simultaneous heating and cooling may occur during the more mild months.
Maintenance Condition
All of the units appeared to be in good condition. The filters in the units were clean, and it appears that the units are regularly serviced and maintained.
Summary of Problems - Small HVAC Units – Appendix B
28
Summary of Problems - Small HVAC Units – Appendix B
29
Site 49 - Apple Valley Science and Technology Lewis Center
The Apple Valley Science and Technology Lewis Center is an 11,125 square foot building. The space is conditioned and used for various educational purposes. Heating and cooling for the building is provided by Trane packaged air conditioners. The larger units are equipped with differential temperature economizers, which modulate outside air proportions and provide free cooling when conditions permit.
Monitoring Configuration
Short-term diagnostic monitoring was performed on four of the units at this site. The units are classified by the following numbers: AC-6, AC-5, AC-3, and AC-4. AC-6 and AC-5 are six and one-half ton units, AC-3 is two tons, and AC-4 is two and one-half tons. The units all serve the NASA research portion of the building.
Economizer Operations
The economizers failed to respond to spot checking in both of the units with economizers. The results of diagnostic monitoring show that the economizer dampers did not modulate during the monitoring period.
Fan Schedules
The supply fans in all of the units ran continuously during the monitoring period. This may be necessary due to the high equipment density in the space.
This figure displays the kW for each of the units over time. Each series of data, from top to bottom represents a different unit. The kW is labeled to the left of each time series plot. The date and time are labeled at the bottom. Each unit is labeled in the center of the top of each series.
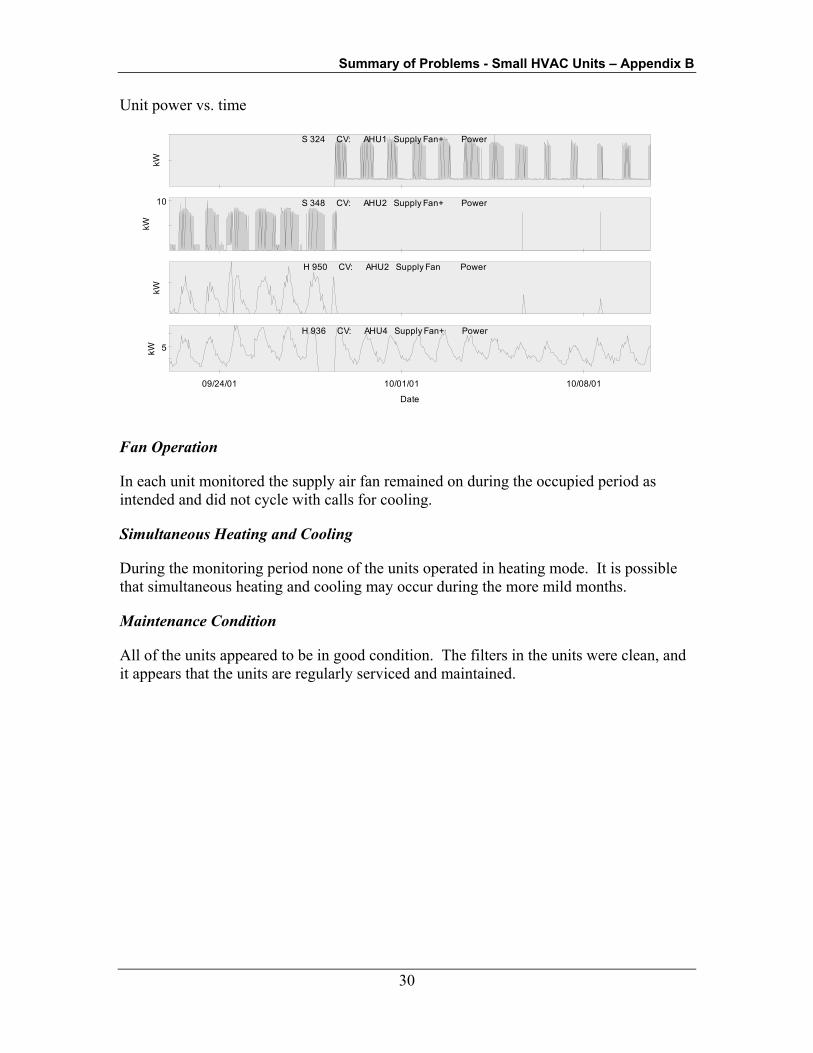
Summary of Problems - Small HVAC Units – Appendix B
30
Unit power vs. time
kW
S 324 CV: AHU1 Supply Fan+ Power
10
kW
S 348 CV: AHU2 Supply Fan+ Power
kW
H 950 CV: AHU2 Supply Fan Power
5
09/24/01 10/01/01 10/08/01
kW
Date
H 936 CV: AHU4 Supply Fan+ Power
Fan Operation
In each unit monitored the supply air fan remained on during the occupied period as intended and did not cycle with calls for cooling.
Simultaneous Heating and Cooling
During the monitoring period none of the units operated in heating mode. It is possible that simultaneous heating and cooling may occur during the more mild months.
Maintenance Condition
All of the units appeared to be in good condition. The filters in the units were clean, and it appears that the units are regularly serviced and maintained.
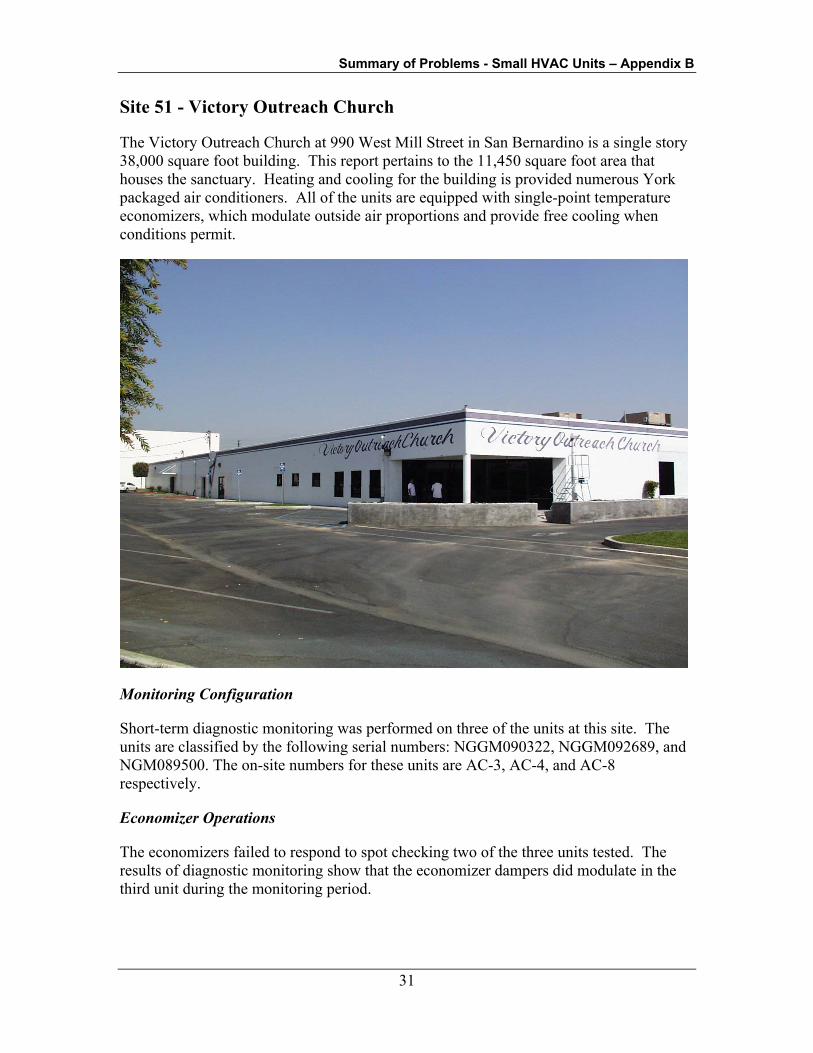
Summary of Problems - Small HVAC Units – Appendix B
31
Site 51 - Victory Outreach Church
The Victory Outreach Church at 990 West Mill Street in San Bernardino is a single story 38,000 square foot building. This report pertains to the 11,450 square foot area that houses the sanctuary. Heating and cooling for the building is provided numerous York packaged air conditioners. All of the units are equipped with single-point temperature economizers, which modulate outside air proportions and provide free cooling when conditions permit.
Monitoring Configuration
Short-term diagnostic monitoring was performed on three of the units at this site. The units are classified by the following serial numbers: NGGM090322, NGGM092689, and NGM089500. The on-site numbers for these units are AC-3, AC-4, and AC-8 respectively.
Economizer Operations
The economizers failed to respond to spot checking two of the three units tested. The results of diagnostic monitoring show that the economizer dampers did modulate in the third unit during the monitoring period.

Summary of Problems - Small HVAC Units – Appendix B
32
Fan Schedules
Heating and cooling for the building is manually scheduled by building occupants. The units are turned on at the breaker during high occupancy periods and remain off the rest of the time.
This figure displays the kW for each of the units over time. Each series of data, from top to bottom represents a different unit. The kW is labeled to the left of each time series plot. The date and time are labeled at the bottom. Each unit is labeled in the center of the top of each series.
Unit power vs. time
0
5
10
kW
S 416 CV: AHU1 Supply Fan Power
0
10
20
kW
S 348 CV: AHU2 Supply Fan+ Power
0
5
10
15
09/22/01 09/24/01 09/26/01 09/28/01 09/30/01 10/02/01 10/04/01
kW
Date
S 440 CV: AHU3 Supply Fan Power
Fan Operation
In each unit monitored the supply air fan remained on during the occupied period as intended and did not cycle with calls for cooling.
Simultaneous Heating and Cooling
During the monitoring period none of the units operated in heating mode. It is possible that simultaneous heating and cooling may occur during the more mild months.
Maintenance Condition
The units did not appear to be well maintained. The filters were very dirty and needed to be replaced. The exterior panels on some of the units were not properly attached.

Summary of Problems - Small HVAC Units – Appendix B
33
Site 53 - St. Michael’s Episcopal Church School
St. Michael’s Episcopal Church School at 2140 Mission Ave, in Carmichael is a 34,000 square foot building. The majority of the space is conditioned and used for educational purposes, while the remainder is used for unconditioned storage.
Heating and cooling for the building area studied is provided by Carrier packaged air conditioners. All of the units are equipped with differential enthalpy economizers, which modulate outside air proportions and provide free cooling when conditions permit.
Monitoring Configuration
Short term diagnostic monitoring was performed on four of the units at this site. The units are classified by the following serial numbers: 3499G20334, 2599G20294, 2199G20521 and 4498G20853. The on site numbers for these units are RTU-2, RTU-3, RTU-4 and RTU-5 respectively.
Economizer Operations
The results of diagnostic monitoring show that the economizer damper in unit 4498G20853 did not modulate during the monitoring period.
Fan Schedules
The supply fans in all of the units follow the building use schedule.
This figure displays the kW for each of the units over time. Each series of data (from top to bottom) represents a different unit. The kW is labeled to the left of each time series plot. The date and time are labeled at the bottom. Each unit is labeled in the center of the top of each series.
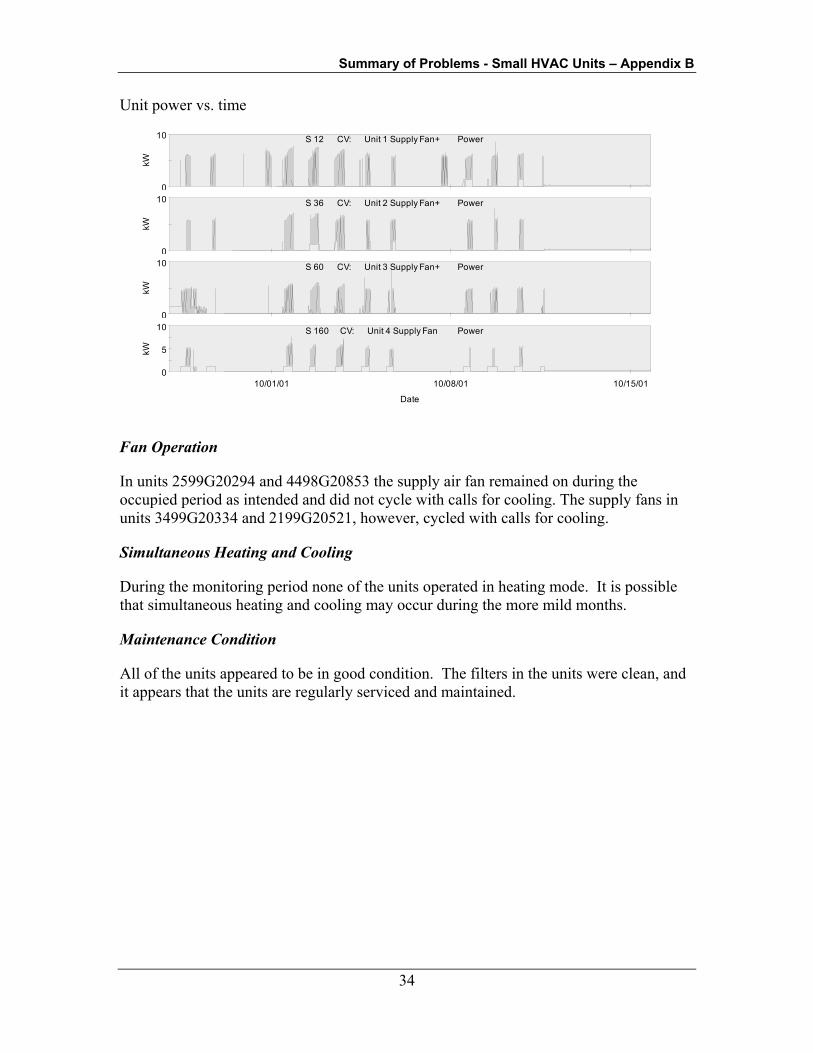
Summary of Problems - Small HVAC Units – Appendix B
34
Unit power vs. time
0
10kW
S 12 CV: Unit 1 Supply Fan+ Power
0
10
kW
S 36 CV: Unit 2 Supply Fan+ Power
0
10
kW
S 60 CV: Unit 3 Supply Fan+ Power
0
5
10
10/01/01 10/08/01 10/15/01
kW
Date
S 160 CV: Unit 4 Supply Fan Power
Fan Operation
In units 2599G20294 and 4498G20853 the supply air fan remained on during the occupied period as intended and did not cycle with calls for cooling. The supply fans in units 3499G20334 and 2199G20521, however, cycled with calls for cooling.
Simultaneous Heating and Cooling
During the monitoring period none of the units operated in heating mode. It is possible that simultaneous heating and cooling may occur during the more mild months.
Maintenance Condition
All of the units appeared to be in good condition. The filters in the units were clean, and it appears that the units are regularly serviced and maintained.

Summary of Problems - Small HVAC Units – Appendix B
35
Site 55 - Jardiniere
The Jardiniere Restaurant is at 300 Grove St in San Francisco is housed in an historic building on the corner of Grove and Franklin streets.. The majority of the space is conditioned and used for restaurant seating, while the remainder is used for unconditioned storage.
Heating and cooling for 6,000 square feet of the restaurant is provided by four York packaged air conditioners. All of the units are equipped with differential enthalpy economizers, which modulate outside air proportions and provide free cooling when conditions permit.
Monitoring Configuration
Short term diagnostic monitoring was performed on four of the units at this site. The units are classified by the following serial numbers: NDTM037847, NDFM043983, NBFM020636 and NBFM020639.
Economizer Operations
The results of diagnostic monitoring show that the economizer dampers did not modulate during the monitoring period.
Fan Schedules
The supply fans in all of the units follow the operation schedule of the restaurant.
This figure displays the kW for each of the units over time. Each series of data (from top to bottom) represents a different unit. The kW is labeled to the left of each time series plot. The date and time are labeled at the bottom. Each unit is labeled in the center of the top of each series.

Summary of Problems - Small HVAC Units – Appendix B
36
Unit power vs. time
5kW
S 12 CV: Unit 1 Supply Fan+ Power
1.0
2.0
3.0
kW
S 36 CV: Unit 2 Supply Fan+ Power
10
kW
S 60 CV: Unit 3 Supply Fan+ Power
10
09/24/01 10/01/01 10/08/01
kW
Date
S 160 CV: Unit 4 Supply Fan Power
Fan Operation
In all of the units monitored the supply fans cycled with the compressor. The supply fans should run continuously while the building is occupied in order to provide adequate ventilation.
Simultaneous Heating and Cooling
During the monitoring period unit NDFM043983 ran in heating mode while the other three units were cooling.
Maintenance Condition
All of the units appeared to be in good condition. The filters in the units were clean, and it appears that the units are regularly serviced and maintained.
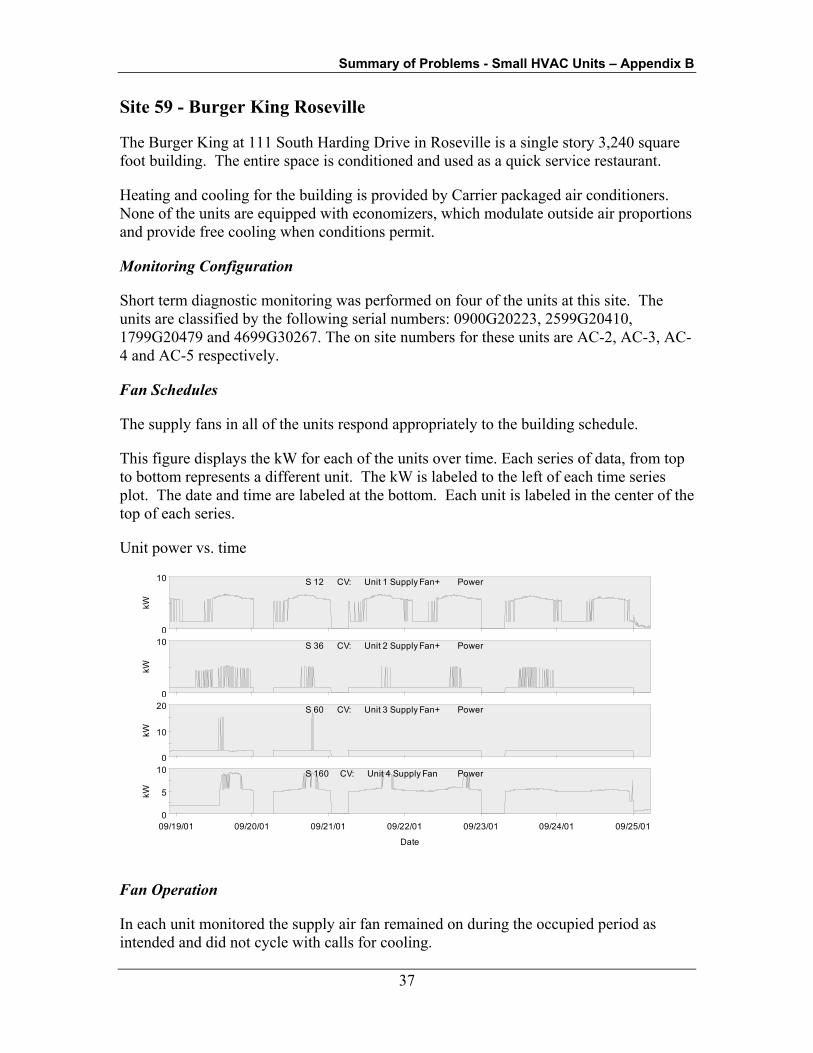
Summary of Problems - Small HVAC Units – Appendix B
37
Site 59 - Burger King Roseville
The Burger King at 111 South Harding Drive in Roseville is a single story 3,240 square foot building. The entire space is conditioned and used as a quick service restaurant.
Heating and cooling for the building is provided by Carrier packaged air conditioners. None of the units are equipped with economizers, which modulate outside air proportions and provide free cooling when conditions permit.
Monitoring Configuration
Short term diagnostic monitoring was performed on four of the units at this site. The units are classified by the following serial numbers: 0900G20223, 2599G20410, 1799G20479 and 4699G30267. The on site numbers for these units are AC-2, AC-3, AC-4 and AC-5 respectively.
Fan Schedules
The supply fans in all of the units respond appropriately to the building schedule.
This figure displays the kW for each of the units over time. Each series of data, from top to bottom represents a different unit. The kW is labeled to the left of each time series plot. The date and time are labeled at the bottom. Each unit is labeled in the center of the top of each series.
Unit power vs. time
0
10
kW
S 12 CV: Unit 1 Supply Fan+ Power
0
10
kW
S 36 CV: Unit 2 Supply Fan+ Power
0
10
20
kW
S 60 CV: Unit 3 Supply Fan+ Power
0
5
10
09/19/01 09/20/01 09/21/01 09/22/01 09/23/01 09/24/01 09/25/01
kW
Date
S 160 CV: Unit 4 Supply Fan Power
Fan Operation
In each unit monitored the supply air fan remained on during the occupied period as intended and did not cycle with calls for cooling.
Summary of Problems - Small HVAC Units – Appendix B
38
Simultaneous Heating and Cooling
During the monitoring period none of the units operated in heating mode. It is possible that simultaneous heating and cooling may occur during the more mild months.
Maintenance Condition
All of the units appeared to be in good condition. The filters in the units were clean, and it appears that the units are regularly serviced and maintained.
Other Issues
The supply air temperature is unit 1799G20479 is above 60 degrees. There may be a number of reasons for the high supply air temperature such as high volumes of air movement or low refrigerant charge.
Summary of Problems - Small HVAC Units – Appendix B
39
Site 60 - Jack In the Box Watsonville
The Jack In the Box at 1085 S. Green Valley Road in Watsonville is a single story 2,385 square foot building. The space is used as a quick service restaurant.
Heating and cooling for the building is provided by two York packaged air conditioners. Both of the units are equipped with single point enthalpy economizers, which modulate outside air proportions and provide free cooling when conditions permit.
Monitoring Configuration
Short term diagnostic monitoring was performed on both of the units at this site. The units are identified by the following serial numbers: NKGM126007 and NANM001384. Unit NKGM126007 serves the kitchen. Unit NANM001384 serves the dining area.
Economizer Operations
The results of diagnostic monitoring show that the economizer dampers did not modulate during the monitoring period. There were times during the monitoring period that cooling for the building could have been provided by economizer control of outside air, but was instead met by mechanical cooling.
Fan Schedules
The supply fans in both of the units followed the occupancy schedule of the building.
This figure displays the kW for each of the units over time. Each series of data (from top to bottom) represents a different unit. The kW is labeled to the left of each time series plot. The date and time are labeled at the bottom. Each unit is labeled in the center of the top of each series.

Summary of Problems - Small HVAC Units – Appendix B
40
Unit power vs. time
2
4
6kW
S 1020 CV: Unit 1 Supply Fan Power
2
4
6
8
09/17/01 09/24/01
kW
Date
S 1001 CV: Unit 2 Supply Fan+ Power
Fan Operation
In each unit monitored the supply air fan remained on during the occupied period as intended and did not cycle with calls for cooling.
Simultaneous Heating and Cooling
No simultaneous heating and cooling occurred during the monitoring period. Unit NKGM126007 operated primarily in cooling mode. Unit NANM001384 operated primarily in heating mode.
Maintenance Condition
All of the units appeared to be in good condition. Although it appears that the units are regularly serviced and maintained, the filters were in need of replacement at the time of our visit.

Summary of Problems - Small HVAC Units – Appendix B
41
Site 62 - Camino Real Marketplace
Camino Real Marketplace at 7004 Market Place Drive is a 7,598 square foot building. The majority of the space is conditioned and used for retail sales.
Heating and cooling for the building is provided by Carrier packaged air conditioners. The larger units are equipped with differential enthalpy economizers, which modulate outside air proportions and provide free cooling when conditions permit.
Monitoring Configuration
Short term diagnostic monitoring was performed on four of the units at this site. The units are classified by the following serial numbers: 3699G2041, 3599G20755, 3999G30302 and 3999G30302. The on site numbers for these units are RTU-13, RTU-14, RTU-15 and RTU-17 respectively.
Economizer Operation
The results of diagnostic monitoring show that the economizer dampers did modulate during the monitoring period. There were times, however, that cooling for the building was provided by mechanical cooling when the cooling load could have been met by the economizer. The outside air fraction on both of the units with economizers is set to 45 percent. This may be higher than necessary.
Fan Schedules
The supply fan in unit 3699G2041 remained on constantly during the monitoring period. The supply fans in the other three units followed the building operation schedule.
This figure displays the kW for each of the units over time. Each series of data (from top to bottom) represents a different unit. The kW is labeled to the left of each time series plot. The date and time are labeled at the bottom. Each unit is labeled in the center of the top of each series.
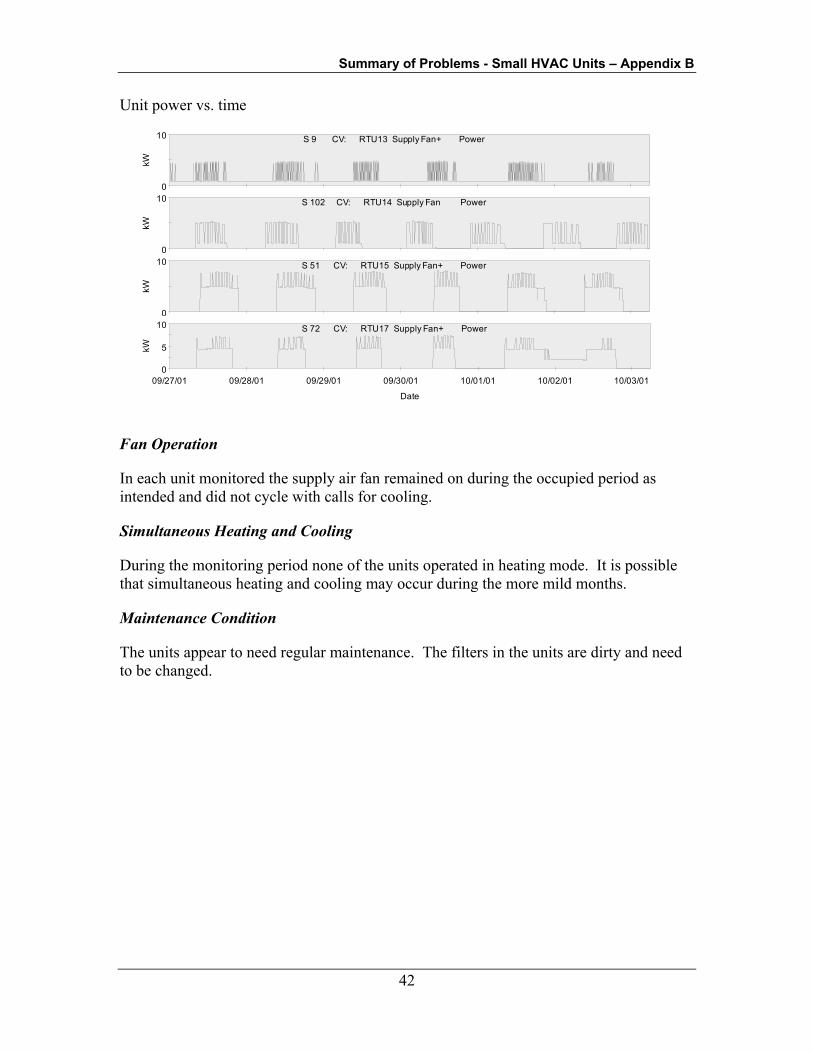
Summary of Problems - Small HVAC Units – Appendix B
42
Unit power vs. time
0
10kW
S 9 CV: RTU13 Supply Fan+ Power
0
10
kW
S 102 CV: RTU14 Supply Fan Power
0
10
kW
S 51 CV: RTU15 Supply Fan+ Power
0
5
10
09/27/01 09/28/01 09/29/01 09/30/01 10/01/01 10/02/01 10/03/01
kW
Date
S 72 CV: RTU17 Supply Fan+ Power
Fan Operation
In each unit monitored the supply air fan remained on during the occupied period as intended and did not cycle with calls for cooling.
Simultaneous Heating and Cooling
During the monitoring period none of the units operated in heating mode. It is possible that simultaneous heating and cooling may occur during the more mild months.
Maintenance Condition
The units appear to need regular maintenance. The filters in the units are dirty and need to be changed.

Summary of Problems - Small HVAC Units – Appendix B
43
Summary of Problems - Small HVAC Units – Appendix B
44
Site 63 - Babies “R” Us La Mesa
The Babies “R” Us at 8165 Fletcher Parkway in La Mesa is a single-story, 38,948 square foot building. The majority of the space is conditioned and used for retail sales, while the remainder is used for unconditioned storage.
Heating and cooling for the building is provided by numerous 15-ton Lennox packaged air conditioners. All of the units are equipped with differential enthalpy economizers, which modulate outside air proportions and provide free cooling when conditions permit. The HVAC system is controlled by a NOVAR energy management and control system.
Short-term diagnostic monitoring was performed on three of the rooftop units at this site. The units are classified by the following serial numbers: 5692F03359, 5697F03360, and 5697F03357.
Fan Schedules
The NOVAR energy management system installed in the building is responding appropriately to the schedule of the building. The supply air fans allow fresh air to circulate during the occupied period and remain off when the building is unoccupied.
Fan Operation
In each unit, the supply air fan remained on during the occupied period as intended and did not cycle with calls for cooling.
The following graph demonstrates the fan power over time for all three units. Each of the measurements is for total unit power. The data shows the operation of the units over the two-week monitoring period. Fan only operation uses about four kW of power in each of the units, first stage cooling uses 12 kW and demand spikes above 12 kW represent second stage cooling. The .120 to .130 kW load of unit 2 is standby power use only.
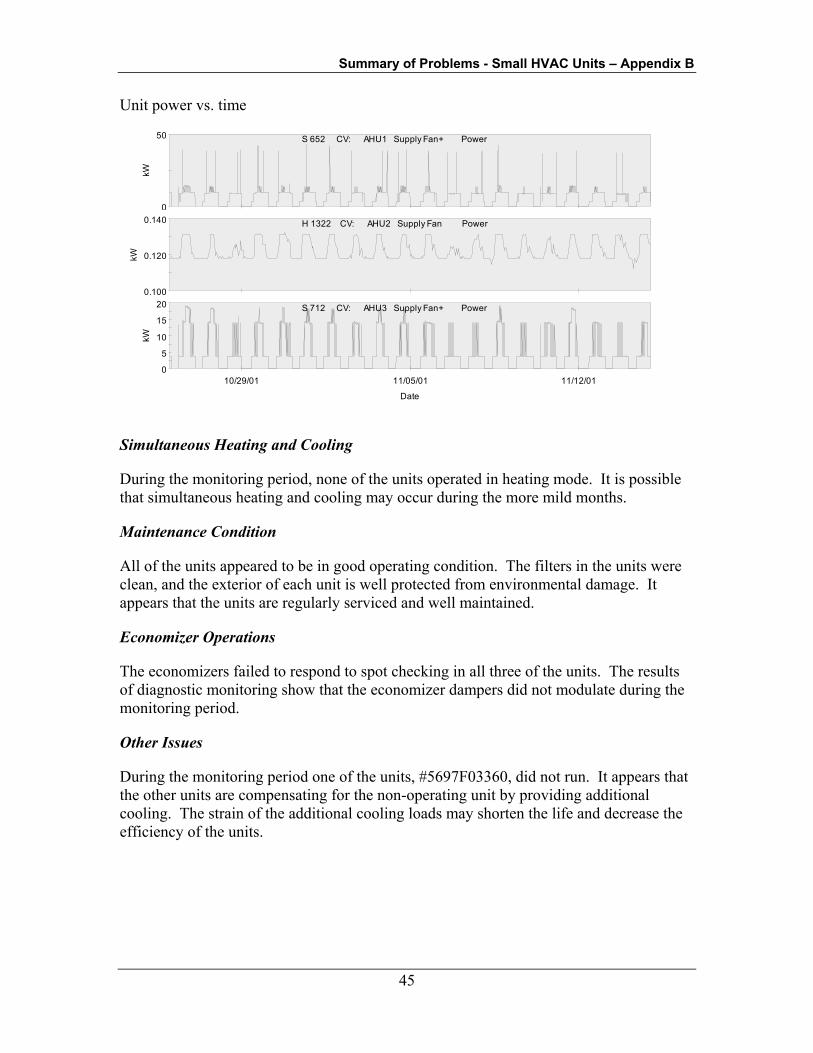
Summary of Problems - Small HVAC Units – Appendix B
45
Unit power vs. time
0
50kW
S 652 CV: AHU1 Supply Fan+ Power
0.100
0.120
0.140
kW
H 1322 CV: AHU2 Supply Fan Power
0
5
10
15
20
10/29/01 11/05/01 11/12/01
kW
Date
S 712 CV: AHU3 Supply Fan+ Power
Simultaneous Heating and Cooling
During the monitoring period, none of the units operated in heating mode. It is possible that simultaneous heating and cooling may occur during the more mild months.
Maintenance Condition
All of the units appeared to be in good operating condition. The filters in the units were clean, and the exterior of each unit is well protected from environmental damage. It appears that the units are regularly serviced and well maintained.
Economizer Operations
The economizers failed to respond to spot checking in all three of the units. The results of diagnostic monitoring show that the economizer dampers did not modulate during the monitoring period.
Other Issues
During the monitoring period one of the units, #5697F03360, did not run. It appears that the other units are compensating for the non-operating unit by providing additional cooling. The strain of the additional cooling loads may shorten the life and decrease the efficiency of the units.

Summary of Problems - Small HVAC Units – Appendix B
46
Site 65 - Michael’s
Michael’s at 25686 The Old Road N in Santa Clarita is a 20,381 square foot building. The majority of the space is conditioned and used for retail sales, while the remainder is used for unconditioned storage. Heating and cooling for the building is provided by numerous Lennox packaged air conditioners. All of the units are equipped with differential enthalpy economizers, which modulate outside air proportions and provide free cooling when conditions permit.
Monitoring Configuration
Short term diagnostic monitoring was performed on four of the units at this site. The units are classified by the following serial numbers: 5697604517, 5697C04435, 5697604436 and 5697C04435.
Economizer Operations
The economizers failed to respond to spot checking in all three of the units. The results of diagnostic monitoring show that the economizer dampers did not modulate during the monitoring period.

Summary of Problems - Small HVAC Units – Appendix B
47
Fan Schedules
The operation of the supply fans in all of the units appears to follow the building use schedule.
This figure displays the kW for each of the units over time. Each series of data (from top to bottom) represents a different unit. The kW is labeled to the left of each time series plot. The date and time are labeled at the bottom. Each unit is labeled in the center of the top of each series.
Unit power vs. time
0
2
4
kW
S 522 CV: HP-6 Supply Fan+ Power
0
5
10
kW
S 543 CV: HP-7 Supply Fan+ Power
0.0
1.0
2.0
3.0
10/18/01 10/20/01 10/22/01 10/24/01 10/26/01 10/28/01 10/30/01 11/01/01
kW
Date
S 564 CV: HP-9 Supply Fan+ Power
Fan Operation
In each unit monitored the supply air fan remained on during the occupied period as intended and did not cycle with calls for cooling.
Simultaneous Heating and Cooling
During the monitoring period none of the units operated in heating mode. It is possible that simultaneous heating and cooling may occur during the more mild months.
Maintenance Condition
All of the units appeared to be in good condition. The filters in the units were clean, and it appears that the units are regularly serviced and maintained.
Other Issues
During the monitoring period one of the units, 5697F03360 did not run. It appears that the other units are compensating for the failed unit by providing additional cooling. The

Summary of Problems - Small HVAC Units – Appendix B
48
strain of meeting additional cooling loads can shorten the life and decrease the efficiency of the units providing the additional cooling.

Summary of Problems - Small HVAC Units – Appendix B
49
Site 67 - Carl’s Jr. Restaurant Westminster
The Carl’s Jr. at 13425 Beach Blvd. In Westminster is a single story 3,100 square foot building. The entire space is conditioned and used as a quick service restaurant. Heating and cooling for the building is provided by two York packaged air conditioners. Both of the units are equipped with single-point enthalpy economizers, which modulate outside air proportions and provide free cooling when conditions permit.
Monitoring Configuration
Short term diagnostic monitoring was performed on both of the units at this site. The units are classified by the following serial numbers: NMFM137827 and NMFM139352. Unit NMFM137827 serves the kitchen. Unit NMFM139352 serves the dining area.
Economizer Operation
The economizer dampers in both of the units moved in response to changes in climatic conditions.

Summary of Problems - Small HVAC Units – Appendix B
50
Fan Schedules
The units are scheduled to respond appropriately to the building use schedule.
This figure displays the kW for each of the units over time. Each series of data (from top to bottom) represents a different unit. The kW is labeled to the left of each time series plot. The date and time are labeled at the bottom. Each unit is labeled in the center of the top of each series.
Unit power vs. time
2
4
6
kW
S 23 CV: AC1 Supply Fan+ Power
5
10
15
11/03/01 11/05/01 11/07/01 11/09/01 11/11/01 11/13/01 11/15/01
kW
Date
S 44 CV: AC2 Supply Fan+ Power
Fan Operation
In each unit monitored the supply air fan remained on during the occupied period as intended and did not cycle with calls for cooling.
Simultaneous Heating and Cooling
During the monitoring period none of the units operated in heating mode. It is possible that simultaneous heating and cooling may occur during the more mild months.
Maintenance Condition
Both of the units appear to need cleaning and maintenance. The filters are clogged with dirt from the kitchen exhaust. Small amounts of rust have built up on one of the economizer dampers. At the time of the site visit there was a significant amount of ice buildup on the evaporator of one of the units

Summary of Problems - Small HVAC Units – Appendix B
51
Site 77 - School of Cosmetology and Adult Handicapped Ed
The School of Cosmetology and Adult Handicapped Ed at 3340 East Los Angeles St. in Simi Valley is a 15,195 square foot building. Small packaged HVAC equipment is used to condition 3,163 square feet of the facility, the information in this report refers to this portion of the building.
Heating and cooling for the building is provided by Carrier packaged air conditioners. The units are equipped with single-point enthalpy economizers, which modulate outside air proportions and provide free cooling when conditions permit.
Monitoring Configuration
Short term diagnostic monitoring was performed on two of the units at this site. The units are classified by the following serial numbers: 1497G20367 and 1497G20449. The on site names for the units are AC-2 and AC-6 respectively.
Economizer Operations
The economizers failed to respond to spot-checking. The results of diagnostic monitoring show that the economizer dampers did not modulate during the monitoring period.
Fan Schedules
The operation of the units follows the building use schedule.
This figure displays the kW for each of the units over time. Each series of data (from top to bottom) represents a different unit. The kW is labeled to the left of each time series plot. The date and time are labeled at the bottom. Each unit is labeled in the center of the top of each series.

Summary of Problems - Small HVAC Units – Appendix B
52
Unit power vs. time
0
2
4
6
kWS 102 VAV: AC2 Supply Fan Power
0
5
10
15
09/26/01 09/28/01 09/30/01 10/02/01 10/04/01 10/06/01 10/08/01 10/10/01
kW
Date
S 62 VAV: AC6 Supply Fan+ Power
Fan Operation
In each unit monitored the supply air fan remained on during the occupied period as intended and did not cycle with calls for cooling.
Simultaneous Heating and Cooling
During the monitoring period no simultaneous heating and cooling occurred. Unit 1497G20449, however, did operate in heating mode within five minutes of unit 1497G20367 cooling.
Maintenance Condition
All of the units appeared to be in good condition. The filters in the units were clean, and it appears that the units are regularly serviced and maintained.

Summary of Problems - Small HVAC Units – Appendix B
53
Site 80 - Henry J Kaiser High School
Henry J Kaiser High School, at 11155 Almond Ave in Fontana is a multi building campus. The building monitored houses the library and administration areas as well as classrooms. The space is conditioned and used for educational purposes. Heating and cooling for the building is provided by Carrier packaged air conditioners. All of the units are equipped with single-point temperature economizers, which modulate outside air proportions and provide free cooling when conditions permit.
Monitoring Configuration
Short term diagnostic monitoring was performed on four of the units at this site. The units are classified by the following serial numbers: 0798630320, 0798630321, 0898620310 and 0898620316. The on site names for the units are AC 11, AC 12, AC 8 and AC 9 respectively.
Economizer Operations
The economizers failed to respond to spot checking in all of the units. The results of diagnostic monitoring show that the economizer dampers did not modulate during the monitoring period.
Fan Schedules
The supply fans in all of the units respond appropriately to the building schedule.

Summary of Problems - Small HVAC Units – Appendix B
54
This figure displays the kW for each of the units over time. Each series of data (from top to bottom) represents a different unit. The kW is labeled to the left of each time series plot. The date and time are labeled at the bottom. Each unit is labeled in the center of the top of each series.
Unit power vs. time
0
10
20
kW
S 324 CV: AHU1 Supply Fan+ Power
0
10
kW
S 348 CV: AHU2 Supply Fan+ Power
0
10
20
kW
S 372 CV: AHU3 Supply Fan+ Power
0
10
20
09/20/01 09/22/01 09/24/01 09/26/01 09/28/01 09/30/01 10/02/01 10/04/01
kW
Date
S 396 CV: AHU4 Supply Fan+ Power
Fan Operation
In each unit monitored the supply air fan remained on during the occupied period as intended and did not cycle with calls for cooling.
Simultaneous Heating and Cooling
During the monitoring period none of the units operated in heating mode. It is possible that simultaneous heating and cooling may occur during the more mild months.
Maintenance Condition
All of the units appeared to be in good condition. The filters in the units were clean, and it appears that the units are regularly serviced and maintained.
Summary of Problems - Small HVAC Units – Appendix B
55
Site 133 - Folsom High School Building
Folsom High School, at 1655 Iron Point Road in Folsom, is a 152,714 square foot conditioned high school. Heating and cooling for the building is provided by five-ton BDP packaged air conditioners. All units are equipped with differential enthalpy economizers, which modulate outside air proportions and provide free cooling when conditions permit.
Monitoring Configuration
Short-term diagnostic monitoring was performed on four of the units at this site. The units are classified by the following serial numbers: 4397G20224, 4397G20226, 4397G20223, and 4397G20242. These units are labeled as AC-14L, AC-15L, AC16L, and AC-19L respectively.
Economizer Operations
The results of diagnostic monitoring show that the economizer dampers did not modulate during the monitoring period. The outside air dampers appear to be locked at an outside air fraction of between 10 and 20 percent.
Fan Schedules
The energy management system installed in the building responds appropriately to the schedule of the building. The supply air fans allow fresh air to circulate during the occupied period and remain off when the building is unoccupied.
This figure displays the kW for each of the units over time. Each series of data (from top to bottom) represents a different unit. The kW is labeled to the left of each time series plot. The date and time are labeled at the bottom. Each unit is labeled in the center of the top of each series.

Summary of Problems - Small HVAC Units – Appendix B
56
Fan Power vs. Time
kW
S 12 CV: Unit 1 Supply Fan+ Power
kW
S 36 CV: Unit 2 Supply Fan+ Power
10
kW
S 148 CV: Unit 3 Supply Fan Power
0.2
0.4
0.6
10/15/01 10/22/01 10/29/01 11/05/01
kW
Date
S 84 CV: Unit 4 Supply Fan+ Power
Fan Operation
In each unit monitored the supply air fan remained on during the occupied period as intended and did not cycle with calls for cooling.
Fan Power
ARI ratings are based on a supply fan power of 365W/1000 cfm. All of the units tested higher than the rated W/cfm. On-site testing showed an average of 428W/1000 cfm for the units monitored.
Simultaneous Heating and Cooling
During the monitoring period none of the units operated in heating mode. It is possible that simultaneous heating and cooling may occur during the more mild months.
Maintenance Condition
All of the units appeared to be in good condition. The filters in the units were clean and it appears that the units are regularly serviced and well maintained.
Other Issues
During the monitoring period one of the units, 4397G20242, did not run. It appears that the other units may be compensating for the failed unit by providing additional cooling. The strain of meeting additional cooling loads may shorten the life and decrease the efficiency of the units providing the additional cooling.
Summary of Problems - Small HVAC Units – Appendix B
57
Site 146 - Safeway, Santa Rosa
The Safeway at Fourth Street and Farmers Lane in Santa Rosa is a single story 44,000 square foot building. The space is used for retail sales and unconditioned storage.
Heating and cooling for the building is provided by three- and five-ton Carrier packaged air conditioners. The units are equipped with differential enthalpy economizers, which modulate outside air proportions and provide free cooling when conditions permit.
Monitoring Configuration
Short-term diagnostic monitoring was performed on three of the units at this site. The units are classified by the following serial numbers: 2100G24486, 2400G20333, and 2400G20334. These on-site names for these units are AC-2, AC-3, and AC-4 respectively.
Economizer Operations
The results of diagnostic monitoring show that the economizer dampers on units 2100G24486 and 2400G20334 did not modulate during the monitoring period.
Fan Schedules
The supply fans in units 2100G24486 and 2400G20333 ran continuously during the monitoring period. The supply fan in unit 2400G20334 cycled daily with the building operation.
This figure displays the kW for each of the units over time. Each series of data (from top to bottom) represents a different unit. The kW is labeled to the left of each time series plot. The date and time are labeled at the bottom. Each unit is labeled in the center of the top of each series.
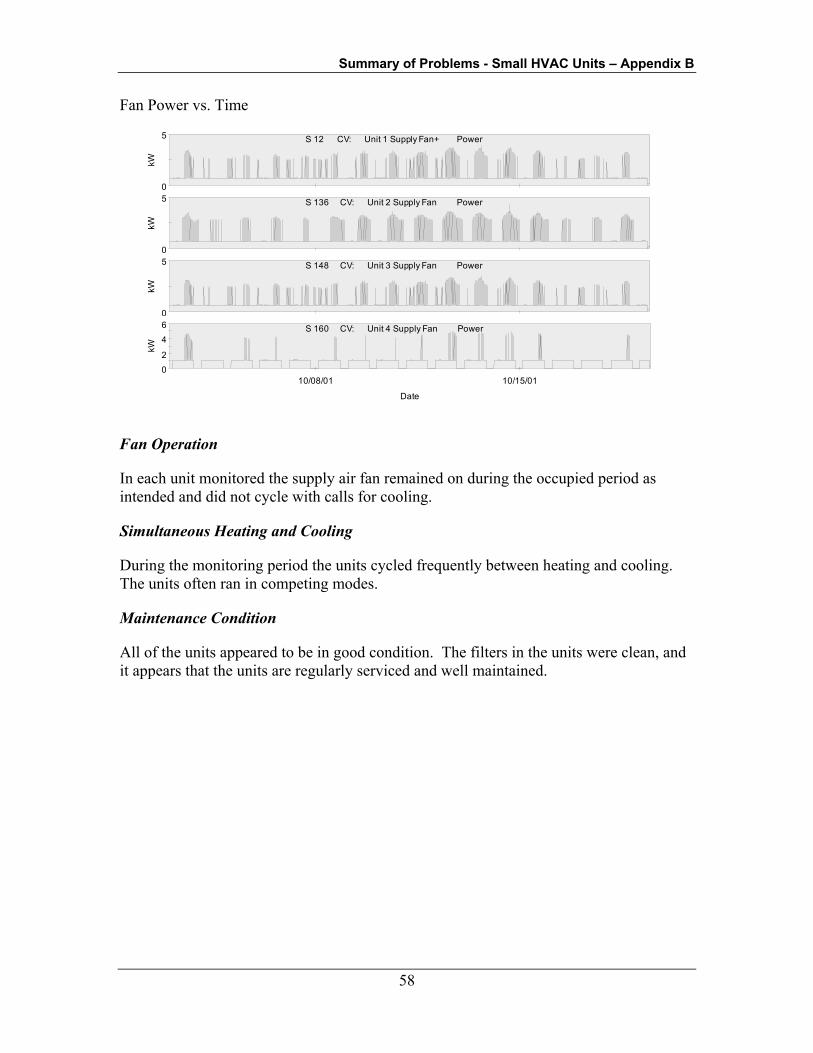
Summary of Problems - Small HVAC Units – Appendix B
58
Fan Power vs. Time
0
5
kWS 12 CV: Unit 1 Supply Fan+ Power
0
5
kW
S 136 CV: Unit 2 Supply Fan Power
0
5
kW
S 148 CV: Unit 3 Supply Fan Power
0
2
4
6
10/08/01 10/15/01
kW
Date
S 160 CV: Unit 4 Supply Fan Power
Fan Operation
In each unit monitored the supply air fan remained on during the occupied period as intended and did not cycle with calls for cooling.
Simultaneous Heating and Cooling
During the monitoring period the units cycled frequently between heating and cooling. The units often ran in competing modes.
Maintenance Condition
All of the units appeared to be in good condition. The filters in the units were clean, and it appears that the units are regularly serviced and well maintained.
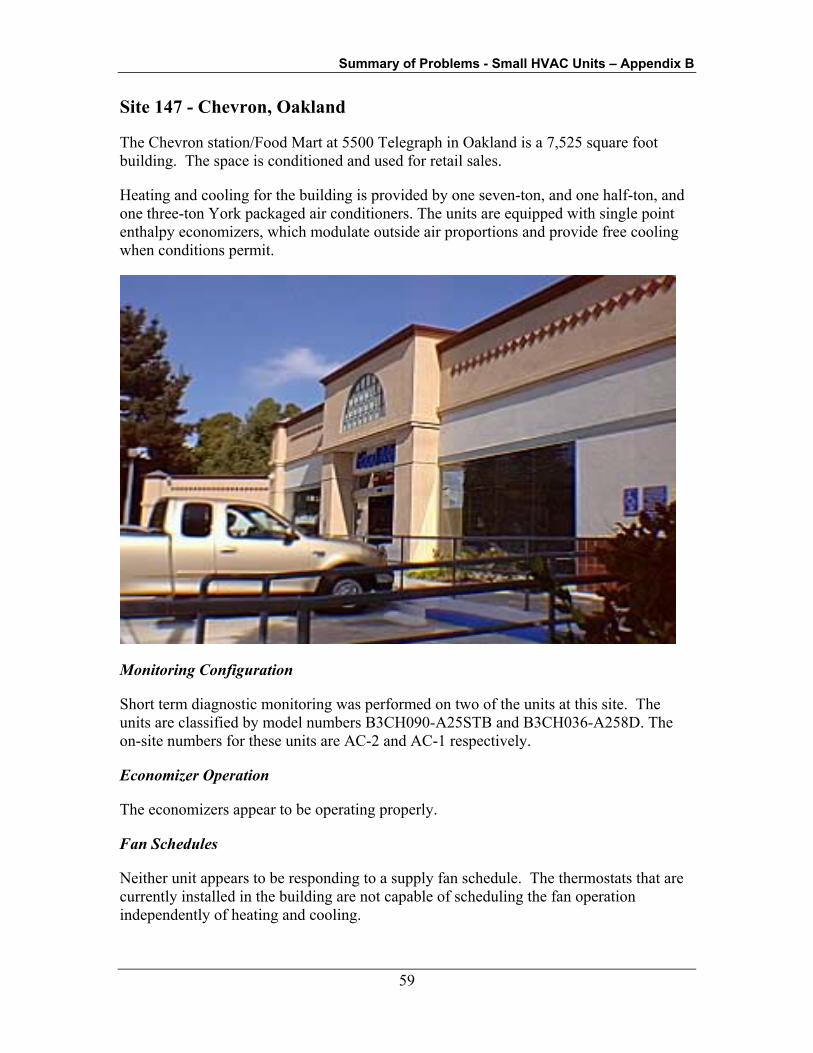
Summary of Problems - Small HVAC Units – Appendix B
59
Site 147 - Chevron, Oakland
The Chevron station/Food Mart at 5500 Telegraph in Oakland is a 7,525 square foot building. The space is conditioned and used for retail sales.
Heating and cooling for the building is provided by one seven-ton, and one half-ton, and one three-ton York packaged air conditioners. The units are equipped with single point enthalpy economizers, which modulate outside air proportions and provide free cooling when conditions permit.
Monitoring Configuration
Short term diagnostic monitoring was performed on two of the units at this site. The units are classified by model numbers B3CH090-A25STB and B3CH036-A258D. The on-site numbers for these units are AC-2 and AC-1 respectively.
Economizer Operation
The economizers appear to be operating properly.
Fan Schedules
Neither unit appears to be responding to a supply fan schedule. The thermostats that are currently installed in the building are not capable of scheduling the fan operation independently of heating and cooling.

Summary of Problems - Small HVAC Units – Appendix B
60
This figure displays the kW for each of the units over time. Each series of data (from top to bottom) represents a different unit. The kW is labeled to the left of each time series plot. The date and time are labeled at the bottom. Each unit is labeled in the center of the top of each series.
Fan Power vs. Time
0
5
10
15
kW
S 13272 CV: AC 1 Supply Fan+ Power
0
5
10
15
10/29/01 11/05/01 11/12/01 11/19/01
kW
Date
S 13341 CV: AC-2 Supply Fan Power
Fan Operation
The supply fan in unit B3CH090-A25STB cycled with calls for heating and cooling. The supply fan in unit B3CH036-A258D remained on continuously during the monitoring period. The supply air fans should instead remain on while the building is occupied and turn off when it is unoccupied.
During the initial site visit it became clear that the building occupants did not understand the thermostats that they were operating. Whenever there was discomfort, the levers of the heating and cooling setpoint were moved up and down together. This accounts for much of the erratic behavior of the HVAC system. During the second visit, the proper operation of a heating/cooling thermostat was explained to the management at great length.
Fan Power
ARI ratings are based on a supply fan power of 365W/1000 cfm. Both of the units tested higher than the rated W/cfm. On-site testing showed an average of 453W/1000 cfm for the units monitored.
Simultaneous Heating and Cooling
During the monitoring period both units switched frequently between heating and cooling. Often when one unit operated in heating mode, the other was in cooling mode.

Summary of Problems - Small HVAC Units – Appendix B
61
Maintenance Condition
All of the units appear to be in good condition. The filters in the units are clean and it appears that the units are regularly serviced and maintained.
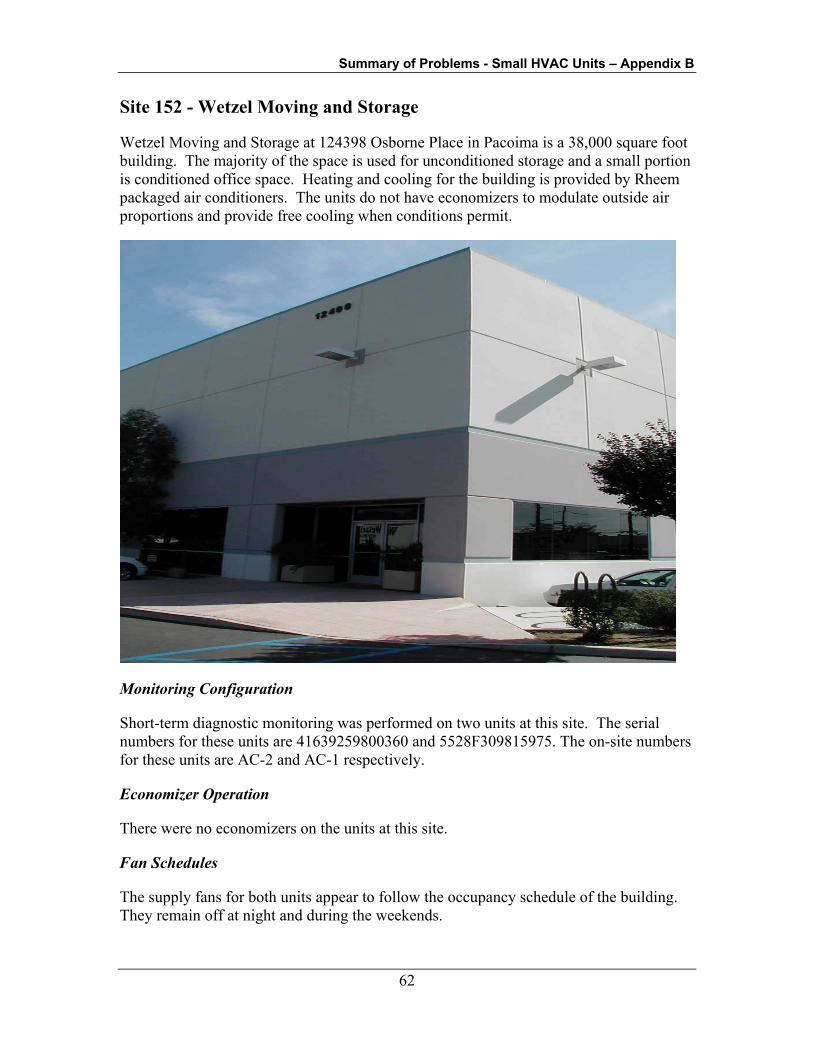
Summary of Problems - Small HVAC Units – Appendix B
62
Site 152 - Wetzel Moving and Storage
Wetzel Moving and Storage at 124398 Osborne Place in Pacoima is a 38,000 square foot building. The majority of the space is used for unconditioned storage and a small portion is conditioned office space. Heating and cooling for the building is provided by Rheem packaged air conditioners. The units do not have economizers to modulate outside air proportions and provide free cooling when conditions permit.
Monitoring Configuration
Short-term diagnostic monitoring was performed on two units at this site. The serial numbers for these units are 41639259800360 and 5528F309815975. The on-site numbers for these units are AC-2 and AC-1 respectively.
Economizer Operation
There were no economizers on the units at this site.
Fan Schedules
The supply fans for both units appear to follow the occupancy schedule of the building. They remain off at night and during the weekends.

Summary of Problems - Small HVAC Units – Appendix B
63
This figure displays the current for each of the units over time. Each series of data (from top to bottom) represents a different unit. The amperage is labeled to the left of each time series plot. The date and time are labeled at the bottom. Each unit is labeled in the center of the top of each series.
Fan Power vs. Time
0
5
10
15
amps
S 44 CV: AHU1 Supply Fan Current
0
5
10
15
20
10/20/01 10/22/01 10/24/01 10/26/01 10/28/01 10/30/01 11/01/01
amps
Date
S 393 CV: AHU2 Current
Fan Operation
In each unit monitored the supply air fan remained on during the occupied period as intended and did not cycle with calls for cooling.
Simultaneous Heating and Cooling
The units had the opportunity to operate in both heating and cooling mode during the monitoring period. No simultaneous heating and cooling occurred during this time.
Maintenance Condition
All of the units appeared to be in good condition. The filters in the units were clean, and it appears that the units are regularly serviced and maintained.

Summary of Problems - Small HVAC Units – Appendix B
64
Site 161 - Adventure Christian Church
Adventure Christian Church, at 6401 Stanford Ranch Rd., in Roseville is a 28,000 square foot building, 4,800 square feet of which was studied; and is conditioned by packaged air conditioners.
Heating and cooling for the building is provided by York packaged air conditioners. None of the units are equipped with economizers, which modulate outside air proportions and provide free cooling when conditions permit.
Monitoring Configuration
Short-term diagnostic monitoring was performed on four of the units at this site. The units are classified by the following serial numbers: NGGM092878, NGGM092876, NHGM096500, and NHGM095852. The on-site numbers for these units are AC-4, RTU-15, RTU-1, and RTU-2 respectively.
Economizer Operation
None of the units monitored had economizers.
Fan Schedules
The units do not appear to follow an on/off schedule. They run at varying times of the day every day of the week.
This figure displays the kW for each of the units over time. Each series of data (from top to bottom) represents a different unit. The kW is labeled to the left of each time series plot. The date and time are labeled at the bottom. Each unit is labeled in the center of the top of each series.
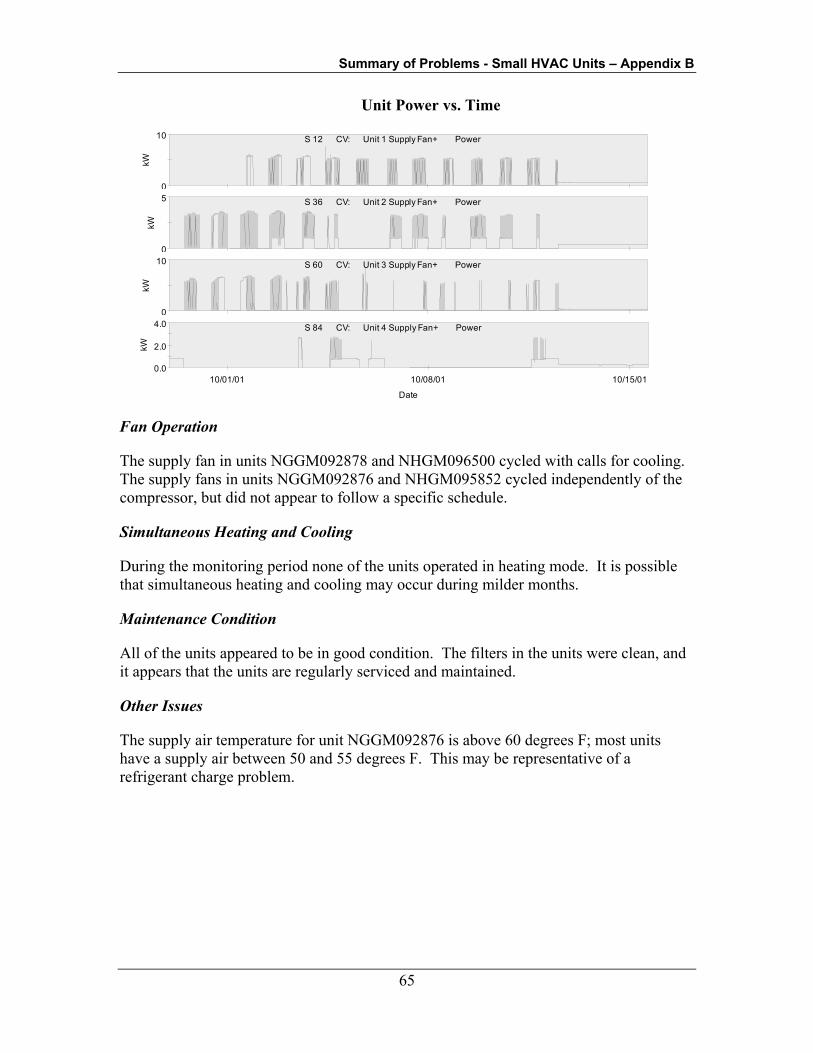
Summary of Problems - Small HVAC Units – Appendix B
65
Unit Power vs. Time
Fan Operation
The supply fan in units NGGM092878 and NHGM096500 cycled with calls for cooling. The supply fans in units NGGM092876 and NHGM095852 cycled independently of the compressor, but did not appear to follow a specific schedule.
Simultaneous Heating and Cooling
During the monitoring period none of the units operated in heating mode. It is possible that simultaneous heating and cooling may occur during milder months.
Maintenance Condition
All of the units appeared to be in good condition. The filters in the units were clean, and it appears that the units are regularly serviced and maintained.
Other Issues
The supply air temperature for unit NGGM092876 is above 60 degrees F; most units have a supply air between 50 and 55 degrees F. This may be representative of a refrigerant charge problem.
0
10kW
S 12 CV: Unit 1 Supply Fan+ Power
0
5
kW
S 36 CV: Unit 2 Supply Fan+ Power
0
10
kW
S 60 CV: Unit 3 Supply Fan+ Power
0.0
2.0
4.0
10/01/01 10/08/01 10/15/01
kW
Date
S 84 CV: Unit 4 Supply Fan+ Power

Summary of Problems - Small HVAC Units – Appendix B
66
Site 165 - Swan Market
The Swan Market is a mixed use, commercial/residential group of buildings in downtown Oakland. The offices at Swan Market, 538 9th St. comprises approximately 15,000 square feet of conditioned space on the second floor of an historic building on the corner of 9th and Washington. Heating and cooling for the building is provided by Carrier packaged air conditioners. All units are equipped with single point enthalpy economizers, which modulate outside air proportions and provide free cooling when conditions permit.
Monitoring Configuration
Short-term diagnostic monitoring was performed on three of the units at this site. The units are identified by the following serial numbers: 110063005J, 1200G20953, and 0500630757.
Economizer Operation
The economizers on three of the four units failed to operate during the monitoring period. Only one them showed a response to changes in climatic conditions.
Fan Schedules
The units appear to follow a Monday through Friday operation schedule. The units did not run at night or during the weekend during the monitoring period.
This figure displays the current for each of the units over time. Each series of data (from top to bottom) represents a different unit. The current is labeled to the left of each time series plot. The date and time are labeled at the bottom. Each unit is labeled in the center of the top of each series.

Summary of Problems - Small HVAC Units – Appendix B
67
Unit Power vs. Time
20
amps
S 01575 CV: HKIT-U Supply Fan Current
50
amps
S 02310 CV: Suite Supply Fan Current
5
10/30/01 11/01/01 11/03/01 11/05/01 11/07/01 11/09/01 11/11/01
amps
Date
S 01540 CV: MOCCHA Supply Fan Current
Fan Operation
The supply fan in units 110063005J and 0500630757 cycled with the compressor. The supply fan in unit 1200G20953 ran continuously when the building was occupied and remained off the rest of the time.
Simultaneous Heating and Cooling
During the monitoring period all of the units had the opportunity to run in both heating and cooling mode. No simultaneous heating and cooling occurred.
Maintenance Condition
All of the units appeared to be in good condition. The filters in the units were of varying conditions and appeared to be maintained by different contractors. Some units appeared to be regularly serviced and others were in need of a filter change. Special attention should be paid to the filters, given that the exhaust of a downstairs kitchen is near the intake of several of these units.
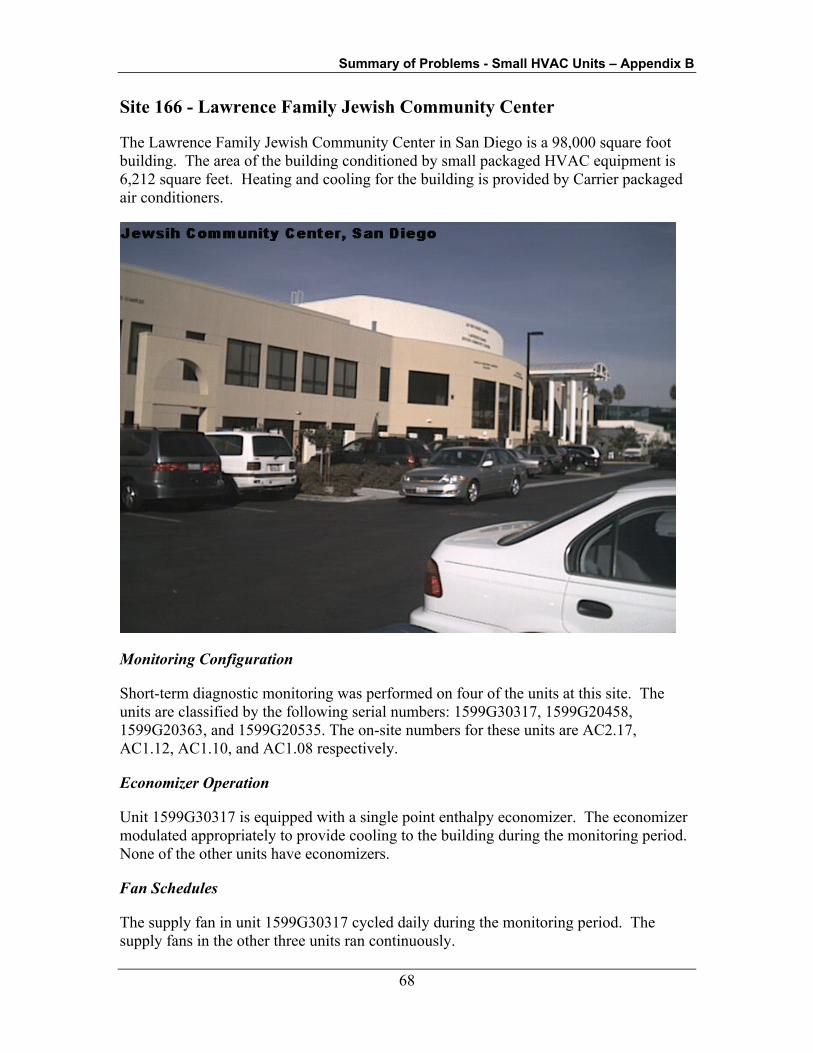
Summary of Problems - Small HVAC Units – Appendix B
68
Site 166 - Lawrence Family Jewish Community Center
The Lawrence Family Jewish Community Center in San Diego is a 98,000 square foot building. The area of the building conditioned by small packaged HVAC equipment is 6,212 square feet. Heating and cooling for the building is provided by Carrier packaged air conditioners.
Monitoring Configuration
Short-term diagnostic monitoring was performed on four of the units at this site. The units are classified by the following serial numbers: 1599G30317, 1599G20458, 1599G20363, and 1599G20535. The on-site numbers for these units are AC2.17, AC1.12, AC1.10, and AC1.08 respectively.
Economizer Operation
Unit 1599G30317 is equipped with a single point enthalpy economizer. The economizer modulated appropriately to provide cooling to the building during the monitoring period. None of the other units have economizers.
Fan Schedules
The supply fan in unit 1599G30317 cycled daily during the monitoring period. The supply fans in the other three units ran continuously.

Summary of Problems - Small HVAC Units – Appendix B
69
This figure displays the kW for each of the units over time. Each series of data (from top to bottom) represents a different unit. The kW is labeled to the left of each time series plot. The date and time are labeled at the bottom. Each unit is labeled in the center of the top of each series.
Unit Power vs. Time
amps
S 01876 CV: AHU1 Supply Fan Current:3
10
amps
S 01840 CV: AHU2 Supply Fan Current:3
10
amps
S 01636 CV: AHU3 Supply Air Current
5
10
10/22/01 10/29/01 11/05/01
amps
Date
S 01801 CV: AHU4 Supply Fan Current:2
Fan Operation
In each unit monitored the supply air fan remained on during the occupied period as intended and did not cycle with calls for cooling.
Simultaneous Heating and Cooling
During the monitoring period none of the units operated in heating mode. It is possible that simultaneous heating and cooling may occur during milder months.
Maintenance Condition
All of the units appeared to be in good condition. The filters in the units were clean, and it appears that the units are regularly serviced and maintained.

Summary of Problems - Small HVAC Units – Appendix B
70
Site 168 - National Steinbeck Center
The National Steinbeck Center at 1 Main Street in Salinas is a 38,000 square foot building. Heating and cooling for all 38,000 square feet of the space is provided by Trane packaged air conditioners. All of the units are equipped with differential temperature economizers, which modulate outside air proportions and provide free cooling when conditions permit.
Monitoring Configuration
Short-term diagnostic monitoring was performed on four of the units at this site. The units are classified by the following numbers: AC-6, AC-5, AC-1 and AC-3.
Economizer Operations
The economizers in units AC-6 and AC-1failed to modulate during the monitoring period. The economizers in AC-3 and AC-5 did modulate, but it did not respond optimally to climatic changes.
Fan Schedules
The supply fans in all of the units operate independently of calls for cooling. This allows fresh air to circulate through the building.
Fan Operation
The supply fan in AC-1 cycled daily with the occupancy of the building. The supply fans in the other three units remained on continuously during the monitoring period.
This figure displays the kW for each of the units over time. Each series of data, from top to bottom represents a different unit. The kW is labeled to the left of each time series plot. The date and time are labeled at the bottom. Each unit is labeled in the center of the top of each series.
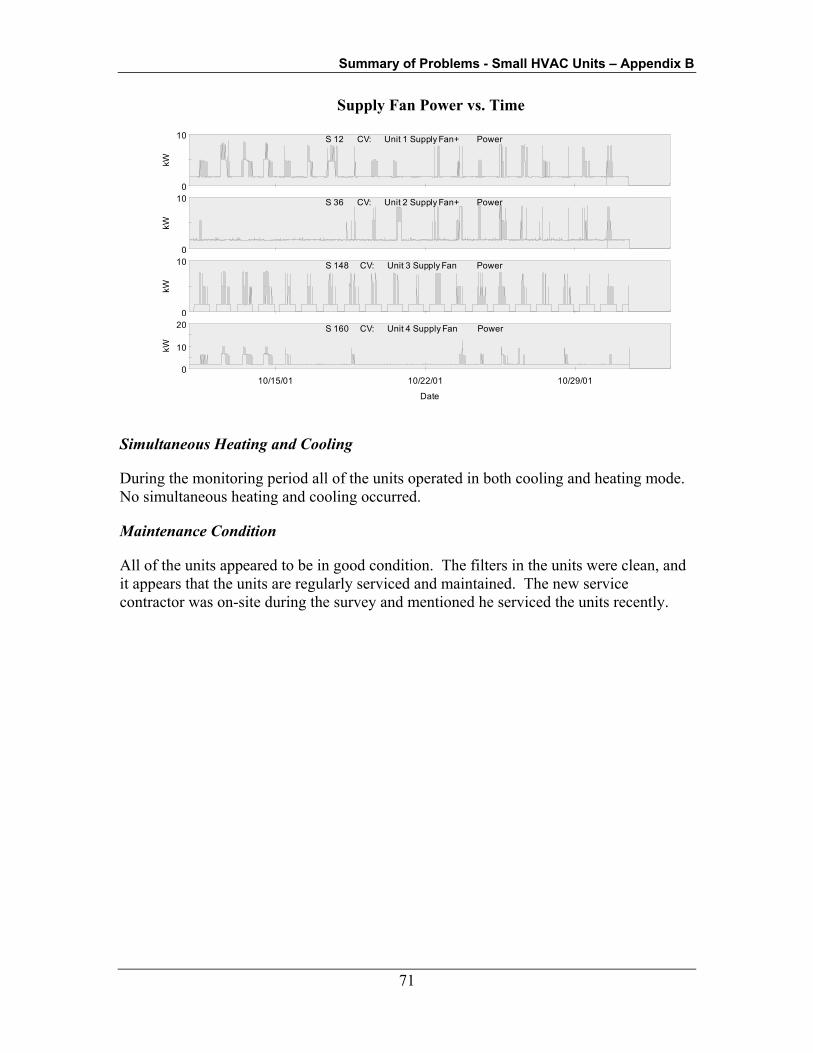
Summary of Problems - Small HVAC Units – Appendix B
71
Supply Fan Power vs. Time
0
10
kW
S 12 CV: Unit 1 Supply Fan+ Power
0
10
kW
S 36 CV: Unit 2 Supply Fan+ Power
0
10
kW
S 148 CV: Unit 3 Supply Fan Power
0
10
20
10/15/01 10/22/01 10/29/01
kW
Date
S 160 CV: Unit 4 Supply Fan Power
Simultaneous Heating and Cooling
During the monitoring period all of the units operated in both cooling and heating mode. No simultaneous heating and cooling occurred.
Maintenance Condition
All of the units appeared to be in good condition. The filters in the units were clean, and it appears that the units are regularly serviced and maintained. The new service contractor was on-site during the survey and mentioned he serviced the units recently.
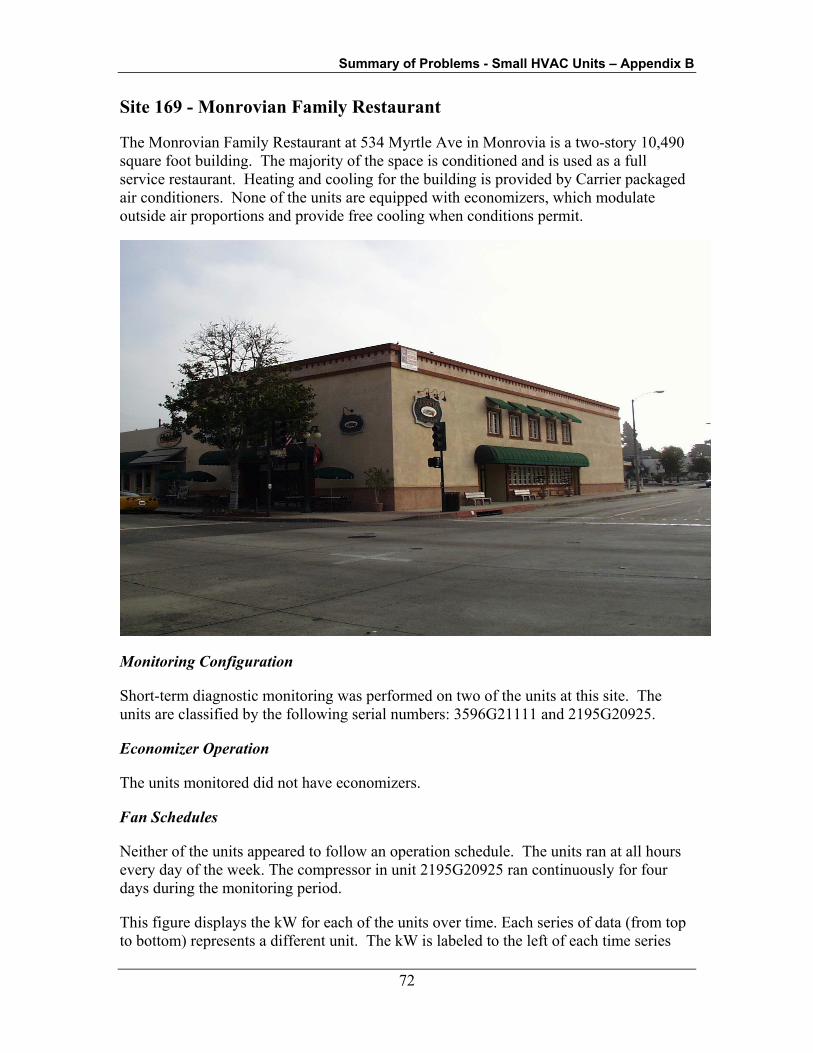
Summary of Problems - Small HVAC Units – Appendix B
72
Site 169 - Monrovian Family Restaurant
The Monrovian Family Restaurant at 534 Myrtle Ave in Monrovia is a two-story 10,490 square foot building. The majority of the space is conditioned and is used as a full service restaurant. Heating and cooling for the building is provided by Carrier packaged air conditioners. None of the units are equipped with economizers, which modulate outside air proportions and provide free cooling when conditions permit.
Monitoring Configuration
Short-term diagnostic monitoring was performed on two of the units at this site. The units are classified by the following serial numbers: 3596G21111 and 2195G20925.
Economizer Operation
The units monitored did not have economizers.
Fan Schedules
Neither of the units appeared to follow an operation schedule. The units ran at all hours every day of the week. The compressor in unit 2195G20925 ran continuously for four days during the monitoring period.
This figure displays the kW for each of the units over time. Each series of data (from top to bottom) represents a different unit. The kW is labeled to the left of each time series

Summary of Problems - Small HVAC Units – Appendix B
73
plot. The date and time are labeled at the bottom. Each unit is labeled in the center of the top of each series.
Unit Power vs. Time
2
4
kW
S 12 CV: AHU1 Supply Fan+ Power
2
4
6
10/06/01 10/08/01 10/10/01 10/12/01 10/14/01 10/16/01 10/18/01
kW
Date
S 36 CV: AHU2 Supply Fan+ Power
Fan Operation
The supply fan in each of the units monitored cycled with calls for cooling. The fans should run independently of the compressor to supply continuous fresh air to the building. The thermostats that are currently installed in the building are intended for residential use and are incapable of scheduling the fan operation independently of the compressor.
Simultaneous Heating and Cooling
During the monitoring period none of the units operated in heating mode. It is possible that simultaneous heating and cooling may occur during milder months.
Maintenance Condition
The units appear to need servicing and cleaning. The grease in the exhaust air from the kitchen has clogged many of the filters, hindering the ability of the units to function properly. The following image shows the grease build-up on the exterior of one of the units:
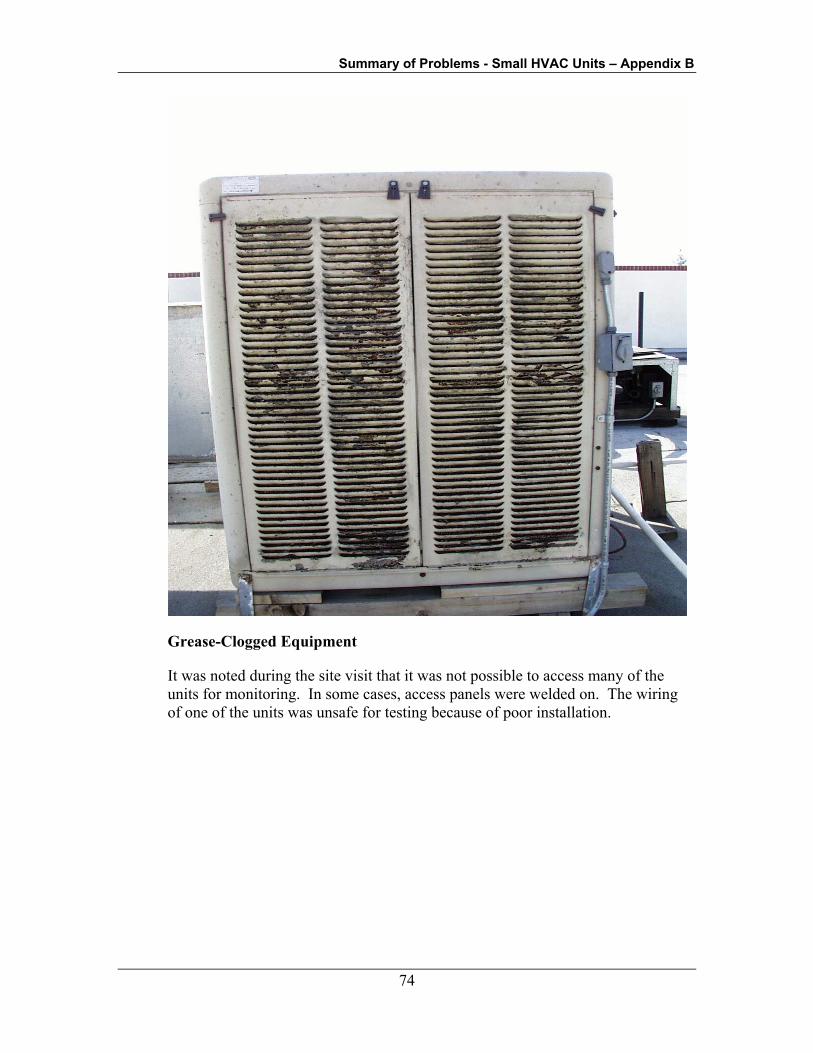
Summary of Problems - Small HVAC Units – Appendix B
74
Grease-Clogged Equipment
It was noted during the site visit that it was not possible to access many of the units for monitoring. In some cases, access panels were welded on. The wiring of one of the units was unsafe for testing because of poor installation.

Summary of Problems - Small HVAC Units – Appendix B
75
Poor Wiring Installation
Other Issues
At the time of the site visit, one of the cooling coils had frozen up enough that ice was built up on the air filter. The supply air temperature in both of the units monitored was over 60 degrees F. At the time of the site visit in October the team of surveyors was unable to get two of the units to run. It is likely that there is something malfunctioning in these units.
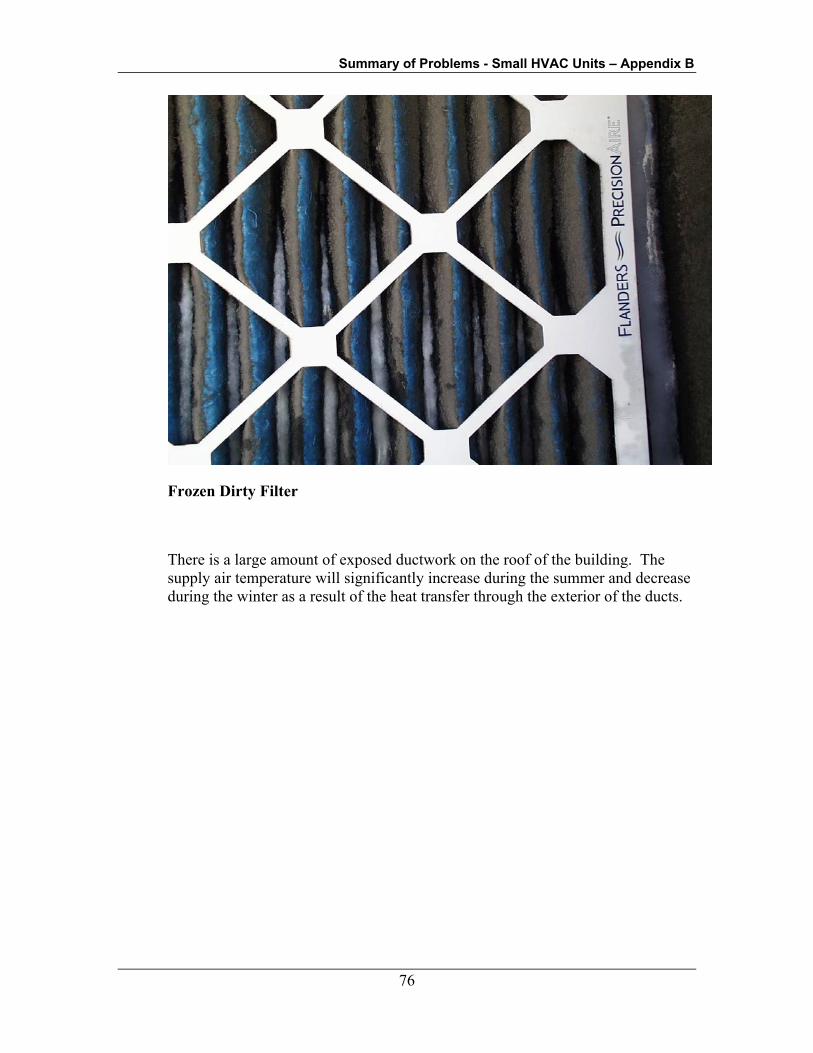
Summary of Problems - Small HVAC Units – Appendix B
76
Frozen Dirty Filter
There is a large amount of exposed ductwork on the roof of the building. The supply air temperature will significantly increase during the summer and decrease during the winter as a result of the heat transfer through the exterior of the ducts.
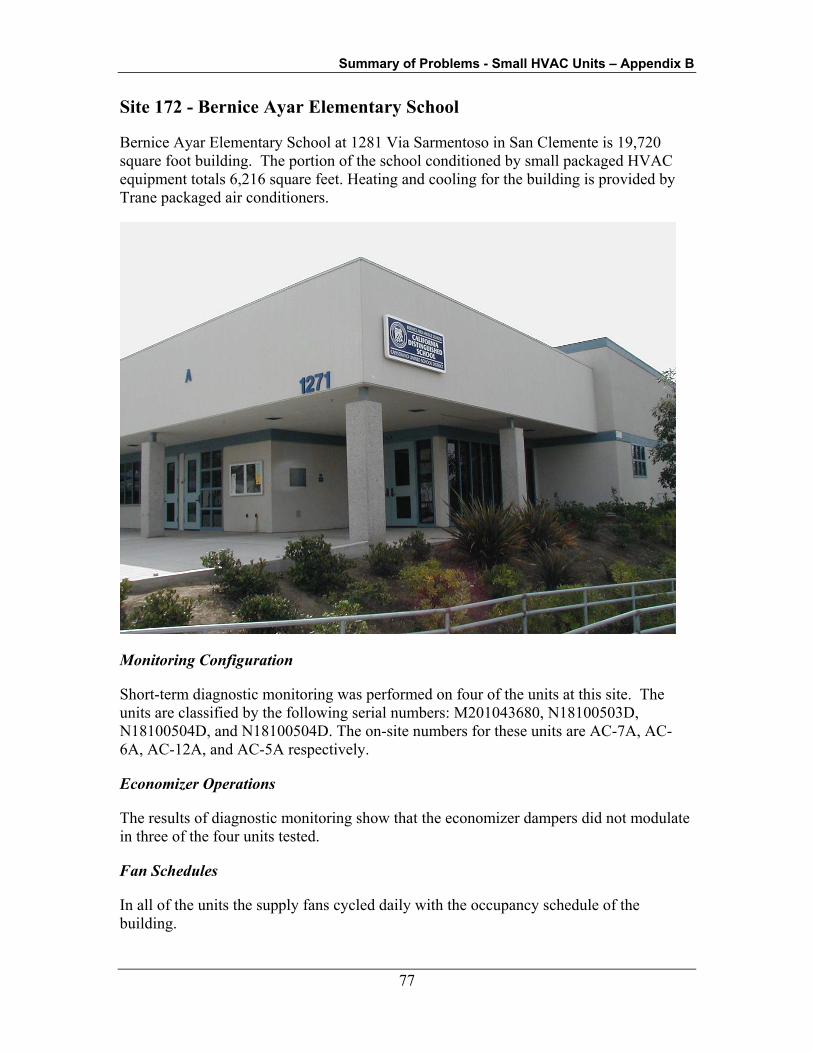
Summary of Problems - Small HVAC Units – Appendix B
77
Site 172 - Bernice Ayar Elementary School
Bernice Ayar Elementary School at 1281 Via Sarmentoso in San Clemente is 19,720 square foot building. The portion of the school conditioned by small packaged HVAC equipment totals 6,216 square feet. Heating and cooling for the building is provided by Trane packaged air conditioners.
Monitoring Configuration
Short-term diagnostic monitoring was performed on four of the units at this site. The units are classified by the following serial numbers: M201043680, N18100503D, N18100504D, and N18100504D. The on-site numbers for these units are AC-7A, AC-6A, AC-12A, and AC-5A respectively.
Economizer Operations
The results of diagnostic monitoring show that the economizer dampers did not modulate in three of the four units tested.
Fan Schedules
In all of the units the supply fans cycled daily with the occupancy schedule of the building.
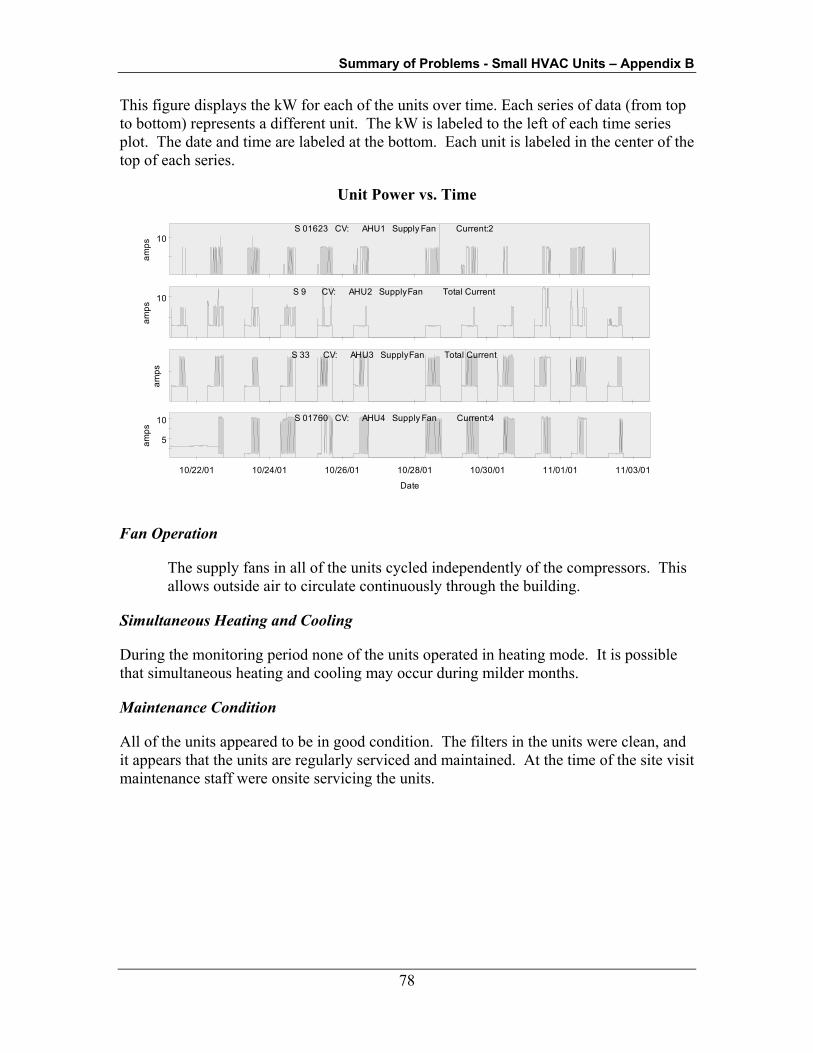
Summary of Problems - Small HVAC Units – Appendix B
78
This figure displays the kW for each of the units over time. Each series of data (from top to bottom) represents a different unit. The kW is labeled to the left of each time series plot. The date and time are labeled at the bottom. Each unit is labeled in the center of the top of each series.
Unit Power vs. Time
10
amps
S 01623 CV: AHU1 Supply Fan Current:2
10
amps
S 9 CV: AHU2 Supply Fan Total Current
amps
S 33 CV: AHU3 Supply Fan Total Current
5
10
10/22/01 10/24/01 10/26/01 10/28/01 10/30/01 11/01/01 11/03/01
amps
Date
S 01760 CV: AHU4 Supply Fan Current:4
Fan Operation
The supply fans in all of the units cycled independently of the compressors. This allows outside air to circulate continuously through the building.
Simultaneous Heating and Cooling
During the monitoring period none of the units operated in heating mode. It is possible that simultaneous heating and cooling may occur during milder months.
Maintenance Condition
All of the units appeared to be in good condition. The filters in the units were clean, and it appears that the units are regularly serviced and maintained. At the time of the site visit maintenance staff were onsite servicing the units.
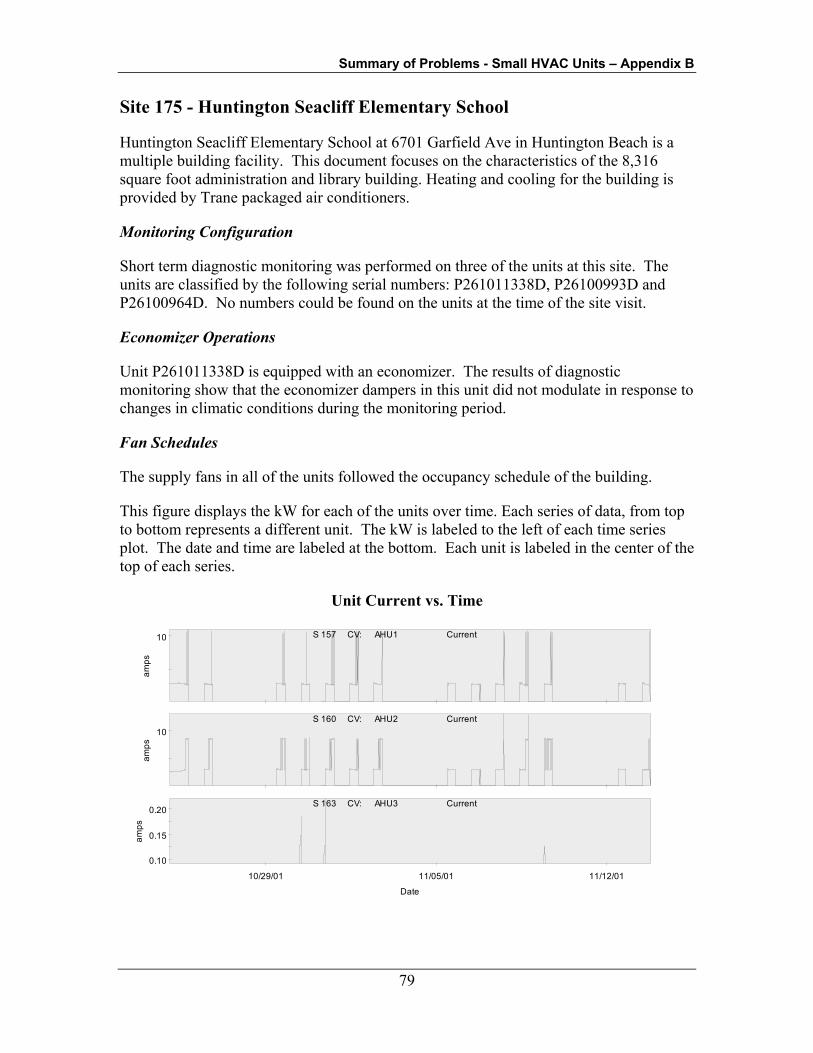
Summary of Problems - Small HVAC Units – Appendix B
79
Site 175 - Huntington Seacliff Elementary School
Huntington Seacliff Elementary School at 6701 Garfield Ave in Huntington Beach is a multiple building facility. This document focuses on the characteristics of the 8,316 square foot administration and library building. Heating and cooling for the building is provided by Trane packaged air conditioners.
Monitoring Configuration
Short term diagnostic monitoring was performed on three of the units at this site. The units are classified by the following serial numbers: P261011338D, P26100993D and P26100964D. No numbers could be found on the units at the time of the site visit.
Economizer Operations
Unit P261011338D is equipped with an economizer. The results of diagnostic monitoring show that the economizer dampers in this unit did not modulate in response to changes in climatic conditions during the monitoring period.
Fan Schedules
The supply fans in all of the units followed the occupancy schedule of the building.
This figure displays the kW for each of the units over time. Each series of data, from top to bottom represents a different unit. The kW is labeled to the left of each time series plot. The date and time are labeled at the bottom. Each unit is labeled in the center of the top of each series.
Unit Current vs. Time
10
amps
S 157 CV: AHU1 Current
10
amps
S 160 CV: AHU2 Current
0.10
0.15
0.20
10/29/01 11/05/01 11/12/01
amps
Date
S 163 CV: AHU3 Current

Summary of Problems - Small HVAC Units – Appendix B
80
Fan Operation
In each unit monitored the supply air fan did not cycle with calls for cooling. This allows outside air to circulate continuously through the building.
Simultaneous Heating and Cooling
During the monitoring period none of the units operated in heating mode. It is possible that simultaneous heating and cooling may occur during the more mild months.
Maintenance Condition
All of the units appeared to be in good condition. The filters in the units were clean, and it appears that the units are regularly serviced and maintained.
Other Issues
The supply air temperature in unit P26100993D is consistently over 60 degrees. This is indicative of a potential refrigerant charge problem.
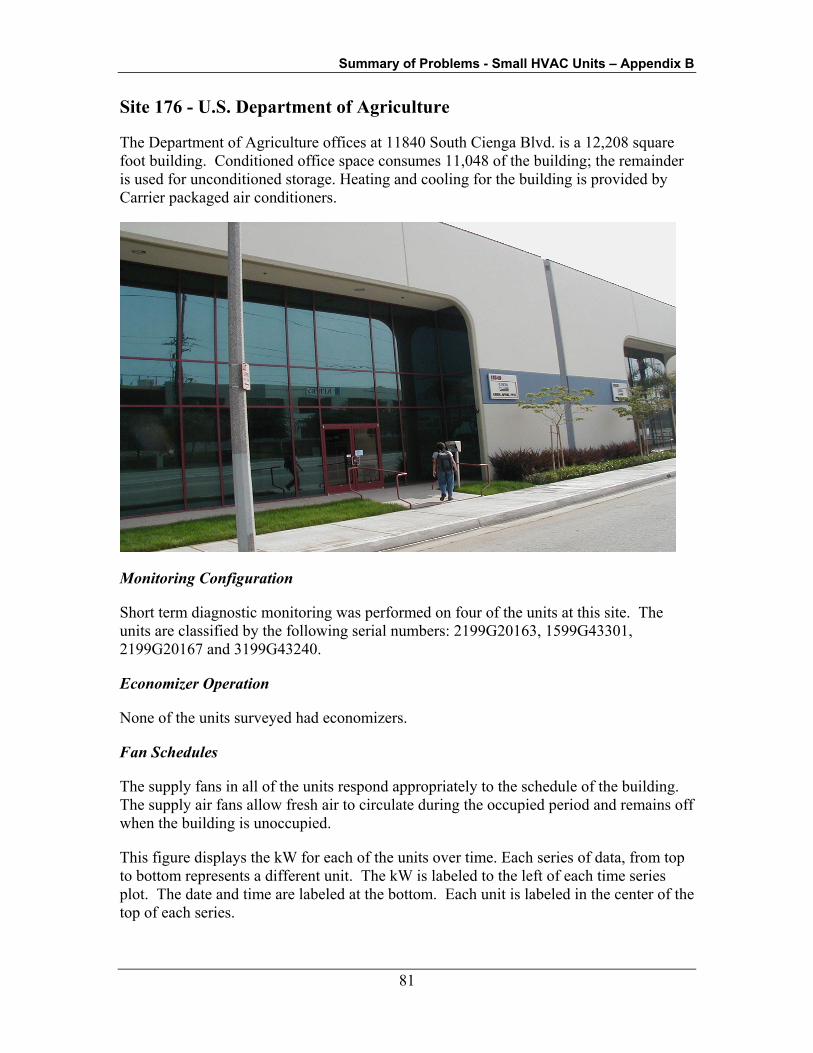
Summary of Problems - Small HVAC Units – Appendix B
81
Site 176 - U.S. Department of Agriculture
The Department of Agriculture offices at 11840 South Cienga Blvd. is a 12,208 square foot building. Conditioned office space consumes 11,048 of the building; the remainder is used for unconditioned storage. Heating and cooling for the building is provided by Carrier packaged air conditioners.
Monitoring Configuration
Short term diagnostic monitoring was performed on four of the units at this site. The units are classified by the following serial numbers: 2199G20163, 1599G43301, 2199G20167 and 3199G43240.
Economizer Operation
None of the units surveyed had economizers.
Fan Schedules
The supply fans in all of the units respond appropriately to the schedule of the building. The supply air fans allow fresh air to circulate during the occupied period and remains off when the building is unoccupied.
This figure displays the kW for each of the units over time. Each series of data, from top to bottom represents a different unit. The kW is labeled to the left of each time series plot. The date and time are labeled at the bottom. Each unit is labeled in the center of the top of each series.

Summary of Problems - Small HVAC Units – Appendix B
82
Unit power vs. time
0
10
20kW
S 173 CV: HP-5 Supply Fan+ Power
0
10
kW
S 194 CV: HP-6 Supply Fan+ Power
0
10
kW
S 266 CV: HP-6 Supply Fan Power
0.0
0.5
1.0
10/22/01 10/29/01
kW
Date
S 215 CV: HP-7 Supply Fan+ Power
Fan Operation
In each unit monitored the supply air fan cycled independently of the compressors as intended.
Simultaneous Heating and Cooling
During the monitoring period none of the units operated in heating mode. It is possible that simultaneous heating and cooling may occur during the more mild months.
Maintenance Condition
All of the units appeared to be in good condition. The filters in the units were clean, and it appears that the units are regularly serviced and maintained.
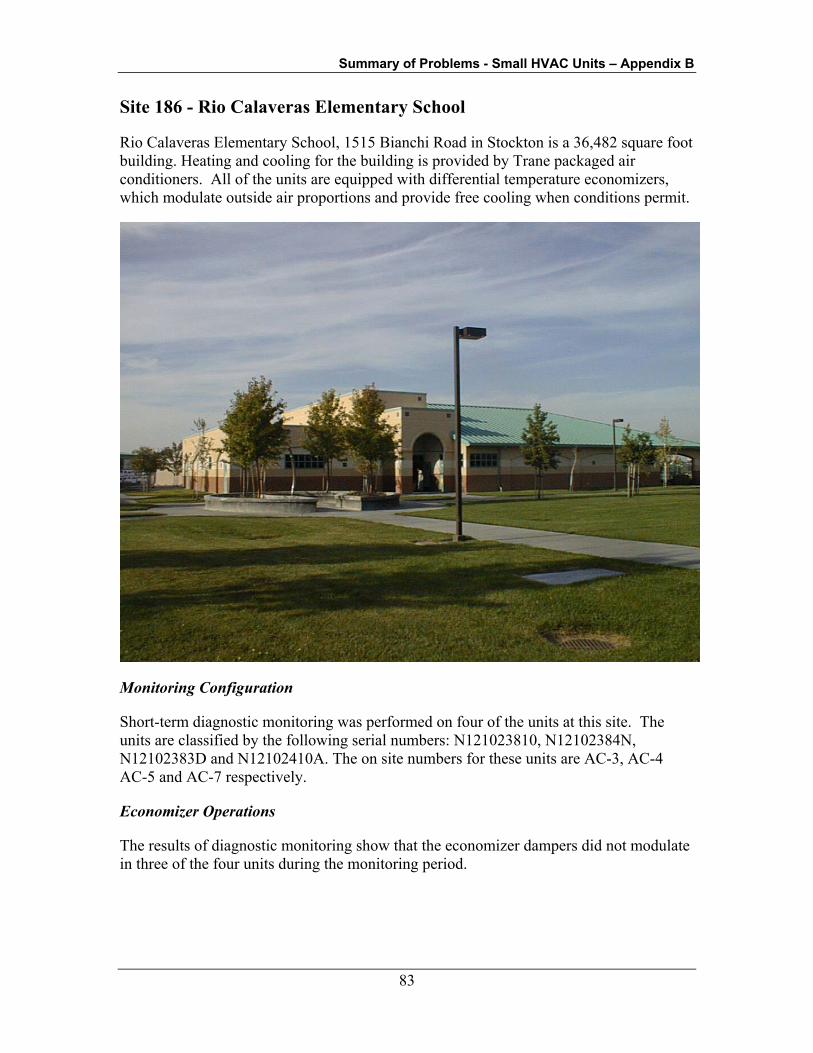
Summary of Problems - Small HVAC Units – Appendix B
83
Site 186 - Rio Calaveras Elementary School
Rio Calaveras Elementary School, 1515 Bianchi Road in Stockton is a 36,482 square foot building. Heating and cooling for the building is provided by Trane packaged air conditioners. All of the units are equipped with differential temperature economizers, which modulate outside air proportions and provide free cooling when conditions permit.
Monitoring Configuration
Short-term diagnostic monitoring was performed on four of the units at this site. The units are classified by the following serial numbers: N121023810, N12102384N, N12102383D and N12102410A. The on site numbers for these units are AC-3, AC-4 AC-5 and AC-7 respectively.
Economizer Operations
The results of diagnostic monitoring show that the economizer dampers did not modulate in three of the four units during the monitoring period.
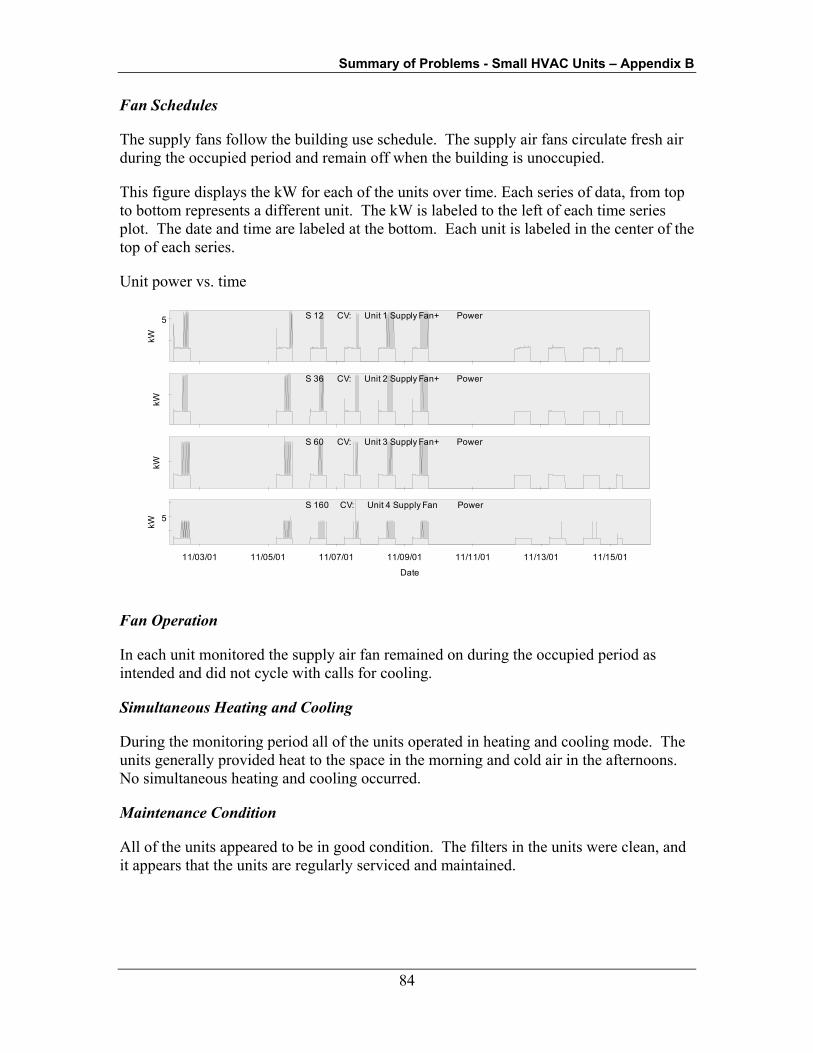
Summary of Problems - Small HVAC Units – Appendix B
84
Fan Schedules
The supply fans follow the building use schedule. The supply air fans circulate fresh air during the occupied period and remain off when the building is unoccupied.
This figure displays the kW for each of the units over time. Each series of data, from top to bottom represents a different unit. The kW is labeled to the left of each time series plot. The date and time are labeled at the bottom. Each unit is labeled in the center of the top of each series.
Unit power vs. time
5
kW
S 12 CV: Unit 1 Supply Fan+ Power
kW
S 36 CV: Unit 2 Supply Fan+ Power
kW
S 60 CV: Unit 3 Supply Fan+ Power
5
11/03/01 11/05/01 11/07/01 11/09/01 11/11/01 11/13/01 11/15/01
kW
Date
S 160 CV: Unit 4 Supply Fan Power
Fan Operation
In each unit monitored the supply air fan remained on during the occupied period as intended and did not cycle with calls for cooling.
Simultaneous Heating and Cooling
During the monitoring period all of the units operated in heating and cooling mode. The units generally provided heat to the space in the morning and cold air in the afternoons. No simultaneous heating and cooling occurred.
Maintenance Condition
All of the units appeared to be in good condition. The filters in the units were clean, and it appears that the units are regularly serviced and maintained.
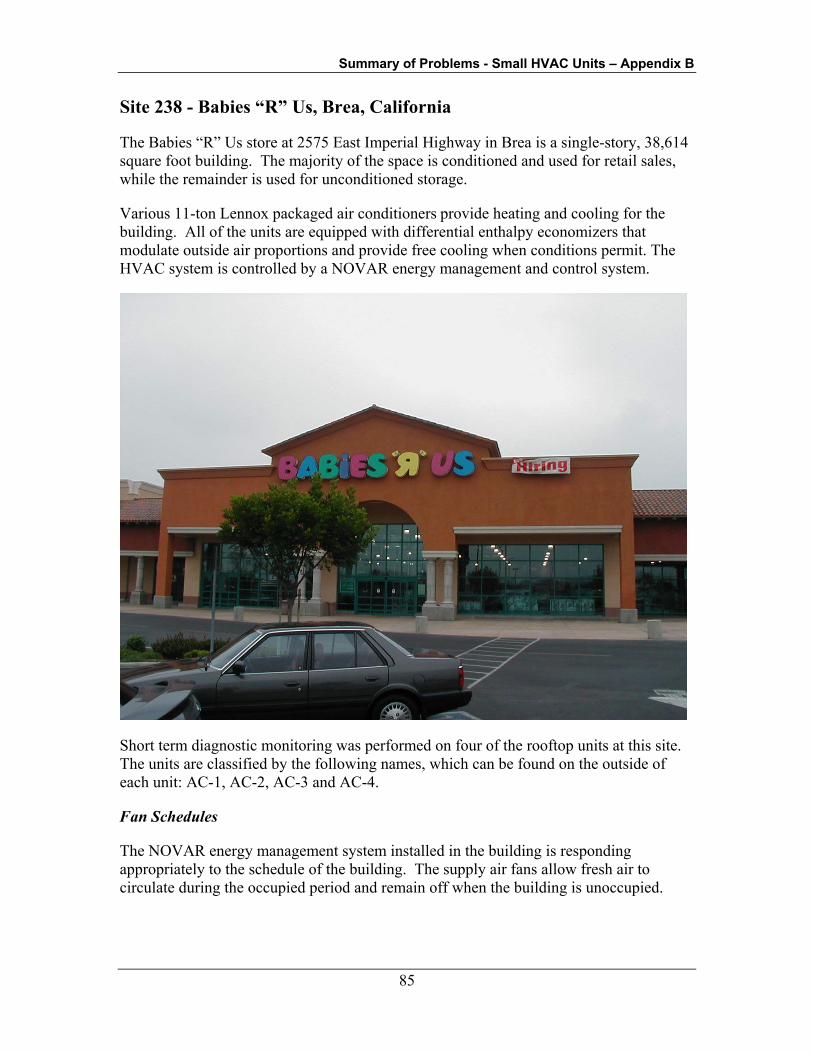
Summary of Problems - Small HVAC Units – Appendix B
85
Site 238 - Babies “R” Us, Brea, California
The Babies “R” Us store at 2575 East Imperial Highway in Brea is a single-story, 38,614 square foot building. The majority of the space is conditioned and used for retail sales, while the remainder is used for unconditioned storage.
Various 11-ton Lennox packaged air conditioners provide heating and cooling for the building. All of the units are equipped with differential enthalpy economizers that modulate outside air proportions and provide free cooling when conditions permit. The HVAC system is controlled by a NOVAR energy management and control system.
Short term diagnostic monitoring was performed on four of the rooftop units at this site. The units are classified by the following names, which can be found on the outside of each unit: AC-1, AC-2, AC-3 and AC-4.
Fan Schedules
The NOVAR energy management system installed in the building is responding appropriately to the schedule of the building. The supply air fans allow fresh air to circulate during the occupied period and remain off when the building is unoccupied.

Summary of Problems - Small HVAC Units – Appendix B
86
Fan Operation
In each unit, the supply air fan remained on during the occupied period as intended and did not cycle with calls for cooling. The following plot shows the operation of the units over the two-week monitoring period. Fan only operation uses about four kW of power in each of the units, first stage cooling uses 10kW and demand spikes above 10 kW represent second stage cooling.
Time series plot of unit kW
10
kW
S 187 CV: AC1 Supply Fan+ Power
10
kW
S 208 CV: AC2 Supply Fan+ Power
10
kW
S 229 CV: AC3 Supply Fan+ Power
10
11/03/01 11/05/01 11/07/01 11/09/01 11/11/01 11/13/01 11/15/01
kW
Date
S 302 CV: AC4 Supply Fan Power
Maintenance Condition
All of the units appeared to be in good operating condition. The filters in the units are clean and it appears that the units are regularly serviced and maintained.
Other Issues
Diagnostic monitoring shows that the supply air temperature for AC-2 averages 62 degrees. This is slightly higher than the desired 55 to 60-degree range. This may be indicative of a mechanical problem with the HVAC unit.
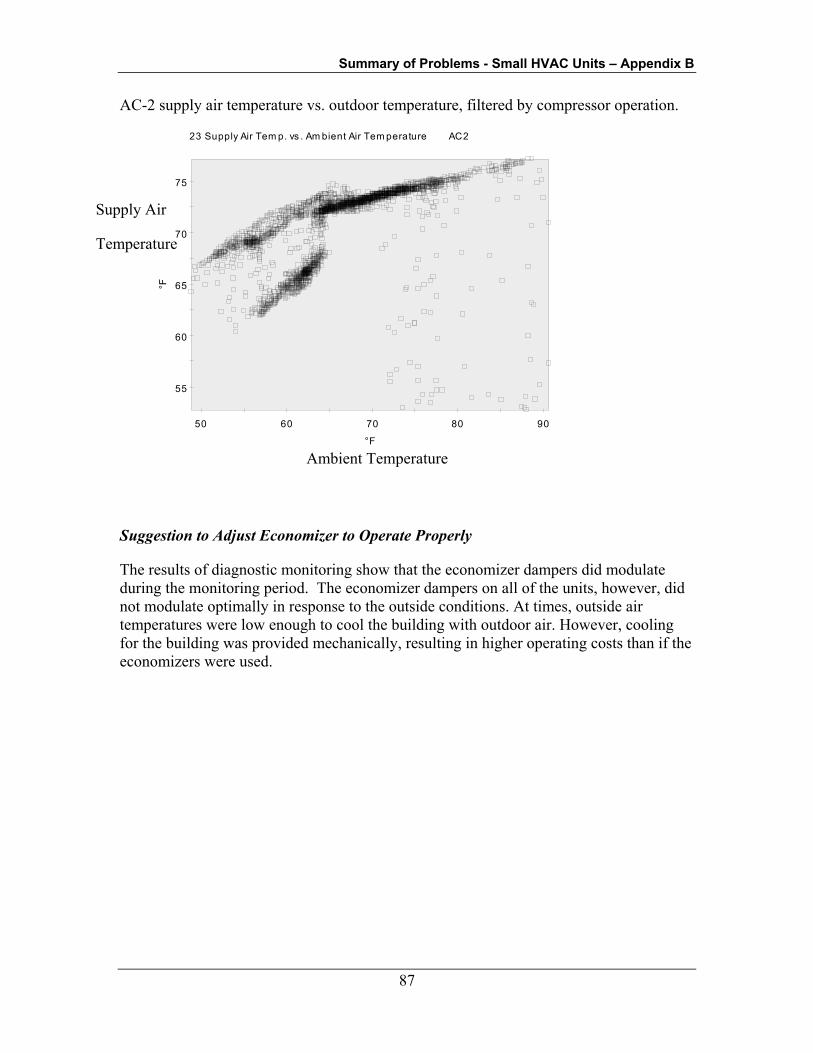
Summary of Problems - Small HVAC Units – Appendix B
87
AC-2 supply air temperature vs. outdoor temperature, filtered by compressor operation.
55
60
65
70
75
50 60 70 80 90
°F
°F
23 Supply Air Tem p. vs . Am bient Air Tem perature AC2
Suggestion to Adjust Economizer to Operate Properly
The results of diagnostic monitoring show that the economizer dampers did modulate during the monitoring period. The economizer dampers on all of the units, however, did not modulate optimally in response to the outside conditions. At times, outside air temperatures were low enough to cool the building with outdoor air. However, cooling for the building was provided mechanically, resulting in higher operating costs than if the economizers were used.
Ambient Temperature
Supply Air
Temperature

Summary of Problems - Small HVAC Units – Appendix B
88
The data indicates that outside air temperatures were low enough at times to cool the building with outdoor air.
Babies “R” Us economizer operation
-1 4
-1 2
-1 0
-8
-6
-4
-2
0
2
-1 0 0 1 0 2 0
Del
ta T
(ºF)
D e l ta T ( ºF )
8 1 T m ixe d - T re tu rn vs . T a m b ie n t - T re tu rn A C 3 A C 3
Example of functioning economizer operation.
-1 2
-1 0
-8
-6
-4
-2
0
2
4
6
-1 0 0 1 0 2 0 3 0
Del
ta T
(ºF)
D e lta T(ºF)
8 1 Tm ixe d - Tre tu rn vs . Ta m b ie n t - T re tu rn U n it 3 U n it 3

Summary of Problems - Small HVAC Units – Appendix B
89
Site 244 - Rite-Aid Hesperia
The Rite-Aid at 17441 Main Street in Hesperia is a 17,400 square foot building. The majority of the space is conditioned and used for retail sales, while the remainder is used for unconditioned storage. Heating and cooling for the building is provided by York packaged air conditioners. All of the units are equipped with single-point enthalpy economizers, which modulate outside air proportions and provide free cooling when conditions permit.
Monitoring Configuration
Short-term diagnostic monitoring was performed on four of the units at this site. The units are classified by the following serial numbers: NLGM138216, NLGM138214, NLGM138217, and NLGM138215. The on site numbers for these units are AC-1, AC-2, AC-3, and AC-4 respectively.
Economizer Operations
The results of diagnostic monitoring show that the economizer dampers did not modulate appropriately in response to climate conditions during the monitoring period.
Fan Schedules
The operation of the units monitored follows the schedule of the building. The units remain off at night when the building is scheduled as unoccupied.

Summary of Problems - Small HVAC Units – Appendix B
90
This figure displays the kW for each of the units over time. Each series of data, from top to bottom represents a different unit. The kW is labeled to the left of each time series plot. The date and time are labeled at the bottom. Each unit is labeled in the center of the top of each series.
Unit power vs. time
10kW
S 23 CV: AC1 Supply Fan+ Power
kW
S 44 CV: AC2 Supply Fan+ Power
10
20
kW
S 65 CV: AC3 Supply Fan+ Power
5
11/03/01 11/05/01 11/07/01 11/09/01 11/11/01 11/13/01
kW
Date
S 86 CV: AC4 Supply Fan+ Power
Fan Operation
In each unit monitored the supply air fan remained on during the occupied period as intended and did not cycle with calls for cooling. Continuous operation of the supply air fans allows for required ventilation of the building.
Simultaneous Heating and Cooling
During the monitoring period none of the units operated in heating mode. It is possible that simultaneous heating and cooling may occur during the more mild months.
Maintenance Condition
All of the units appeared to be in good condition. The filters in the units were clean, and it appears that the units are regularly serviced and maintained.
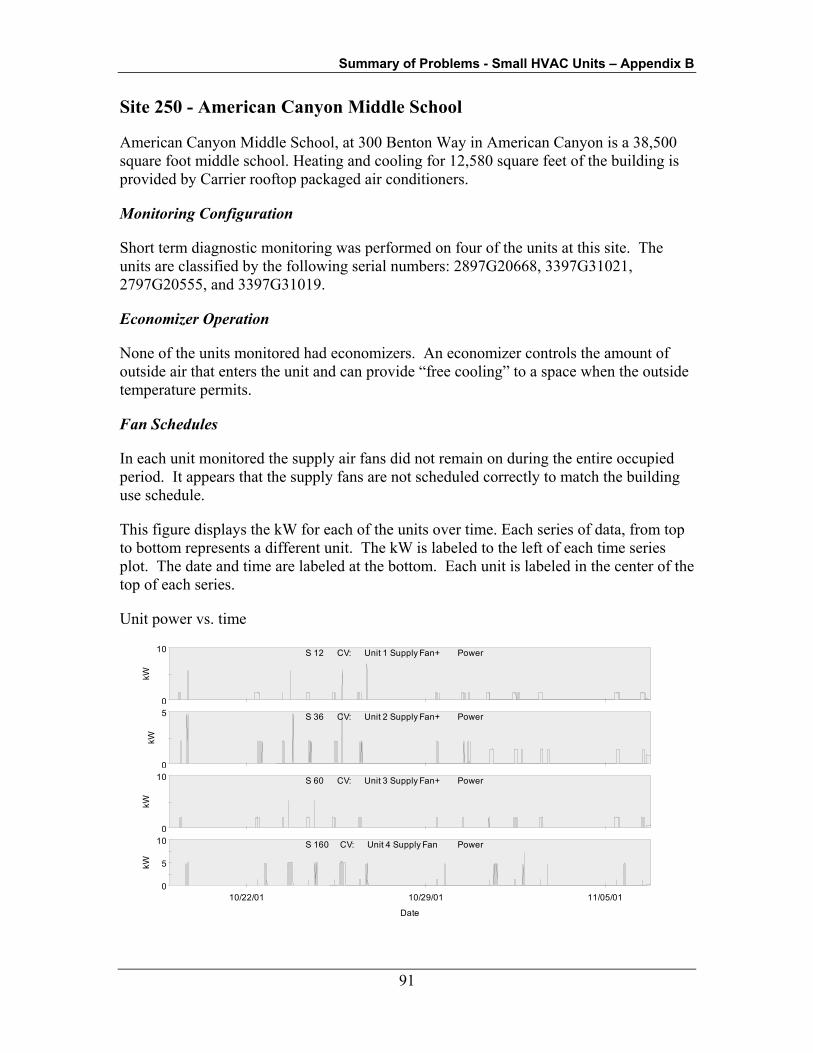
Summary of Problems - Small HVAC Units – Appendix B
91
Site 250 - American Canyon Middle School
American Canyon Middle School, at 300 Benton Way in American Canyon is a 38,500 square foot middle school. Heating and cooling for 12,580 square feet of the building is provided by Carrier rooftop packaged air conditioners.
Monitoring Configuration
Short term diagnostic monitoring was performed on four of the units at this site. The units are classified by the following serial numbers: 2897G20668, 3397G31021, 2797G20555, and 3397G31019.
Economizer Operation
None of the units monitored had economizers. An economizer controls the amount of outside air that enters the unit and can provide “free cooling” to a space when the outside temperature permits.
Fan Schedules
In each unit monitored the supply air fans did not remain on during the entire occupied period. It appears that the supply fans are not scheduled correctly to match the building use schedule.
This figure displays the kW for each of the units over time. Each series of data, from top to bottom represents a different unit. The kW is labeled to the left of each time series plot. The date and time are labeled at the bottom. Each unit is labeled in the center of the top of each series.
Unit power vs. time
0
10
kW
S 12 CV: Unit 1 Supply Fan+ Power
0
5
kW
S 36 CV: Unit 2 Supply Fan+ Power
0
10
kW
S 60 CV: Unit 3 Supply Fan+ Power
0
5
10
10/22/01 10/29/01 11/05/01
kW
Date
S 160 CV: Unit 4 Supply Fan Power

Summary of Problems - Small HVAC Units – Appendix B
92
Fan Operation
The supply air fans circulate fresh air during the occupied period and remain off when the building is unoccupied.
Simultaneous Heating and Cooling
During the monitoring period all of the units had the opportunity to run in both heating and cooling mode. No simultaneous heating and cooling occurred.
Maintenance Condition
All of the units appeared to be in good condition. The filters in the units were clean, and it appears that the units are regularly serviced and maintained. A quarter inch hole was observed on the exterior supply air duct of the unit that serves the library. It is recommended that this hole be patched.
Other Issues
Two buildings were studied at this site, the Library and the Main Office. At each of these locations the rooftop units were zoned incorrectly. Each building had two units, one larger and one smaller, with two corresponding zones. The larger units were both connected to the smaller of the two zones, serving the northeast portion of the buildings, while the smaller units served the larger southwest portions of the buildings. The problem was identified by disabling one unit at each building while forcing the other unit to run continuously. While each unit ran the diffusers were checked for airflow to determine which unit served each zone. The units were also mislabeled; it appeared that the installer intended to have the units configured correctly because the handwritten labels on the units reflect the appropriate configuration.
Summary of Problems - Small HVAC Units – Appendix B
93
2 ROUND 2 SITES
The results of the round 2 testing are described in this section. The diagnostic testing process used in Round 2 included on-site auditing of the building and one-time tests of the HVAC systems. During the on-site audit, a sample of HVAC units was selected for study. Building personnel were interviewed to obtain an understanding of system operations and maintenance procedures. The thermostats used to control the units were inspected to identify cooling and heating setpoints, the operational schedule of the unit, and the control of the air supply fan.
Spot-checking of the HVAC equipment selected with hand-held instruments was done to identify potential problems with the units. The diagnostic testing consisted of:
Air flow monitoring. The air flow rate of the unit was tested using a device called a flow grid. The unit filters were removed, and the flow grids were installed in the filter slots. The flow grid is capable of accurately measuring the air flow rate delivered by the unit.
Economizer testing. For units equipped with an economizer, the economizer was tested to see if it is functioning. The testing consisted of a mechanical test of the economizer dampers and actuators, and a cold spray test of the economizer controller to observe system operation.
Fan power test. A hand-held watt meter was used to measure the power of the unit supply fan, and a digital manometer was used to measure the duct system pressure drop.
Refrigerant charge test. The refrigerant charge was checked and adjusted using the CheckMe!TM 1 refrigerant charge diagnostics procedure.
The conditions of the units as observed are summarized in the following sections. Deviations from normal conditions are indicated for the measured parameters. Impacts indicated with a negative sign mean the unit is less efficient than normal parameters. Impacts with a positive sign indicate the unit is more efficient than normal parameters.
Unit air flow: Normal air flow is defined as 400 CFM per ton. The impacts of deviations from this value on unit cooling efficiency are indicated in the data tables.
Unit fan power. Normal fan power is defined as 365 watts per 1000 cfm, at a flow rate of 400 cfm per nominal ton. Impacts on fan energy are indicated in the data tables.
1 CheckMe!TM is a product of Proctor Engineering Group, San Rafael, CA.
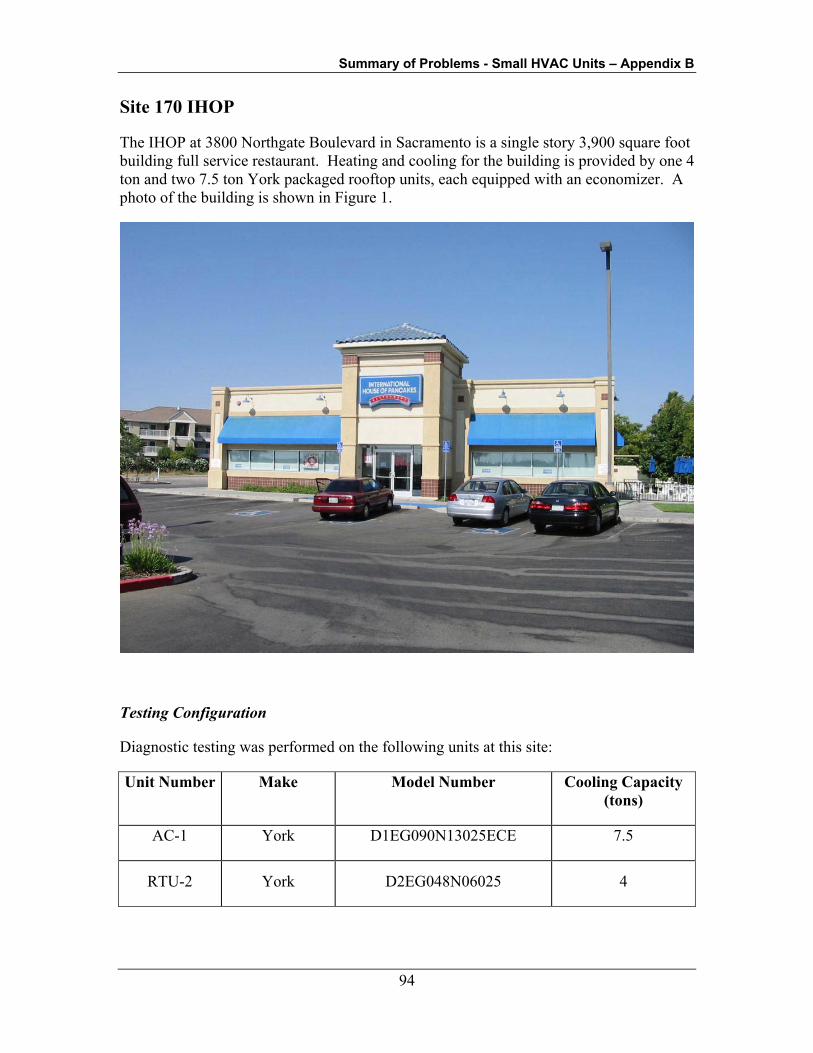
Summary of Problems - Small HVAC Units – Appendix B
94
Site 170 IHOP
The IHOP at 3800 Northgate Boulevard in Sacramento is a single story 3,900 square foot building full service restaurant. Heating and cooling for the building is provided by one 4 ton and two 7.5 ton York packaged rooftop units, each equipped with an economizer. A photo of the building is shown in Figure 1.
Testing Configuration
Diagnostic testing was performed on the following units at this site:
Unit Number Make Model Number Cooling Capacity (tons)
AC-1 York D1EG090N13025ECE 7.5
RTU-2 York D2EG048N06025 4

Summary of Problems - Small HVAC Units – Appendix B
95
Unit Number Make Model Number Cooling Capacity (tons)
RTU-3 York D1EG090N13025ECE 7.5
Economizer Operation
None of the economizers tested at this site were operable.
Fan Schedules
Thermostat not capable of scheduling the fan. The fans in all units were scheduled on at all times regardless of occupancy.
Fan Operation
The fans operated continuously in all units.
Unit Air Flow
The air flow rates for the units tested were measured as follows:
Unit Measured CFM
Normal CFM @ 400
CFM/ton
% of Normal Cooling efficiency
impact
AC-1 684 3,000 22.8% 22.0%
RTU-2 1,010 1,600 63.1% 14.6%
RTU-3 1,850 3,000 61.7% 15.4%
Supply Fan Power
The supply fan power for the units tested were measured as follows:
Unit Measured Watts
Normal Watts Fan efficiency impact
AC-1 406 1,095 63%

Summary of Problems - Small HVAC Units – Appendix B
96
Refrigerant Charge
The results of the refrigerant charge tests are summarized below:
Unit Charge deviation Cooling efficiency impact
AC-1 Charge is OK None
RTU-2 Charge is OK None
RTU-3 Charge is OK None
Maintenance Condition
The condition and apparent level of maintenance of each unit is shown below:
Unit General condition
AC-1 Small air leakage around supply air cover. No filters installed. Dirty evaporator coils.
RTU-2 Fan belt loose. No filters installed, outdoor air adjustment not working; outdoor air damper stuck at 100% open.
RTU-3
Evaporator coils very dirty. System has run without filters for a very long time. Economizer actuator not functional. Condenser coils very dirty. Compressor 1 replaced recently, but was installed without vibration dampers.
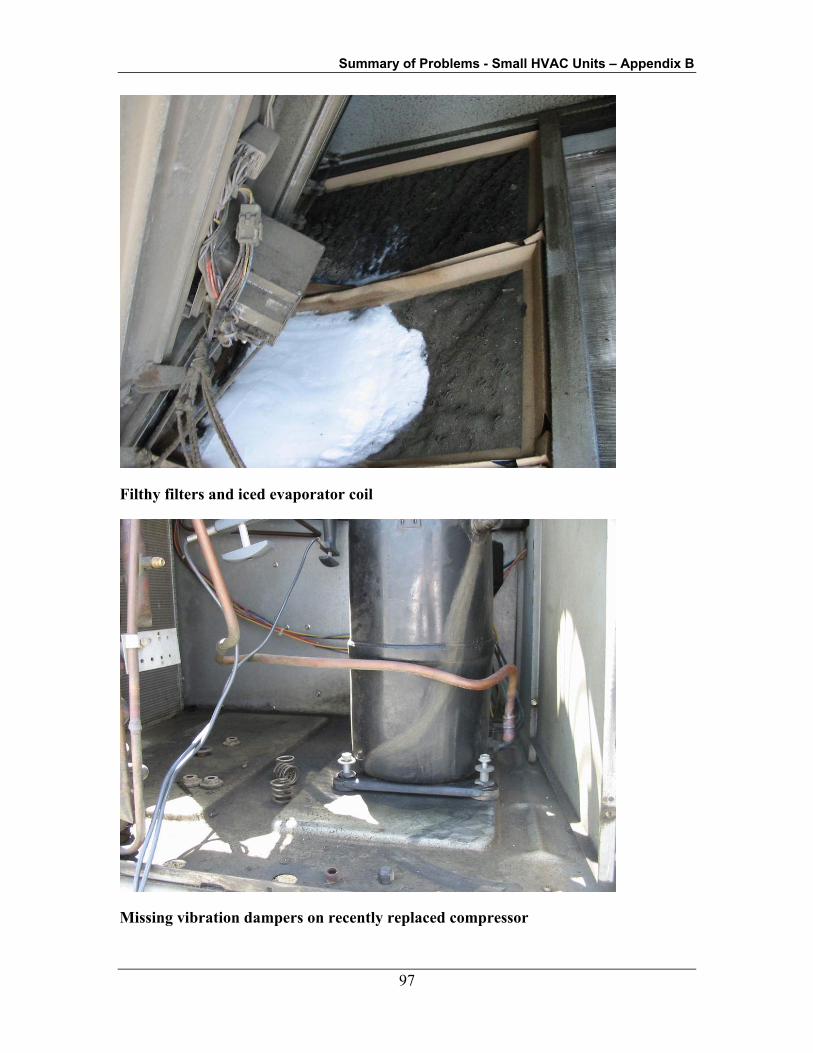
Summary of Problems - Small HVAC Units – Appendix B
97
Filthy filters and iced evaporator coil
Missing vibration dampers on recently replaced compressor

Summary of Problems - Small HVAC Units – Appendix B
98
Other Issues
AC-1 outdoor air intake located adjacent to powered exhaust fan, as shown in photo below:
Building exhaust fan discharging directly into outdoor air intake
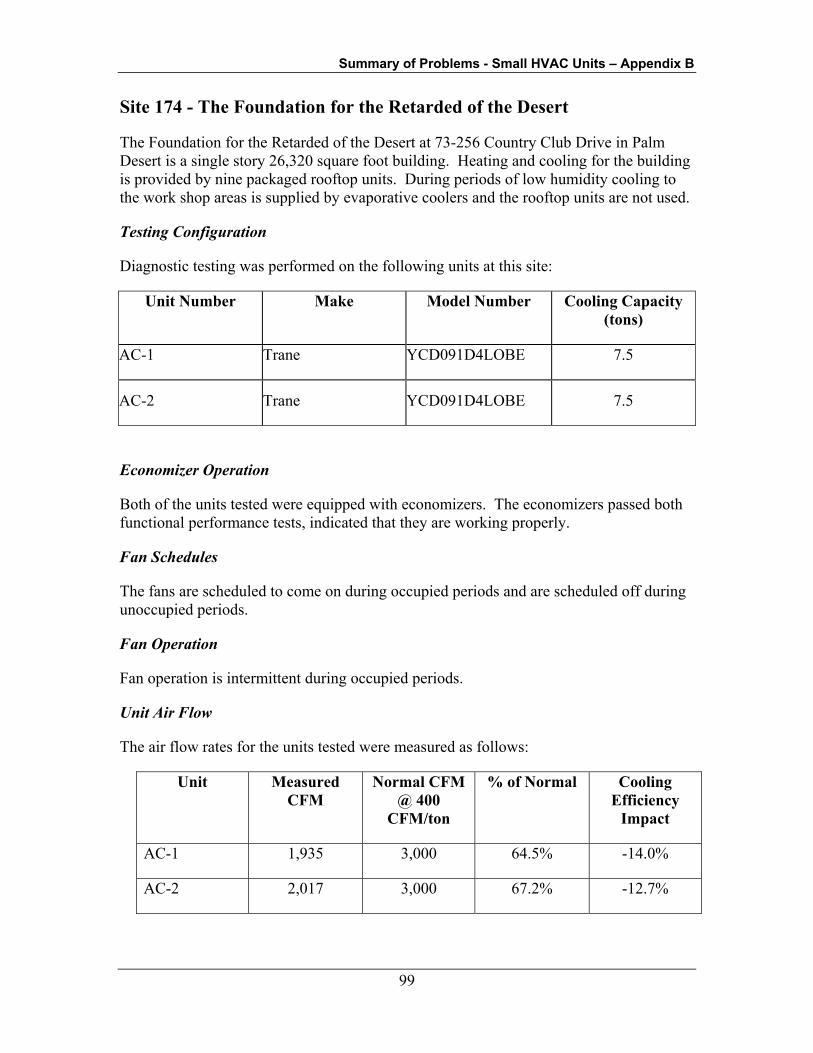
Summary of Problems - Small HVAC Units – Appendix B
99
Site 174 - The Foundation for the Retarded of the Desert
The Foundation for the Retarded of the Desert at 73-256 Country Club Drive in Palm Desert is a single story 26,320 square foot building. Heating and cooling for the building is provided by nine packaged rooftop units. During periods of low humidity cooling to the work shop areas is supplied by evaporative coolers and the rooftop units are not used.
Testing Configuration
Diagnostic testing was performed on the following units at this site:
Unit Number Make Model Number Cooling Capacity (tons)
AC-1 Trane YCD091D4LOBE 7.5
AC-2 Trane YCD091D4LOBE 7.5
Economizer Operation
Both of the units tested were equipped with economizers. The economizers passed both functional performance tests, indicated that they are working properly.
Fan Schedules
The fans are scheduled to come on during occupied periods and are scheduled off during unoccupied periods.
Fan Operation
Fan operation is intermittent during occupied periods.
Unit Air Flow
The air flow rates for the units tested were measured as follows:
Unit Measured CFM
Normal CFM @ 400
CFM/ton
% of Normal Cooling Efficiency
Impact
AC-1 1,935 3,000 64.5% -14.0%
AC-2 2,017 3,000 67.2% -12.7%
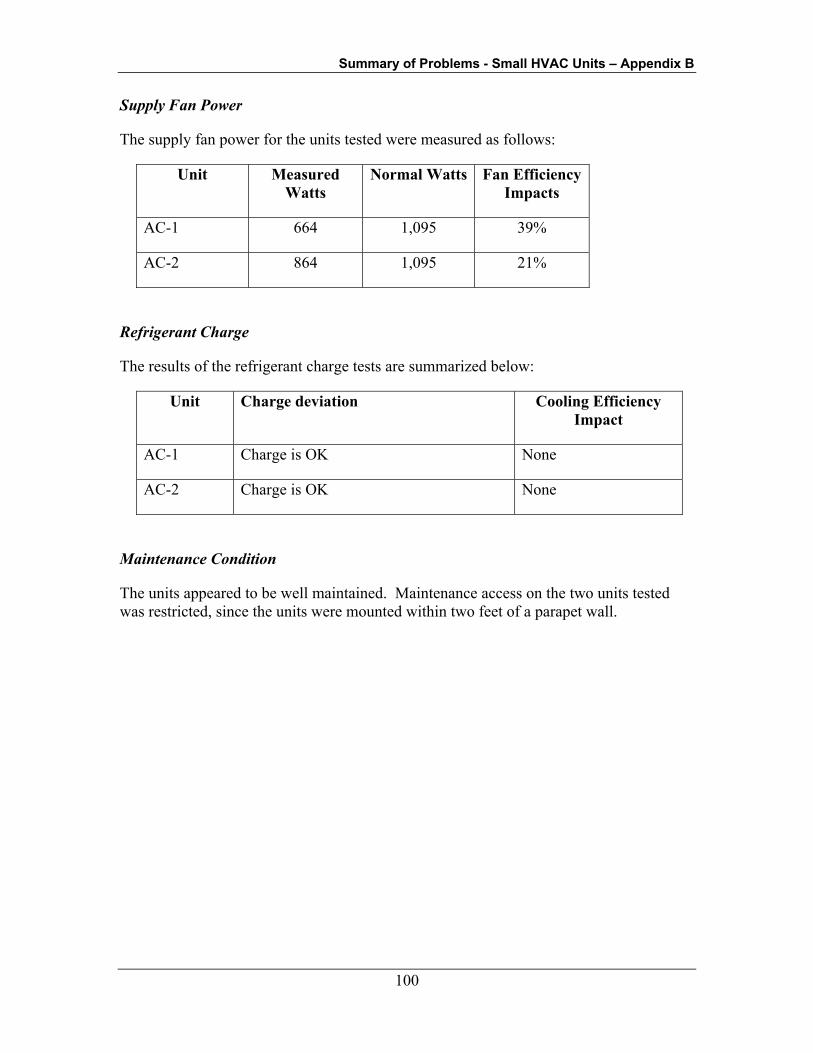
Summary of Problems - Small HVAC Units – Appendix B
100
Supply Fan Power
The supply fan power for the units tested were measured as follows:
Unit Measured Watts
Normal Watts Fan Efficiency Impacts
AC-1 664 1,095 39%
AC-2 864 1,095 21%
Refrigerant Charge
The results of the refrigerant charge tests are summarized below:
Unit Charge deviation Cooling Efficiency Impact
AC-1 Charge is OK None
AC-2 Charge is OK None
Maintenance Condition
The units appeared to be well maintained. Maintenance access on the two units tested was restricted, since the units were mounted within two feet of a parapet wall.

Summary of Problems - Small HVAC Units – Appendix B
101
Site 185 – Walgreen’s
The Walgreens at 5300 3rd Street in San Francisco is a single story 13,000 square foot building. Heating and cooling for the building is provided by Trane packaged rooftop units.
Testing Configuration
Diagnostic testing was performed on the following units at this site:
Unit Number Make Model Number Cooling Capacity (tons)
AC-1 Trane YCD091D4LABE 7.5
AC-3 Trane YCD091D4LABE 7.5
AC-4 Trane YCD091D4LABE 7.5
AC-5 Trane YCD061C4LABF 5
Economizer Operation
All units tested were equipped with economizers. The economizer did not work on unit AC-3.
Fan Schedules
Fans were scheduled to run whenever there is a call for heating or cooling
Fan Operation
Fans cycle on a call for heating and cooling
Unit Air Flow
The air flow rates for the units tested were measured as follows:
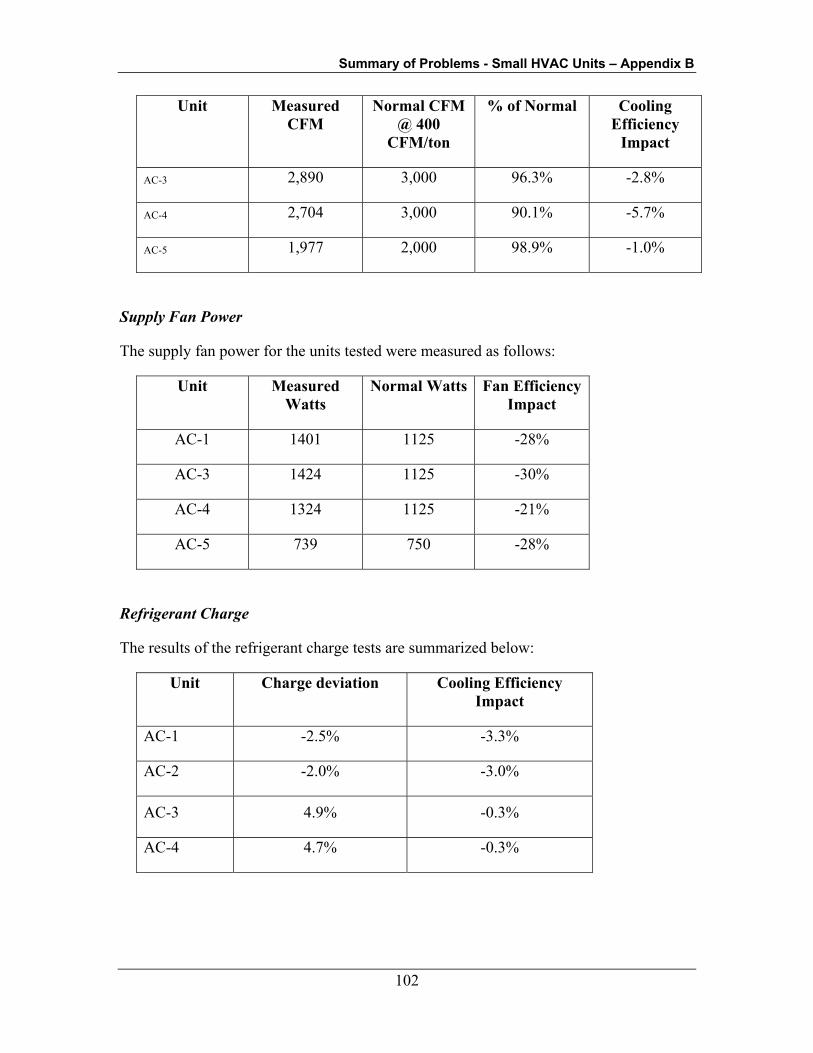
Summary of Problems - Small HVAC Units – Appendix B
102
Unit Measured CFM
Normal CFM @ 400
CFM/ton
% of Normal Cooling Efficiency
Impact
AC-3 2,890 3,000 96.3% -2.8%
AC-4 2,704 3,000 90.1% -5.7%
AC-5 1,977 2,000 98.9% -1.0%
Supply Fan Power
The supply fan power for the units tested were measured as follows:
Unit Measured Watts
Normal Watts Fan Efficiency Impact
AC-1 1401 1125 -28%
AC-3 1424 1125 -30%
AC-4 1324 1125 -21%
AC-5 739 750 -28%
Refrigerant Charge
The results of the refrigerant charge tests are summarized below:
Unit Charge deviation Cooling Efficiency Impact
AC-1 -2.5% -3.3%
AC-2 -2.0% -3.0%
AC-3 4.9% -0.3%
AC-4 4.7% -0.3%
Summary of Problems - Small HVAC Units – Appendix B
103
Maintenance Condition
Unit AC-2 had a bad Schrader valve that needs to be replaced. The filters were clean and the units seemed to be well-maintained.
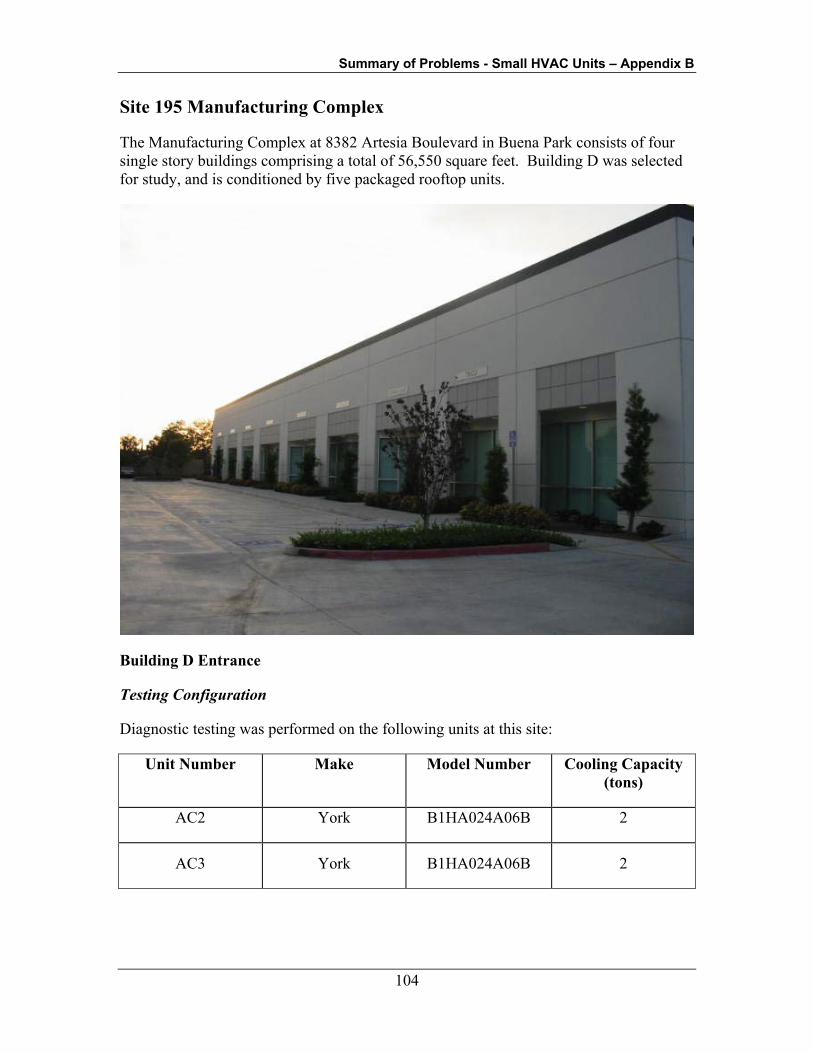
Summary of Problems - Small HVAC Units – Appendix B
104
Site 195 Manufacturing Complex
The Manufacturing Complex at 8382 Artesia Boulevard in Buena Park consists of four single story buildings comprising a total of 56,550 square feet. Building D was selected for study, and is conditioned by five packaged rooftop units.
Building D Entrance
Testing Configuration
Diagnostic testing was performed on the following units at this site:
Unit Number Make Model Number Cooling Capacity (tons)
AC2 York B1HA024A06B 2
AC3 York B1HA024A06B 2
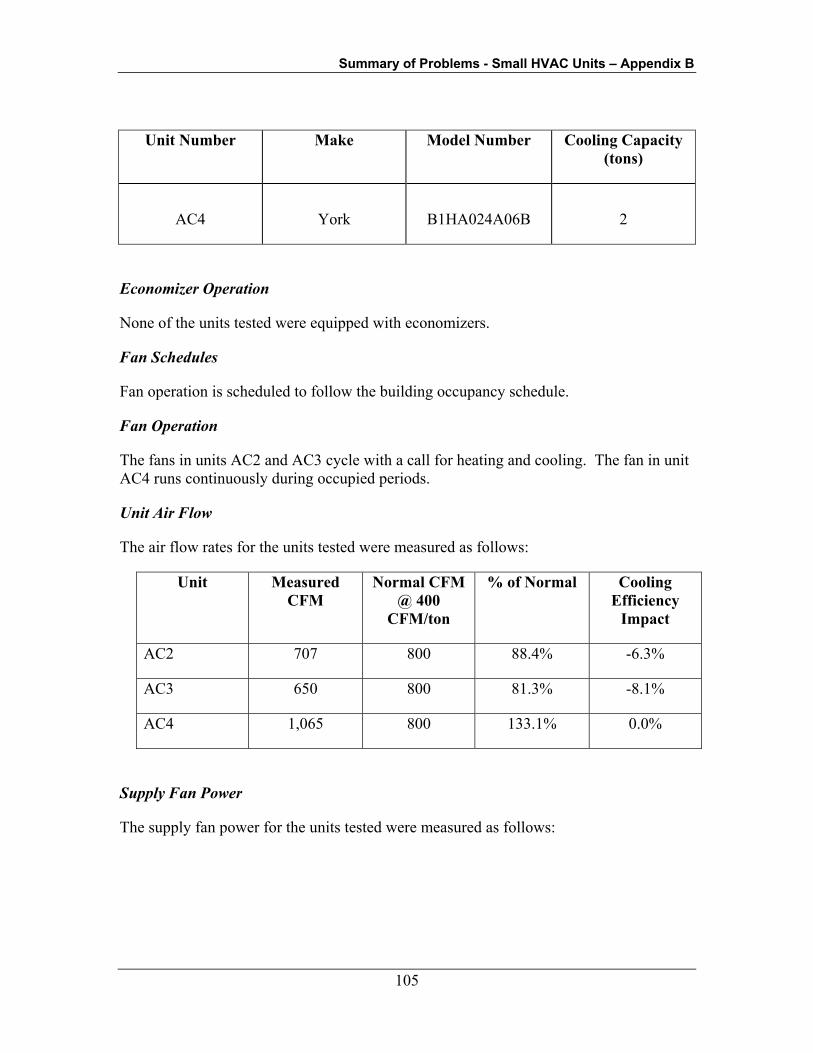
Summary of Problems - Small HVAC Units – Appendix B
105
Unit Number Make Model Number Cooling Capacity (tons)
AC4 York B1HA024A06B 2
Economizer Operation
None of the units tested were equipped with economizers.
Fan Schedules
Fan operation is scheduled to follow the building occupancy schedule.
Fan Operation
The fans in units AC2 and AC3 cycle with a call for heating and cooling. The fan in unit AC4 runs continuously during occupied periods.
Unit Air Flow
The air flow rates for the units tested were measured as follows:
Unit Measured CFM
Normal CFM @ 400
CFM/ton
% of Normal Cooling Efficiency
Impact
AC2 707 800 88.4% -6.3%
AC3 650 800 81.3% -8.1%
AC4 1,065 800 133.1% 0.0%
Supply Fan Power
The supply fan power for the units tested were measured as follows:

Summary of Problems - Small HVAC Units – Appendix B
106
Unit Measured Watts
Normal Watts Fan Efficiency Impact
AC2 230 292 21%
AC3 231 292 21%
AC4 422 292 -45%
Refrigerant Charge
The results of the refrigerant charge tests are summarized below:
Unit Charge deviation Cooling Efficiency impact
AC2 9.4% 1.2%
AC3 Leaks
AC4 Charge OK No impact
Maintenance Condition
The units were in good condition and appeared to be well maintained.
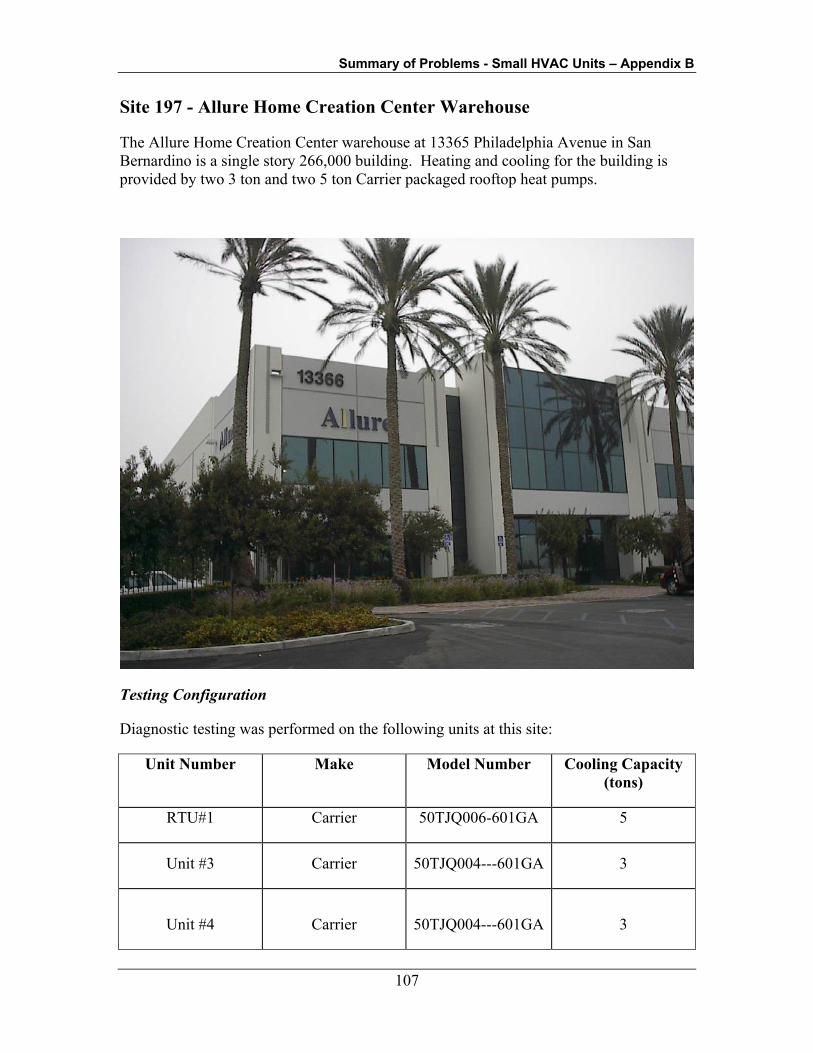
Summary of Problems - Small HVAC Units – Appendix B
107
Site 197 - Allure Home Creation Center Warehouse
The Allure Home Creation Center warehouse at 13365 Philadelphia Avenue in San Bernardino is a single story 266,000 building. Heating and cooling for the building is provided by two 3 ton and two 5 ton Carrier packaged rooftop heat pumps.
Testing Configuration
Diagnostic testing was performed on the following units at this site:
Unit Number Make Model Number Cooling Capacity (tons)
RTU#1 Carrier 50TJQ006-601GA 5
Unit #3 Carrier 50TJQ004---601GA 3
Unit #4 Carrier 50TJQ004---601GA 3

Summary of Problems - Small HVAC Units – Appendix B
108
Unit Number Make Model Number Cooling Capacity (tons)
Unit#2 Carrier 50TJQ006---601GA 5
Economizer Operation
None of the units at this site were equipped with economizers.
Fan Schedules
The units were scheduled to run 24 hours/day, 7 days/week, while the building is occupied 6am to 6pm Monday-Friday.
Fan Operation
The fans are set up to run continuously.
Unit Air Flow
The air flow rates for the units tested were measured as follows:
Unit Measured CFM
Normal CFM @ 400
CFM/ton
% of Normal Cooling Efficiency
Impact
RTU#1 1,190 2,000 59.5% 16.5%
Unit #3 924 1,200 77.0% 9.2%
Unit #4 990 1,200 82.5% 7.8%
Unit#2 1,290 2,000 64.5% 14.0%
Supply Fan Power
The supply fan power for the units tested were measured as follows:
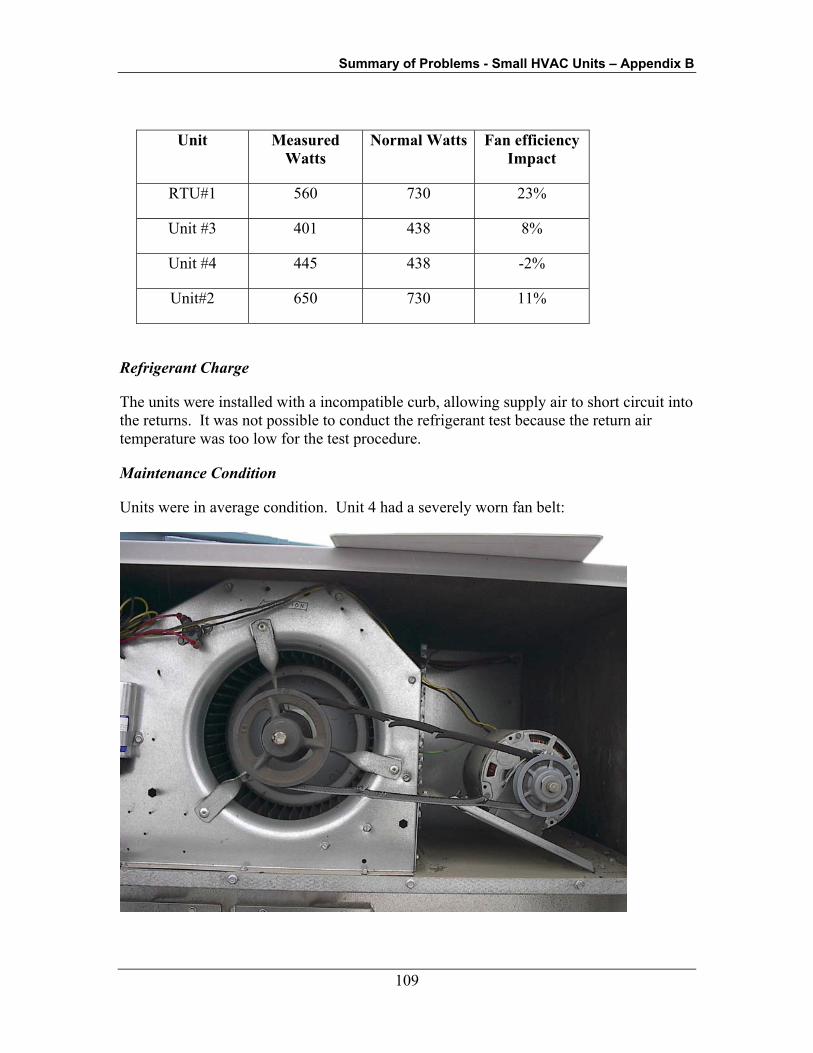
Summary of Problems - Small HVAC Units – Appendix B
109
Unit Measured Watts
Normal Watts Fan efficiency Impact
RTU#1 560 730 23%
Unit #3 401 438 8%
Unit #4 445 438 -2%
Unit#2 650 730 11%
Refrigerant Charge
The units were installed with a incompatible curb, allowing supply air to short circuit into the returns. It was not possible to conduct the refrigerant test because the return air temperature was too low for the test procedure.
Maintenance Condition
Units were in average condition. Unit 4 had a severely worn fan belt:

Summary of Problems - Small HVAC Units – Appendix B
110
Other Issues
The units were installed with an incompatible curb, allowing supply air to short circuit into the returns, as shown below:
Misalignment of unit supply and return outlets with building ductwork
Close-up of unit supply plenum showing bypass into return side
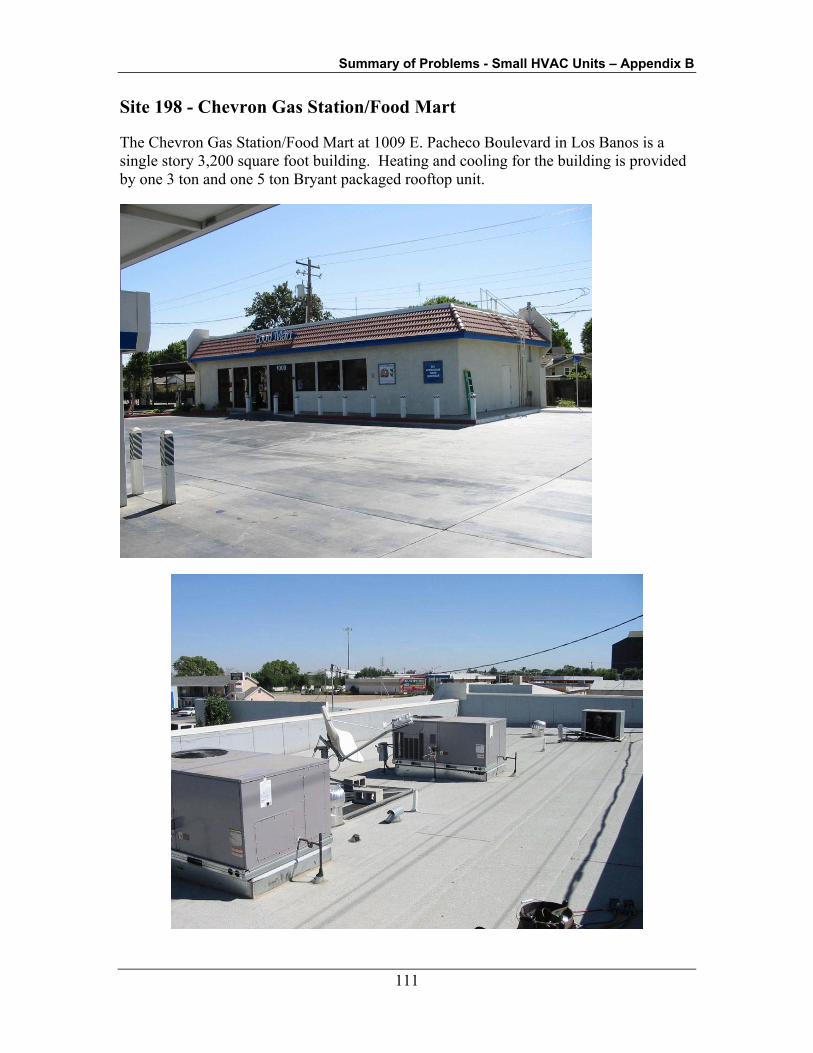
Summary of Problems - Small HVAC Units – Appendix B
111
Site 198 - Chevron Gas Station/Food Mart
The Chevron Gas Station/Food Mart at 1009 E. Pacheco Boulevard in Los Banos is a single story 3,200 square foot building. Heating and cooling for the building is provided by one 3 ton and one 5 ton Bryant packaged rooftop unit.

Summary of Problems - Small HVAC Units – Appendix B
112
Testing Configuration
Diagnostic testing was performed on the following units at this site:
Unit Number Make Model Number Cooling Capacity (tons)
AC1 Bryant 501BPU031072APAA 3
AC2 Bryant 581PU060072ADAA 5
Economizer Operation
Neither unit at this site was equipped with an economizer
Fan Schedules
The fans are scheduled to operate along with the building occupancy, which is 24 hours per day, 7 days per week.
Fan Operation
The fans are set up to cycle on and off with a call for heating or cooling.
Unit Air Flow
The air flow rates for the units tested were measured as follows:
Unit Measured CFM
Normal CFM @ 400
CFM/ton
% of Normal Cooling Efficiency
Impact
AC1 872 1,200 72.7% -10.6%
AC2 1,307 2,000 65.4% -13.6%
Supply Fan Power
The supply fan power for the units tested were measured as follows:

Summary of Problems - Small HVAC Units – Appendix B
113
Unit Measured Watts
Normal Watts Fan Efficiency Impact
AC1 380 438 13%
AC2 740 730 -1%
Refrigerant Charge
The results of the refrigerant charge tests are summarized below:
Unit Charge deviation Cooling Efficiency impact
AC-1 Charge OK No Impact
AC-2 Charge OK No Impact
Maintenance Condition
The filters and coils were very dirty at this site.
Filter as removed from system

Summary of Problems - Small HVAC Units – Appendix B
114
Indoor coil dirty and showing signs of corrosion.
Other Issues
There was no outdoor air intake for unit AC-1.
Summary of Problems - Small HVAC Units – Appendix B
115
Site 207 - Office Building
The Office Building at 3586 4th Avenue in San Diego is a three story 6,420 square foot building. Heating and cooling for the building is provided by two Carrier 4 ton packaged rooftop heat pumps.
Testing Configuration
Diagnostic testing was performed on the following units at this site:
Unit Number Make Model Number Cooling Capacity (tons)
AC-1 Carrier 50TJQ005 4
AC-2 Carrier 50TJQ005 4
Economizer Operation
Economizers were not installed at this site
Fan Schedules
The fans are scheduled on between 7:30am and 5 pm. The building is occupied between 8am and 5pm.
Fan Operation
The fans were set up to cycle on a call for heating in cooling during occupied hours in both units.
Unit Air Flow
The air flow rates for the units tested were measured as follows:
Unit Measured CFM
Normal CFM @ 400
CFM/ton
% of Normal Cooling Efficiency
Impact
AC-1 1,840 1,600 115.0% 0.0%
AC-2 1,495 1,600 93.4% -4.4%
Summary of Problems - Small HVAC Units – Appendix B
116
Supply Fan Power
The supply fan power for the units tested were measured as follows:
Unit Measured Watts
Normal Watts Fan Efficiency Impact
AC-1 870 584 -49%
AC-2 621 584 -6%
Refrigerant Charge
The results of the refrigerant charge tests are summarized below:
Unit Charge deviation Cooling Efficiency impact
AC-1 -9.57% -9.0%
AC-2 -9.57% -9.0%
Maintenance Condition
Units were in good condition.

Summary of Problems - Small HVAC Units – Appendix B
117
Site 211 - Sunsports
Sunsports is a single story 500,000 square foot building, consisting of conditioned office space and unconditioned storage space. Heating and cooling for the conditioned portion of the building is provided by three packaged rooftop units.
Testing Configuration
Diagnostic testing was performed on the following units at this site:
Unit Number Make Model Number Cooling Capacity (tons)
AC-1 Trane WCD090C400BC 7.5
AC-3 Carrier 50TJQ005 4
Summary of Problems - Small HVAC Units – Appendix B
118
Economizer Operation
Unit AC-1 was equipped with an economizer, which did not respond to the cold spray test. Unit AC-3 was not equipped with an economizer.
Fan Schedules
The building is occupied between 7 am and 10 pm Monday through Friday, and 8am to 1 pm on Saturday. The fans are set to run whenever there is a call for heating or cooling. The thermostat for unit AC-1 is set to comfort conditions from 6am to 10pm; the thermostat for unit AC-3 is set for comfort conditions from 6am to 6:30pm.
Fan Operation
The fans are set up to cycle on a call for heating or cooling.
Unit Air Flow
The air flow rates for the units tested were measured as follows:
Unit Measured CFM
Normal CFM @ 400
CFM/ton
% of Normal Cooling Efficiency
Impact
AC-1 2076 3000 -30.8% -11.9%
AC-3 1364 1600 -14.8% -7.1%
Supply Fan Power
The supply fan power for the units tested were measured as follows:
Unit Measured Watts
Normal Watts Fan efficiency impact
AC-1 742 1,095 32%
AC-3 704 584 -21%
Refrigerant Charge
The results of the refrigerant charge tests are summarized below:

Summary of Problems - Small HVAC Units – Appendix B
119
Unit Charge deviation Cooling Efficiency impact
AC-1 4.37% 0.1%
AC-2 -7.29% -6.8%
Maintenance Condition
Unit AC-1 had bent condenser fan blades and a missing wire on the control board. Maintenance access was poor due to materials blocking access to roof hatch ladder.
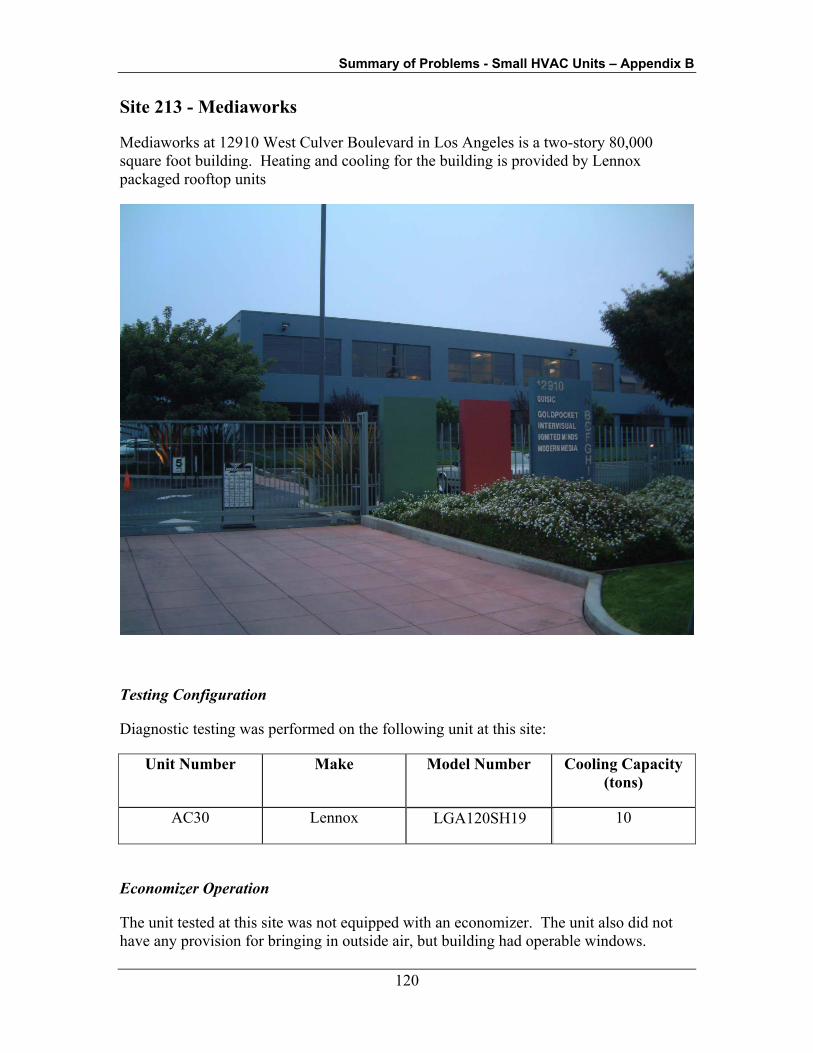
Summary of Problems - Small HVAC Units – Appendix B
120
Site 213 - Mediaworks
Mediaworks at 12910 West Culver Boulevard in Los Angeles is a two-story 80,000 square foot building. Heating and cooling for the building is provided by Lennox packaged rooftop units
Testing Configuration
Diagnostic testing was performed on the following unit at this site:
Unit Number Make Model Number Cooling Capacity (tons)
AC30 Lennox LGA120SH19
10
Economizer Operation
The unit tested at this site was not equipped with an economizer. The unit also did not have any provision for bringing in outside air, but building had operable windows.

Summary of Problems - Small HVAC Units – Appendix B
121
Fan Schedules
The fan schedule follows the occupancy schedule, which is 8am to 5pm M-F. The fans are schedule off during the unoccupied period
Fan Operation
Fans are set up to run continuously during the occupied period.
Unit Air Flow
The air flow rates for the unit tested were measured as follows:
Unit Measured CFM
Normal CFM @ 400
CFM/ton
% of Normal Cooling Efficiency
Impact
AC30 3,117 4,000 77.9% -9%
Supply Fan Power
The supply fan power for the units tested were measured as follows:
Unit Measured Watts
Watts per CFM
Fan Efficiency Impact
AC30 1,607 1,460 -10%
Refrigerant Charge
The results of the refrigerant charge tests are summarized below:
Unit Charge deviation Efficiency impact
AC30 12.2% -4.7%
Maintenance Condition
Units were in good condition. The duct system had balance problems, which were corrected by the occupants using bubble wrap to block air flow from several diffusers.
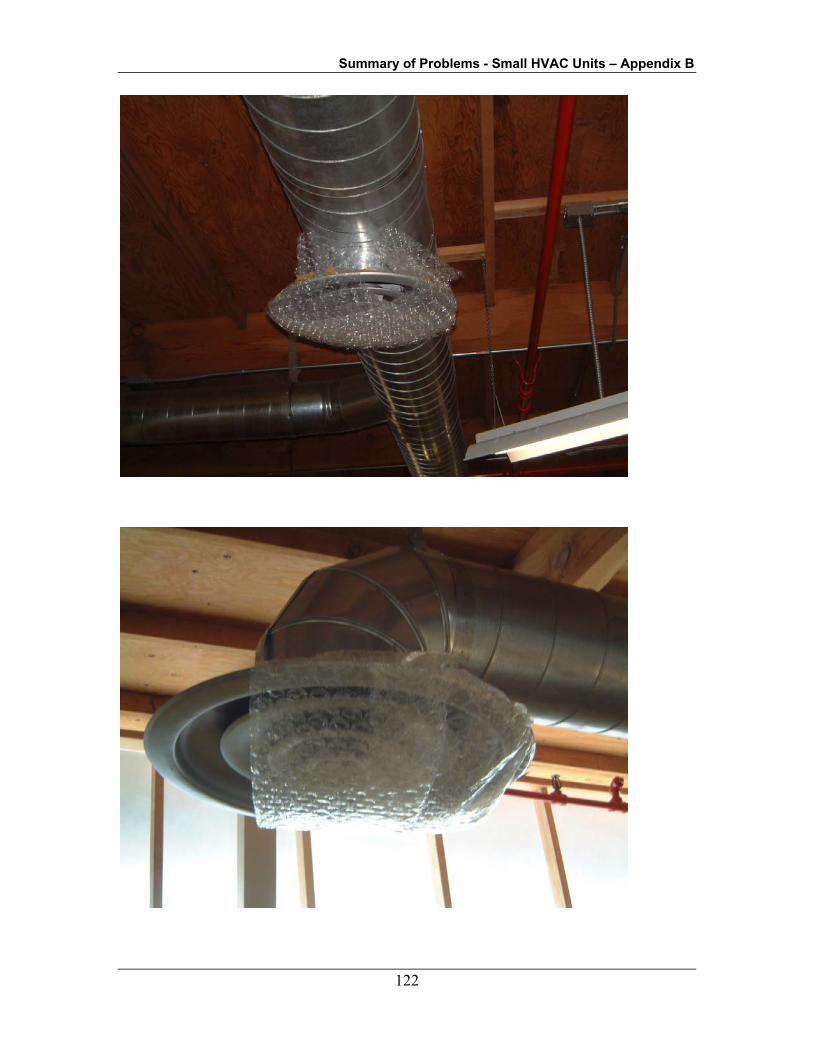
Summary of Problems - Small HVAC Units – Appendix B
122
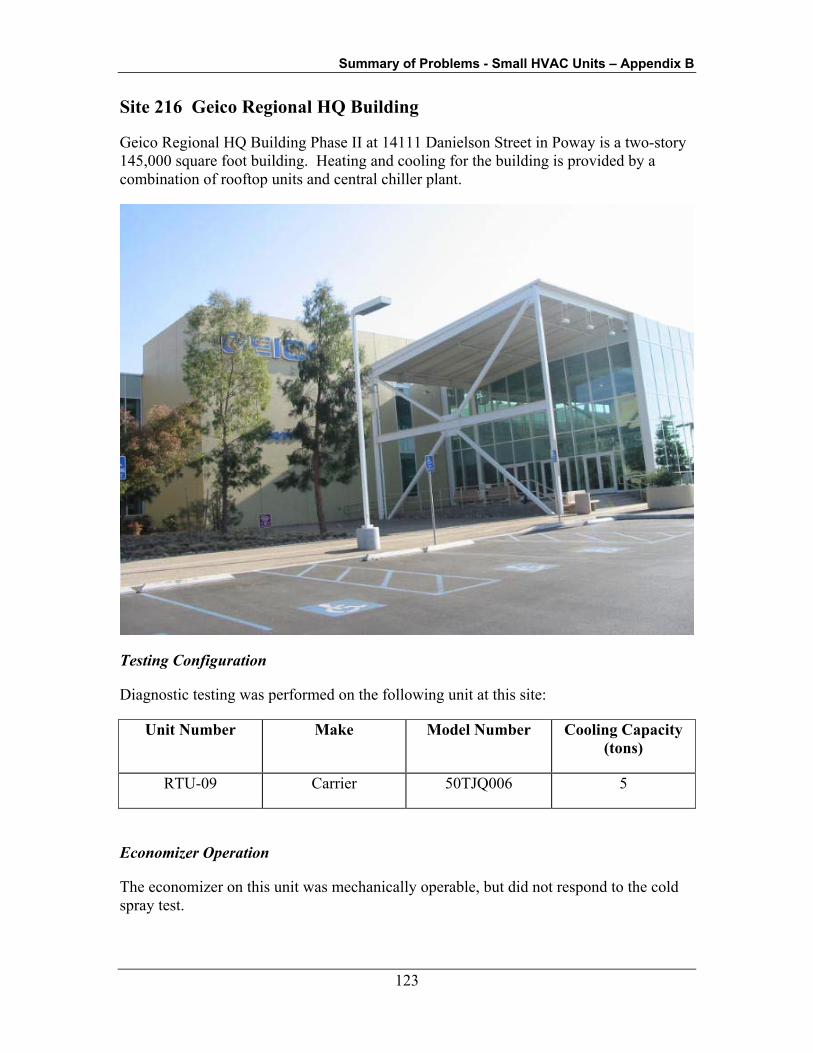
Summary of Problems - Small HVAC Units – Appendix B
123
Site 216 Geico Regional HQ Building
Geico Regional HQ Building Phase II at 14111 Danielson Street in Poway is a two-story 145,000 square foot building. Heating and cooling for the building is provided by a combination of rooftop units and central chiller plant.
Testing Configuration
Diagnostic testing was performed on the following unit at this site:
Unit Number Make Model Number Cooling Capacity (tons)
RTU-09 Carrier 50TJQ006 5
Economizer Operation
The economizer on this unit was mechanically operable, but did not respond to the cold spray test.
Summary of Problems - Small HVAC Units – Appendix B
124
Fan Schedules
The fans follow the occupancy schedule, which is 8am to 4:30pm.
Fan Operation
The fan is set up to cycle with a call for heating or cooling.
Unit Air Flow
The air flow rates for the units tested were measured as follows:
Unit Measured CFM
Normal CFM @ 400
CFM/ton
% of Normal Cooling Efficiency
Impact
RTU-09 1,437 2,000 71.9% -10.9%
Supply Fan Power
The supply fan power for the units tested were measured as follows:
Unit Measured Watts
Normal Watts Fan Efficiency Impact
RTU-09 670 730 8%
Refrigerant Charge
The results of the refrigerant charge tests are summarized below:
Unit Charge deviation Cooling Efficiency Impact
RTU-09 -4.69% -4.7%
Maintenance Condition
The unit was in average condition, indicating adequate maintenance.

Summary of Problems - Small HVAC Units – Appendix B
125
Site 245 - Staples
Staples at 44620 Valley Central Way in Lancaster is a single story 24,000 square foot building. Heating and cooling for the building is provided by nine packaged rooftop units.
Testing Configuration
Diagnostic testing was performed on the following units at this site:
Unit Number Make Model Number Cooling Capacity (tons)
AC12 Carrier 48DJD008530 7.5
AC-1 Carrier 48LJE006520 5
ETM-7 Carrier 48DJB012530 10

Summary of Problems - Small HVAC Units – Appendix B
126
Economizer Operation
Two of the three units tested had economizers, but one was disconnected.
Fan Schedules
Units are controlled by Novar EMS, which controls fans according to occupancy schedule. Occupancy schedule is Mon-Sat 9am - 9pm, Sun 9am - 7 pm.
Fan Operation
EMS controls fans to operate continuously during occupied periods.
Unit Air Flow
The air flow rates for the units tested were measured as follows:
Unit Measured CFM
Normal CFM @ 400
CFM/ton
% of Normal Cooling Efficiency
Impact
AC12 2,565 3,000 85.5% -7.1%
Supply Fan Power
The supply fan power for the units tested were measured as follows:
Unit Measured Watts
Watts per CFM
Fan Efficiency Impact
AC12 1,448 1,095 -32%
Refrigerant Charge
The results of the refrigerant charge tests are summarized below:
Unit Charge deviation Cooling Efficiency Impact
AC-12 Major leak – no measurements possible N/A

Summary of Problems - Small HVAC Units – Appendix B
127
Maintenance Condition
All units had very dirty filters. Economizers were disconnected in two of three units examined. Unit AC-12 had a major refrigerant leak.

Summary of Problems - Small HVAC Units – Appendix B
128
Site 259 - Albertson's
The Albertson's at 232 Dyer St. in Union City is a single story 65,000 square foot building. Heating and cooling for the building is provided by two 3 ton and one 5 ton Trane packaged rooftop units along with air handlers served by refrigeration racks.
Testing Configuration
Diagnostic testing was performed on the following units at this site:
Unit Number Make Model Number Cooling Capacity (tons)
RTU-1 Trane YCD060C4LC13F 5
RTU-2 Trane YCD036C4LGBE 3
RTU-3 Trane YCD036C4LGBE 3
Economizer Operation
All three units were equipped with economizers. One unit had stuck linkage; the others responded appropriately.
Fan Schedules
All fans controlled by central office through store EMS.
Fan Operation
Fans were set to operate continuously during occupied periods.
Unit Air Flow
The air flow rates for the units tested were measured as follows:
Unit Measured CFM
Normal CFM @ 400
CFM/ton
% of Normal Cooling Efficiency
Impact
RTU-1 1,702 2,000 85.1% -7.2%
RTU-2 820 1,200 68.3% -12.2%

Summary of Problems - Small HVAC Units – Appendix B
129
Unit Measured CFM
Normal CFM @ 400
CFM/ton
% of Normal Cooling Efficiency
Impact
RTU-3 960 1,200 80.0% -8.4%
Supply Fan Power
The supply fan power for the units tested were measured as follows:
Unit Measured Watts
Normal Watts Fan Efficiency Impact
RTU-1 1,008 730 -38%
RTU-2 325 438 26%
RTU-3 293 438 33%
Refrigerant Charge
The results of the refrigerant charge tests are summarized below:
Unit Charge deviation Cooling Efficiency impact
RTU-1 Charge OK No Impact
RTU-2 Charge OK No Impact
RTU-3 Charge OK No Impact
Maintenance Condition
Filters were dirty during site visit. Units appeared to be in average condition.

Summary of Problems - Small HVAC Units – Appendix B
130
Site 261 - North Canyon Business Center
The North Canyon Business Center at 3025-3095 Independence Drive in Livermore is a single story, multi building complex totaling 100,000 square foot. Heating and cooling for the building examined is provided by five 10 ton and one 7.5 ton Byrant packaged rooftop units.
Testing Configuration
Diagnostic testing was performed on the following units at this site:
Unit Number Make Model Number Cooling Capacity (tons)
AC-1 Bryant 580DEU120180ACAA 10
AC-2 Bryant 580DEV120180ACAA 10
Summary of Problems - Small HVAC Units – Appendix B
131
Economizer Operation
Both units tested were equipped with economizers. Unit AC-1 had operable linkage but did not respond to the cold spray test. Unit AC-2 had inoperable linkage.
Fan Schedules
Thermostats are set up to operate fans from 6am to 8pm, 7 days per week. Building is unoccupied.
Fan Operation
Fans are set up to run continuously during the occupied period.
Unit Air Flow
The air flow rates for the units tested were measured as follows:
Unit Measured CFM
Normal CFM @ 400
CFM/ton
% of Normal Cooling Efficiency
Impact
AC-1 3,611 4,000 90.3% -5.7%
AC-2 3,310 4,000 82.8% -7.8%
Refrigerant Charge
The results of the refrigerant charge tests are summarized below:
Unit Charge deviation Cooling Efficiency Impact
AC-2 Charge OK No impact
Maintenance Condition
Units were observed to be in average condition. Insulation was loose on filter access panel of AC-1.
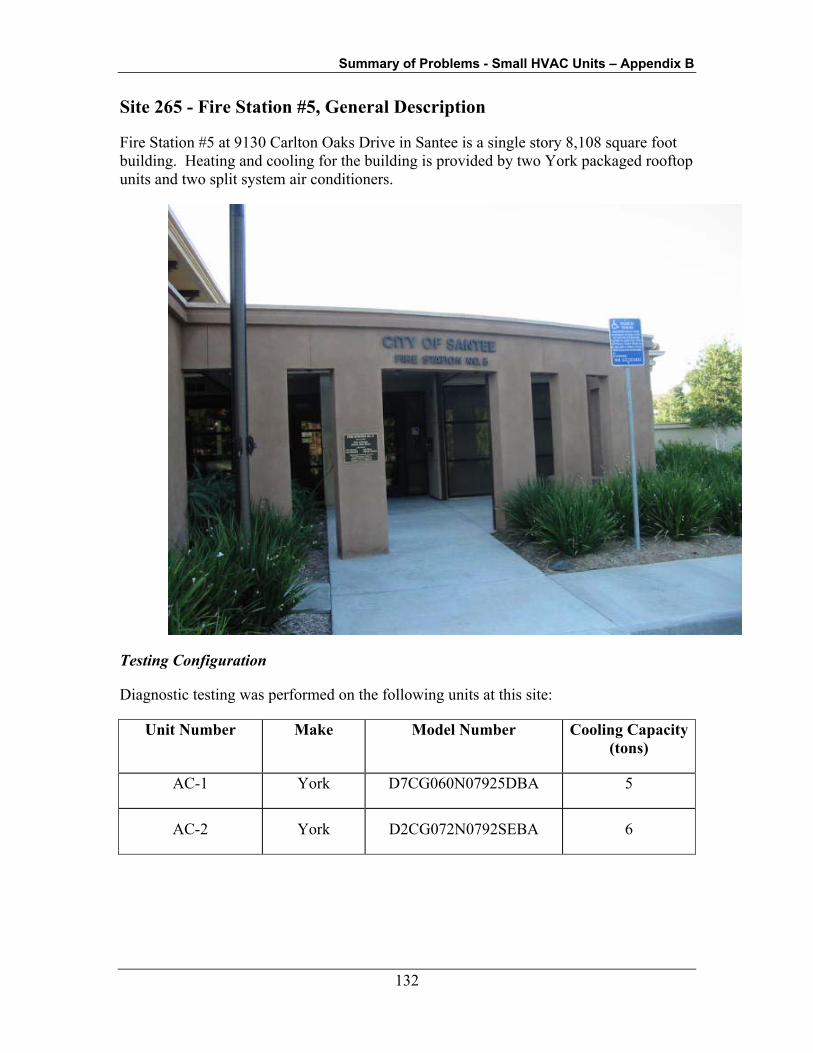
Summary of Problems - Small HVAC Units – Appendix B
132
Site 265 - Fire Station #5, General Description
Fire Station #5 at 9130 Carlton Oaks Drive in Santee is a single story 8,108 square foot building. Heating and cooling for the building is provided by two York packaged rooftop units and two split system air conditioners.
Testing Configuration
Diagnostic testing was performed on the following units at this site:
Unit Number Make Model Number Cooling Capacity (tons)
AC-1 York D7CG060N07925DBA 5
AC-2 York D2CG072N0792SEBA 6
Summary of Problems - Small HVAC Units – Appendix B
133
Economizer Operation
Both units tested were equipped with economizers. The economizer on unit AC-2 failed the cold spray test.
Fan Schedules
The units tested serve the sleeping and living areas of the fire station, which are occupied 24 hrs/day; 7 days/week. The fans are scheduled on at all times.
Fan Operation
The fans in both units are set up to cycle on and off with a call for heating or cooling.
Unit Air Flow
The air flow rates for the units tested were measured as follows:
Unit Measured CFM
Normal CFM @ 400
CFM/ton
% of Normal Cooling Efficiency
Impact
AC-1 1,626 2,000 81.3% -8.1%
AC-2 1,173 2,400 48.9% -22.0%
Supply Fan Power
The supply fan power for the units tested were measured as follows:
Unit Measured Watts
Normal Watts Fan Efficiency Impact
AC-1 910 730 -25%
AC-2 510 876 42%
Refrigerant Charge
The results of the refrigerant charge tests are summarized below:
Summary of Problems - Small HVAC Units – Appendix B
134
Unit Charge deviation Cooling Efficiency Impact
AC-1 Charge OK No Impact
AC-2 Charge OK No Impact
Maintenance Condition
Units were observed to be in good condition.

Summary of Problems - Small HVAC Units – Appendix B
135
Site 268 - True Hope of God in Christ Church
The True Hope of God in Christ Church at 950 Gilman Avenue in San Francisco is a single story 15,500 square foot building. Heating and cooling for the building is provided by five packaged rooftop units.
Testing Configuration
Diagnostic testing was performed on the following units at this site:
Unit Number Make Model Number Cooling Capacity (tons)
AC-1 Trane YCD06DC3LOBT 5
RTU-2 Carrier 48TJF008 7.5
Economizer Operation
Both units tested were equipped with economizers. The economizer on unit RTU-2 was functioning, the economizer on unit AC-1 functioned mechanically but failed the cold spray test.
Fan Schedules
The thermostat was set to provide comfort conditions at all times; no temperature setback or fan scheduling was implemented.
Fan Operation
The fans were set to cycle on a call for heating or cooling
Unit Air Flow
The air flow rates for the units tested were measured as follows:
Unit Measured CFM
Normal CFM @ 400
CFM/ton
% of Normal Cooling Efficiency
Impact
AC-1 1,870 2,000 93.5% -4.4%
RTU-2 1,650 3,000 55.0% -18.8%

Summary of Problems - Small HVAC Units – Appendix B
136
Supply Fan Power
The supply fan power for the units tested were measured as follows:
Unit Measured Watts
Normal Watts Fan Efficiency Impact
AC-1 732 730 0%
RTU-2 1,513 1,095 -38%
Refrigerant Charge
The results of the refrigerant charge tests are summarized below:
Unit Charge deviation Cooling Efficiency Impact
AC-1 0.0 0.0
RTU-2 -1.3% -2.5%
Maintenance Condition
Units were observed to be in average condition
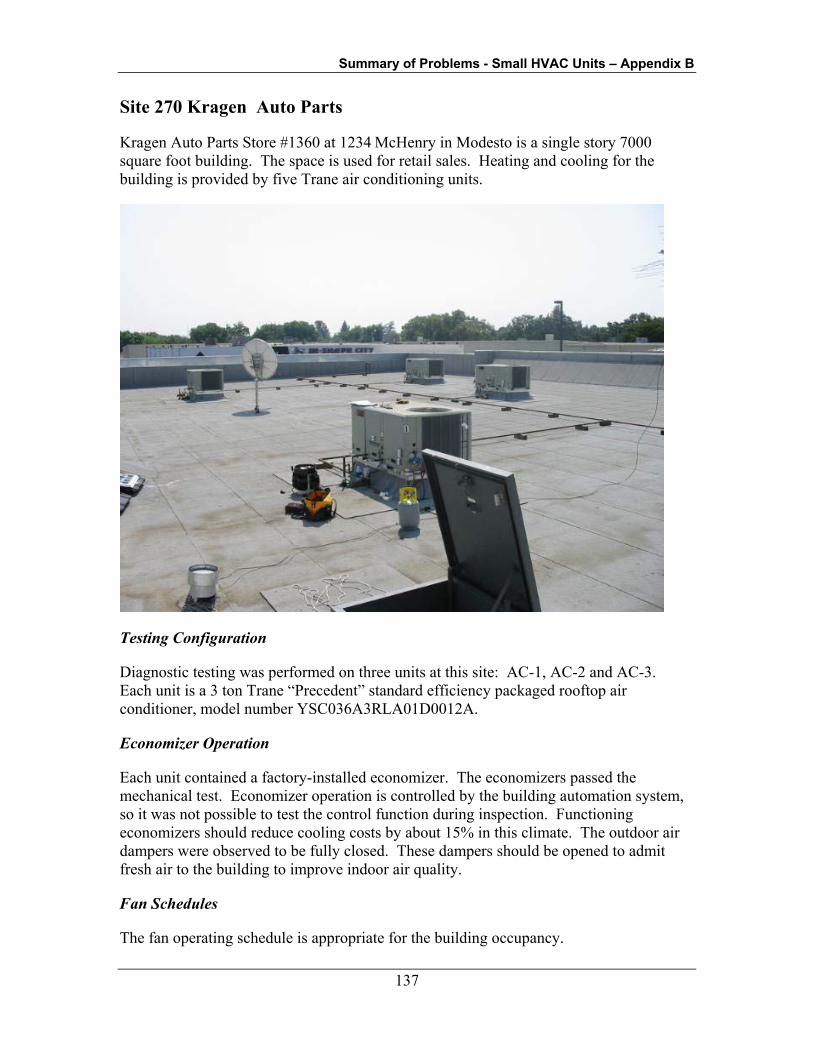
Summary of Problems - Small HVAC Units – Appendix B
137
Site 270 Kragen Auto Parts
Kragen Auto Parts Store #1360 at 1234 McHenry in Modesto is a single story 7000 square foot building. The space is used for retail sales. Heating and cooling for the building is provided by five Trane air conditioning units.
Testing Configuration
Diagnostic testing was performed on three units at this site: AC-1, AC-2 and AC-3. Each unit is a 3 ton Trane “Precedent” standard efficiency packaged rooftop air conditioner, model number YSC036A3RLA01D0012A.
Economizer Operation
Each unit contained a factory-installed economizer. The economizers passed the mechanical test. Economizer operation is controlled by the building automation system, so it was not possible to test the control function during inspection. Functioning economizers should reduce cooling costs by about 15% in this climate. The outdoor air dampers were observed to be fully closed. These dampers should be opened to admit fresh air to the building to improve indoor air quality.
Fan Schedules
The fan operating schedule is appropriate for the building occupancy.

Summary of Problems - Small HVAC Units – Appendix B
138
Fan Operation
The fans are set up to cycle on a call for heating or cooling, and do not provide continuous air circulation to the building during occupied hours. This controls strategy, coupled with a lack of outside air at the rooftop unit can adversely affect indoor air quality.
Unit Air Flow
The air flow rates for the units tested were measured as follows:
Unit Measured CFM Normal CFM (@ 400 CFM/ton)
% of Normal
AC-1 1445 1200 120.4%
AC-2 1360 1200 113.3%
AC-3 1350 1200 112.5%
According to the test results, the units have sufficient air flow. Air flow rates exceeding 400 CFM/ton result in a slight increase in unit efficiency.
Supply Fan Power
The supply fan power for the units tested were measured as follows:
Unit Measured Watts
Normal Watts Fan Efficiency Impact
AC-1 273 438 38%
AC-2 346 438 21%
AC-3 435 438 1%
The units use less fan power than industry standards, indicating efficient fans and minimal pressure drop through the unit and the duct system.
Refrigerant Charge
The results of the refrigerant charge tests are summarized below:
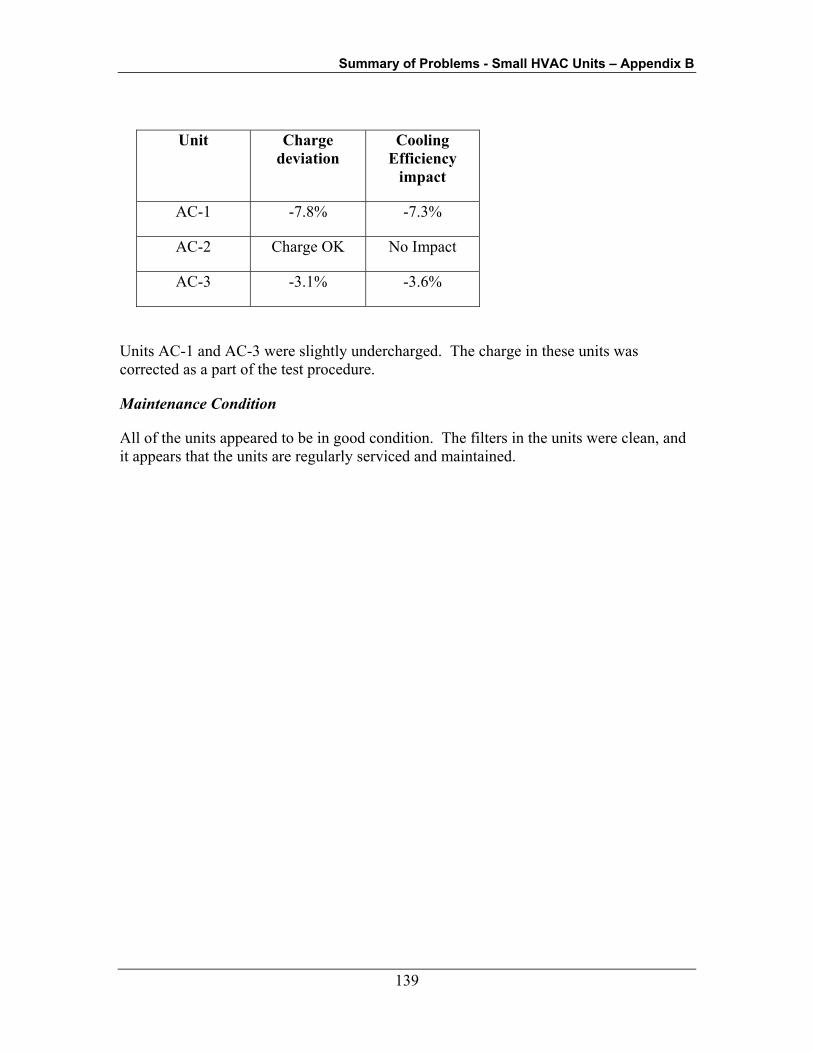
Summary of Problems - Small HVAC Units – Appendix B
139
Unit Charge deviation
Cooling Efficiency
impact
AC-1 -7.8% -7.3%
AC-2 Charge OK No Impact
AC-3 -3.1% -3.6%
Units AC-1 and AC-3 were slightly undercharged. The charge in these units was corrected as a part of the test procedure.
Maintenance Condition
All of the units appeared to be in good condition. The filters in the units were clean, and it appears that the units are regularly serviced and maintained.

Summary of Problems - Small HVAC Units – Appendix B
140
Site 273 - Playground Design
Playground Design at 1210 Keystone Way in Vista is a single story 29,595 square foot building. Heating and cooling for the building is provided by Trane packaged rooftop units
Testing Configuration
Diagnostic testing was performed on the following units at this site:
Unit Number Make Model Number Cooling Capacity (tons)
A/C South Trane WCCO48F400BF 4
N1 Trane WC0048F400BF 4
Economizer Operation
The units tested at this site were not equipped with economizers.
Fan Schedules
The fans were not scheduled at this site, and run whenever there is a call for heating or cooling. The thermostats were programmed to provide comfort conditions at all times without a setback schedule.
Fan Operation
The fans in both units cycled on and off with a call for heating or cooling.
Unit Air Flow
The air flow rates for the units tested were measured as follows:
Unit Measured CFM
Normal CFM @ 400
CFM/ton
% of Normal Cooling Efficiency
Impact
A/C South 1,330 1,600 83.1% -7.7%
N1 1,390 1,600 86.9% -6.7%
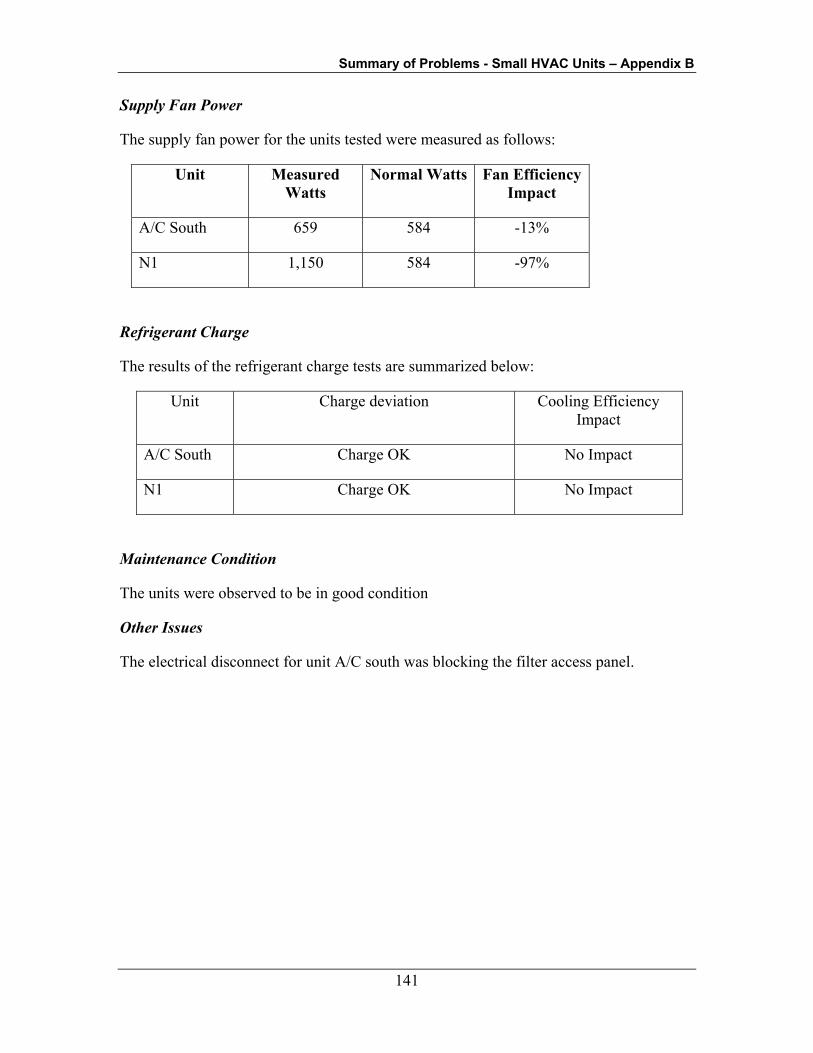
Summary of Problems - Small HVAC Units – Appendix B
141
Supply Fan Power
The supply fan power for the units tested were measured as follows:
Unit Measured Watts
Normal Watts Fan Efficiency Impact
A/C South 659 584 -13%
N1 1,150 584 -97%
Refrigerant Charge
The results of the refrigerant charge tests are summarized below:
Unit Charge deviation Cooling Efficiency Impact
A/C South Charge OK No Impact
N1 Charge OK No Impact
Maintenance Condition
The units were observed to be in good condition
Other Issues
The electrical disconnect for unit A/C south was blocking the filter access panel.
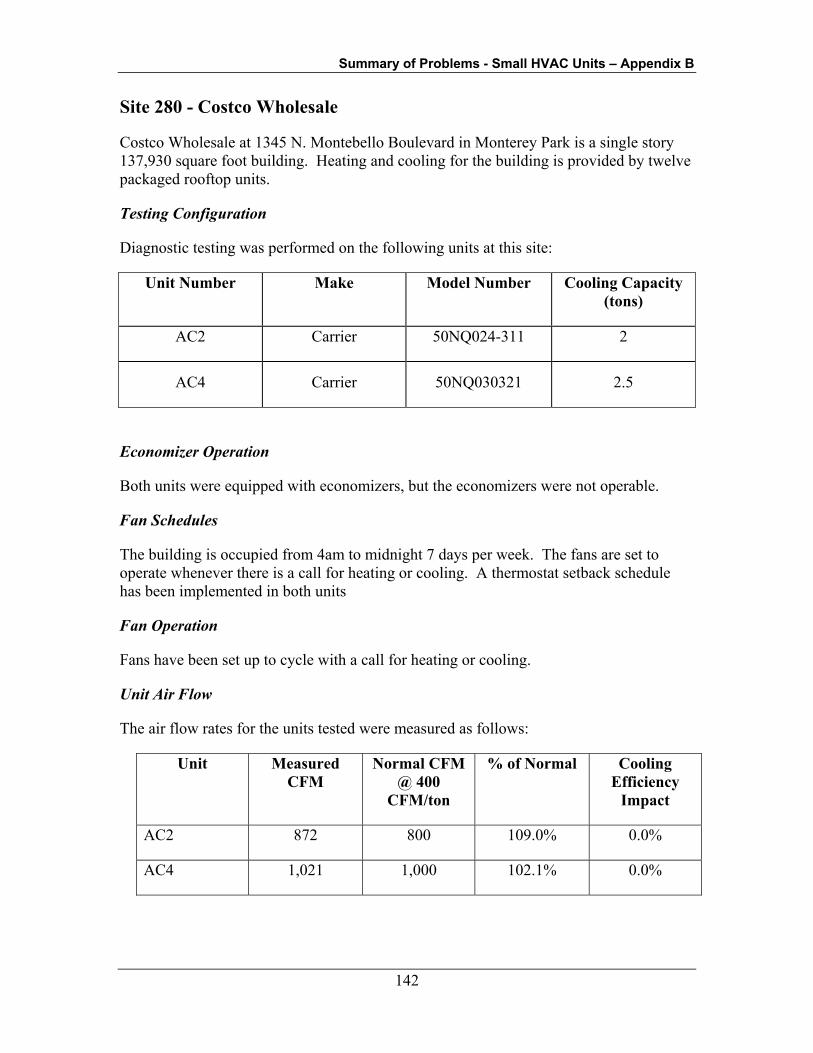
Summary of Problems - Small HVAC Units – Appendix B
142
Site 280 - Costco Wholesale
Costco Wholesale at 1345 N. Montebello Boulevard in Monterey Park is a single story 137,930 square foot building. Heating and cooling for the building is provided by twelve packaged rooftop units.
Testing Configuration
Diagnostic testing was performed on the following units at this site:
Unit Number Make Model Number Cooling Capacity (tons)
AC2 Carrier 50NQ024-311 2
AC4 Carrier 50NQ030321 2.5
Economizer Operation
Both units were equipped with economizers, but the economizers were not operable.
Fan Schedules
The building is occupied from 4am to midnight 7 days per week. The fans are set to operate whenever there is a call for heating or cooling. A thermostat setback schedule has been implemented in both units
Fan Operation
Fans have been set up to cycle with a call for heating or cooling.
Unit Air Flow
The air flow rates for the units tested were measured as follows:
Unit Measured CFM
Normal CFM @ 400
CFM/ton
% of Normal Cooling Efficiency
Impact
AC2 872 800 109.0% 0.0%
AC4 1,021 1,000 102.1% 0.0%

Summary of Problems - Small HVAC Units – Appendix B
143
Supply Fan Power
The supply fan power for the units tested were measured as follows:
Unit Measured Watts
Normal watts Fan Efficiency Impact
AC2 353 292 -21%
AC4 396 365 -8%
Refrigerant Charge
The results of the refrigerant charge tests are summarized below:
Unit Charge deviation Cooling Efficiency impact
AC2 -7.46% -7.0%
AC4 -7.29% -6.8%
Maintenance Condition
The units were observed to be in average condition. The filters were dirty and needed to be changed.

Summary of Problems - Small HVAC Units – Appendix B
144
Site 283 - Regenesis
Regenesis at 1011 Calle Sombre in San Clemente is a two-story 23,000 square foot building, consisting of conditioned office and unconditioned work and storage space. Heating and cooling for the building is provided by four Carrier packaged rooftop heat pumps.
Testing Configuration
Diagnostic testing was performed on the following units at this site:
Unit Number Make Model Number Cooling Capacity (tons)
AC-1.1 Carrier 50TJQ005 4
AC-1.2 Carrier 50TJQ004 3
AC-1.6 Carrier 50TJQ006 5
Economizer Operation
None of the units tested at this site were equipped with economizers.
Fan Schedules
The fans are scheduled to be on during the occupied period, which is nominally 8 am to 5 pm. Fan schedules vary by unit, but generally start between 6:30am and 7am, and shut down between 5pm and 6:30pm.
Fan Operation
The fans are set up to run continuously during occupied hours and shut off during unoccupied hours.
Unit Air Flow
The air flow rates for the units tested were measured as follows:
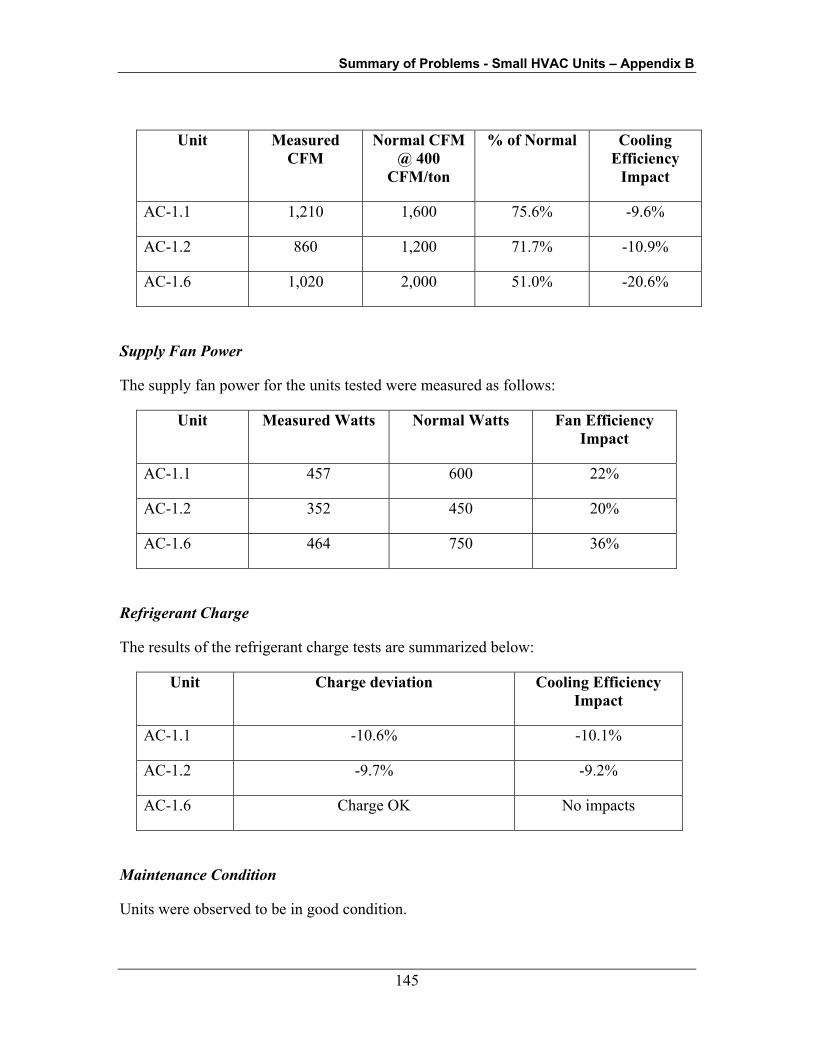
Summary of Problems - Small HVAC Units – Appendix B
145
Unit Measured CFM
Normal CFM @ 400
CFM/ton
% of Normal Cooling Efficiency
Impact
AC-1.1 1,210 1,600 75.6% -9.6%
AC-1.2 860 1,200 71.7% -10.9%
AC-1.6 1,020 2,000 51.0% -20.6%
Supply Fan Power
The supply fan power for the units tested were measured as follows:
Unit Measured Watts Normal Watts Fan Efficiency Impact
AC-1.1 457 600 22%
AC-1.2 352 450 20%
AC-1.6 464 750 36%
Refrigerant Charge
The results of the refrigerant charge tests are summarized below:
Unit Charge deviation Cooling Efficiency Impact
AC-1.1 -10.6% -10.1%
AC-1.2 -9.7% -9.2%
AC-1.6 Charge OK No impacts
Maintenance Condition
Units were observed to be in good condition.

Summary of Problems - Small HVAC Units – Appendix B
146
Site 314 - St. Maximilian Kolbe Catholic Church
St. Maximilian Kolbe Catholic Church at 5801 Kanan Road in Thousand Oaks is a single story 64,260 square foot building. Heating and cooling for the building is provided by several large Carrier packaged rooftop air conditioners. One small system of 3.5 tons serves an electrical equipment room.
Testing Configuration
Diagnostic testing was performed on the following unit at this site:
Unit Number Make Model Number Cooling Capacity (tons)
AC-7 Carrier 50SX-042-601-AA 3.5
Economizer Operation
The unit tested was not equipped with an economizer

Summary of Problems - Small HVAC Units – Appendix B
147
Fan Schedules
Fan is scheduled on 24/7, consistent with use of space.
Fan Operation
Fan cycles with call for cooling, which is appropriate for an unoccupied electrical equipment room.
Unit Air Flow
The air flow rate for the unit tested was measured as follows:
Unit Measured CFM
Normal CFM @ 400
CFM/ton
% of Normal Cooling Efficiency
Impact
AC-7 790 1,400 56.4% -18.0%
Supply Fan Power
The supply fan power for the units tested were measured as follows:
Unit Measured Watts
Normal Watts Fan Efficiency Impact
AC-7 417 511 18%
Refrigerant Charge
The results of the refrigerant charge tests are summarized below:
Unit Charge deviation Cooling Efficiency impact
AC-7 Charge OK No impact
Maintenance Condition
The unit was observed to be in good condition.

Summary of Problems - Small HVAC Units – Appendix B
148
Site 317 - Soka University Maintenance Building
The Soka University Maintenance Building in Aliso Viejo is a single story 18,000 square foot building. Heating and cooling for the building is provided by a single 12.5 ton Trane packaged rooftop units serving 3000 square feet and several split system air conditioners. Approximately 9,000 square feet is unconditioned.
Testing Configuration
Diagnostic testing was performed on the following unit at this site:
Unit Number Make Model Number Cooling Capacity (tons)
AC1 Trane WCH1508400EA 12.5
Economizer Operation
The economizer in the unit tested was not functional.
Fan Schedules
The space is occupied 7am to 5pm Monday – Friday. The fans are scheduled to operate from 8am to 8pm Monday-Friday.
Fan Operation
The fans are set up to cycle with a call for heating and cooling during the occupied hours.
Unit Air Flow
The air flow rates for the units tested were measured as follows:
Unit Measured CFM
Normal CFM @ 400
CFM/ton
% of Normal Cooling Efficiency
impact
AC1 3,632 5,000 72.6% -10.6%
Supply Fan Power
The supply fan power for the unit tested was measured as follows:

Summary of Problems - Small HVAC Units – Appendix B
149
Unit Measured Watts
Normal Watts Fan Efficiency Impact
AC1 1,667 1,825 9%
Refrigerant Charge
The results of the refrigerant charge test is summarized below:
Unit Charge deviation Cooling Efficiency impact
AC-1 Charge OK No Impact
Maintenance Condition
The unit was observed to be in good condition.

Summary of Problems - Small HVAC Units – Appendix B
150
Site 325 - Valencia Commerce Center Building B
The Valencia Commerce Center Building B at 28305 Livingston Ave. in Valencia is a single story 6,000 square foot building, consisting of conditioned office and unconditioned warehouse space. Heating and cooling for the building is provided by four Carrier packaged rooftop units.
Testing Configuration
Diagnostic testing was performed on the following unit at this site:
Unit Number Make Model Number Cooling Capacity (tons)
RTU-1 Carrier 5DTJQ006-601GA 5
Economizer Operation
The unit tested was not equipped with an economizer.
Fan Schedules
All units in building are controlled by a Honeywell XBS EMS. The fans are scheduled to follow the building occupancy schedule, which is 7am - 10:30pm Monday-Friday.
Fan Operation
Fans are controlled by the Honeywell XBS EMS. The fans run continuously during occupied hours.
Unit Air Flow
The air flow rates for the units tested were measured as follows:
Unit Measured CFM
Normal CFM @ 400
CFM/ton
% of Normal Cooling Efficiency
Impact
RTU-1 1,480 2,000 74.0% -10.1%
Supply Fan Power
The supply fan power for the unit tested was measured as follows:
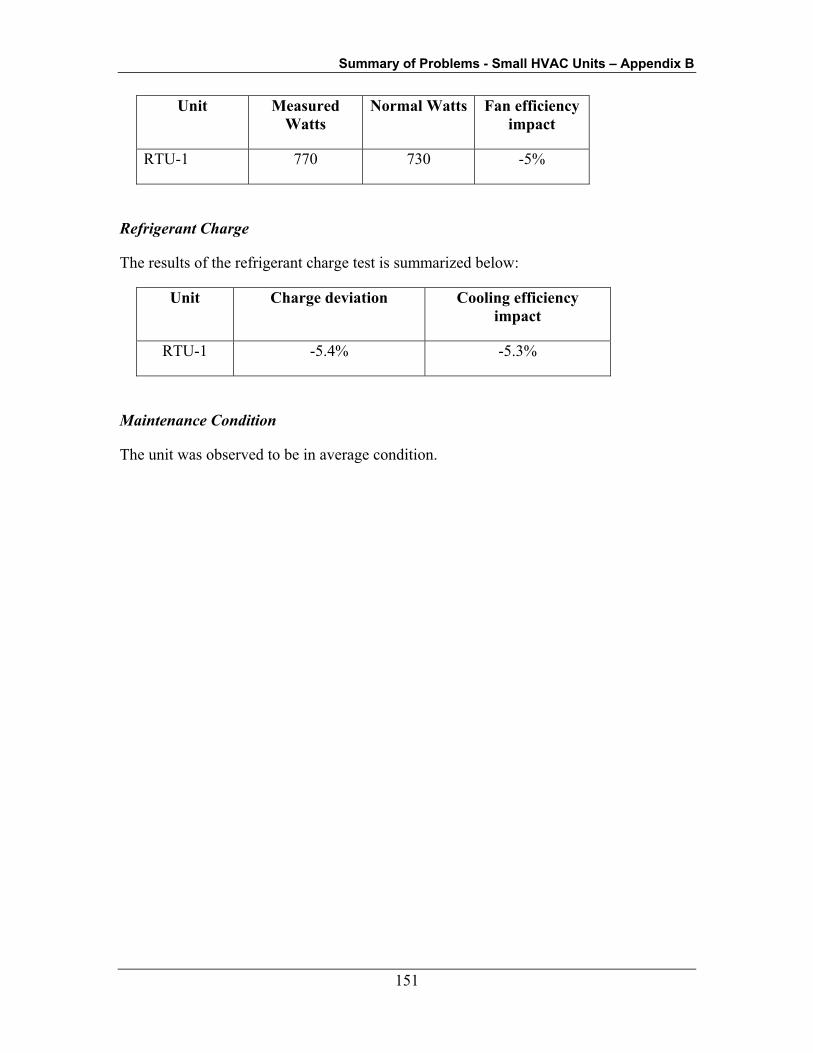
Summary of Problems - Small HVAC Units – Appendix B
151
Unit Measured Watts
Normal Watts Fan efficiency impact
RTU-1 770 730 -5%
Refrigerant Charge
The results of the refrigerant charge test is summarized below:
Unit Charge deviation Cooling efficiency impact
RTU-1 -5.4% -5.3%
Maintenance Condition
The unit was observed to be in average condition.
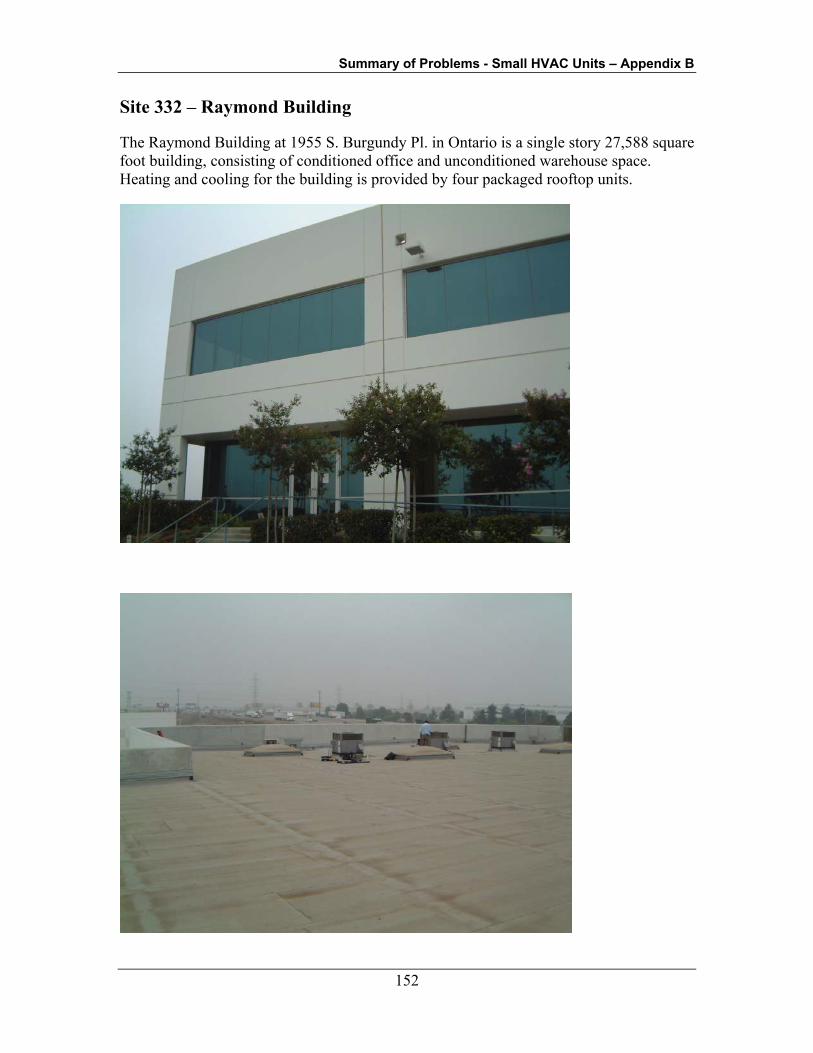
Summary of Problems - Small HVAC Units – Appendix B
152
Site 332 – Raymond Building
The Raymond Building at 1955 S. Burgundy Pl. in Ontario is a single story 27,588 square foot building, consisting of conditioned office and unconditioned warehouse space. Heating and cooling for the building is provided by four packaged rooftop units.

Summary of Problems - Small HVAC Units – Appendix B
153
Testing Configuration
Diagnostic testing was performed on the following units at this site:
Unit Number Make Model Number Cooling Capacity (tons)
E-2 Carrier 50JS-036-601 3
East 1 Carrier 50JS-036-601 3
Economizer Operation
None of the units tested at this site had economizers.
Fan Schedules
The fan schedule follows the building occupancy, which is 6am to 6pm, Monday-Friday.
Fan Operation
The fans are set up to run continuously during occupied hours.
Unit Air Flow
The air flow rates for the units tested were measured as follows:
Unit Measured CFM
Normal CFM @ 400
CFM/ton
% of Normal Cooling Efficiency
Impact
E-2 960 1,200 80.0% -8.4%
East 1 950 1,200 79.2% -8.6%
Supply Fan Power
The supply fan power for the units tested were measured as follows:

Summary of Problems - Small HVAC Units – Appendix B
154
Unit Measured Watts
Normal watts Fan efficiency impact
E-2 613 438 -40%
East 1 601 438 -37%
Refrigerant Charge
The results of the refrigerant charge tests are summarized below:
Unit Charge deviation Cooling Efficiency impact
E-2 -1.75% -2.7%
East 1 Charge OK No impact
Maintenance Condition
The units were observed to be in average condition.
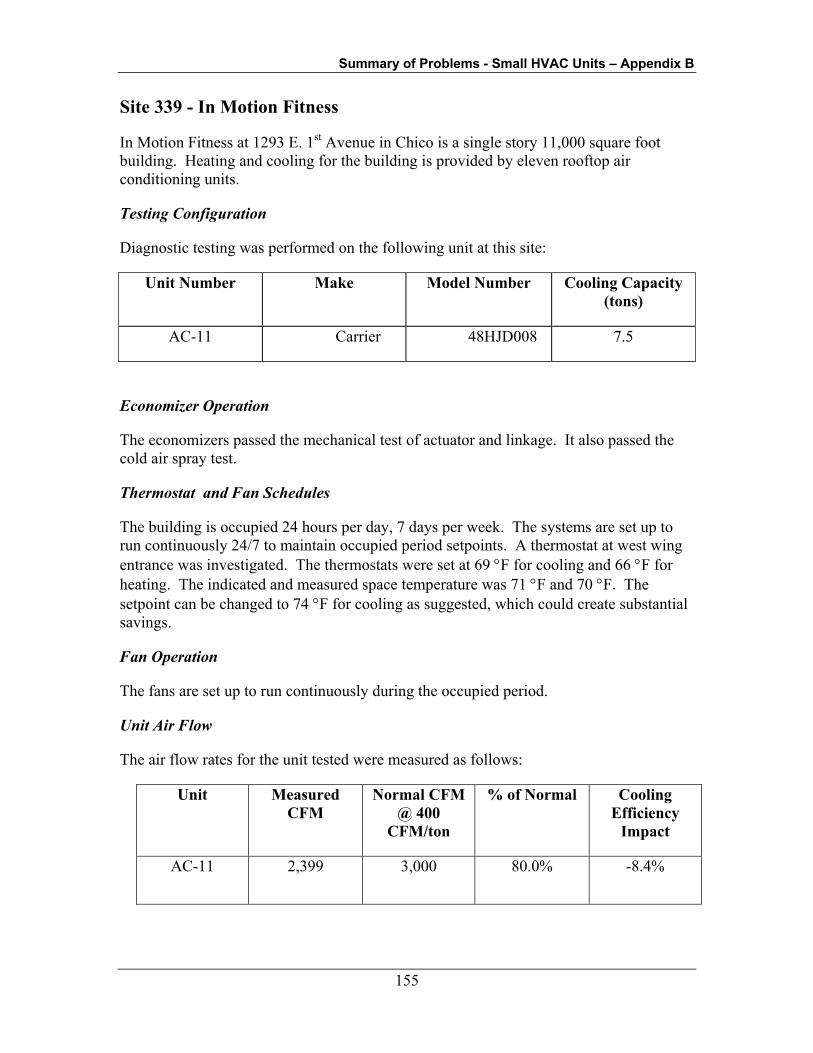
Summary of Problems - Small HVAC Units – Appendix B
155
Site 339 - In Motion Fitness
In Motion Fitness at 1293 E. 1st Avenue in Chico is a single story 11,000 square foot building. Heating and cooling for the building is provided by eleven rooftop air conditioning units.
Testing Configuration
Diagnostic testing was performed on the following unit at this site:
Unit Number Make Model Number Cooling Capacity (tons)
AC-11 Carrier 48HJD008 7.5
Economizer Operation
The economizers passed the mechanical test of actuator and linkage. It also passed the cold air spray test.
Thermostat and Fan Schedules
The building is occupied 24 hours per day, 7 days per week. The systems are set up to run continuously 24/7 to maintain occupied period setpoints. A thermostat at west wing entrance was investigated. The thermostats were set at 69 °F for cooling and 66 °F for heating. The indicated and measured space temperature was 71 °F and 70 °F. The setpoint can be changed to 74 °F for cooling as suggested, which could create substantial savings.
Fan Operation
The fans are set up to run continuously during the occupied period.
Unit Air Flow
The air flow rates for the unit tested were measured as follows:
Unit Measured CFM
Normal CFM @ 400
CFM/ton
% of Normal Cooling Efficiency
Impact
AC-11 2,399 3,000 80.0% -8.4%
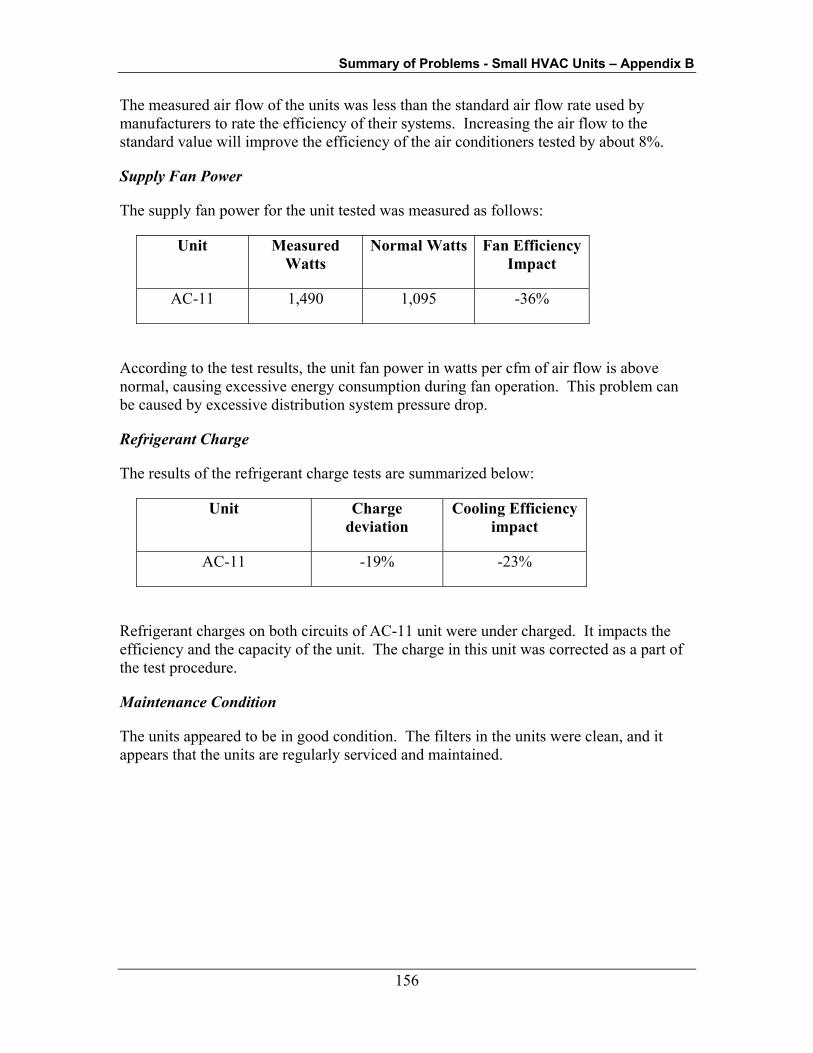
Summary of Problems - Small HVAC Units – Appendix B
156
The measured air flow of the units was less than the standard air flow rate used by manufacturers to rate the efficiency of their systems. Increasing the air flow to the standard value will improve the efficiency of the air conditioners tested by about 8%.
Supply Fan Power
The supply fan power for the unit tested was measured as follows:
Unit Measured Watts
Normal Watts Fan Efficiency Impact
AC-11 1,490 1,095 -36%
According to the test results, the unit fan power in watts per cfm of air flow is above normal, causing excessive energy consumption during fan operation. This problem can be caused by excessive distribution system pressure drop.
Refrigerant Charge
The results of the refrigerant charge tests are summarized below:
Unit Charge deviation
Cooling Efficiency impact
AC-11 -19% -23%
Refrigerant charges on both circuits of AC-11 unit were under charged. It impacts the efficiency and the capacity of the unit. The charge in this unit was corrected as a part of the test procedure.
Maintenance Condition
The units appeared to be in good condition. The filters in the units were clean, and it appears that the units are regularly serviced and maintained.
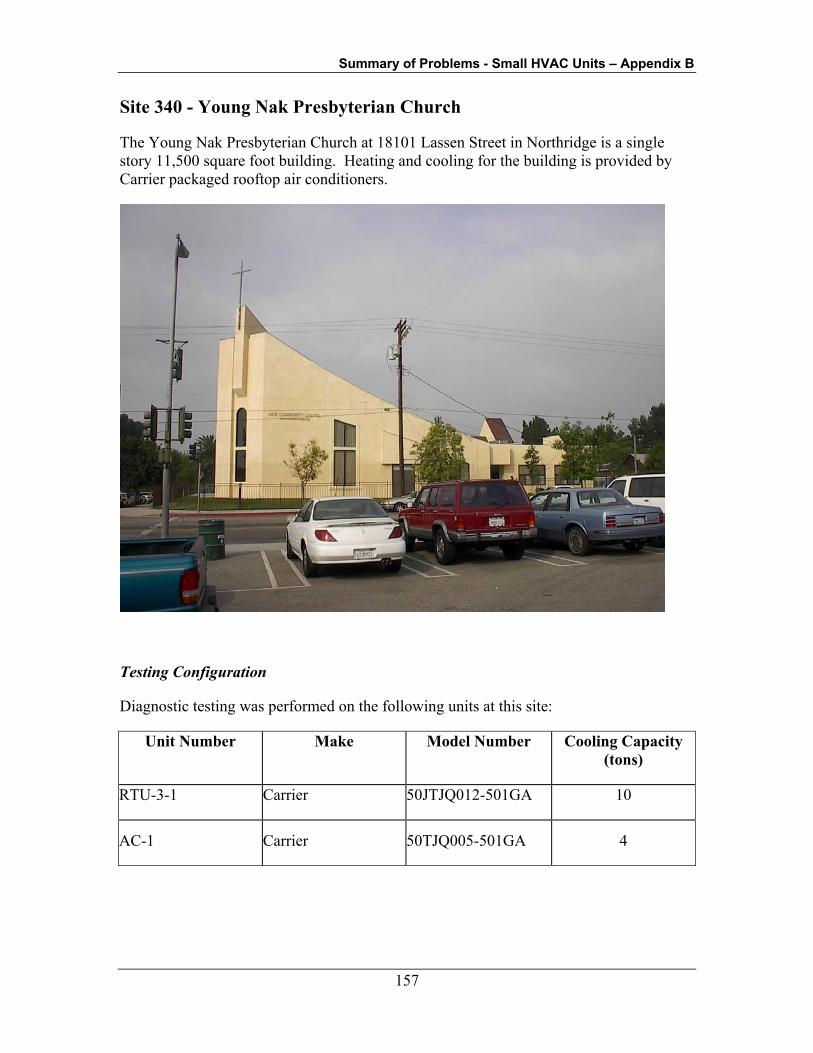
Summary of Problems - Small HVAC Units – Appendix B
157
Site 340 - Young Nak Presbyterian Church
The Young Nak Presbyterian Church at 18101 Lassen Street in Northridge is a single story 11,500 square foot building. Heating and cooling for the building is provided by Carrier packaged rooftop air conditioners.
Testing Configuration
Diagnostic testing was performed on the following units at this site:
Unit Number Make Model Number Cooling Capacity (tons)
RTU-3-1 Carrier 50JTJQ012-501GA 10
AC-1 Carrier 50TJQ005-501GA 4

Summary of Problems - Small HVAC Units – Appendix B
158
Economizer Operation
Two rooftops, AC-1 and RTU-3-1, were investigated. AC-1 does not have an economizer. The economizer of RTU-3-1 was stuck at wide open.
Thermostat and Fan Schedules
Building occupancy for office area is Monday to Friday from 8:00 to 16:00. The sanctuary is occupied on Sunday from 8:00 to 14:00. Five thermostats were investigated. The cooling was set between 70 to 72 °F and the heating was set between 60 to 70 °F. However, the occupants can override the thermostat. One of the thermostat at the sanctuary area was set at 64 °F for cooling. The measured space temperature was at 67 °F. The occupants might have set the space temperature very low to cool the space down very rapidly, however, the savings could be substantial if the thermostats are set appropriately. The suggested thermostat setting is 74-76 °F for cooling and 70°F for heating.
Fan Operation
The systems are set up to cycle to maintain occupied period setpoints, and schedule the systems off during unoccupied periods.
Unit Air Flow
The air flow rates for the units tested were measured as follows:
Unit Measured CFM
Normal CFM @ 400
CFM/ton
% of Normal
Cooling Efficiency
Impact
RTU-3-1 3,760 4,000 94.0% -4.1%
AC-1 1,300 1,600 81.3% -8.1%
Both unit has low airflow. Low air flow can cause reduced cooling capacity, reduced unit efficiency, and coil icing during humid weather. The correct airflow would improve the efficiency of the unit by 4% to 8%.
Supply Fan Power
The supply fan power for the units tested were measured as follows:
Summary of Problems - Small HVAC Units – Appendix B
159
Unit Measured Watts
Normal Watts
Fan Efficiency Impact
RTU-3-1 1,920 1,460 -32%
AC-1 516 584 12%
According to the test results, the unit fan power for RTU-13 is above normal, causing excessive energy consumption during fan operation. This problem can be caused by excessive distribution system pressure drop.
Refrigerant Charge
The results of the refrigerant charge tests are summarized below:
Unit Charge deviation Cooling Efficiency impact
RTU-3-1 -5.9% -5.6%
AC-1 -10.64% -10.1%
Refrigerant charges on both rooftop units were under charged. It impacts the efficiency and the capacity of the unit. The charges in these units were corrected as a part of the test procedure.
Maintenance Condition
All of the units appeared to be in good condition. However, the filters in the units were very dirty. It appears that the units are not regularly serviced and maintained. The regular maintenance and service would improve the performance for the units and a healthy building.
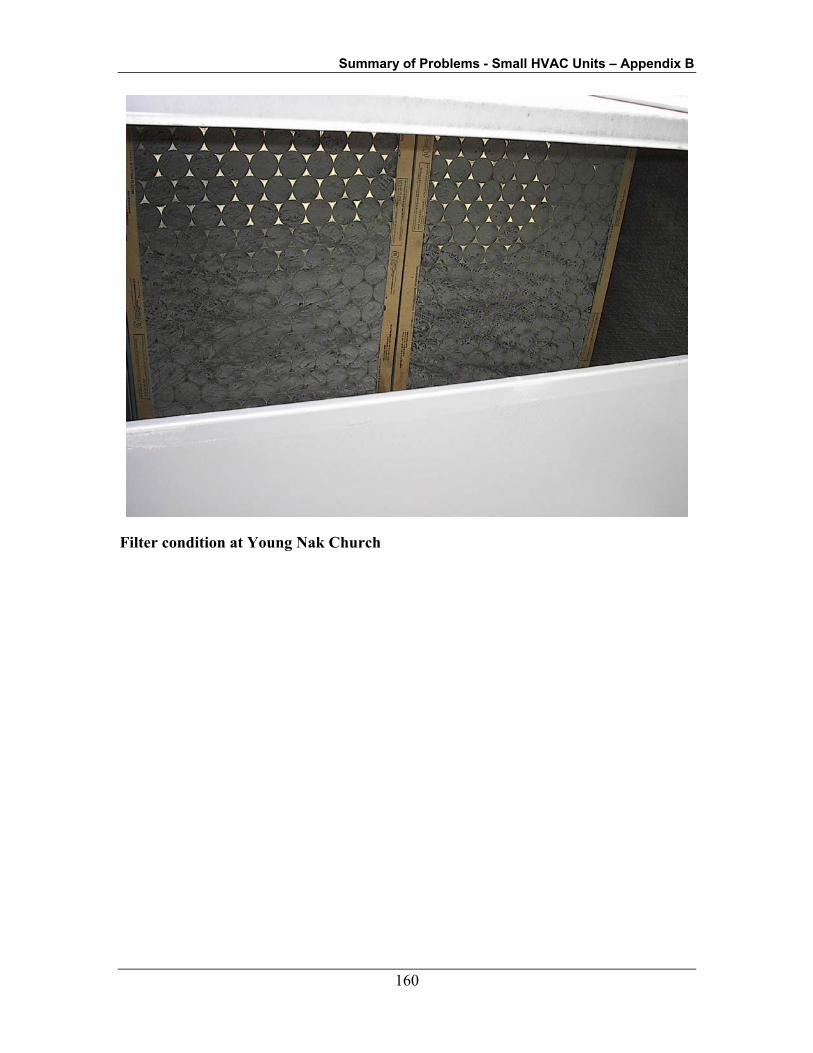
Summary of Problems - Small HVAC Units – Appendix B
160
Filter condition at Young Nak Church

Summary of Problems - Small HVAC Units – Appendix B
161
Site 343 – Target
Target at 1871 N. Main Street in Walnut Creek is a single story 139,000 square foot building. Heating and cooling for the building is provided by AAON packaged rooftop units.
Testing Configuration
Diagnostic testing was performed on the following units at this site:
Unit Number Make Model Number Cooling Capacity (tons)
RTU-1 Aaon RK063E0222 6
RTU-5 Aaon RR08-3-PO-212 8
Economizer Operation
The economizers passed the mechanical test of actuator and linkage. It also passed the cold air spray test.
Fan Schedules
Building occupancy is from 8 am to 10 pm everyday. Thermostats were set at 72/82 °F for cooling during occupied and unoccupied period, and 70/60 °F for heating during occupied and unoccupied period. The systems are set up to maintain occupied period setpoints for occupied periods; and schedule the systems off during unoccupied periods.
Fan Operation
Approximately 50% of the units cycle fan with load, the other half of the units have fans that run at all times during occupied hours.
Unit Air Flow
The air flow rates for the units tested were measured as follows:
Unit Measured CFM
Normal CFM @ 400
CFM/ton
% of Normal Cooling Efficiency
Impact
RTU-1 2,403 2,400 100.1% 0.0%
RTU-5 3,991 3,200 124.7% 0.0%
Summary of Problems - Small HVAC Units – Appendix B
162
Both systems have adequate airflow. No adjustment was needed.
Supply Fan Power
The supply fan power for the units tested were measured as follows:
Unit Measured Watts
Normal Watts Fan efficiency Impact
RTU-1 1,640 876 -87%
RTU-5 1,280 1,168 -10%
According to the test results, the unit fan power of RTU-1 is above normal, causing excessive energy consumption during fan operation. This problem can be caused by excessive distribution system pressure drop.
Refrigerant Charge
The results of the refrigerant charge tests are summarized below:
Unit Charge deviation Cooling Efficiency impact
RTU-1 Charge OK No Impact
RTU-5 Charge OK No Impact
Both RTU-1 and RTU-2 were adequately charged. All rooftops at this site were scheduled to be checked on refrigerant charge twice a year (fall/spring).
Maintenance Condition
All of the units appeared to be in good condition. The filters in the units were clean, and it appears that the units are regularly serviced and maintained.

Summary of Problems - Small HVAC Units – Appendix B
163
Site 347 - Greybar Electric
Greybar Electric at 383 Cheryl Lane in City of Industry is a two-story 278,380 square foot building consisting of conditioned offices and unconditioned warehouse space. Heating and cooling for the offices is provided by Trane packaged rooftop units.
Testing Configuration
Diagnostic testing was performed on the following unit at this site:
Unit Number Make Model Number Cooling Capacity (tons)
RTU-4 Trane YFD075C4LCBE 6.25
Economizer Operation
The tested unit has no economizer.

Summary of Problems - Small HVAC Units – Appendix B
164
Thermostat and Fan Schedules
Building occupancy is from 6 am to 5 pm Monday to Friday. Thermostats were set at 72 to 75 °F on cooling. However, the measured room temperature was between 71 to 73 °F. From three thermal comfort surveys, all occupants indicated that the space was too cold. Therefore, the thermostat could be set at a higher temperature. It would create better comfort and energy savings.
Fan Operation
The systems are set up to maintain occupied period setpoints for occupied periods; and schedule the systems off during unoccupied periods.
Unit Air Flow
The air flow rates for the units tested were measured as follows:
Unit Measured CFM
Normal CFM @ 400
CFM/ton
% of Normal Efficiency Impact
RTU-4 2,590 2,500 103.6% 0.0%
According to the test results, the unit has sufficient air flow. Air flow rates exceeding 400 CFM/ton result in a slight increase in unit efficiency.
Refrigerant Charge
The results of the refrigerant charge test is summarized below:
Unit Charge deviation Efficiency impact
RTU-4 Charge OK No impact
The unit was properly charge. No adjustment was made.
Maintenance Condition
The unit appeared to be in average condition. It appears that the unit is regularly serviced and maintained.
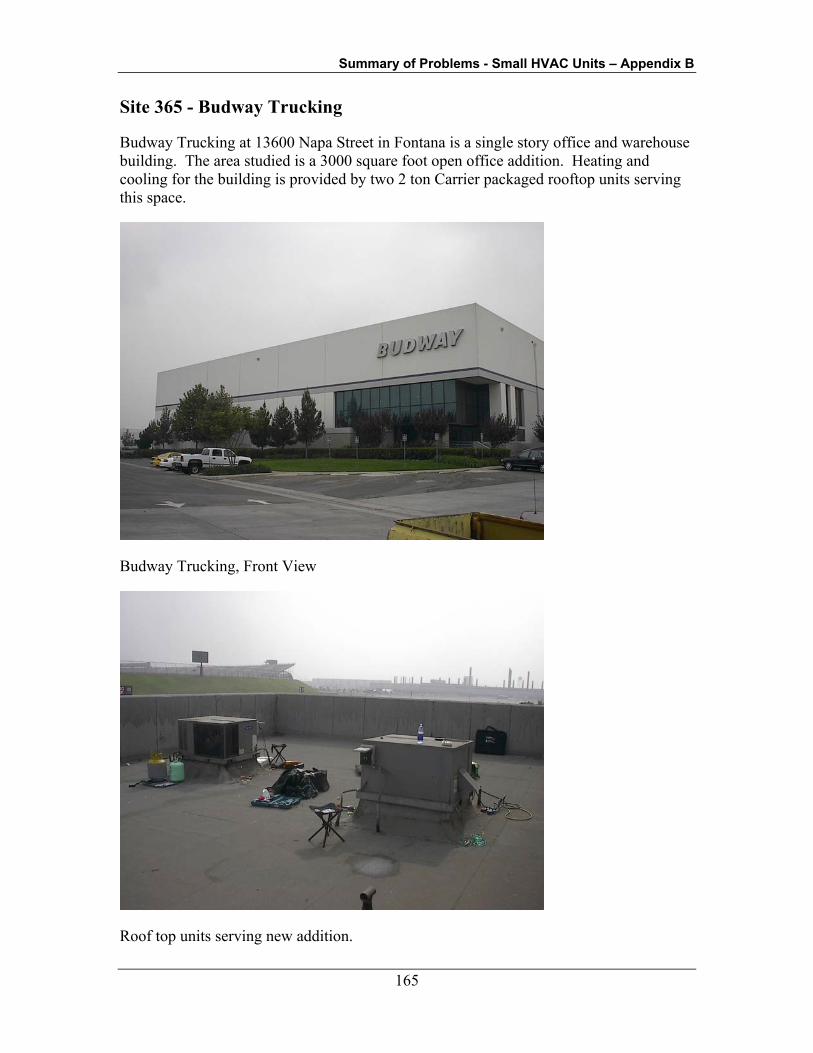
Summary of Problems - Small HVAC Units – Appendix B
165
Site 365 - Budway Trucking
Budway Trucking at 13600 Napa Street in Fontana is a single story office and warehouse building. The area studied is a 3000 square foot open office addition. Heating and cooling for the building is provided by two 2 ton Carrier packaged rooftop units serving this space.
Budway Trucking, Front View
Roof top units serving new addition.

Summary of Problems - Small HVAC Units – Appendix B
166
Testing Configuration
Diagnostic testing was performed on the following units at this site:
Unit Number Make Model Number Cooling Capacity (tons)
Unit 1 Carrier 50HS-024031146 2
Unit 2 Carrier 50HS-0240311AB 2
Economizer Operation
None of the units studied were equipped with economizers.
Fan Schedules
The fans follow the space occupancy schedule, which is 6am – midnight, Monday-Friday.
Fan Operation
The fans are set up to operate continuously during the occupied period.
Unit Air Flow
The air flow rates for the units tested were measured as follows:
Unit Measured CFM
Normal CFM @ 400
CFM/ton
% of Normal Cooling Efficiency Impacts
Unit 1 935 800 116.9% 0.0%
Unit 2 690 800 86.3% -6.9%
Supply Fan Power
The supply fan power for the units tested were measured as follows:
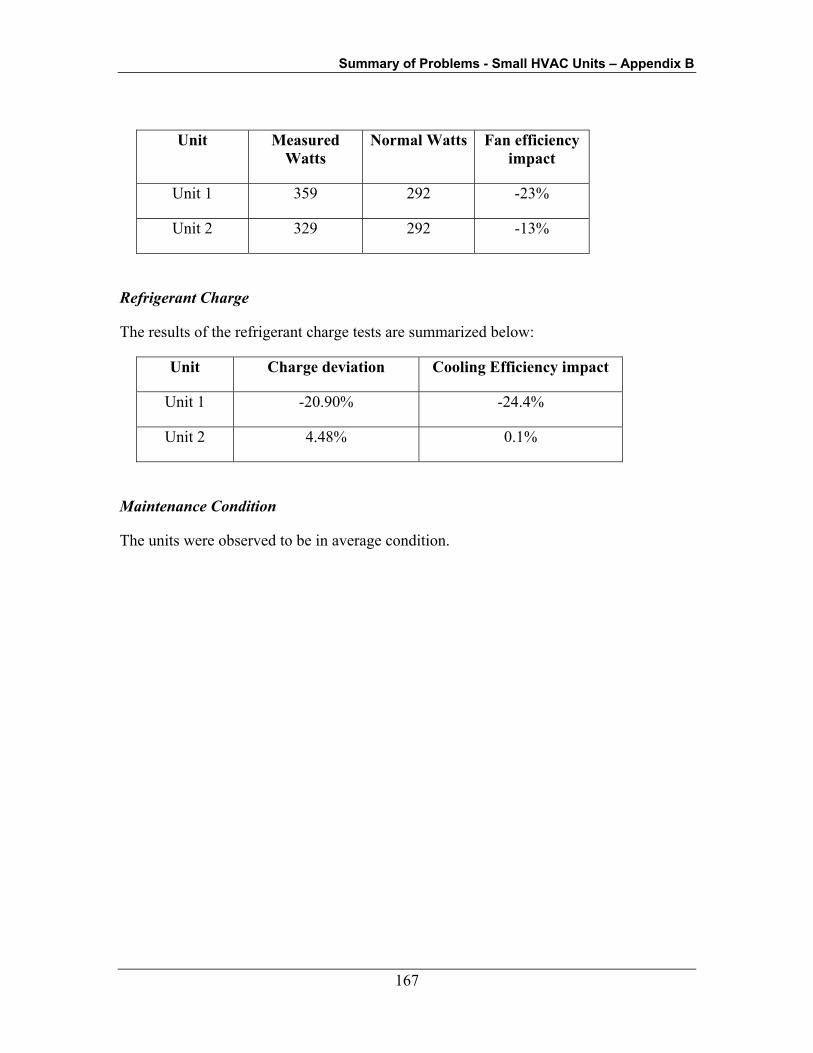
Summary of Problems - Small HVAC Units – Appendix B
167
Unit Measured Watts
Normal Watts Fan efficiency impact
Unit 1 359 292 -23%
Unit 2 329 292 -13%
Refrigerant Charge
The results of the refrigerant charge tests are summarized below:
Unit Charge deviation Cooling Efficiency impact
Unit 1 -20.90% -24.4%
Unit 2 4.48% 0.1%
Maintenance Condition
The units were observed to be in average condition.

Summary of Problems - Small HVAC Units – Appendix B
168
Site 376 - Home Depot
Home Depot at 9700 Lower Azusa Road in El Monte is a single story 130,000 square foot building. Heating and cooling for the building is provided by unit ventilators and three roof top air conditioning units
Testing Configuration
Diagnostic testing was performed on the following units at this site:
Unit Number Make Model Number Cooling Capacity (tons)
AC-2 Carrier 48HJE004---631 3
RTU-3 Carrier 48HJD006---631 5
Economizer Operation
For the AC-2, the economizer was responding to the cold spray. However, the linkage is not tightly connected so when motor moves, the outside air damper does not move. For RTU-3, the economizer passed the actuator and cold spray tests.
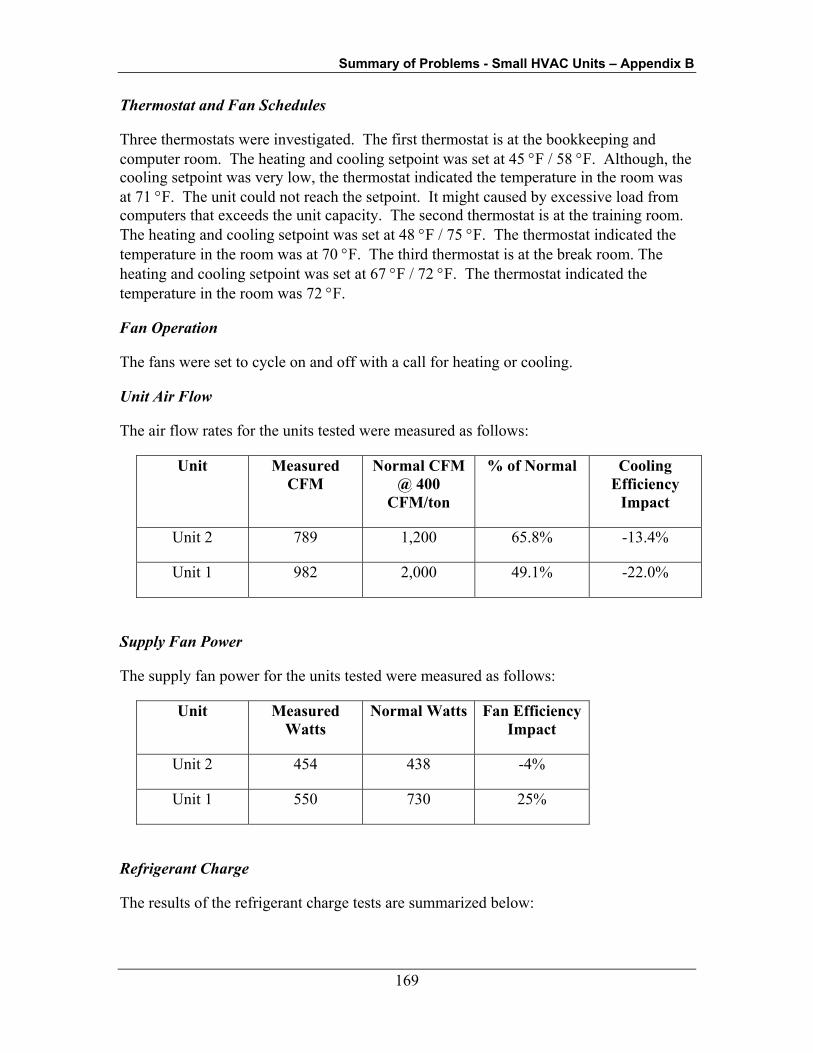
Summary of Problems - Small HVAC Units – Appendix B
169
Thermostat and Fan Schedules
Three thermostats were investigated. The first thermostat is at the bookkeeping and computer room. The heating and cooling setpoint was set at 45 °F / 58 °F. Although, the cooling setpoint was very low, the thermostat indicated the temperature in the room was at 71 °F. The unit could not reach the setpoint. It might caused by excessive load from computers that exceeds the unit capacity. The second thermostat is at the training room. The heating and cooling setpoint was set at 48 °F / 75 °F. The thermostat indicated the temperature in the room was at 70 °F. The third thermostat is at the break room. The heating and cooling setpoint was set at 67 °F / 72 °F. The thermostat indicated the temperature in the room was 72 °F.
Fan Operation
The fans were set to cycle on and off with a call for heating or cooling.
Unit Air Flow
The air flow rates for the units tested were measured as follows:
Unit Measured CFM
Normal CFM @ 400
CFM/ton
% of Normal Cooling Efficiency
Impact
Unit 2 789 1,200 65.8% -13.4%
Unit 1 982 2,000 49.1% -22.0%
Supply Fan Power
The supply fan power for the units tested were measured as follows:
Unit Measured Watts
Normal Watts Fan Efficiency Impact
Unit 2 454 438 -4%
Unit 1 550 730 25%
Refrigerant Charge
The results of the refrigerant charge tests are summarized below:
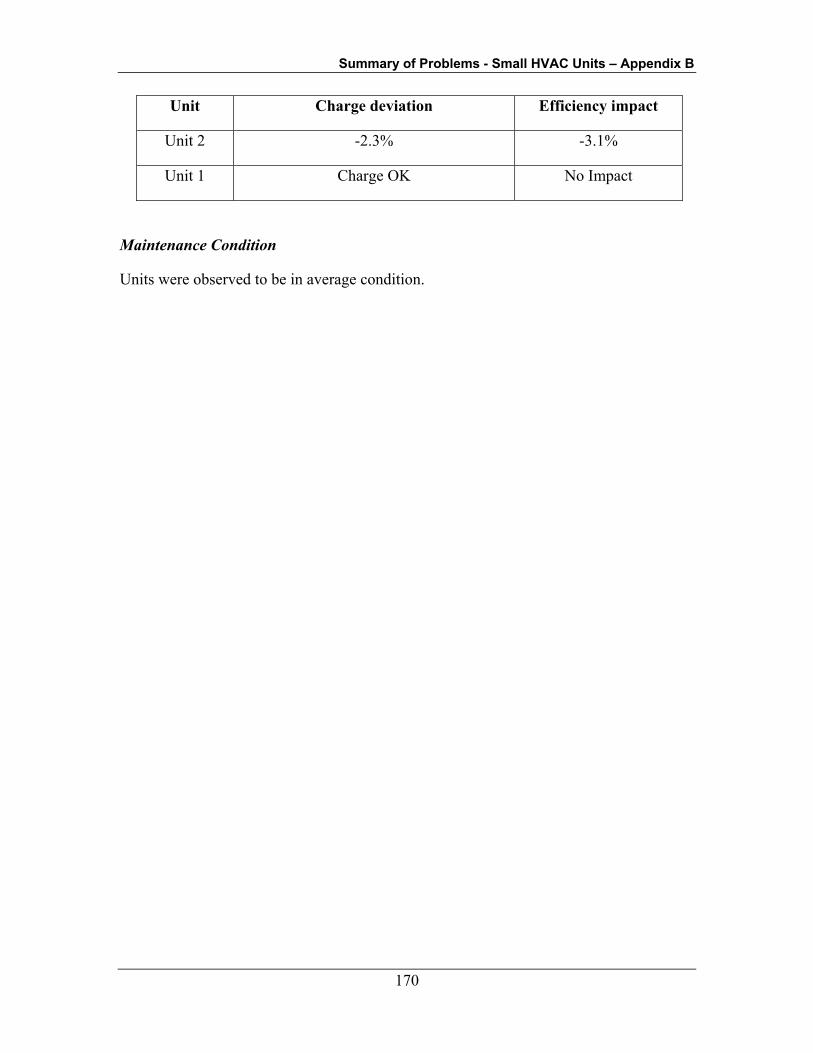
Summary of Problems - Small HVAC Units – Appendix B
170
Unit Charge deviation Efficiency impact
Unit 2 -2.3% -3.1%
Unit 1 Charge OK No Impact
Maintenance Condition
Units were observed to be in average condition.
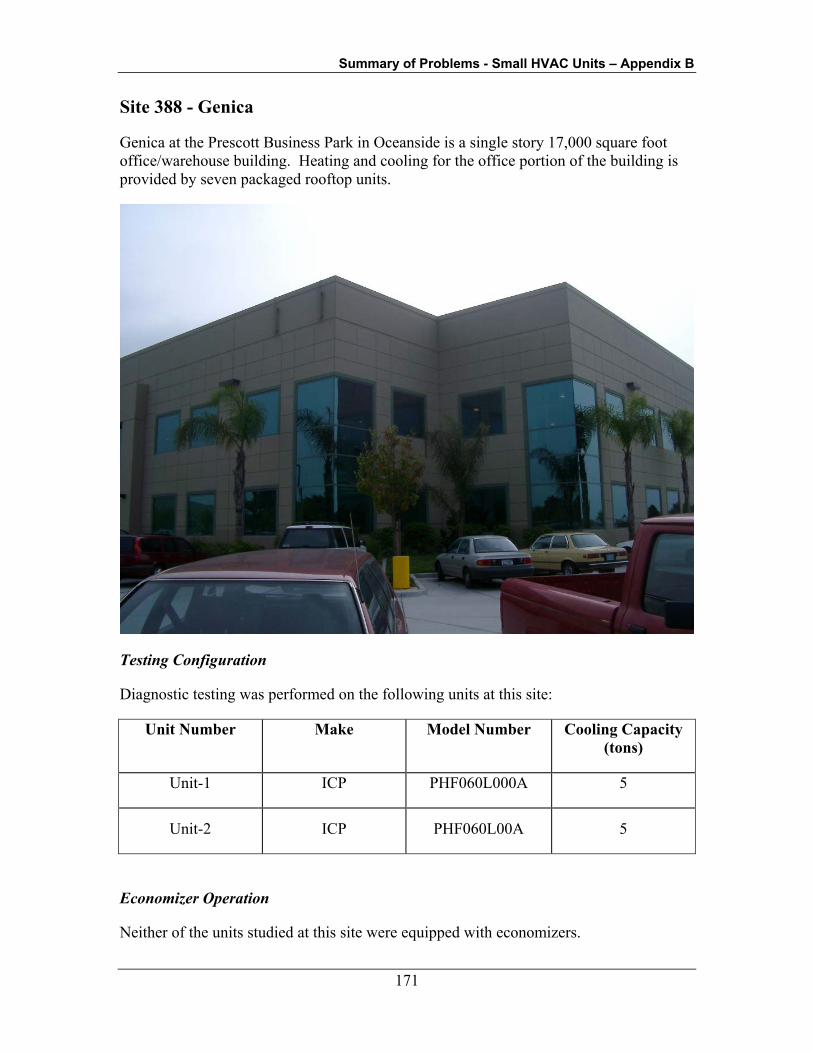
Summary of Problems - Small HVAC Units – Appendix B
171
Site 388 - Genica
Genica at the Prescott Business Park in Oceanside is a single story 17,000 square foot office/warehouse building. Heating and cooling for the office portion of the building is provided by seven packaged rooftop units.
Testing Configuration
Diagnostic testing was performed on the following units at this site:
Unit Number Make Model Number Cooling Capacity (tons)
Unit-1 ICP PHF060L000A 5
Unit-2 ICP PHF060L00A 5
Economizer Operation
Neither of the units studied at this site were equipped with economizers.

Summary of Problems - Small HVAC Units – Appendix B
172
Fan Schedules
The building operates on a 7am – 5pm Monday-Friday schedule. The thermostats are residential style, so fan scheduling is not possible. The fans operate whenever there is a call for heating or cooling.
Fan Operation
The fans are set up to cycle on whenever there is a call for heating or cooling.
Unit Air Flow
The air flow rates for the units tested were measured as follows:
Unit Measured CFM
Normal CFM @ 400
CFM/ton
% of Normal Cooling Efficiency
Impact
Unit-1 1,550 2,000 77.5% -9.1%
Unit-2 1,395 2,000 69.8% -11.7%
Supply Fan Power
The supply fan power for the units tested were measured as follows:
Unit Measured Watts
Normal Watts Fan efficiency impact
Unit-1 820 730 -12%
Unit-2 630 730 14%
Refrigerant Charge
The results of the refrigerant charge tests are summarized below:
Unit Charge deviation Cooling Efficiency impact
Unit-1 19.89% -1.7%

Summary of Problems - Small HVAC Units – Appendix B
173
Maintenance Condition
The units were observed to be in average condition.
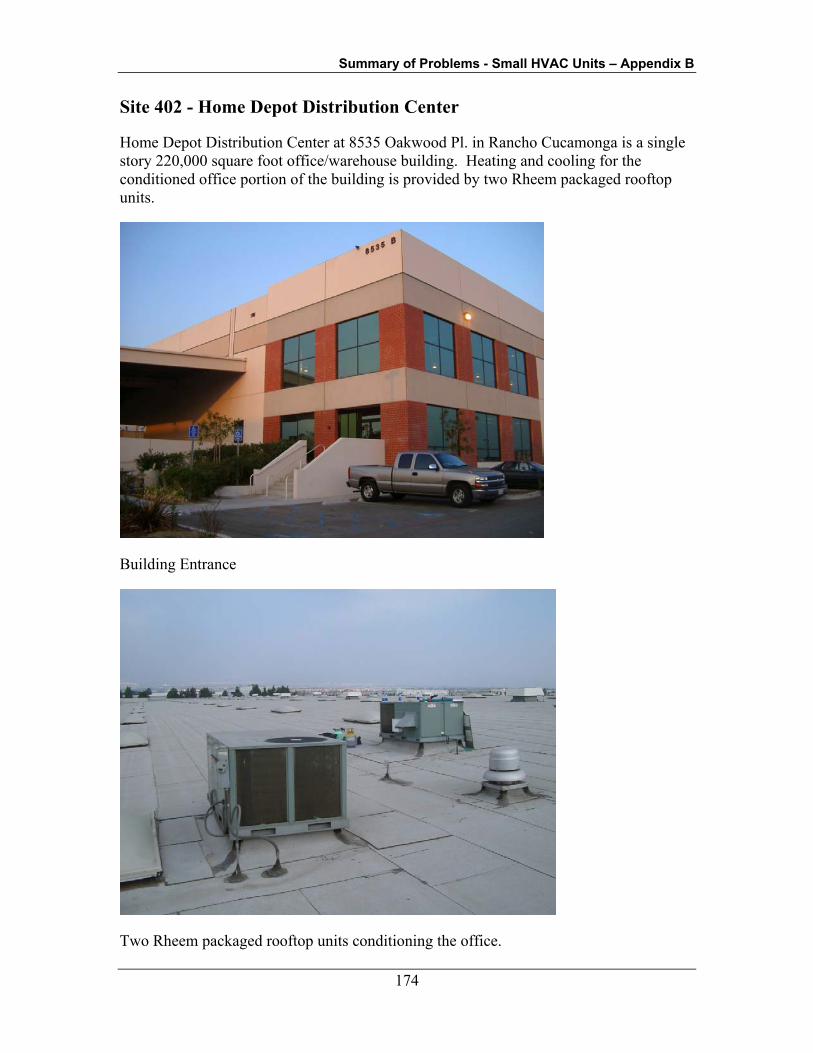
Summary of Problems - Small HVAC Units – Appendix B
174
Site 402 - Home Depot Distribution Center
Home Depot Distribution Center at 8535 Oakwood Pl. in Rancho Cucamonga is a single story 220,000 square foot office/warehouse building. Heating and cooling for the conditioned office portion of the building is provided by two Rheem packaged rooftop units.
Building Entrance
Two Rheem packaged rooftop units conditioning the office.

Summary of Problems - Small HVAC Units – Appendix B
175
Testing Configuration
Diagnostic testing was performed on the following units at this site:
Unit Number Make Model Number Cooling Capacity (tons)
RTU-1 Rheem RJKA-A048DM 4
RTU-2 Rheem RJKA-A060DM 5
Economizer Operation
Neither of the units tested were equipped with economizers.
Fan Schedules
The office portion of the building is occupied from 6am to 3pm Monday-Friday. The thermostats are programmed to operate the fans 24 hours per day, 7 days per week.
Fan Operation
The fans are set up to cycle on a call for heating or cooling
Unit Air Flow
The air flow rates for the units tested were measured as follows:
Unit Measured CFM
Normal CFM @ 400
CFM/ton
% of Normal Cooling Efficiency
Impact
RTU-1 1,935 1,600 120.9% 0.0%
RTU-2 1,705 2,000 85.3% -7.1%
Supply Fan Power
The supply fan power for the units tested were measured as follows:
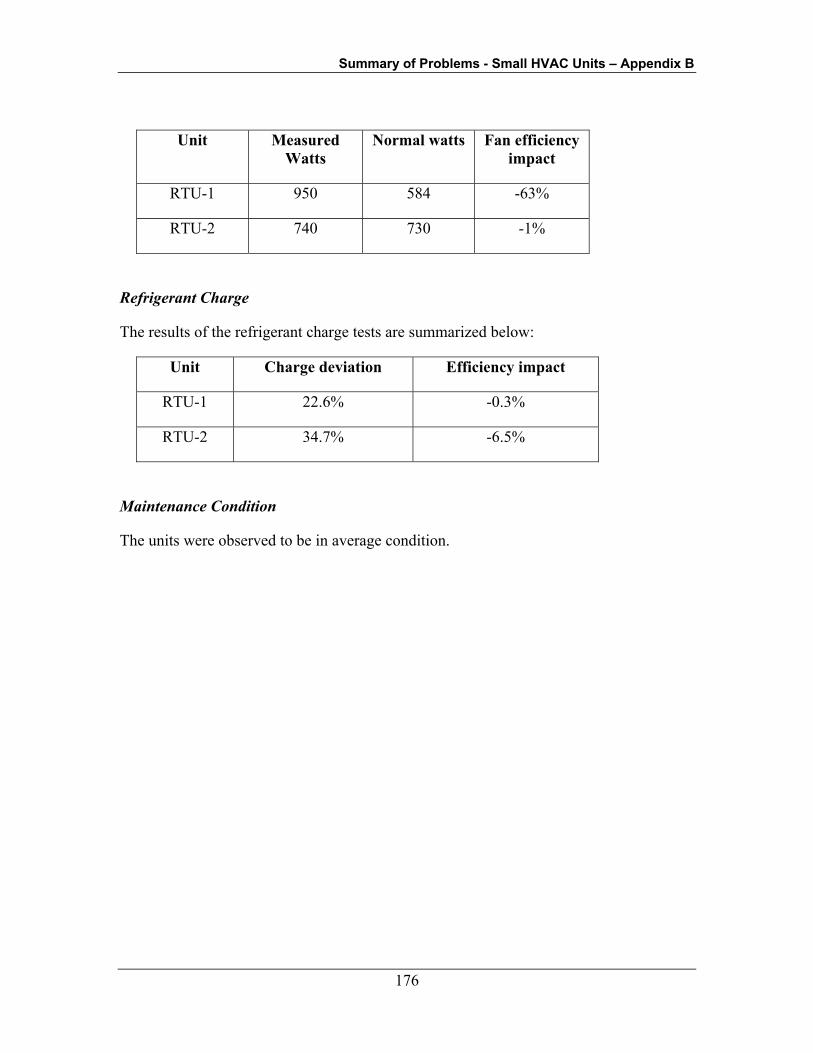
Summary of Problems - Small HVAC Units – Appendix B
176
Unit Measured Watts
Normal watts Fan efficiency impact
RTU-1 950 584 -63%
RTU-2 740 730 -1%
Refrigerant Charge
The results of the refrigerant charge tests are summarized below:
Unit Charge deviation Efficiency impact
RTU-1 22.6% -0.3%
RTU-2 34.7% -6.5%
Maintenance Condition
The units were observed to be in average condition.

Summary of Problems - Small HVAC Units – Appendix B
177
Site 407 - Albertson's
The Albertson's at 715 El Camino Real in Mountain View is a single story 60,000 square foot building. Heating and cooling for the building is provided by a combination of four packaged rooftop units and air handlers served from a refrigeration rack.
Testing Configuration
Diagnostic testing was performed on the following units at this site:
Unit Number Make Model Number Cooling Capacity (tons)
AC-1 Trane YCD036C4LGBE 3
AC-2 Trane YCD036C4LGBE 3
Economizer Operation
Both units were equipped with economizers. Unit AC-1 had a non-functioning damper actuator.
Fan Schedules
The fans follow the building occupancy, which is 24 hours/day, 7 days per week. The unit is controlled by a central EMS, with setpoints and schedules determined by the Corporate office.
Fan Operation
The fans are set up to run continuously.
Unit Air Flow
The air flow rates for the units tested were measured as follows:
Unit Measured CFM
Normal CFM @ 400
CFM/ton
% of Normal Cooling efficiency
impact
AC-1 1,222 1,200 101.8% 0.0%
AC-2 1,059 1,200 88.3% -6.3%
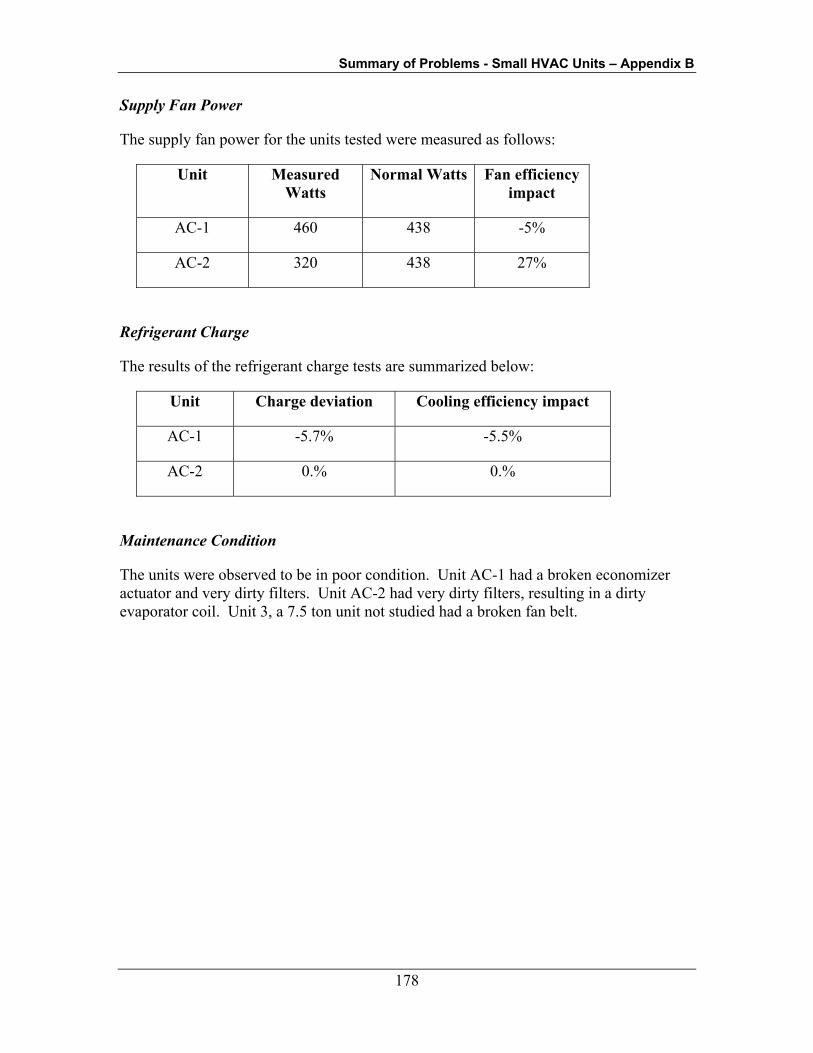
Summary of Problems - Small HVAC Units – Appendix B
178
Supply Fan Power
The supply fan power for the units tested were measured as follows:
Unit Measured Watts
Normal Watts Fan efficiency impact
AC-1 460 438 -5%
AC-2 320 438 27%
Refrigerant Charge
The results of the refrigerant charge tests are summarized below:
Unit Charge deviation Cooling efficiency impact
AC-1 -5.7% -5.5%
AC-2 0.% 0.%
Maintenance Condition
The units were observed to be in poor condition. Unit AC-1 had a broken economizer actuator and very dirty filters. Unit AC-2 had very dirty filters, resulting in a dirty evaporator coil. Unit 3, a 7.5 ton unit not studied had a broken fan belt.
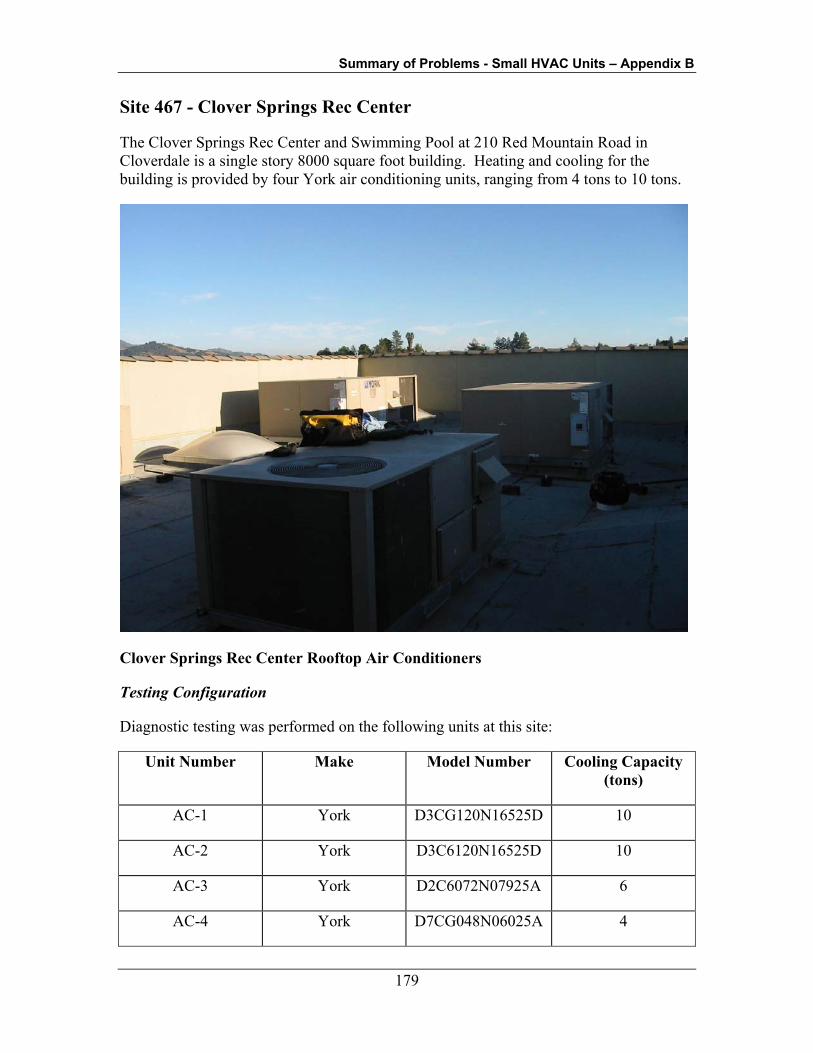
Summary of Problems - Small HVAC Units – Appendix B
179
Site 467 - Clover Springs Rec Center
The Clover Springs Rec Center and Swimming Pool at 210 Red Mountain Road in Cloverdale is a single story 8000 square foot building. Heating and cooling for the building is provided by four York air conditioning units, ranging from 4 tons to 10 tons.
Clover Springs Rec Center Rooftop Air Conditioners
Testing Configuration
Diagnostic testing was performed on the following units at this site:
Unit Number Make Model Number Cooling Capacity (tons)
AC-1 York D3CG120N16525D 10
AC-2 York D3C6120N16525D 10
AC-3 York D2C6072N07925A 6
AC-4 York D7CG048N06025A 4
Summary of Problems - Small HVAC Units – Appendix B
180
Economizer Operation
None of the units were equipped with economizers. The six and ten ton units, according to the California Title 24 Energy Standards, should be equipped with economizers.
Thermostat and Fan Schedules
Building occupancy is from 7 am to 8 pm Monday through Saturday, and 8 am to 3 pm Sundays. The systems are set up to continuously maintain occupied period setpoints with no temperature setback. The fan controls are set up to provide continuous ventilation air to the building during occupied hours.
Unit Air Flow
The air flow rates for the units tested were measured as follows:
Unit Measured CFM
Normal CFM @ 400
CFM/ton
% of Normal Cooling Efficiency
Impact
AC-1 2667 4000 66.7% -11%
AC-2 2903 4000 72.6% -10%
AC-3 1044 2400 43.5% > -20%
AC-4 1163 1600 72.7% -10%
According to the test results, all units have low air flow. Low air flow can cause reduced cooling capacity, reduced unit efficiency, and coil icing during humid weather. The loss of efficiency ranges from 10% to 20+%.
Supply Fan Power
The supply fan power for the units tested were measured as follows:
Unit Measured Watts
Normal Watts Fan Efficiency Impact
AC-1 1,610 1,460 -10%
AC-2 1,830 1,460 -25%
AC-3 774 876 12%
AC-4 631 584 -8%
Summary of Problems - Small HVAC Units – Appendix B
181
According to the test results, the unit fan power is above normal in three of the four units tested, causing excessive energy consumption during fan operation. This problem can be caused by excessive distribution system pressure drop.
Refrigerant Charge
The results of the refrigerant charge tests are summarized below:
Unit Charge deviation Cooling Efficiency impact
AC-1 Significantly under charged, no adjustment made -20+%
AC-2 No charge in unit Unit does not operate
AC-3 Significantly under charged, no adjustment made -20+%
AC-4 OK No impact
Units AC-1, AC-2, and AC-3 were significantly undercharged. AC-2 was essentially discharged, and would not operate. The charge in AC-4 is adequate.
Maintenance Condition
All of the units appeared to be in good condition. The filters in the units were clean, and it appears that the units are regularly serviced and maintained. The charge problems mentioned above must be addressed to restore the units to full capacity and efficiency.
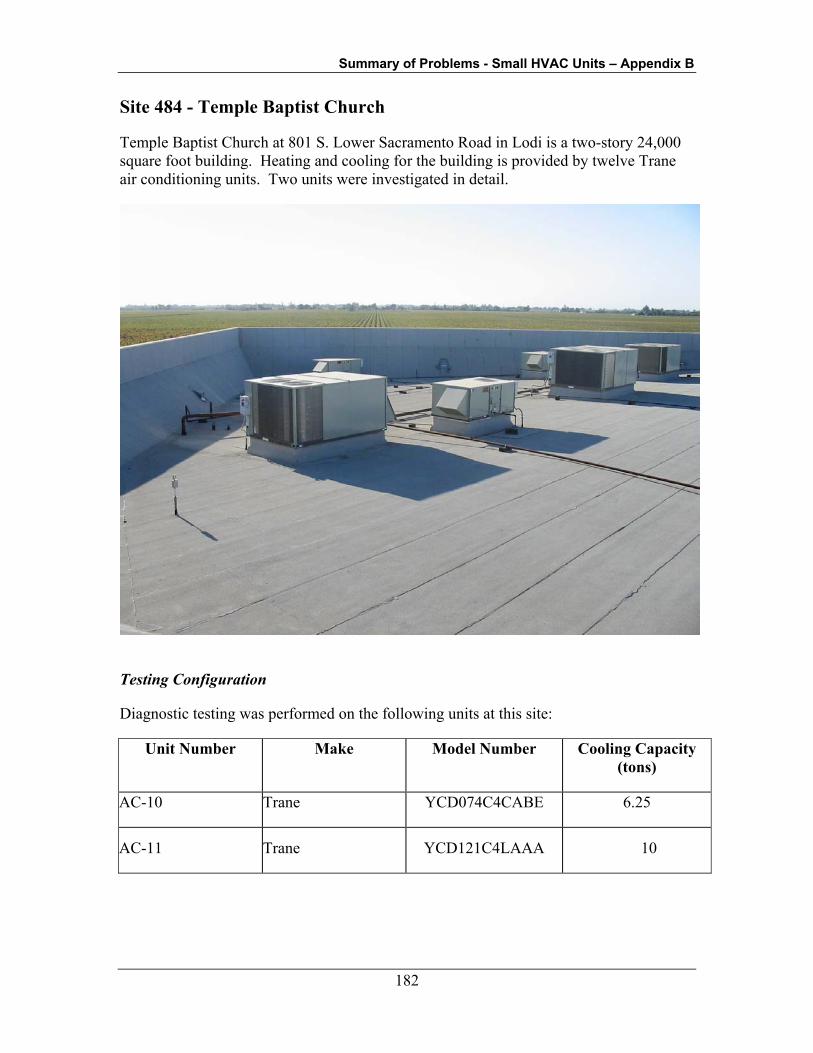
Summary of Problems - Small HVAC Units – Appendix B
182
Site 484 - Temple Baptist Church
Temple Baptist Church at 801 S. Lower Sacramento Road in Lodi is a two-story 24,000 square foot building. Heating and cooling for the building is provided by twelve Trane air conditioning units. Two units were investigated in detail.
Testing Configuration
Diagnostic testing was performed on the following units at this site:
Unit Number Make Model Number Cooling Capacity (tons)
AC-10 Trane YCD074C4CABE 6.25
AC-11 Trane YCD121C4LAAA 10
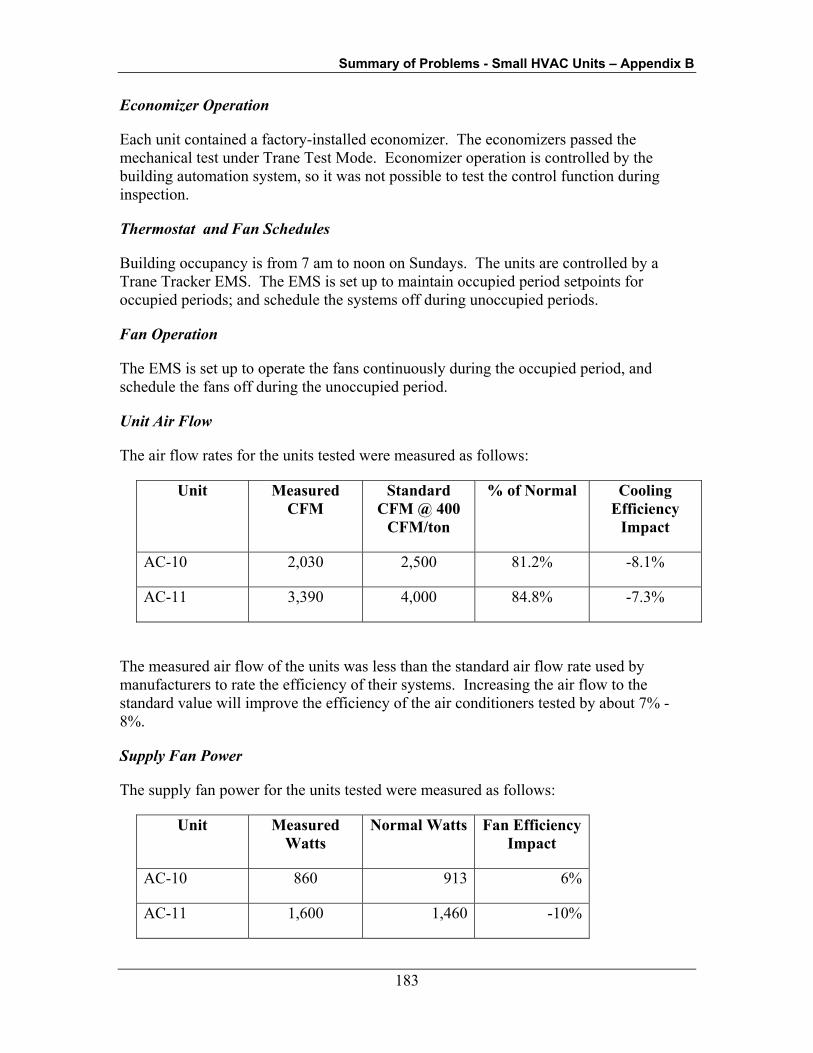
Summary of Problems - Small HVAC Units – Appendix B
183
Economizer Operation
Each unit contained a factory-installed economizer. The economizers passed the mechanical test under Trane Test Mode. Economizer operation is controlled by the building automation system, so it was not possible to test the control function during inspection.
Thermostat and Fan Schedules
Building occupancy is from 7 am to noon on Sundays. The units are controlled by a Trane Tracker EMS. The EMS is set up to maintain occupied period setpoints for occupied periods; and schedule the systems off during unoccupied periods.
Fan Operation
The EMS is set up to operate the fans continuously during the occupied period, and schedule the fans off during the unoccupied period.
Unit Air Flow
The air flow rates for the units tested were measured as follows:
Unit Measured CFM
Standard CFM @ 400
CFM/ton
% of Normal Cooling Efficiency
Impact
AC-10 2,030 2,500 81.2% -8.1%
AC-11 3,390 4,000 84.8% -7.3%
The measured air flow of the units was less than the standard air flow rate used by manufacturers to rate the efficiency of their systems. Increasing the air flow to the standard value will improve the efficiency of the air conditioners tested by about 7% - 8%.
Supply Fan Power
The supply fan power for the units tested were measured as follows:
Unit Measured Watts
Normal Watts Fan Efficiency Impact
AC-10 860 913 6%
AC-11 1,600 1,460 -10%

Summary of Problems - Small HVAC Units – Appendix B
184
According to the test results, the unit fan power in unit AC-11 is above normal, causing excessive energy consumption during fan operation. This problem can be caused by excessive distribution system pressure drop.
Refrigerant Charge
The results of the refrigerant charge tests are summarized below:
Unit Charge deviation Efficiency impact
AC-10 Charge OK No impact
AC-11 Charge OK No impact
Both AC-10 and AC-11 were adequately charged.
Maintenance Condition
All of the units appeared to be in good condition. The filters in the units were clean, and it appears that the units are regularly serviced and maintained.
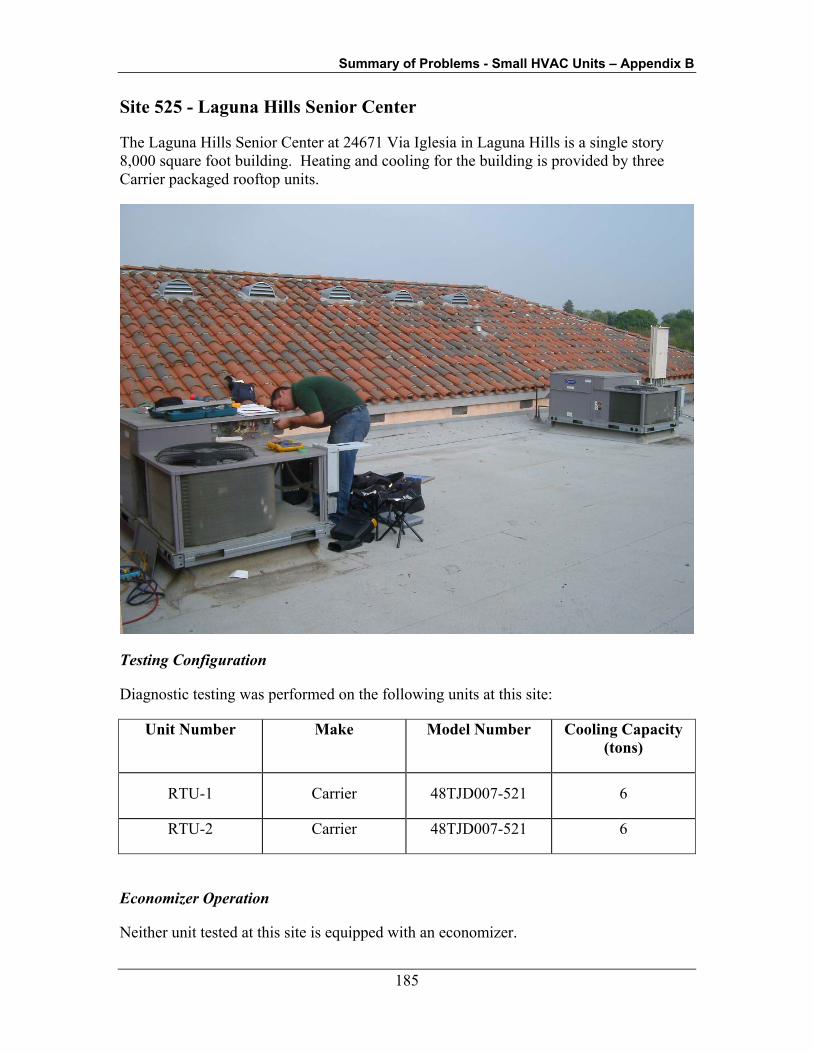
Summary of Problems - Small HVAC Units – Appendix B
185
Site 525 - Laguna Hills Senior Center
The Laguna Hills Senior Center at 24671 Via Iglesia in Laguna Hills is a single story 8,000 square foot building. Heating and cooling for the building is provided by three Carrier packaged rooftop units.
Testing Configuration
Diagnostic testing was performed on the following units at this site:
Unit Number Make Model Number Cooling Capacity (tons)
RTU-1 Carrier 48TJD007-521 6
RTU-2 Carrier 48TJD007-521 6
Economizer Operation
Neither unit tested at this site is equipped with an economizer.
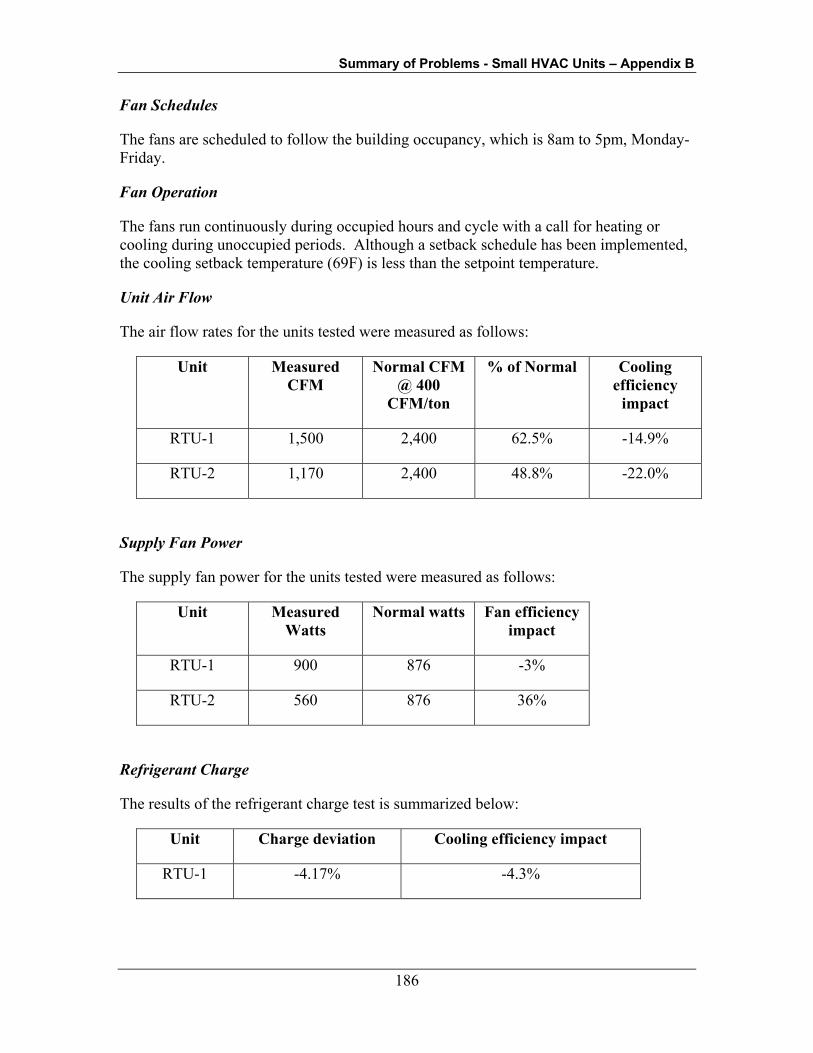
Summary of Problems - Small HVAC Units – Appendix B
186
Fan Schedules
The fans are scheduled to follow the building occupancy, which is 8am to 5pm, Monday-Friday.
Fan Operation
The fans run continuously during occupied hours and cycle with a call for heating or cooling during unoccupied periods. Although a setback schedule has been implemented, the cooling setback temperature (69F) is less than the setpoint temperature.
Unit Air Flow
The air flow rates for the units tested were measured as follows:
Unit Measured CFM
Normal CFM @ 400
CFM/ton
% of Normal Cooling efficiency
impact
RTU-1 1,500 2,400 62.5% -14.9%
RTU-2 1,170 2,400 48.8% -22.0%
Supply Fan Power
The supply fan power for the units tested were measured as follows:
Unit Measured Watts
Normal watts Fan efficiency impact
RTU-1 900 876 -3%
RTU-2 560 876 36%
Refrigerant Charge
The results of the refrigerant charge test is summarized below:
Unit Charge deviation Cooling efficiency impact
RTU-1 -4.17% -4.3%

Summary of Problems - Small HVAC Units – Appendix B
187
Maintenance Condition
The units were observed to be in average condition.
Integrated Energy Systems
Productivity & Building Science Program
A project of the State of California PIER Program
Element Four – Integrated Design of Small Commercial HVAC Systems
Impact Analysis FINAL September 25, 2003
Deliverable 4.5.3

Table of Contents
TABLE OF CONTENTS 1 INTRODUCTION ...................................................................................................................................................... 1
2 APPROACH................................................................................................................................................................ 1
3 NRNC DATABASE .................................................................................................................................................... 3 3.1 INTERVIEW QUESTIONS........................................................................................................................................ 3 3.2 BUILDING CHARACTERISTICS............................................................................................................................... 4 3.3 ESTABLISHING COMPONENT RELATIONSHIPS....................................................................................................... 5 3.4 MODELING PROCEDURES ..................................................................................................................................... 6
3.4.1 Loads .............................................................................................................................................................. 6 3.4.2 Systems ........................................................................................................................................................... 8
4 FIELD TESTING ....................................................................................................................................................... 9 4.1 ONE-TIME TESTING. ............................................................................................................................................. 9
4.1.1 Fan flow and Power ....................................................................................................................................... 9 4.1.2 Economizer ..................................................................................................................................................... 9 4.1.3 Refrigerant charge.......................................................................................................................................... 9
4.2 SHORT-TERM MONITORING.............................................................................................................................. 10 5 PROBLEMS STUDIED ........................................................................................................................................... 10
6 IMPACT ESTIMATION APPROACH.................................................................................................................. 11
7 RESULTS .................................................................................................................................................................. 15

PIER Program Report
Impact Analysis - Small HVAC (4.5.3) September 2003 1
1 INTRODUCTION This document presents the results of the statewide impact analysis for Element 4 of the New Buildings Institute’s Integrated Energy Systems - Productivity & Building Science Program, a Public Interest Energy Research (PIER) program. It is funded by California ratepayers through California’s System Benefit Charges administered by the California Energy Commission under (PIER) contract No. 400-99-013, and managed by the New Buildings Institute. The Public Interest Energy Research (PIER) Program supports public interest energy research and development that will help improve the quality of life in California by bringing environmentally safe, affordable, and reliable energy services and products to the marketplace.
The focus of Element 4 is system integration issues affecting the installed efficiency of small packaged HVAC systems. For the purposes of this project, small systems are defined as single package rooftop air conditioners and heat pumps with cooling capacity of 10 tons or less. The impacts of correcting several problems researched during the conduct of this project at a statewide level are presented.
2 APPROACH
We utilized the same methodology in this study that was used to provide the California Energy Commission with estimates of the energy impacts of revisions to the title 24 energy efficiency standards in the AB970 process1. The process involved a series of parametric DOE2.1 E simulations of 990 non-residential buildings contained in the Statewide Nonresidential New Construction Baseline database (NRNC database)2. The impacts of avoiding the problems noted in the study are estimated by comparing the simulated energy consumption with and without the simulated problems. The impacts of fixing each problem in this study were evaluated individually, without accounting for interactive effects. A final run was done to look at the impacts of fixing all problems together, including their interactions. The statewide impacts were projected using the California Statewide NRNC database, a collection of 990 buildings statistically selected to represent the majority of statewide NRNC activity. The buildings in the database represent the building types considered by the CEC in their non-residential sector forecasting models, with the exception of refrigerated warehouses, which generally do not contain HVAC Systems covered under this study. The majority of the data come from about 880 on-site surveys conducted during impact evaluation studies of the SCE and PG&E 1994 and 1996 NRNC energy efficiency programs. These data were supplemented with thirty audits from the impact evaluation of the 1995 SDG&E NRNC program and additional on-site surveys designed to supplement the existing data. Participants in utility energy-efficiency programs are included, but are weighted according to their general representation in the population. The population was defined using a listing of new construction projects obtained from F. W. Dodge. The Dodge database seeks to list all new construction projects that are valued over $200,000 and are expected to start within 60
1 Architectural Energy Corporation, Assembly Bill 970 Emergency Rulemaking – 2001 Update of California Nonresidential Building
Energy Efficiency Standards, Volume IV- Impact Analysis. November 21, 2000. 2 RLW Analytics et al, California Non-residential New Construction Baseline Study, California Board for Energy Efficiency, 1999

PIER Program Report
Impact Analysis - Small HVAC (4.5.3) September 2003 2
days. The data include renovations and expansions as well as entirely new buildings.3 These data were filtered to exclude projects not covered under Title 24. The population-weighted square footage distribution of audited sites in the NRNC database is shown by building type in Figure 1. These data are compared to estimates of new construction activity in 2001 supplied by the CEC.
S h a re o f T o ta l N R N C M a rk e t
0
0 .0 5
0 .1
0 .1 5
0 .2
0 .2 5
0 .3
Office
Restau
rants
Retail
Food S
tores
Non-R
efrg W
hses
Refrg W
hse
Elem/S
cndry
Sch
ools
Colleg
es, U
nivers
ities
Hospit
als
Hotel/M
otel
Misc.
B u ild in g T y p e
Mar
ket S
hare
(% o
f tot
al S
F)
C E C P ro je c tio n sN R N C D a ta b a s e
Figure 1 - Estimates of NRNC Construction Activity by Building Type
Note: the market share distribution in the NRNC database and the CEC projections are fairly close in most important market categories. Notable exceptions are the Restaurant and Hotel/Motel sectors, which generally do not comprise a large fraction of the total NRNC activity. Refrigerated warehouses are not considered, since they do not contain small HVAC Systems studied under this project. Buildings within the database were filtered to remove systems not covered under this project, such as built-up systems, water loop heat pumps, window air-conditioners, and so on. The resulting data base contained a total of 540 Buildings, each of which contained at least one small HVAC system. During the audits, information on building physical characteristics such as types of lighting and plug load inventories, types and efficiency of HVAC equipment, insulation levels, and glazing properties were collected. Building occupants were interviewed to determine behavior characteristics such as occupancy schedules and equipment operation. The on-site data were used to develop DOE-2 building energy simulation models through an automated modeling process. Most building simulation models were calibrated to monthly billing data when the data were available. The NRNC data represent the broad range of construction practices, climate zones and occupant behavior expected in a building population as diverse as the NRNC market. For example, the office segment contains a wide variety of buildings ranging from glass and steel skyscrapers to one-story
3 The data are thought to cover over 95% of all projects that are competitively bid.

PIER Program Report
Impact Analysis - Small HVAC (4.5.3) September 2003 3
wood frame buildings. Each site in the sample has a statistically derived sample weight and precision, expressing the relative representation of each building in the NRNC population, thus allowing the results obtained from simulations of each individual building to be projected to the population with a quantifiable level of precision. The energy consumption predicted for the population of buildings in the database was adjusted to reflect the Commission’s estimate of NRNC activity for the year 2001. Table 1Table 1Table 1 summarizes the results.
Table 1. Summary of NRNC floor space and Commission New Construction Projections
Parameter Value Comments Total floor space in NRNC database
233.2 million ft2 Sum of weighted floor area in database
Estimated 2001 new construction activity
155.1 million ft2 Excludes refrigerated warehouses
Adjustment factor 0.665
3 NRNC DATABASE On-site surveys conducted by energy engineers were used to develop the database. Building characteristics data were collected during the on-site survey and recorded on a form. The on-site survey data entry form was designed so that key modeling decisions on model zoning and equipment/space association were made by the surveyors in the field. The form was designed to follow the logical progression of an on-site survey process. The form started out with a series of interview questions. Conducting the interview first helped orient the surveyor to the building and allowed time for the surveyor to establish a rapport with the customer. Once the interview was completed, an inventory of building equipment was conducted. The survey started with the HVAC systems, and progressed from the roof and/or other mechanical spaces into the conditioned spaces. This progression allowed the surveyor to establish the linkages between the HVAC equipment and the spaces served by the equipment. 3.1 Interview Questions The surveyor used the interview questions to identify building characteristics and operating parameters that were not observable during the course of the on-site survey. The interview questions covered the following topics: Building functional areas. Functional areas were defined on the basis of operating schedules. Subsequent questions regarding occupancy, lighting, and equipment schedules, were repeated for each functional area. Building Occupancy schedules. For each functional area in the building, a set of questions were asked to establish the building occupancy schedules. First, the surveyor assigned each day of the week
PIER Program Report
Impact Analysis - Small HVAC (4.5.3) September 2003 4
to one of three daytypes: full occupancy, partial occupancy, and unoccupied. This was done to cover buildings that did not operate on a normal Monday through Friday workweek. Holidays and monthly variability in occupancy schedules were identified. Daily schedules for occupants, interior lighting, and equipment/plug loads. A set of questions was used to establish hourly occupancy, interior lighting, and miscellaneous equipment and plug load schedules for each functional area in the building. During the on-site survey, the surveyor defined hourly schedules for each daytype. A value, which represents the fraction of the maximum occupancy and/or connected load was entered for each hour of the day. Daily schedules of kitchen equipment. A set of questions were asked to establish hourly kitchen equipment schedules for each functional area in the building for each daytype. A value which represented the equipment-operating mode (off, idle, or low, medium or high volume production) was entered for each hour of the day. Operation of the HVAC systems. A series of questions were asked to construct operating schedules for the HVAC systems serving each area. The surveyors entered fan operating schedules and heating and cooling setpoints. A series of questions were used to define the HVAC system controls. These questions were intended to be answered by someone familiar with the operation of the building mechanical systems. The questions covered operation of the outdoor air ventilation system, supply air temperature controls, and so on. Refrigeration system. The operation of refrigeration systems utilizing remote condensers, which are common in groceries and restaurants, was covered in this section. Surveyors divided the systems into three temperature classes, (low, medium and high) depending on the compressor suction temperature. For each system temperature, the refrigerant, and predominant defrost mechanism was identified. Overall system controls strategies were also covered. Understanding the operation of the refrigeration is important due to the interactions of refrigerated cases with the HVAC system. 3.2 Building Characteristics The next sections of the on-site survey covered observations on building equipment inventories and other physical characteristics. Observable information on HVAC systems, building shell, lighting, plug loads, and other building characteristics were entered, as described below: Packaged HVAC systems. Equipment type, make, model number, and other nameplate data were collected on the packaged HVAC systems in the building. Zones. Based on an understanding of the building layout and the HVAC equipment inventory, basic zoning decisions were made by the surveyors according to the following criteria: • Unusual internal gain conditions. Spaces with unusual internal gain conditions, such as
computer rooms, kitchens, laboratories were defined as separate zones. • Operating schedules. Occupant behavior varies within spaces of nominally equivalent use. For
example, retail establishments in a strip retail store may have different operating hours. Office tenants may also have different office hours.

PIER Program Report
Impact Analysis - Small HVAC (4.5.3) September 2003 5
• HVAC system type and zoning. When the HVAC systems serving a particular space were different, the surveyors sub-divided the spaces according to HVAC system type. If the space was zoned by exposure, the space was surveyed as a single zone, and a “zone by exposure” option was selected on the survey form.
For each zone defined, the surveyor recorded the floor area and occupancy type. Enclosing surfaces were surveyed, in terms of surface area, construction type code, orientation, and observed insulation levels. Window areas were surveyed by orientation. The surveyor also identified and inventoried basic window properties, interior and exterior shading devices, lighting fixtures and controls, and miscellaneous equipment and plug loads. Refrigeration systems. The surveyor inventoried the refrigeration equipment and associated the equipment with a particular zone in the building. Refrigerated cases and stand-alone refrigerators were identified by case type, size, product stored, and manufacturer. Remote compressor systems were inventoried by make, model number, and compressor system type. Each compressor or compressor rack was associated with a refrigerated case temperature loop and heat rejection equipment such as a remote condenser, cooling tower, and/or HVAC system air handler. Remote condensers were inventoried by make, model number, and type. Nameplate data on fan and pump hp were recorded. Observations on condenser fan speed controls were also recorded. Cooking Equipment. The surveyor recorded the cooking equipment separately and associated with a particular zone in the building. Major equipment was inventoried by equipment type (broiler, fryer, oven, and so on), size, and fuel type. Kitchen ventilation hoods were inventoried by type and size. Nameplate data on exhaust flowrate and fan hp were recorded and each piece of kitchen equipment was associated with a particular ventilation hood. 3.3 Establishing Component Relationships In order to create a DOE-2 model of the building from the various information sources contained in the on-site survey, relationships between the information contained in the various parts of the survey needed to be established. In the interview portion of the form, schedule and operations data were cataloged by building functional area. In the equipment inventory section, individual pieces of HVAC equipment were inventoried. In the zone section of the survey, building envelope data, lighting and plug load data were collected. The following forms provided the information needed by the software to associate the schedule, equipment, and zone information. System/Zone Association Checklist. The system/zone association checklist provided a link between each building zone and the HVAC equipment serving that zone. Systems were defined in terms of a single or set of several units of packaged equipment. Each system was assigned to the appropriate thermal zones in accordance with the observed building design. Interview “Area” / Audit “Zone” Association Checklist. Schedule and operations data gathered during the interview phase of the survey were linked to the appropriate building zone. These data were gathered according to the building functional areas defined previously. Each building functional area could contain multiple zones. This table facilitated the association of the functional areas to the zones, and thereby the assignment of the appropriate schedule to each zone.
PIER Program Report
Impact Analysis - Small HVAC (4.5.3) September 2003 6
3.4 Modeling Procedures The on-site survey data were entered by the field engineering staff into a Microsoft Access application called SurveyIT. SurveyIT contains a series of relational data tables that store information for multiple buildings, and Visual Basic code that interfaces with the ModelIT automated modeling software. ModelIT is C++ code that reads SurveyIT data tables and automatically creates a DOE-2 input file for each building in the database. Once the basic building is described and an as-built DOE-2 model is created, the modeling software also creates additional DOE-2 input files for each of the building parametric runs. The software is designed to create DOE-2 BDL (building description language) files that are recognized by DOE-2.2. The version of DOE-2.2 used for this project is Beta 2.2-41c. The data elements used, default assumptions, and engineering calculations are described for the Loads and Systems portions of the DOE-2.2 input file as follows. 3.4.1 Loads Schedules were created for each zone in the model by associating the zones defined in the on-site survey with the appropriate functional area, and assigning the schedule defined for each functional area to the appropriate zone. Hourly schedules were created by the software on a zone-by-zone basis for: • Occupancy • Lighting • Electric equipment • Gas equipment (primarily kitchen equipment) • Solar glare • Window shading • Infiltration Occupancy, lighting, and equipment schedules. Each day of the week was assigned to a particular daytype, as reported by the surveyor. Hourly values for each day of the week were extracted from the on-site database according to the appropriate daytype. These values were modified on a monthly basis, according to the monthly building occupancy history. Solar and shading schedules. The use of blinds by the occupants was simulated by the use of solar and shading schedules. The glass shading coefficient values were modified to account for the use of interior shading devices. Infiltration schedule. The infiltration schedule was established from the fan system schedule. Infiltration was scheduled “off” during fan system operation, and was scheduled “on” when the fan system was off. Shell materials. A single-layer, homogeneous material was described which contains the conductance and heat capacity properties of the composite wall used in the building. The thermal
PIER Program Report
Impact Analysis - Small HVAC (4.5.3) September 2003 7
conductance and heat capacity of each wall and roof assembly was taken from the Title 24 documents, when available. If the Title 24 documents were not available, default values for the conductance and heat capacity were assigned from the wall and roof types specified in the on-site survey, and the observed R-values. If the R-values were not observed during the on-site survey and the Title 24 documents were not available, an “energy-neutral” approach was taken by assigning the same U-value and heat capacity for the as-built and Title 24 simulation runs. Windows. Window thermal and optical properties from the building drawings or Title 24 documents (when available) were used to develop the DOE-2 inputs. If these documents were not available, default values for the glass conductance were assigned according to the glass type specified in the on-site survey. If the glass type was not observed during the on-site survey and the Title 24 documents were not available, an “energy-neutral” approach was taken by assigning the same U-value and shading coefficient for the as-built and Title 24 simulation runs. Lighting kW. Installed lighting power was calculated from the lighting fixture inventory reported on the survey. A standard fixture wattage was assigned to each fixture type identified by the surveyors. Lighting fixtures were identified by lamp type, number of lamps per fixture, and ballast type as appropriate. Equipment kW. Connected loads for equipment located in the conditioned space, including miscellaneous equipment and plug loads, kitchen equipment and refrigeration systems with integral condensers were calculated. Input data were based on the “nameplate” or total connected load. The nameplate data were adjusted using a “rated-load factor,” which is the ratio of the average operating load to the nameplate load during the definition of the equipment schedules. This adjusted value represented the hourly running load of all equipment surveyed. Equipment diversity was also accounted for in the schedule definition. For the miscellaneous equipment and plug loads, equipment counts and connected loads were taken from the on-site survey. When the connected loads were not observed, default values based on equipment type were used. For the kitchen equipment, equipment counts and connected loads were taken from the on-site survey. Where the connected loads were not observed, default values based on equipment type and “trade size” were used. Unlike the miscellaneous plug load schedules, the kitchen equipment schedules were defined by operating regime. An hourly value corresponding to “off”, “idle”, or “low,” “medium,” or “high” production rates were assigned by the surveyor. The hourly schedule was developed from the reported hourly operating status and the ratio of the hourly average running load to the connected load for each of the operating regimes. For the refrigeration equipment, refrigerator type, count, and size were taken from the on-site survey. Equipment observed to have an “integral” compressor/condenser that is, equipment that rejects heat to the conditioned space, were assigned a connected load per unit size. Source input energy. Source input energy represented all non-electric equipment in the conditioned space. In the model, the source type was set to natural gas, and a total input energy was specified in terms of Btu/hr. Sources of internal heat gains to the space that were not electrically powered include

PIER Program Report
Impact Analysis - Small HVAC (4.5.3) September 2003 8
kitchen equipment, dryers, and other miscellaneous process loads. The input rating of the equipment was entered by the surveyors. As with the electrical equipment, the ratio of the rated input energy to the actual hourly consumption was calculated by the rated load factor assigned by equipment type and operating regime. Heat gains to space. The heat gains to space were calculated based on the actual running loads and an assessment of the proportion of the input energy that contributed to sensible and latent heat gains. This in turn depended on whether or not the equipment was located under a ventilation hood. Spaces. Each space in the DOE-2 model corresponded to a zone defined in the on-site survey. In the instance where the “zoned by exposure” option was selected by the surveyor, additional DOE-2 zones were created. The space conditions parameters developed on a zone by zone basis were included in the description of each space. Enclosing surfaces, as defined by the on-site surveyors, were also defined.
3.4.2 Systems This section describes the methodology used to develop DOE-2 input for the systems simulation. Fan schedules. Each day of the week was assigned to a particular daytype, as reported by the surveyor. The fan system on and off times from the on-site survey was assigned to a schedule according to daytype. Setback schedules. Similarly, thermostat setback schedules were created based on the responses to the on-site survey. Each day of the week was assigned to a particular daytype. The thermostat setpoints for heating and cooling, and the setback temperatures and times were defined according to the responses. System type. The HVAC system type was defined from the system description from the on-site survey. The DOE-2 Packaged single zone (PSZ) system type was used to simulate the small HVAC systems studied in this project.
Packaged HVAC system efficiency. Manufacturers’ data were gathered for the equipment surveyed based on the observed make and model number. A database of equipment efficiency and capacity data was developed from an electronic version of the ARI rating catalog. Additional data were obtained directly from manufacturers’ catalogs, or the on-line catalog available on the ARI website (www.ari.org). Manufacturers’ data on packaged system efficiency is a net efficiency, which considers both fan and compressor energy. DOE-2 requires a specification of packaged system efficiency that considers the compressor and fan power separately. Thus, the manufacturers’ data were adjusted to prevent “double-accounting” of fan energy, according to the procedures described in the Title 24 Alternative Compliance Method (ACM) approval manual. Refrigeration systems. Refrigeration display cases and/or walk-ins were grouped into three systems defined by their evaporator temperatures. Ice cream cases were assigned to the lowest temperature circuit, followed by frozen food cases, and all other cases. Case refrigeration loads per lineal foot were taken from manufacturers’ catalog data for typical cases. Auxiliary energy requirement data for

PIER Program Report
Impact Analysis - Small HVAC (4.5.3) September 2003 9
evaporator fans, anti-sweat heaters, and lighting were also compiled from manufacturers’ catalog data. Model inputs were calculated based on the survey responses. For example, if the display lighting was surveyed with T-8 lamps, lighting energy requirements appropriate for T-8 lamps were used to derive the case auxiliary energy input to DOE-2. Compressor EER data were obtained from manufacturers’ catalogs as a function of the suction temperatures corresponding to each of the three systems defined above. These data were used to create default efficiencies for each compressor system. Custom part-load curves were used to simulate the performance of parallel-unequal rack systems. 4 FIELD TESTING To conduct this research, teams of engineers visited 75 newly constructed commercial buildings throughout California. A total of 215 rooftop units were surveyed. Units were subjected to a physical inspection, a series of one-time tests, and short-term monitoring of unit performance. Up to four units per building were selected for study. Tests were performed at the individual HVAC units to better understand their performance, as described below. 4.1 One-time testing. A series of one-time tests were used to quantify system and equipment performance. Examples of one-time tests included instantaneous measurements of unit supply fan power, refrigeration charge measurements, and unit air flow measurements. Functional performance tests of HVAC unit operation were conducted to identify gross deficiencies in unit performance, as described below: 4.1.1 Fan flow and Power The unit was cycled through each mode of operation (standby, fan-only, cooling stage one, and cooling stage two, if applicable) and the true electric power and current of the unit were measured during each mode using a portable wattmeter. Airflow rate was measured using a flow grid, which is an averaging flow meter designed to be installed in place of the filters. A digital micromanometer was used to measure the pressure drop across the plate. The results were displayed directly in cfm. The manometer was also used to measure supply static pressure, return static pressure, and total unit external static pressure. 4.1.2 Economizer If the unit had an airside economizer, the minimum outdoor air position potentiometer was adjusted to test the operation of damper motors and linkages. The economizer outdoor air temperature sensor was cooled down using a “cool” spray, simulating cool outdoor air conditions and the response of the economizer was observed. 4.1.3 Refrigerant charge Service gauges and temperature sensors were used to verify the state of charge of the rooftop unit using the CheckMe!1 Procedure. The high side and low side pressures were measured, along with the
PIER Program Report
Impact Analysis - Small HVAC (4.5.3) September 2003 10
suction line temperature, the condensed liquid temperature, outdoor drybulb temperature entering the condenser, and drybulb and wet bulb temperature entering the evaporator coil. Refrigerant was added or removed from the system until the suction line superheat on units with fixed metering devices, or the condenser line subcooling on units with thermostatic expansion valves (TXV), was within the target specified by the CheckMe! software. 4.2 Short-term monitoring. HVAC system performance over a variety of operating conditions was observed through short-term monitoring of a sample of HVAC units and controls. Portable, battery-powered dataloggers were used to collect short-term data on HVAC unit performance. The purpose of the short-term monitoring was to spot failure modes that are not obvious from inspection or one-time test, or that only manifest themselves during the dynamic operation of the equipment. Data loggers were left in place on each building for about two weeks. The dataloggers were configured to measure unit current, supply air temperature, return air temperature, and mixed air temperature. The data were stored on a five minute basis. The dataloggers used thermistor sensors with a 0.5�F accuracy over the full range. The current sensors were equipped with signal conditioning equipment to provide true RMS current readings. True RMS current measurements were coupled with the spot kW and current measurements to estimate time series kW data for the unit. In addition to the datalogger installed at each unit, the local rooftop temperature and humidity was monitored at each site. 5 PROBLEMS STUDIED This section in summarizes the problems observed in the study, and the approach taken to simulate the impacts of eliminating those problems. Problems identified include broken economizers, improper refrigerant charge, fans running during unoccupied periods, fan that cycle on and off with a call for heating and cooling rather than providing continuous ventilation air, low air flow, inadequate ventilation air, and simultaneous heating and cooling. Thermostat setpoints. The system thermostats were observed to provide cooling and heating at occupied period setpoints during unoccupied periods. Implementing a thermostat setback during unoccupied periods saves energy without sacrificing comfort. Fan controls. Although the primary function of the thermostat is to control the heating and cooling output of the unit, most thermostats also control the operation of the supply fan. System fans were found to be cycling on and off with a call for heating or cooling in 38% of the units tested. Title 24 Energy Standards require that all buildings not naturally ventilated with operable windows or other openings be mechanically ventilated. Mechanical ventilation is required to occur at least 55 minutes out of every hour that the building is occupied. Building outdoor ventilation air is typically supplied during fan operation, with the minimum quantity of outdoor air determined by the outdoor air damper minimum position. The supply of continuous fresh air during occupied hours relies on continuous operation of the HVAC unit supply fan. The Standards further require operation of the ventilation system at least one hour before normal building occupancy in order to purge potential build up of pollutants and outgassing from furniture, carpets, paint, etc.

PIER Program Report
Impact Analysis - Small HVAC (4.5.3) September 2003 11
Fan schedule. Fans were also observed to run continuously during unoccupied periods in 38% of the systems observed. While this practice improves the ventilation of the space, it represents an opportunity to save energy through thermostat setback and fan cycling during unoccupied periods. Economizers. Economizers show a high rate of failure (63%) in the study. Of the 215 units tested, 123 units were equipped with economizers. Of these, 30 units (24%) would not move at all, 36 units (29%) did not respond when subject to simulated economizer operating conditions. Short term monitoring revealed that an additional 13 (10%) did not respond correctly over a range of operating conditions. Distribution Systems. The efficiency of the HVAC system is a function of both the unit efficiency and distribution system efficiency. Distribution system efficiency is a function of duct design and installation practices, as well as architectural design decisions affecting environmental conditions imposed the duct system. Architectural design issues affecting distribution system efficiency include insulation placement (roof or ceiling), roof surface and color selection, and location of attic vents. We did not make any quantitative measurements of duct leakage in this study; however, the location, surface area and insulation levels of the duct systems were surveyed as part of the onsite survey process. Supply Fan Power. HVAC unit efficiency is calculated from ARI standard test and rating procedures, which use a standard assumption for supply fan power to determine overall unit efficiency. The actual fan power is generally greater than the standard assumption, reducing the installed efficiency of the unit. Fan power in small HVAC systems is not regulated by Title 24, and can be a significant energy cost, especially in systems utilizing continuous ventilation through the HVAC system. The measured fan power at the in-situ flow rate was 0.18 kW/ton, which is about 20% higher than the nominal fan power assumed in the Title 24 energy standards (365 W/cfm or about .15 kW/ton). Unit Air Flow. Units were tested for in-situ airflow rate. Overall, of the 79 units tested for airflow, 28 (39%) had airflow less than 300 cfm /ton. The average airflow rate was 325 cfm/ton. ARI standards are based on airflow rates of 400 cfm/ton. Low air flow can result in reduced system efficiency and coil icing. High air flow can also result in excessive fan energy and insufficient moisture removal. Refrigerant Charge. Refrigerant charge was field tested by measuring unit operating conditions and refrigerant temperature and pressure. Of the 74 refrigerant tests conducted, 33 (46%) were found to be improperly charged. The average energy impact of refrigerant charge problems was about 5% of the annual cooling energy. 6 IMPACT ESTIMATION APPROACH. The general approach taken to estimate the impacts of avoiding problems identified in the study leverage is information gathered during the field study with NRNC population characteristics contained within the NRNC database. The impacts of avoiding problems throughout all new construction activity can be estimated by simulating each building in the database with and without a
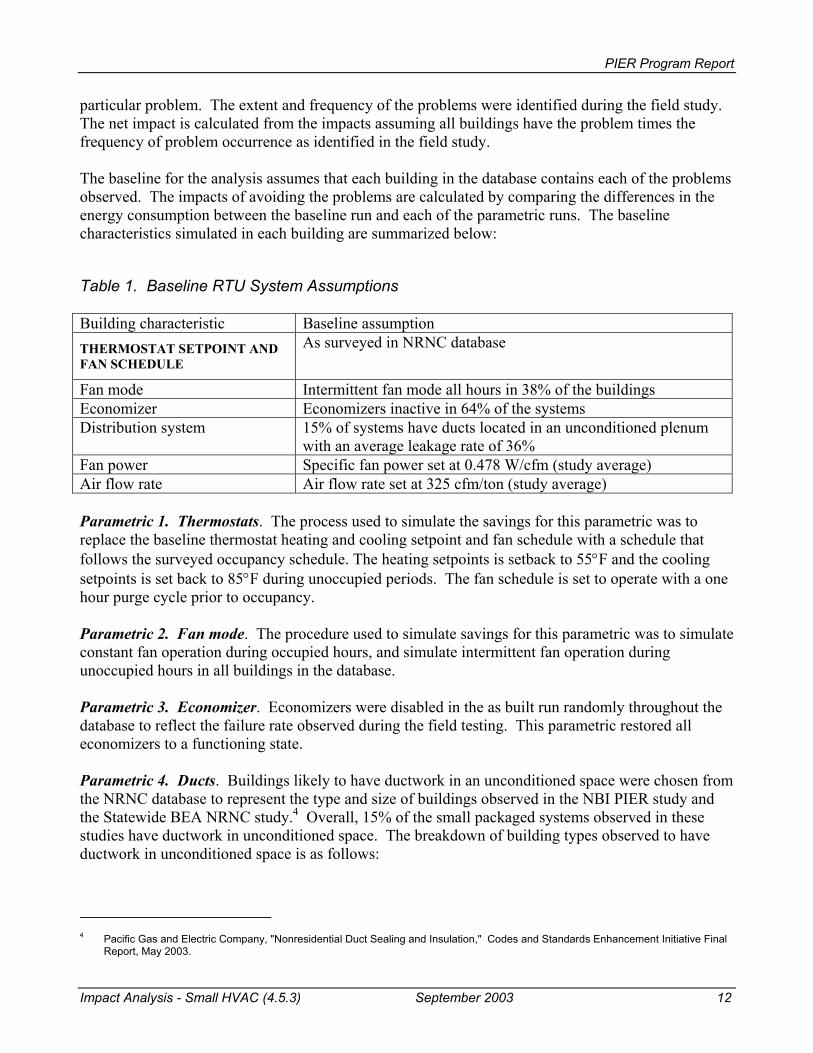
PIER Program Report
Impact Analysis - Small HVAC (4.5.3) September 2003 12
particular problem. The extent and frequency of the problems were identified during the field study. The net impact is calculated from the impacts assuming all buildings have the problem times the frequency of problem occurrence as identified in the field study. The baseline for the analysis assumes that each building in the database contains each of the problems observed. The impacts of avoiding the problems are calculated by comparing the differences in the energy consumption between the baseline run and each of the parametric runs. The baseline characteristics simulated in each building are summarized below:
Table 1. Baseline RTU System Assumptions Building characteristic Baseline assumption THERMOSTAT SETPOINT AND FAN SCHEDULE
As surveyed in NRNC database
Fan mode Intermittent fan mode all hours in 38% of the buildings Economizer Economizers inactive in 64% of the systems Distribution system 15% of systems have ducts located in an unconditioned plenum
with an average leakage rate of 36% Fan power Specific fan power set at 0.478 W/cfm (study average) Air flow rate Air flow rate set at 325 cfm/ton (study average) Parametric 1. Thermostats. The process used to simulate the savings for this parametric was to replace the baseline thermostat heating and cooling setpoint and fan schedule with a schedule that follows the surveyed occupancy schedule. The heating setpoints is setback to 55°F and the cooling setpoints is set back to 85°F during unoccupied periods. The fan schedule is set to operate with a one hour purge cycle prior to occupancy. Parametric 2. Fan mode. The procedure used to simulate savings for this parametric was to simulate constant fan operation during occupied hours, and simulate intermittent fan operation during unoccupied hours in all buildings in the database. Parametric 3. Economizer. Economizers were disabled in the as built run randomly throughout the database to reflect the failure rate observed during the field testing. This parametric restored all economizers to a functioning state. Parametric 4. Ducts. Buildings likely to have ductwork in an unconditioned space were chosen from the NRNC database to represent the type and size of buildings observed in the NBI PIER study and the Statewide BEA NRNC study.4 Overall, 15% of the small packaged systems observed in these studies have ductwork in unconditioned space. The breakdown of building types observed to have ductwork in unconditioned space is as follows:
4 Pacific Gas and Electric Company, "Nonresidential Duct Sealing and Insulation," Codes and Standards Enhancement Initiative Final
Report, May 2003.
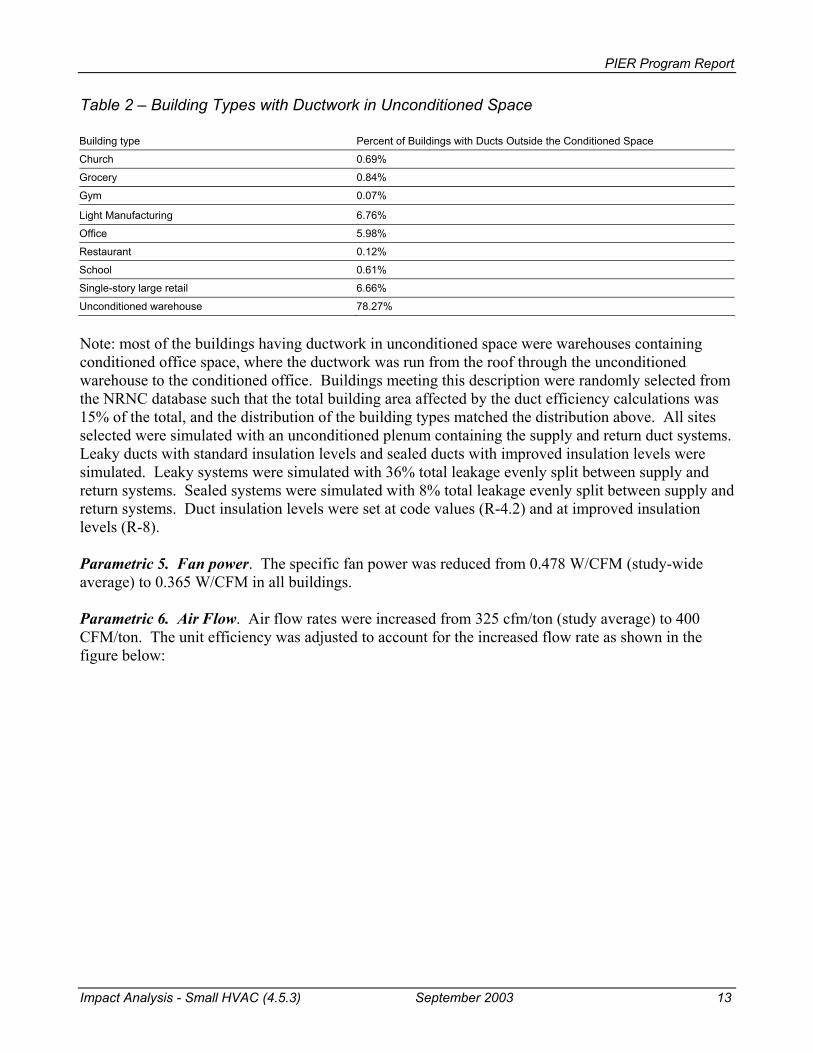
PIER Program Report
Impact Analysis - Small HVAC (4.5.3) September 2003 13
Table 2 – Building Types with Ductwork in Unconditioned Space Building type Percent of Buildings with Ducts Outside the Conditioned Space
Church 0.69%
Grocery 0.84%
Gym 0.07%
Light Manufacturing 6.76%
Office 5.98%
Restaurant 0.12%
School 0.61%
Single-story large retail 6.66%
Unconditioned warehouse 78.27%
Note: most of the buildings having ductwork in unconditioned space were warehouses containing conditioned office space, where the ductwork was run from the roof through the unconditioned warehouse to the conditioned office. Buildings meeting this description were randomly selected from the NRNC database such that the total building area affected by the duct efficiency calculations was 15% of the total, and the distribution of the building types matched the distribution above. All sites selected were simulated with an unconditioned plenum containing the supply and return duct systems. Leaky ducts with standard insulation levels and sealed ducts with improved insulation levels were simulated. Leaky systems were simulated with 36% total leakage evenly split between supply and return systems. Sealed systems were simulated with 8% total leakage evenly split between supply and return systems. Duct insulation levels were set at code values (R-4.2) and at improved insulation levels (R-8). Parametric 5. Fan power. The specific fan power was reduced from 0.478 W/CFM (study-wide average) to 0.365 W/CFM in all buildings. Parametric 6. Air Flow. Air flow rates were increased from 325 cfm/ton (study average) to 400 CFM/ton. The unit efficiency was adjusted to account for the increased flow rate as shown in the figure below:

PIER Program Report
Impact Analysis - Small HVAC (4.5.3) September 2003 14
0
0.2
0.4
0.6
0.8
1
1.2
200 250 300 350 400 450 500
Air flow (cfm/ton)
Nor
mal
ized
Effi
cien
cy
Figure 3 Unit Efficiency as a Function of Air Flow Rate The HVAC unit cooling and heating efficiency was increased by 6.6% due to the increased flow rate. Fan energy was also increased in proportion to the increased air flow rate. Parametric 7. Refrigerant Charge. The impact of correcting the refrigerant charge was simulated by applying a multiplier to the unit efficiency to count for the impact of correcting the refrigerant charge on unit efficiency. The impact of unit efficiency on charge is shown in Figure 4.
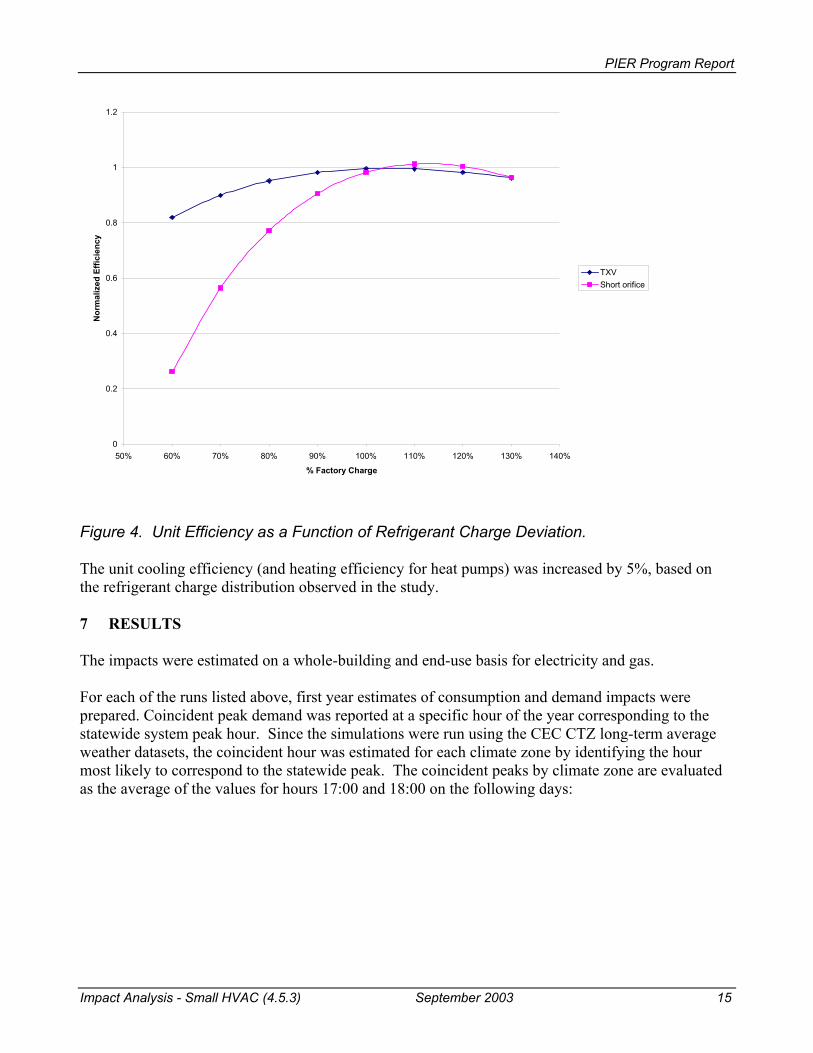
PIER Program Report
Impact Analysis - Small HVAC (4.5.3) September 2003 15
Figure 4. Unit Efficiency as a Function of Refrigerant Charge Deviation. The unit cooling efficiency (and heating efficiency for heat pumps) was increased by 5%, based on the refrigerant charge distribution observed in the study. 7 RESULTS The impacts were estimated on a whole-building and end-use basis for electricity and gas. For each of the runs listed above, first year estimates of consumption and demand impacts were prepared. Coincident peak demand was reported at a specific hour of the year corresponding to the statewide system peak hour. Since the simulations were run using the CEC CTZ long-term average weather datasets, the coincident hour was estimated for each climate zone by identifying the hour most likely to correspond to the statewide peak. The coincident peaks by climate zone are evaluated as the average of the values for hours 17:00 and 18:00 on the following days:
0
0.2
0.4
0.6
0.8
1
1.2
50% 60% 70% 80% 90% 100% 110% 120% 130% 140%
% Factory Charge
Nor
mal
ized
Effi
cien
cy
TXVShort orifice

PIER Program Report
Impact Analysis - Small HVAC (4.5.3) September 2003 16
Table 3 – Day of Year for Coincident Peak Analysis CTZ Month Day (1995 Calendar)
1 7 21
2 7 24
3 7 18
4 7 18
5 9 5
6 9 8
7 7 31
8 7 20
9 8 8
10 8 14
11 8 3
12 7 24
13 8 15
14 8 7
15 7 21
16 8 7
The coincident demand value is reported by end-use, since the estimate is calculated at a particular hour of the year for all end-uses.
The first year results are summarized in Table 4. The end-uses are defined as follows: • Whole building: Impact on electricity consumption and demand for all affected end-uses. • Heating: Impact on electricity consumption and demand for the heating end-use. This is primarily
derived from efficiency improvements applied to heat pumps. • Cooling: Impact on electricity consumption and demand for the cooling end-use. This includes
compressor and condenser fan energy consumption from packaged air conditioning systems, but excludes building fans.
• Fan: Impact on electricity consumption and demand for building circulation fans.
Note: When fan energy and air flow are corrected the energy use increases (creating a savings "penalty" to accomplish effective ventilation requirements). The subsequent energy savings of the other measures with these corrected items is greater then they are singularly resulting in an interactive total savings that exceeds the sum of the measures.
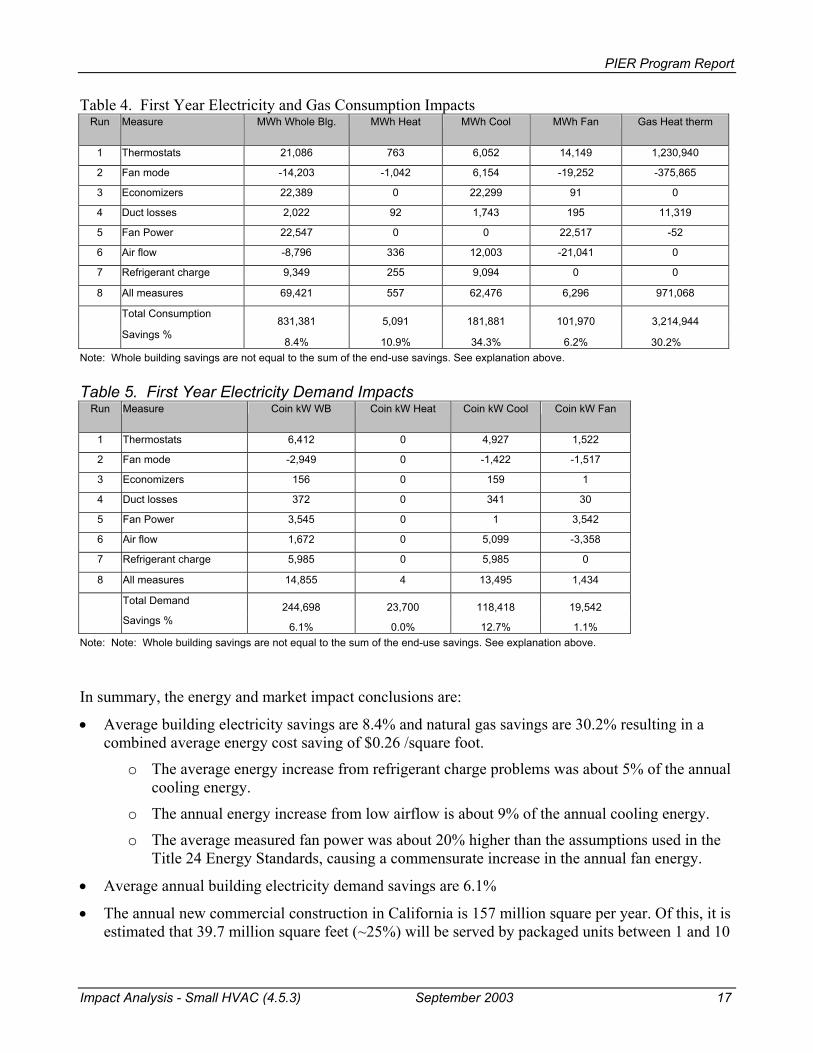
PIER Program Report
Impact Analysis - Small HVAC (4.5.3) September 2003 17
Table 4. First Year Electricity and Gas Consumption Impacts Run Measure MWh Whole Blg. MWh Heat MWh Cool MWh Fan Gas Heat therm
1 Thermostats 21,086 763 6,052 14,149 1,230,940
2 Fan mode -14,203 -1,042 6,154 -19,252 -375,865
3 Economizers 22,389 0 22,299 91 0
4 Duct losses 2,022 92 1,743 195 11,319
5 Fan Power 22,547 0 0 22,517 -52
6 Air flow -8,796 336 12,003 -21,041 0
7 Refrigerant charge 9,349 255 9,094 0 0
8 All measures 69,421 557 62,476 6,296 971,068
Total Consumption 831,381 5,091 181,881 101,970 3,214,944
Savings % 8.4% 10.9% 34.3% 6.2% 30.2%
Note: Whole building savings are not equal to the sum of the end-use savings. See explanation above.
Table 5. First Year Electricity Demand Impacts Run Measure Coin kW WB Coin kW Heat Coin kW Cool Coin kW Fan
1 Thermostats 6,412 0 4,927 1,522
2 Fan mode -2,949 0 -1,422 -1,517
3 Economizers 156 0 159 1
4 Duct losses 372 0 341 30
5 Fan Power 3,545 0 1 3,542
6 Air flow 1,672 0 5,099 -3,358
7 Refrigerant charge 5,985 0 5,985 0
8 All measures 14,855 4 13,495 1,434
Total Demand 244,698 23,700 118,418 19,542 Savings % 6.1% 0.0% 12.7% 1.1%
Note: Note: Whole building savings are not equal to the sum of the end-use savings. See explanation above.
In summary, the energy and market impact conclusions are:
• Average building electricity savings are 8.4% and natural gas savings are 30.2% resulting in a combined average energy cost saving of $0.26 /square foot.
o The average energy increase from refrigerant charge problems was about 5% of the annual cooling energy.
o The annual energy increase from low airflow is about 9% of the annual cooling energy.
o The average measured fan power was about 20% higher than the assumptions used in the Title 24 Energy Standards, causing a commensurate increase in the annual fan energy.
• Average annual building electricity demand savings are 6.1%
• The annual new commercial construction in California is 157 million square per year. Of this, it is estimated that 39.7 million square feet (~25%) will be served by packaged units between 1 and 10

PIER Program Report
Impact Analysis - Small HVAC (4.5.3) September 2003 18
tons in size. With a first year market penetration of 10%, annual energy savings are estimated to be 6,942 MWh. With an increase in market penetration of 1% per year, the ten year cumulative electric energy savings is 496,360 MWhs equal to energy cost savings over this period of $68 million.
• Statewide demand savings are estimated at 1,486 kW per year (1.5 MW) based on a first year market penetration of 10%. With an increase in market penetration of 1% per year, the demand savings in year ten is 21.5 MW.
• The natural gas savings are estimated to be 97,107 therms first year savings resulting in a cumulative 10 year savings of 6,943,000 therms and a resulting cost savings of $5.8 million.
• The total net energy benefits over ten years to citizens of California would be $73.8 million.

NBI Pier Element Four Impact Analysis Appendix A.
1
APPENDIX A – COMPUTER MODELING ASSUMPTIONS This appendix describes the basic approach used by the SurveyIT/ModelIT software to generate DOE-2 models from building survey data in the NRNC database.
SURVEYIT/MODELIT DESCRIPTION SurveyIT is a Microsoft Access application that contains a user interface for entering building description information. SurveyIT contains a series of relational data tables that store information for multiple buildings, and Visual Basic code that interfaces with the ModelIT software. ModelIT is C++ code that reads SurveyIT data tables and automatically creates a DOE-2 input file for each building in the database. Building description data sources include the on-site survey, building design documents, Title 24 documents, and manufacturers’ catalog data. Once the basic building is described and an as-built DOE-2 model is created, the modeling software also creates additional DOE-2 input files for each of the building parametric runs.
The software is designed to create DOE-2 BDL (building description language) files that are recognized by DOE-2.2. The version of DOE-2.2 used for this project is Beta 2.2-41c. The data elements used, default assumptions, and engineering calculations are described for the Loads and Systems portions of the DOE-2.2 input file in the following sections.
LOADS Preliminary data required by the LOADS program are assigned as summarized below:
DOE-2 Input Value Comments
RUN-PERIOD
JAN 1 1995 THRU DEC 31 1995
ALTITUDE Altitude assigned to each building according to location
GROSS-AREA Sum of all surveyed area
DAYLIGHT-SAVINGS YES
HOLIDAYS New Years = Jan 2
MLK day = Jan 10
Presidents day = Feb 20
Memorial day = May 29
July 4th = July 4
Labor day = Sep 4
Columbus day = Oct 23
Thanksgiving = Nov 23
Christmas = Dec 25
Holidays observed at site taken from on-site survey.

NBI Pier Element Four Impact Analysis Appendix A.
2
SCHEDULES
Schedules are created for each zone in the model by associating the zones defined in the on-site survey with the appropriate functional area, and assigning the schedule defined for each functional area to the appropriate zone. Hourly schedules are created by the software on a zone-by-zone basis for:
• Occupancy
• Lighting
• Electric equipment
• Gas equipment (primarily kitchen equipment)
• Solar glare
• Window shading
• Infiltration
Occupancy, lighting, and equipment schedules. Each day of the week is assigned to a particular daytype, as reported by the surveyor. Hourly values for each day of the week are extracted from the on-site database according to the appropriate daytype. These values are modified on a monthly basis, according to the monthly building occupancy history. The basic format of the schedules is shown below:
THRU JAN 31
(MON) (1)( hour 1 schedule value for Monday daytype * monthly occupancy adjustment)
(2)( hour 2 schedule value for Monday daytype * monthly occupancy adjustment)
(3)(__)..
(24)(__)
(TUE) (1)( hour 1 schedule value for Tuesday daytype * monthly occupancy adjustment)
(2)( hour 2 schedule value for Tuesday daytype * monthly occupancy adjustment)
(3)(__)..
(24)(__)
THRU FEB 28…
ETC.

NBI Pier Element Four Impact Analysis Appendix A.
3
Solar and shading schedules. The use of blinds by the occupants is simulated by the use of solar and shading schedules. The glass shading coefficient values are modified to account for the use of interior shading devices as shown below:
Shading type Adjustment Comments
Blinds 0.78 89 ASHRAE Handbook of Fundamentals, pg. 27.30 Table 25 for 0.6 SC, avg. multiplier
Light shades 0.72 89 ASHRAE Handbook of Fundamentals, pg. 27.31 Table 29 for 0.6 SC, “F”
Dark shades 0.82 89 ASHRAE Handbook of Fundamentals pg. 27.31 Table 29 for 0.6 SC, “D”
The adjustment value schedule are determined from the interview response, as shown below:
Interview response Schedule
Always open No adjustment
Always closed Adjustment factors applied to all hours
Operated by occupants to control comfort Deployed when solar radiation exceeds seasonal threshold value
Open when space is occupied Follows zone occupancy schedule
When the shades are operated by occupants to control comfort, the threshold values of solar radiation incident on the glazing surface are defined as follows:
Season Dates Value
Winter Jan 1 - Mar 31, Nov 1 - Dec 31 50 Btu/hr-SF
Summer May 1 - Oct 31 15 Btu/hr-SF
Infiltration schedule. The infiltration schedule is established from the fan system schedule. Infiltration is scheduled “off” when the fan system operated, and is scheduled “on” when the fan system is off.
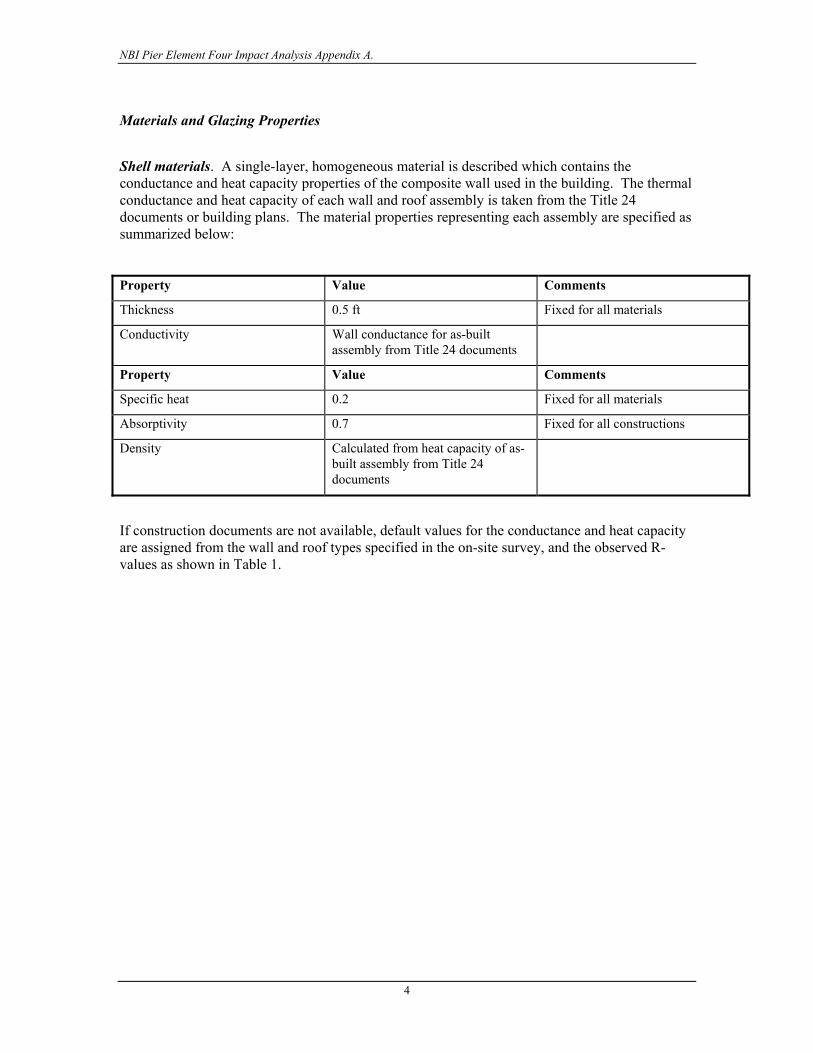
NBI Pier Element Four Impact Analysis Appendix A.
4
Materials and Glazing Properties
Shell materials. A single-layer, homogeneous material is described which contains the conductance and heat capacity properties of the composite wall used in the building. The thermal conductance and heat capacity of each wall and roof assembly is taken from the Title 24 documents or building plans. The material properties representing each assembly are specified as summarized below:
Property Value Comments
Thickness 0.5 ft Fixed for all materials
Conductivity Wall conductance for as-built assembly from Title 24 documents
Property Value Comments
Specific heat 0.2 Fixed for all materials
Absorptivity 0.7 Fixed for all constructions
Density Calculated from heat capacity of as-built assembly from Title 24 documents
If construction documents are not available, default values for the conductance and heat capacity are assigned from the wall and roof types specified in the on-site survey, and the observed R-values as shown in Table 1.
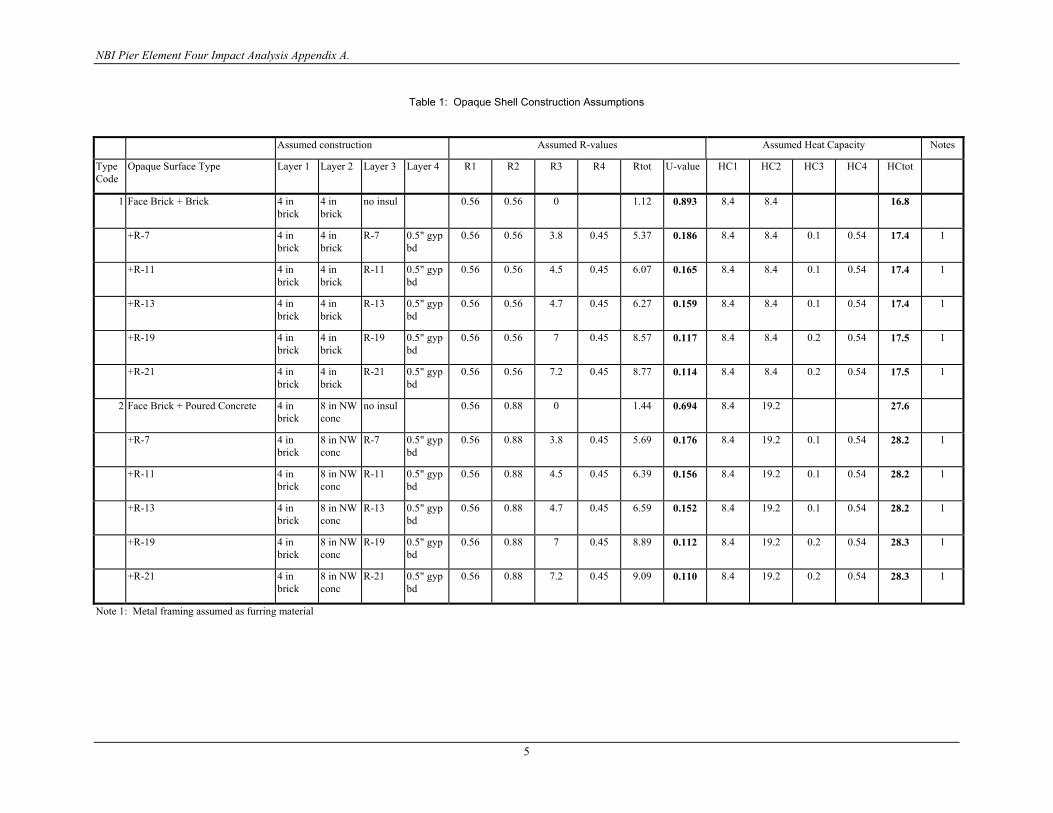
NBI Pier Element Four Impact Analysis Appendix A.
5
Table 1: Opaque Shell Construction Assumptions
Assumed construction Assumed R-values Assumed Heat Capacity Notes
Type Code
Opaque Surface Type Layer 1 Layer 2 Layer 3 Layer 4 R1 R2 R3 R4 Rtot U-value HC1 HC2 HC3 HC4 HCtot
1 Face Brick + Brick 4 in brick
4 in brick
no insul 0.56 0.56 0 1.12 0.893 8.4 8.4 16.8
+R-7 4 in brick
4 in brick
R-7 0.5" gyp bd
0.56 0.56 3.8 0.45 5.37 0.186 8.4 8.4 0.1 0.54 17.4 1
+R-11 4 in brick
4 in brick
R-11 0.5" gyp bd
0.56 0.56 4.5 0.45 6.07 0.165 8.4 8.4 0.1 0.54 17.4 1
+R-13 4 in brick
4 in brick
R-13 0.5" gyp bd
0.56 0.56 4.7 0.45 6.27 0.159 8.4 8.4 0.1 0.54 17.4 1
+R-19 4 in brick
4 in brick
R-19 0.5" gyp bd
0.56 0.56 7 0.45 8.57 0.117 8.4 8.4 0.2 0.54 17.5 1
+R-21 4 in brick
4 in brick
R-21 0.5" gyp bd
0.56 0.56 7.2 0.45 8.77 0.114 8.4 8.4 0.2 0.54 17.5 1
2 Face Brick + Poured Concrete 4 in brick
8 in NW conc
no insul 0.56 0.88 0 1.44 0.694 8.4 19.2 27.6
+R-7 4 in brick
8 in NW conc
R-7 0.5" gyp bd
0.56 0.88 3.8 0.45 5.69 0.176 8.4 19.2 0.1 0.54 28.2 1
+R-11 4 in brick
8 in NW conc
R-11 0.5" gyp bd
0.56 0.88 4.5 0.45 6.39 0.156 8.4 19.2 0.1 0.54 28.2 1
+R-13 4 in brick
8 in NW conc
R-13 0.5" gyp bd
0.56 0.88 4.7 0.45 6.59 0.152 8.4 19.2 0.1 0.54 28.2 1
+R-19 4 in brick
8 in NW conc
R-19 0.5" gyp bd
0.56 0.88 7 0.45 8.89 0.112 8.4 19.2 0.2 0.54 28.3 1
+R-21 4 in brick
8 in NW conc
R-21 0.5" gyp bd
0.56 0.88 7.2 0.45 9.09 0.110 8.4 19.2 0.2 0.54 28.3 1
Note 1: Metal framing assumed as furring material
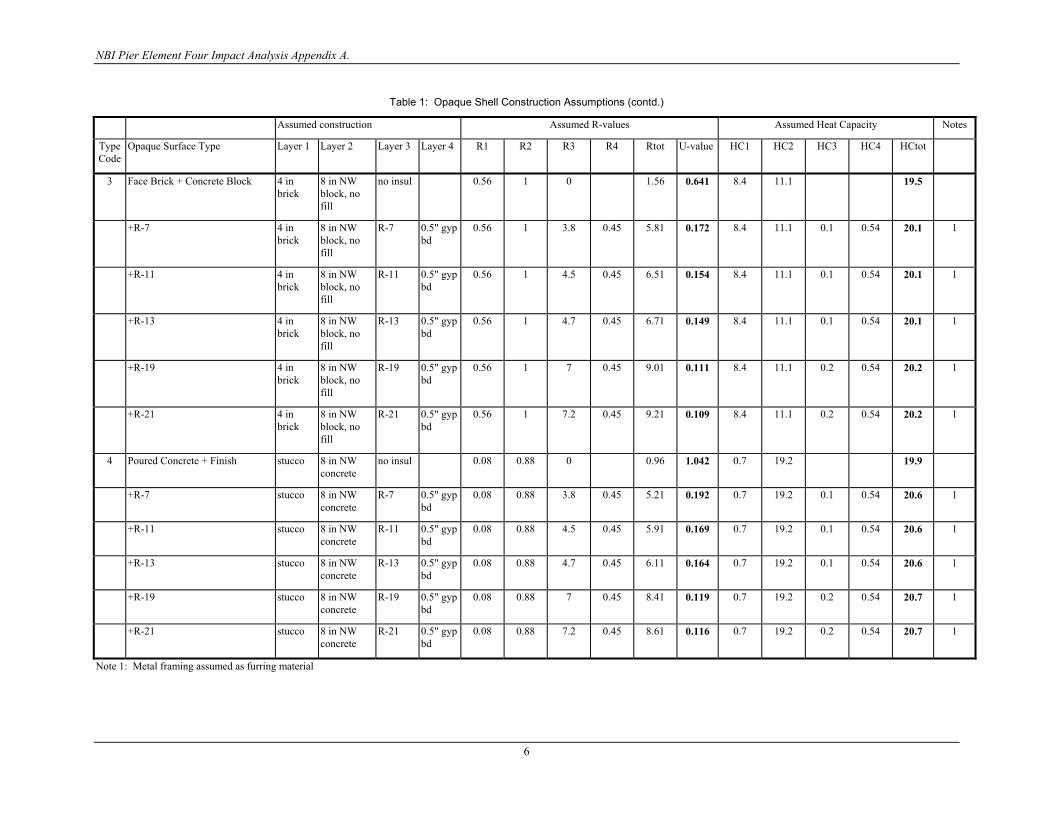
NBI Pier Element Four Impact Analysis Appendix A.
6
Table 1: Opaque Shell Construction Assumptions (contd.)
Assumed construction Assumed R-values Assumed Heat Capacity Notes
Type Code
Opaque Surface Type Layer 1 Layer 2 Layer 3 Layer 4 R1 R2 R3 R4 Rtot U-value HC1 HC2 HC3 HC4 HCtot
3 Face Brick + Concrete Block 4 in brick
8 in NW block, no fill
no insul 0.56 1 0 1.56 0.641 8.4 11.1 19.5
+R-7 4 in brick
8 in NW block, no fill
R-7 0.5" gyp bd
0.56 1 3.8 0.45 5.81 0.172 8.4 11.1 0.1 0.54 20.1 1
+R-11 4 in brick
8 in NW block, no fill
R-11 0.5" gyp bd
0.56 1 4.5 0.45 6.51 0.154 8.4 11.1 0.1 0.54 20.1 1
+R-13 4 in brick
8 in NW block, no fill
R-13 0.5" gyp bd
0.56 1 4.7 0.45 6.71 0.149 8.4 11.1 0.1 0.54 20.1 1
+R-19 4 in brick
8 in NW block, no fill
R-19 0.5" gyp bd
0.56 1 7 0.45 9.01 0.111 8.4 11.1 0.2 0.54 20.2 1
+R-21 4 in brick
8 in NW block, no fill
R-21 0.5" gyp bd
0.56 1 7.2 0.45 9.21 0.109 8.4 11.1 0.2 0.54 20.2 1
4 Poured Concrete + Finish stucco 8 in NW concrete
no insul 0.08 0.88 0 0.96 1.042 0.7 19.2 19.9
+R-7 stucco 8 in NW concrete
R-7 0.5" gyp bd
0.08 0.88 3.8 0.45 5.21 0.192 0.7 19.2 0.1 0.54 20.6 1
+R-11 stucco 8 in NW concrete
R-11 0.5" gyp bd
0.08 0.88 4.5 0.45 5.91 0.169 0.7 19.2 0.1 0.54 20.6 1
+R-13 stucco 8 in NW concrete
R-13 0.5" gyp bd
0.08 0.88 4.7 0.45 6.11 0.164 0.7 19.2 0.1 0.54 20.6 1
+R-19 stucco 8 in NW concrete
R-19 0.5" gyp bd
0.08 0.88 7 0.45 8.41 0.119 0.7 19.2 0.2 0.54 20.7 1
+R-21 stucco 8 in NW concrete
R-21 0.5" gyp bd
0.08 0.88 7.2 0.45 8.61 0.116 0.7 19.2 0.2 0.54 20.7 1
Note 1: Metal framing assumed as furring material

NBI Pier Element Four Impact Analysis Appendix A.
7
Table 1: Opaque Shell Construction Assumptions (contd.)
Assumed construction Assumed R-values Assumed Heat Capacity Notes
Type Code
Opaque Surface Type Layer 1 Layer 2 Layer 3 Layer 4 R1 R2 R3 R4 Rtot U-value HC1 HC2 HC3 HC4 HCtot
5 Concrete Block + Finish stucco 8 in NW block, no
fill
no insul 0.08 1 0 1.08 0.926 0.7 11.1 11.8
+R-7 stucco 8 in NW block, no
fill
R-7 0.5" gyp bd
0.08 1 3.8 0.45 5.33 0.188 0.7 11.1 0.1 0.54 12.5 1
+R-11 stucco 8 in NW block, no
fill
R-11 0.5" gyp bd
0.08 1 4.5 0.45 6.03 0.166 0.7 11.1 0.1 0.54 12.5 1
+R-13 stucco 8 in NW block, no
fill
R-13 0.5" gyp bd
0.08 1 4.7 0.45 6.23 0.161 0.7 11.1 0.1 0.54 12.5 1
+R-19 stucco 8 in NW block, no
fill
R-19 0.5" gyp bd
0.08 1 7 0.45 8.53 0.117 0.7 11.1 0.2 0.54 12.6 1
+R-21 stucco 8 in NW block, no
fill
R-21 0.5" gyp bd
0.08 1 7.2 0.45 8.73 0.115 0.7 11.1 0.2 0.54 12.6 1
6 Wood Frame Wall
R-11 .5 in hb siding
.5 in pw sheath
R-11 0.5" gyp bd
0.5 0.62 8.75 0.56 10.43 0.096 0.84 0.41 1.27 0.54 3.1 2
R-13 .5 in hb siding
.5 in pw sheath
R-13 0.5" gyp bd
0.5 0.62 10.15 0.56 11.83 0.085 0.84 0.41 1.27 0.54 3.1 2
R-19 .5 in hb siding
.5 in pw sheath
R-19 0.5" gyp bd
0.5 0.62 15.025 0.56 16.705 0.060 0.84 0.41 2.102 0.54 3.9 3
R-21 .5 in hb siding
.5 in pw sheath
R-21 0.5" gyp bd
0.5 0.62 16.425 0.56 18.105 0.055 0.84 0.41 2.102 0.54 3.9 3
Note 1: Metal framing assumed as furring material Note 2: 2x4 construction , 16 in. O.C. assumed
Note 3: 2x6 construction, 24 in. O.C. assumed.
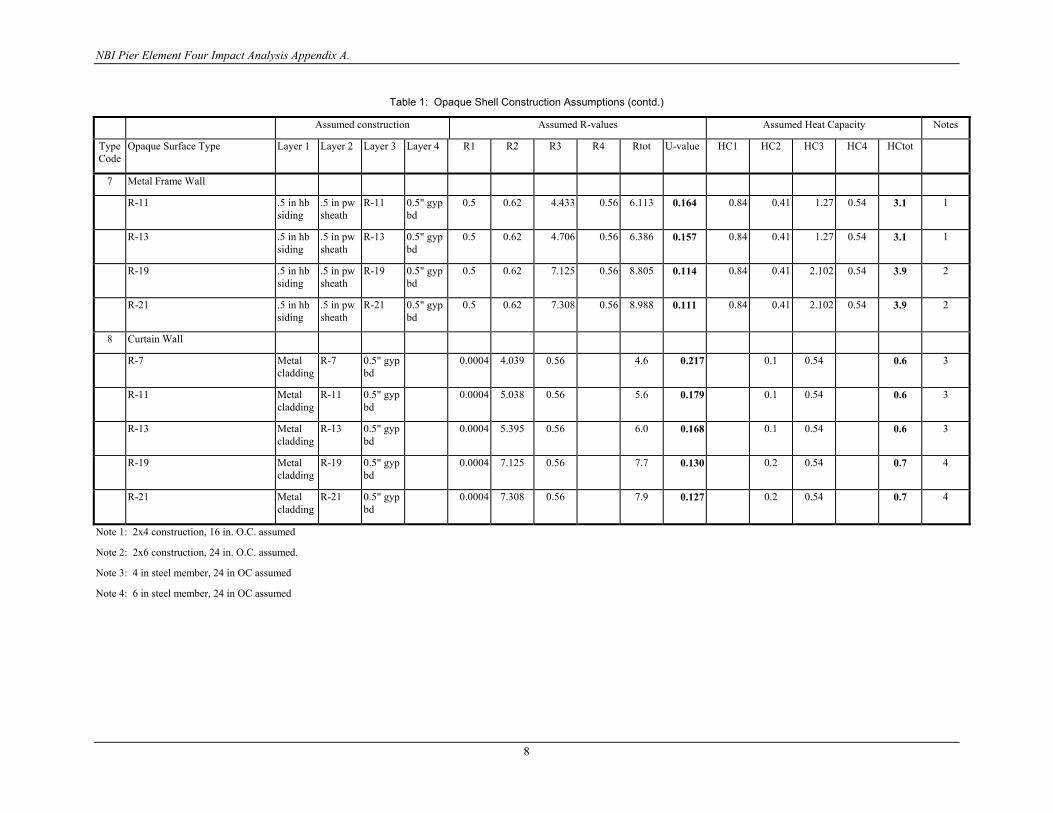
NBI Pier Element Four Impact Analysis Appendix A.
8
Table 1: Opaque Shell Construction Assumptions (contd.)
Assumed construction Assumed R-values Assumed Heat Capacity Notes
Type Code
Opaque Surface Type Layer 1 Layer 2 Layer 3 Layer 4 R1 R2 R3 R4 Rtot U-value HC1 HC2 HC3 HC4 HCtot
7 Metal Frame Wall
R-11 .5 in hb siding
.5 in pw sheath
R-11 0.5" gyp bd
0.5 0.62 4.433 0.56 6.113 0.164 0.84 0.41 1.27 0.54 3.1 1
R-13 .5 in hb siding
.5 in pw sheath
R-13 0.5" gyp bd
0.5 0.62 4.706 0.56 6.386 0.157 0.84 0.41 1.27 0.54 3.1 1
R-19 .5 in hb siding
.5 in pw sheath
R-19 0.5" gyp bd
0.5 0.62 7.125 0.56 8.805 0.114 0.84 0.41 2.102 0.54 3.9 2
R-21 .5 in hb siding
.5 in pw sheath
R-21 0.5" gyp bd
0.5 0.62 7.308 0.56 8.988 0.111 0.84 0.41 2.102 0.54 3.9 2
8 Curtain Wall
R-7 Metal cladding
R-7 0.5" gyp bd
0.0004 4.039 0.56 4.6 0.217 0.1 0.54 0.6 3
R-11 Metal cladding
R-11 0.5" gyp bd
0.0004 5.038 0.56 5.6 0.179 0.1 0.54 0.6 3
R-13 Metal cladding
R-13 0.5" gyp bd
0.0004 5.395 0.56 6.0 0.168 0.1 0.54 0.6 3
R-19 Metal cladding
R-19 0.5" gyp bd
0.0004 7.125 0.56 7.7 0.130 0.2 0.54 0.7 4
R-21 Metal cladding
R-21 0.5" gyp bd
0.0004 7.308 0.56 7.9 0.127 0.2 0.54 0.7 4
Note 1: 2x4 construction, 16 in. O.C. assumed
Note 2: 2x6 construction, 24 in. O.C. assumed.
Note 3: 4 in steel member, 24 in OC assumed
Note 4: 6 in steel member, 24 in OC assumed

NBI Pier Element Four Impact Analysis Appendix A.
9
Table 1: Opaque Shell Construction Assumptions (contd.)
Assumed construction Assumed R-values Assumed Heat Capacity Notes
Type Code
Opaque Surface Type Layer 1 Layer 2 Layer 3 R1 R2 R3 Rtot U-value HC1 HC2 HC3 HCtot
9 Open 2.7 0
10 Concrete Deck Roof. Membrane 8 in LW conc
0.33 1.76 2.1 0.478 0.76 19.2 20.0
+R-5 Membrane R-5 8 in LW conc
0.33 5 1.76 7.1 0.141 0.76 0.1 19.2 20.1
+R-10 Membrane R-10 8 in LW conc
0.33 10 1.76 12.1 0.083 0.76 0.1 19.2 20.1
+R-15 Membrane R-15 8 in LW conc
0.33 15 1.76 17.1 0.059 0.76 0.1 19.2 20.1
+R-20 Membrane R-20 8 in LW conc
0.33 20 1.76 22.1 0.045 0.76 0.2 19.2 20.2
+R-25 Membrane R-25 8 in LW conc
0.33 25 1.76 27.1 0.037 0.76 0.2 19.2 20.2
+R-30 Membrane R-30 8 in LW conc
0.33 30 1.76 32.1 0.031 0.76 0.2 19.2 20.2
+R-35 Membrane R-35 8 in LW conc
0.33 35 1.76 37.1 0.027 0.76 0.2 19.2 20.2
+R-40 Membrane R-40 8 in LW conc
0.33 40 1.76 42.1 0.024 0.76 0.2 19.2 20.2
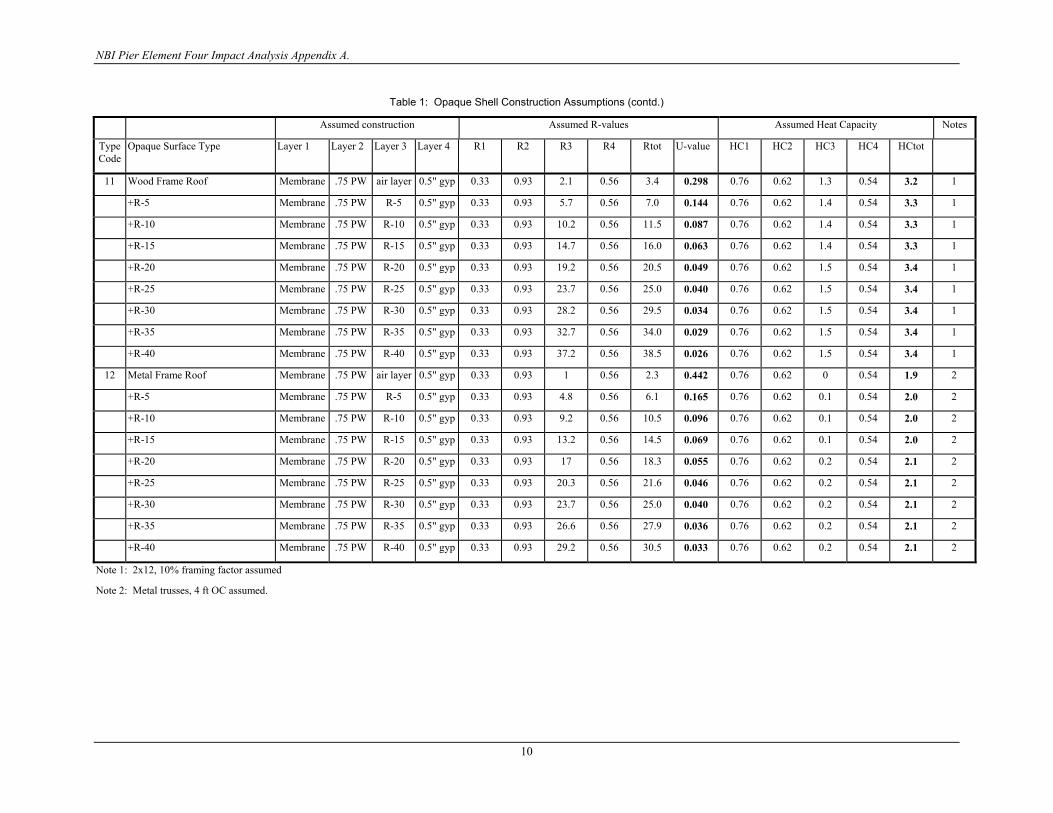
NBI Pier Element Four Impact Analysis Appendix A.
10
Table 1: Opaque Shell Construction Assumptions (contd.)
Assumed construction Assumed R-values Assumed Heat Capacity Notes
Type Code
Opaque Surface Type Layer 1 Layer 2 Layer 3 Layer 4 R1 R2 R3 R4 Rtot U-value HC1 HC2 HC3 HC4 HCtot
11 Wood Frame Roof Membrane .75 PW air layer 0.5" gyp 0.33 0.93 2.1 0.56 3.4 0.298 0.76 0.62 1.3 0.54 3.2 1
+R-5 Membrane .75 PW R-5 0.5" gyp 0.33 0.93 5.7 0.56 7.0 0.144 0.76 0.62 1.4 0.54 3.3 1
+R-10 Membrane .75 PW R-10 0.5" gyp 0.33 0.93 10.2 0.56 11.5 0.087 0.76 0.62 1.4 0.54 3.3 1
+R-15 Membrane .75 PW R-15 0.5" gyp 0.33 0.93 14.7 0.56 16.0 0.063 0.76 0.62 1.4 0.54 3.3 1
+R-20 Membrane .75 PW R-20 0.5" gyp 0.33 0.93 19.2 0.56 20.5 0.049 0.76 0.62 1.5 0.54 3.4 1
+R-25 Membrane .75 PW R-25 0.5" gyp 0.33 0.93 23.7 0.56 25.0 0.040 0.76 0.62 1.5 0.54 3.4 1
+R-30 Membrane .75 PW R-30 0.5" gyp 0.33 0.93 28.2 0.56 29.5 0.034 0.76 0.62 1.5 0.54 3.4 1
+R-35 Membrane .75 PW R-35 0.5" gyp 0.33 0.93 32.7 0.56 34.0 0.029 0.76 0.62 1.5 0.54 3.4 1
+R-40 Membrane .75 PW R-40 0.5" gyp 0.33 0.93 37.2 0.56 38.5 0.026 0.76 0.62 1.5 0.54 3.4 1
12 Metal Frame Roof Membrane .75 PW air layer 0.5" gyp 0.33 0.93 1 0.56 2.3 0.442 0.76 0.62 0 0.54 1.9 2
+R-5 Membrane .75 PW R-5 0.5" gyp 0.33 0.93 4.8 0.56 6.1 0.165 0.76 0.62 0.1 0.54 2.0 2
+R-10 Membrane .75 PW R-10 0.5" gyp 0.33 0.93 9.2 0.56 10.5 0.096 0.76 0.62 0.1 0.54 2.0 2
+R-15 Membrane .75 PW R-15 0.5" gyp 0.33 0.93 13.2 0.56 14.5 0.069 0.76 0.62 0.1 0.54 2.0 2
+R-20 Membrane .75 PW R-20 0.5" gyp 0.33 0.93 17 0.56 18.3 0.055 0.76 0.62 0.2 0.54 2.1 2
+R-25 Membrane .75 PW R-25 0.5" gyp 0.33 0.93 20.3 0.56 21.6 0.046 0.76 0.62 0.2 0.54 2.1 2
+R-30 Membrane .75 PW R-30 0.5" gyp 0.33 0.93 23.7 0.56 25.0 0.040 0.76 0.62 0.2 0.54 2.1 2
+R-35 Membrane .75 PW R-35 0.5" gyp 0.33 0.93 26.6 0.56 27.9 0.036 0.76 0.62 0.2 0.54 2.1 2
+R-40 Membrane .75 PW R-40 0.5" gyp 0.33 0.93 29.2 0.56 30.5 0.033 0.76 0.62 0.2 0.54 2.1 2
Note 1: 2x12, 10% framing factor assumed
Note 2: Metal trusses, 4 ft OC assumed.
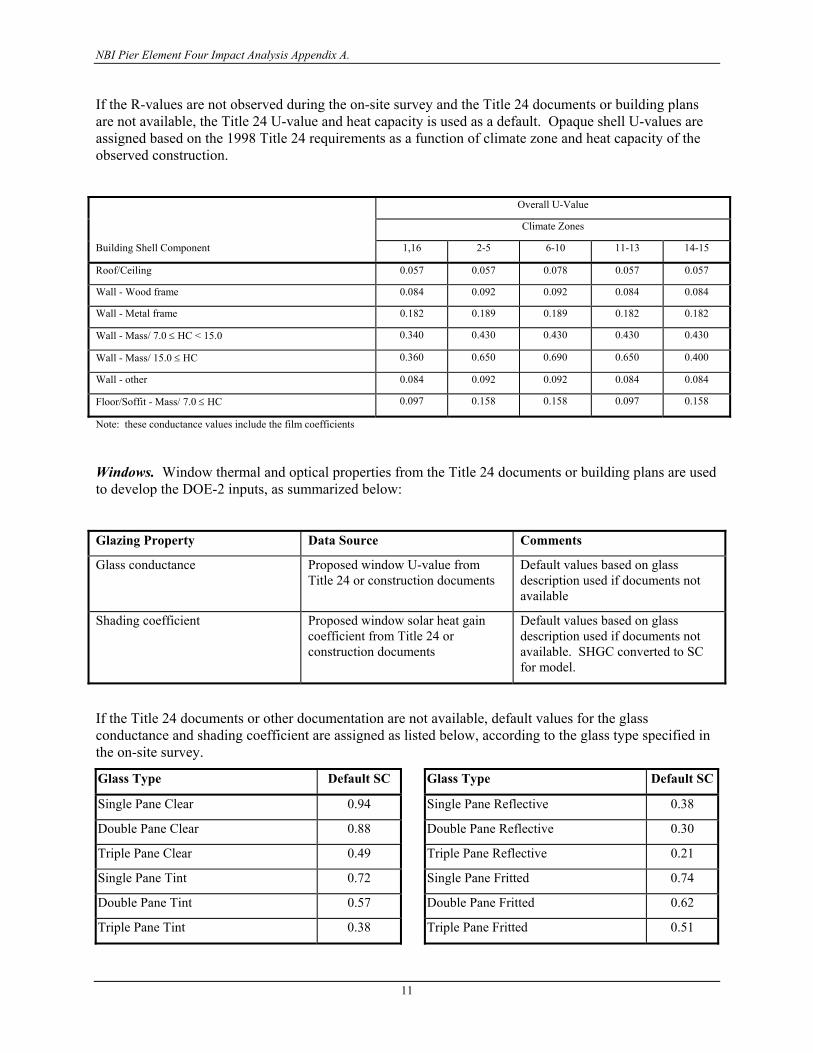
NBI Pier Element Four Impact Analysis Appendix A.
11
If the R-values are not observed during the on-site survey and the Title 24 documents or building plans are not available, the Title 24 U-value and heat capacity is used as a default. Opaque shell U-values are assigned based on the 1998 Title 24 requirements as a function of climate zone and heat capacity of the observed construction.
Overall U-Value
Climate Zones
Building Shell Component 1,16 2-5 6-10 11-13 14-15
Roof/Ceiling 0.057 0.057 0.078 0.057 0.057
Wall - Wood frame 0.084 0.092 0.092 0.084 0.084
Wall - Metal frame 0.182 0.189 0.189 0.182 0.182
Wall - Mass/ 7.0 ≤ HC < 15.0 0.340 0.430 0.430 0.430 0.430
Wall - Mass/ 15.0 ≤ HC 0.360 0.650 0.690 0.650 0.400
Wall - other 0.084 0.092 0.092 0.084 0.084
Floor/Soffit - Mass/ 7.0 ≤ HC 0.097 0.158 0.158 0.097 0.158
Note: these conductance values include the film coefficients
Windows. Window thermal and optical properties from the Title 24 documents or building plans are used to develop the DOE-2 inputs, as summarized below:
Glazing Property Data Source Comments
Glass conductance Proposed window U-value from Title 24 or construction documents
Default values based on glass description used if documents not available
Shading coefficient Proposed window solar heat gain coefficient from Title 24 or construction documents
Default values based on glass description used if documents not available. SHGC converted to SC for model.
If the Title 24 documents or other documentation are not available, default values for the glass conductance and shading coefficient are assigned as listed below, according to the glass type specified in the on-site survey.
Glass Type Default SC Glass Type Default SC
Single Pane Clear 0.94 Single Pane Reflective 0.38
Double Pane Clear 0.88 Double Pane Reflective 0.30
Triple Pane Clear 0.49 Triple Pane Reflective 0.21
Single Pane Tint 0.72 Single Pane Fritted 0.74
Double Pane Tint 0.57 Double Pane Fritted 0.62
Triple Pane Tint 0.38 Triple Pane Fritted 0.51
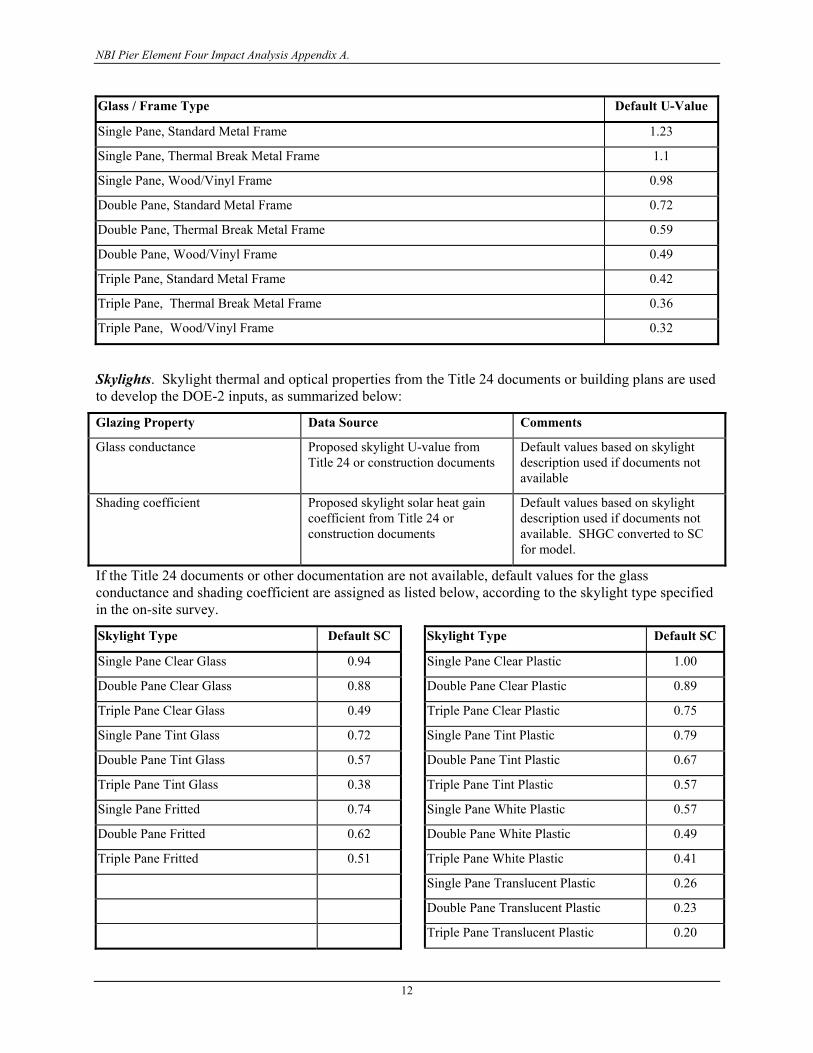
NBI Pier Element Four Impact Analysis Appendix A.
12
Glass / Frame Type Default U-Value
Single Pane, Standard Metal Frame 1.23
Single Pane, Thermal Break Metal Frame 1.1
Single Pane, Wood/Vinyl Frame 0.98
Double Pane, Standard Metal Frame 0.72
Double Pane, Thermal Break Metal Frame 0.59
Double Pane, Wood/Vinyl Frame 0.49
Triple Pane, Standard Metal Frame 0.42
Triple Pane, Thermal Break Metal Frame 0.36
Triple Pane, Wood/Vinyl Frame 0.32
Skylights. Skylight thermal and optical properties from the Title 24 documents or building plans are used to develop the DOE-2 inputs, as summarized below:
Glazing Property Data Source Comments
Glass conductance Proposed skylight U-value from Title 24 or construction documents
Default values based on skylight description used if documents not available
Shading coefficient Proposed skylight solar heat gain coefficient from Title 24 or construction documents
Default values based on skylight description used if documents not available. SHGC converted to SC for model.
If the Title 24 documents or other documentation are not available, default values for the glass conductance and shading coefficient are assigned as listed below, according to the skylight type specified in the on-site survey.
Skylight Type Default SC Skylight Type Default SC
Single Pane Clear Glass 0.94 Single Pane Clear Plastic 1.00
Double Pane Clear Glass 0.88 Double Pane Clear Plastic 0.89
Triple Pane Clear Glass 0.49 Triple Pane Clear Plastic 0.75
Single Pane Tint Glass 0.72 Single Pane Tint Plastic 0.79
Double Pane Tint Glass 0.57 Double Pane Tint Plastic 0.67
Triple Pane Tint Glass 0.38 Triple Pane Tint Plastic 0.57
Single Pane Fritted 0.74 Single Pane White Plastic 0.57
Double Pane Fritted 0.62 Double Pane White Plastic 0.49
Triple Pane Fritted 0.51 Triple Pane White Plastic 0.41
Single Pane Translucent Plastic 0.26
Double Pane Translucent Plastic 0.23
Triple Pane Translucent Plastic 0.20
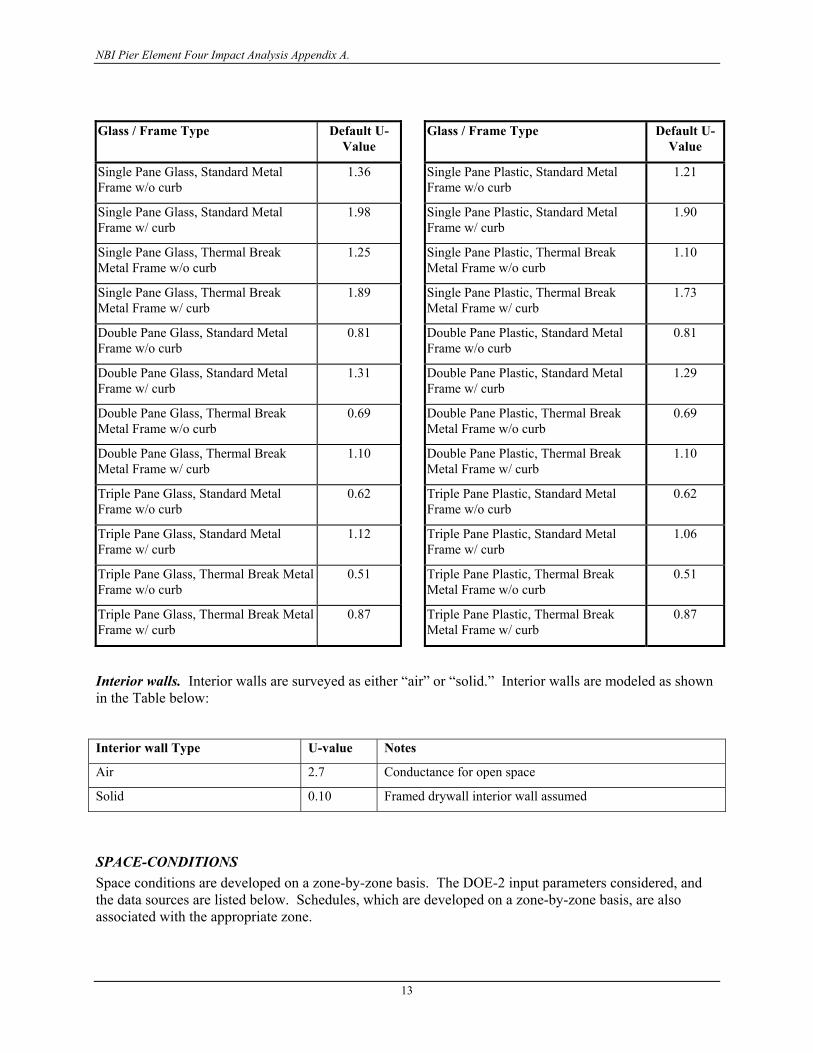
NBI Pier Element Four Impact Analysis Appendix A.
13
Glass / Frame Type Default U-Value
Glass / Frame Type Default U-Value
Single Pane Glass, Standard Metal Frame w/o curb
1.36 Single Pane Plastic, Standard Metal Frame w/o curb
1.21
Single Pane Glass, Standard Metal Frame w/ curb
1.98 Single Pane Plastic, Standard Metal Frame w/ curb
1.90
Single Pane Glass, Thermal Break Metal Frame w/o curb
1.25 Single Pane Plastic, Thermal Break Metal Frame w/o curb
1.10
Single Pane Glass, Thermal Break Metal Frame w/ curb
1.89 Single Pane Plastic, Thermal Break Metal Frame w/ curb
1.73
Double Pane Glass, Standard Metal Frame w/o curb
0.81 Double Pane Plastic, Standard Metal Frame w/o curb
0.81
Double Pane Glass, Standard Metal Frame w/ curb
1.31 Double Pane Plastic, Standard Metal Frame w/ curb
1.29
Double Pane Glass, Thermal Break Metal Frame w/o curb
0.69 Double Pane Plastic, Thermal Break Metal Frame w/o curb
0.69
Double Pane Glass, Thermal Break Metal Frame w/ curb
1.10 Double Pane Plastic, Thermal Break Metal Frame w/ curb
1.10
Triple Pane Glass, Standard Metal Frame w/o curb
0.62 Triple Pane Plastic, Standard Metal Frame w/o curb
0.62
Triple Pane Glass, Standard Metal Frame w/ curb
1.12 Triple Pane Plastic, Standard Metal Frame w/ curb
1.06
Triple Pane Glass, Thermal Break Metal Frame w/o curb
0.51 Triple Pane Plastic, Thermal Break Metal Frame w/o curb
0.51
Triple Pane Glass, Thermal Break Metal Frame w/ curb
0.87 Triple Pane Plastic, Thermal Break Metal Frame w/ curb
0.87
Interior walls. Interior walls are surveyed as either “air” or “solid.” Interior walls are modeled as shown in the Table below:
Interior wall Type U-value Notes
Air 2.7 Conductance for open space
Solid 0.10 Framed drywall interior wall assumed
SPACE-CONDITIONS Space conditions are developed on a zone-by-zone basis. The DOE-2 input parameters considered, and the data sources are listed below. Schedules, which are developed on a zone-by-zone basis, are also associated with the appropriate zone.
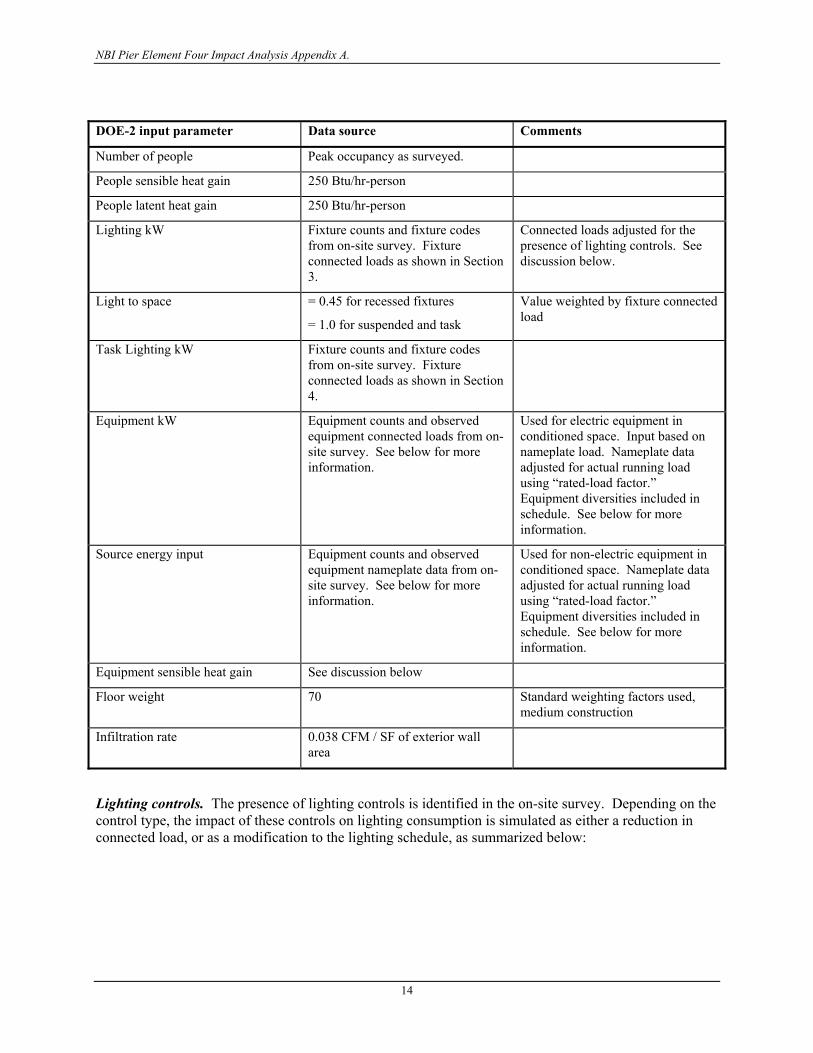
NBI Pier Element Four Impact Analysis Appendix A.
14
DOE-2 input parameter Data source Comments
Number of people Peak occupancy as surveyed.
People sensible heat gain 250 Btu/hr-person
People latent heat gain 250 Btu/hr-person
Lighting kW Fixture counts and fixture codes from on-site survey. Fixture connected loads as shown in Section 3.
Connected loads adjusted for the presence of lighting controls. See discussion below.
Light to space = 0.45 for recessed fixtures
= 1.0 for suspended and task
Value weighted by fixture connected load
Task Lighting kW Fixture counts and fixture codes from on-site survey. Fixture connected loads as shown in Section 4.
Equipment kW Equipment counts and observed equipment connected loads from on-site survey. See below for more information.
Used for electric equipment in conditioned space. Input based on nameplate load. Nameplate data adjusted for actual running load using “rated-load factor.” Equipment diversities included in schedule. See below for more information.
Source energy input Equipment counts and observed equipment nameplate data from on-site survey. See below for more information.
Used for non-electric equipment in conditioned space. Nameplate data adjusted for actual running load using “rated-load factor.” Equipment diversities included in schedule. See below for more information.
Equipment sensible heat gain See discussion below
Floor weight 70 Standard weighting factors used, medium construction
Infiltration rate 0.038 CFM / SF of exterior wall area
Lighting controls. The presence of lighting controls is identified in the on-site survey. Depending on the control type, the impact of these controls on lighting consumption is simulated as either a reduction in connected load, or as a modification to the lighting schedule, as summarized below:

NBI Pier Element Four Impact Analysis Appendix A.
15
Lighting Controls Simulation Approach
Occupancy sensor Reduction in lighting power density of 20% for affected fixtures
Daylighting - continuous dimming DOE-2 “function,” as described below.
Daylighting - stepped DOE-2 “function,” as described below.
Lumen maintenance Reduction in lighting power density of 10% for affected fixtures
Occupancy sensor plus daylighting Reduction in lighting power density of 10% for affected fixtures, plus DOE-2 “function,” as described below.
Occupancy sensor plus lumen maintenance Reduction in lighting power density of 37% for affected fixtures
Daylighting plus lumen maintenance Reduction in lighting power density of 10% for affected fixtures, plus DOE-2 “function,” as described below.
Daylighting controls are simulated using the “functions” utility in the loads portion of DOE-2. Since the geometry of the zone is not fully described, it is not be possible to use the standard DOE-2 algorithms for simulating the daylighting illuminance in the space. A daylight factor, defined as the ratio of the interior illuminance at the daylighting control point to the global horizontal illuminance is estimated for each zone subject to daylighting control. The DOE-2 sky illuminance model calculates separate values for direct sun, clear sky, and overcast sky illuminance. The total exterior horizontal illuminance is simply the sum of each component:
I I I Itotal overcast direct clear= + +
Separate daylight factors are applied for overcast and clear sky sources. The fraction of the total illuminance that comes from the diffuse sky is calculated as follows:
fI
Iovercastovercast
total=
The total interior illuminance at the control point is calculated from:
( )[ ]I I f df f dferior total overcast overcast overcast clearint = × × + − ×1
Default daylight factors are chosen to be typical of sidelighting applications in an enclosed office, as shown below. The values were developed from a set of Lumen-Micro simulations on a typical perimeter office space.

NBI Pier Element Four Impact Analysis Appendix A.
16
Illuminance Source Daylight factor
Clear sky plus direct sun 0.18446
Diffuse sky 0.04252
The interior illuminance is calculated as described above using a DOE-2 “function.” Standard DOE-2 inputs for daylighting control specifications are used to simulate the impacts of daylighting controls on lighting schedules, as shown below:
DOE-2 input parameter Data source Comments
ZONE-FRACTION On-site survey Based on fraction of zone connected load controlled
LIGHT-SET-POINT IES guidelines by occupancy type. Occupancy type as listed in on-site survey
LIGHT-CTRL-TYPE On-site survey Stepped or continuous
LIGHT-CTRL-STEPS 1 On/off if stepped
The IES codes by occupancy type, and minimum illuminance setpoints are shown below:
CODE Occupancy IES category Minimum illuminance (fc)
1 Auditorium C 15
2 Churches/Chapels D 30
3 Conventions, conference, meeting centers D 30
4 Courtrooms C 15
5 Exhibit C 15
6 Main Entry Lobby C 15
7 Motion Picture Theater B 7.5
8 Performance theater B 7.5
9 Bars, cocktail lounges, casinos B 7.5
10 Dining B 7.5
11 Kitchen E 75
12 Bank/financial institution D 30
13 Medical and clinical office (doctor D 30
14 Office - Other D 30
15 Computer Center B 7.5
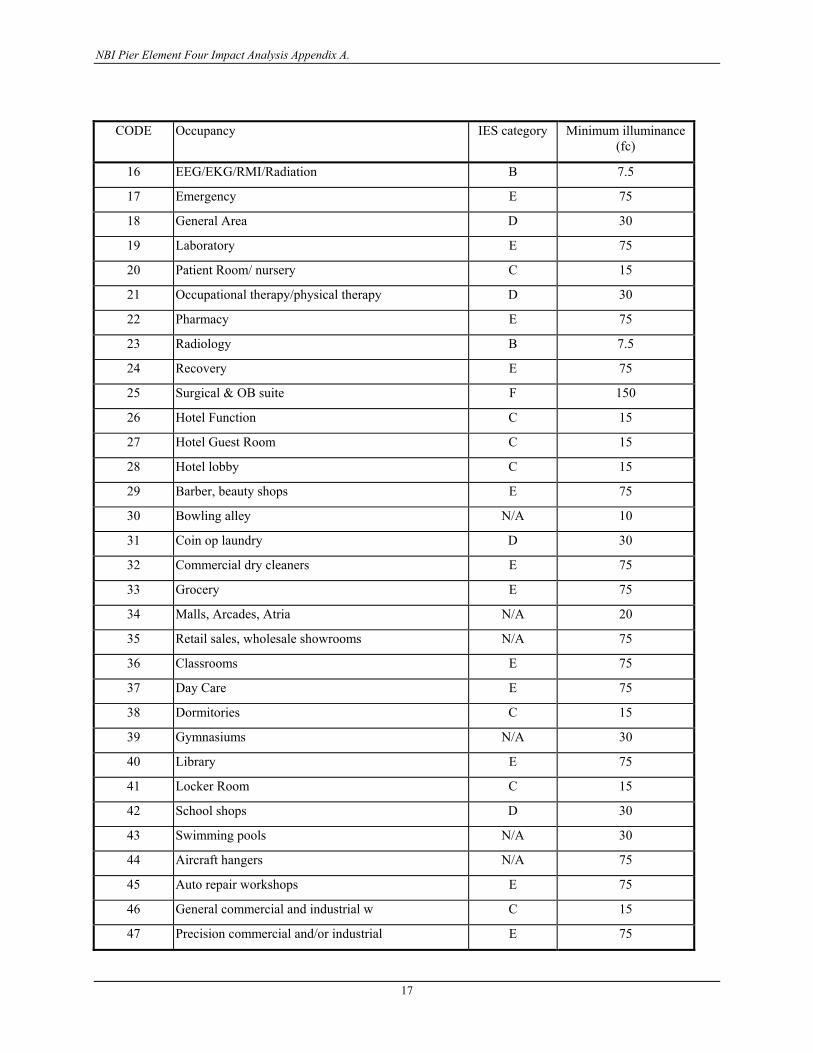
NBI Pier Element Four Impact Analysis Appendix A.
17
CODE Occupancy IES category Minimum illuminance (fc)
16 EEG/EKG/RMI/Radiation B 7.5
17 Emergency E 75
18 General Area D 30
19 Laboratory E 75
20 Patient Room/ nursery C 15
21 Occupational therapy/physical therapy D 30
22 Pharmacy E 75
23 Radiology B 7.5
24 Recovery E 75
25 Surgical & OB suite F 150
26 Hotel Function C 15
27 Hotel Guest Room C 15
28 Hotel lobby C 15
29 Barber, beauty shops E 75
30 Bowling alley N/A 10
31 Coin op laundry D 30
32 Commercial dry cleaners E 75
33 Grocery E 75
34 Malls, Arcades, Atria N/A 20
35 Retail sales, wholesale showrooms N/A 75
36 Classrooms E 75
37 Day Care E 75
38 Dormitories C 15
39 Gymnasiums N/A 30
40 Library E 75
41 Locker Room C 15
42 School shops D 30
43 Swimming pools N/A 30
44 Aircraft hangers N/A 75
45 Auto repair workshops E 75
46 General commercial and industrial w C 15
47 Precision commercial and/or industrial E 75

NBI Pier Element Four Impact Analysis Appendix A.
18
CODE Occupancy IES category Minimum illuminance (fc)
48 Storage, warehouse B 7.5
49 Other spaces not listed B 7.5
Equipment kW. Equipment connected loads represent all electrical loads in the conditioned space, which includes miscellaneous equipment and plug loads, kitchen equipment and refrigeration systems with integral condensers. Input data are based on the “nameplate” or total connected load. The nameplate data are adjusted using a “rated-load factor,” which is the ratio of the average operating load to the nameplate load. This adjusted value represents the hourly running load of all equipment surveyed. Equipment diversity is accounted for in the schedule definition.
For the miscellaneous equipment and plug load category, equipment counts and connected loads are taken from the on-site survey. Where the connected loads are not observed, default values based on equipment type are used, as shown below:
Space Type
Equipment Description Default kW
Rated Load Factor
Notes
General Personal Computer w/ Monitor 0.5 0.25
Terminal 0.15 0.30
Laser Printer 0.85 0.15
Small Copier 0.77 0.15
Medium Copier 1.4 0.15
Large Copier 6.6 0.15
Fax Machine 0.1 0.15
Mini-Computer + Periph 1.0 0.35
Main Frame Computer + Periph 0.55 Must record kW
Microwave 1.7 0.1
Misc. Appliance 0.20 Must record kW
Television 0.15 0.60
Washer 0.5 0.20
Dryer 4. 1.0
Cash Register 0.15 0.30
Box Crusher 10. 0.02
Gasoline pump 0.7 0.10
ATM 0.5 0.3
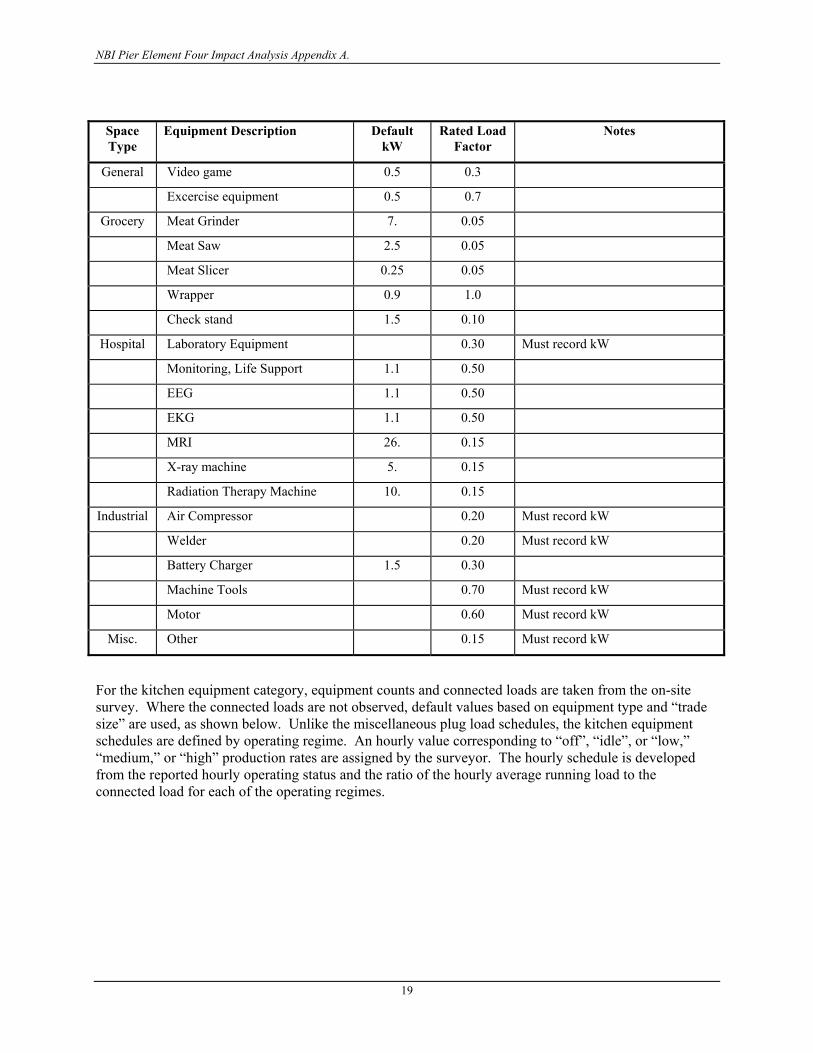
NBI Pier Element Four Impact Analysis Appendix A.
19
Space Type
Equipment Description Default kW
Rated Load Factor
Notes
General Video game 0.5 0.3
Excercise equipment 0.5 0.7
Grocery Meat Grinder 7. 0.05
Meat Saw 2.5 0.05
Meat Slicer 0.25 0.05
Wrapper 0.9 1.0
Check stand 1.5 0.10
Hospital Laboratory Equipment 0.30 Must record kW
Monitoring, Life Support 1.1 0.50
EEG 1.1 0.50
EKG 1.1 0.50
MRI 26. 0.15
X-ray machine 5. 0.15
Radiation Therapy Machine 10. 0.15
Industrial Air Compressor 0.20 Must record kW
Welder 0.20 Must record kW
Battery Charger 1.5 0.30
Machine Tools 0.70 Must record kW
Motor 0.60 Must record kW
Misc. Other 0.15 Must record kW
For the kitchen equipment category, equipment counts and connected loads are taken from the on-site survey. Where the connected loads are not observed, default values based on equipment type and “trade size” are used, as shown below. Unlike the miscellaneous plug load schedules, the kitchen equipment schedules are defined by operating regime. An hourly value corresponding to “off”, “idle”, or “low,” “medium,” or “high” production rates are assigned by the surveyor. The hourly schedule is developed from the reported hourly operating status and the ratio of the hourly average running load to the connected load for each of the operating regimes.

NBI Pier Element Four Impact Analysis Appendix A.
20
Ratio
Appliance Type Code
Appliance Description Trade size Default kW/unit
Idle Low Medium High
1 Broiler (including cheesemelter)
ft 1.7 0.17 0.25 0.30 0.35
2 Char Broiler ft 3.7 0.60 0.70 0.80 0.90
3 Single sided griddle ft 4.5 0.17 0.19 0.41 0.65
4 Clam shell griddle ft 7.5 0.09 0.16 0.39 0.63
5 Countertop fryer lb. 0.3 0.07 0.33 0.53 0.90
6 Free-standing fryer lb. 0.3 0.07 0.33 0.53 0.90
7 Pressure fryer lb. 0.3 0.07 0.33 0.53 0.90
8 Donut fryer lb. 0.3 0.07 0.33 0.53 0.90
9 Kettle, Pasta cooker qt 0.25 0.10 0.20 0.30 0.40
10 Heat lamps no. lamps 0.5 1.0 1.0 1.0 1.0
11 Range top ft 5. 0 0.20 0.40 0.60
12 Pizza or Bake Oven no. decks 7. 0.10 0.20 0.30 0.40
13 Conveyor oven no. decks 13. 0.10 0.20 0.30 0.40
14 Range Oven ft 2. 0.10 0.20 0.30 0.40
15 Convection, combi, retherm oven, steamer
no. doors 3.8 0.10 0.20 0.30 0.40
16 Food warmer ft 0.6 0.30 0.30 0.30 0.30
17 Heated display case ft 0.5 0.50 0.50 0.50 0.50
18 Microwave oven ea. 1.7 0.0 0.04 0.07 0.10
19 Pop-up Toaster ea. 1.8 0.0 0.15 0.30 0.45
20 Conveyor Toaster ea. 4.6 0.0 0.20 0.35 0.50
21 Coffee pot burners 1. 0.30 0.30 0.30 0.30
22 Steam table ft 0.6 0.30 0.30 0.30 0.30
23 Single Tank Dishwasher racks/hr 0.3 0.10 0.30 0.40 0.50
24 Conveyor Dishwasher racks/hr 0.1 0.10 0.30 0.40 0.50
25 Steam jacketed kettle qt 0.4 0.15 0.20 0.40 0.60
26 Braising pan/skillet qt 0.1 0.10 0.20 0.30 0.40
For the refrigeration equipment category, equipment type, count, and size are taken from the on-site survey. Equipment observed to have an “integral” compressor/condenser, that is, equipment that reject heat to the conditioned space, is assigned a connected load per unit size as shown below. For the

NBI Pier Element Four Impact Analysis Appendix A.
21
refrigeration equipment listed, the default load is equal to the actual running load; thus the rated load factor is equal to 1.0.
Type Code
Case Description Unit Dim. Default kW/unit
1 Single-level narrow open island ft 0.1
2 Single-level wide open island ft 0.1
3 Single level double open island ft 0.2
4 Single-level narrow closed island ft 0.1
5 Single-level wide closed island ft 0.1
6 Single level double closed island ft 0.2
7 Open Single-deck ft 0.3
8 Open Multi-deck ft 0.3
9 Reach-in Multi deck ft 0.1
10 Closed rear-entry multi-deck ft 0.03
11 Curved glass rear entry multi deck ft 0.06
12 Walk-in / Reach-in ft 0.3
13 Walk-in SF 0.015
14 Under counter Reach-in CF 0.03
15 Blast Chiller CF 0.03
16 Ice Maker CF 0.15
17 Residential Reach-in Refrigerator/Freezer CF 0.03
18 Residential Reach-in Freezer CF 0.03
19 Residential Closed Coffin Freezer CF 0.03
20 Refrigerated Vending Machine CF 0.03
21 Water cooler ea. 0.5
22 Slurpee, frappaccino machine ea. 1.0
23 Other kBtuh
Source input energy. Source input energy represents all non-electric equipment in the conditioned space. In the model, the source type is set to natural gas, and a total input energy is specified in terms of Btu/hr. Sources of internal heat gains to the space that were not electrically-powered include kitchen equipment, and dryers and other miscellaneous process loads. The input rating of the equipment is entered by the surveyors. As with the electrical equipment, the ratio of the rated input energy to the actual hourly consumption is calculated by the rated load factor assigned by equipment type and operating regime. Default values for gas equipment input ratings are used as shown below:
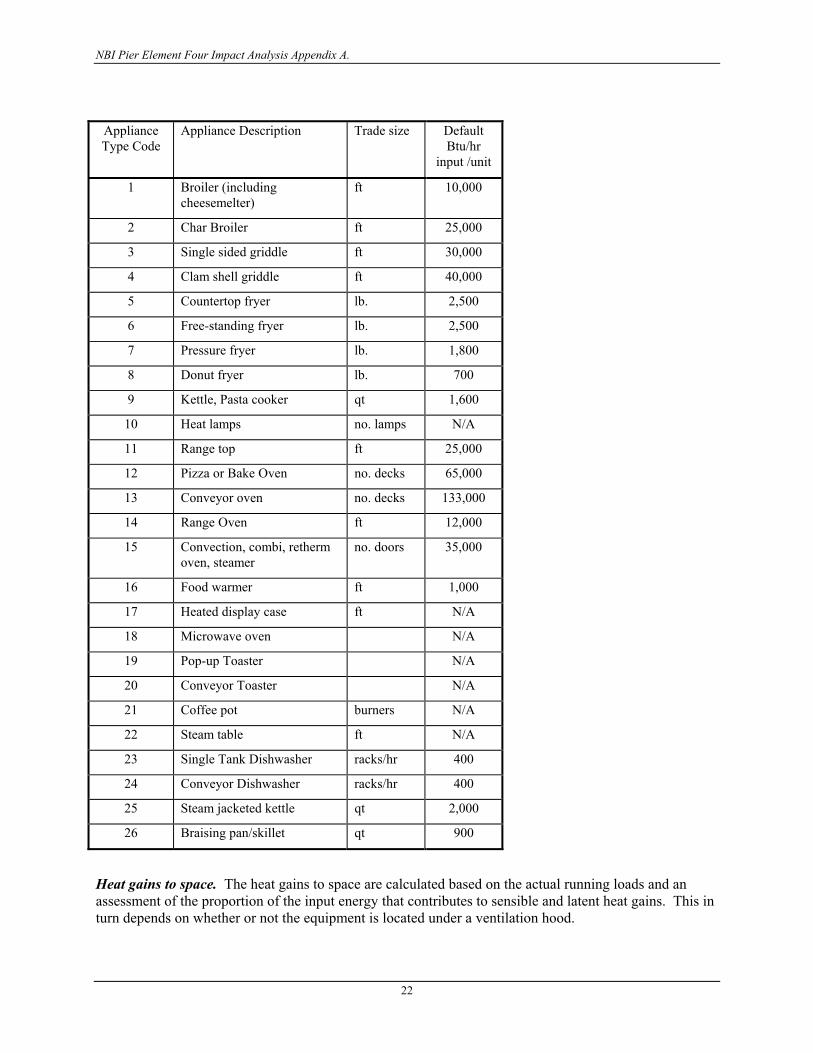
NBI Pier Element Four Impact Analysis Appendix A.
22
Appliance Type Code
Appliance Description Trade size Default Btu/hr
input /unit
1 Broiler (including cheesemelter)
ft 10,000
2 Char Broiler ft 25,000
3 Single sided griddle ft 30,000
4 Clam shell griddle ft 40,000
5 Countertop fryer lb. 2,500
6 Free-standing fryer lb. 2,500
7 Pressure fryer lb. 1,800
8 Donut fryer lb. 700
9 Kettle, Pasta cooker qt 1,600
10 Heat lamps no. lamps N/A
11 Range top ft 25,000
12 Pizza or Bake Oven no. decks 65,000
13 Conveyor oven no. decks 133,000
14 Range Oven ft 12,000
15 Convection, combi, retherm oven, steamer
no. doors 35,000
16 Food warmer ft 1,000
17 Heated display case ft N/A
18 Microwave oven N/A
19 Pop-up Toaster N/A
20 Conveyor Toaster N/A
21 Coffee pot burners N/A
22 Steam table ft N/A
23 Single Tank Dishwasher racks/hr 400
24 Conveyor Dishwasher racks/hr 400
25 Steam jacketed kettle qt 2,000
26 Braising pan/skillet qt 900
Heat gains to space. The heat gains to space are calculated based on the actual running loads and an assessment of the proportion of the input energy that contributes to sensible and latent heat gains. This in turn depends on whether or not the equipment is located under a ventilation hood.
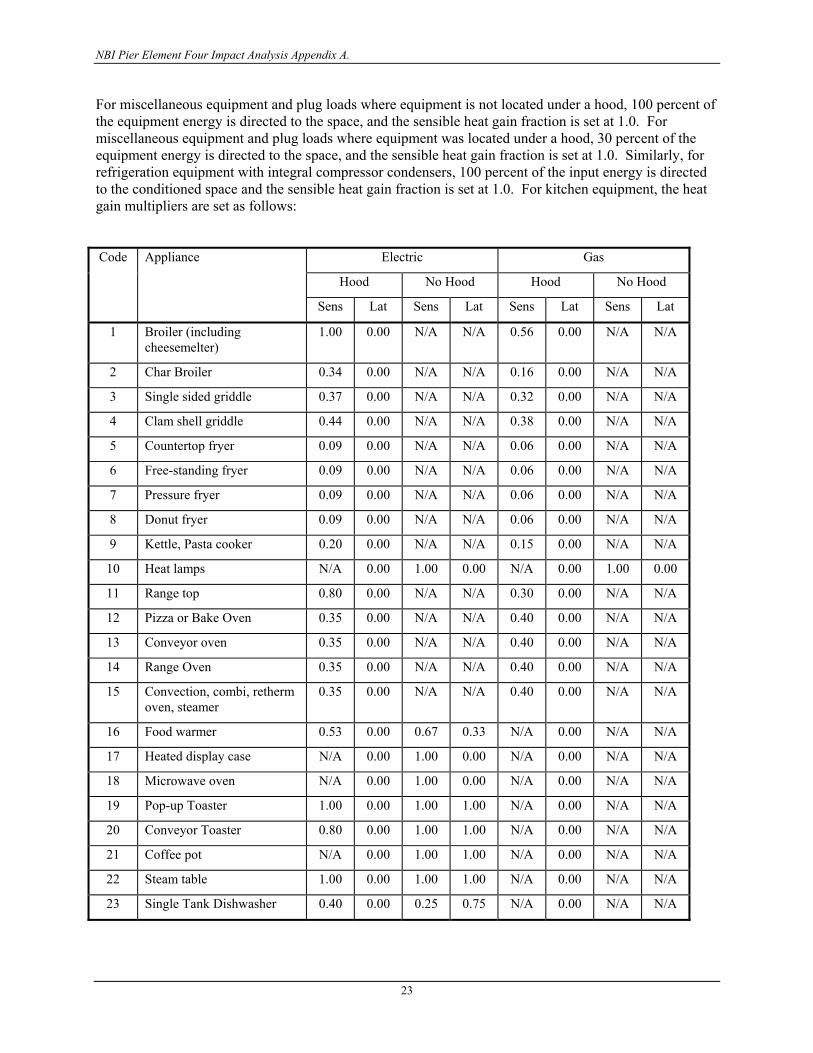
NBI Pier Element Four Impact Analysis Appendix A.
23
For miscellaneous equipment and plug loads where equipment is not located under a hood, 100 percent of the equipment energy is directed to the space, and the sensible heat gain fraction is set at 1.0. For miscellaneous equipment and plug loads where equipment was located under a hood, 30 percent of the equipment energy is directed to the space, and the sensible heat gain fraction is set at 1.0. Similarly, for refrigeration equipment with integral compressor condensers, 100 percent of the input energy is directed to the conditioned space and the sensible heat gain fraction is set at 1.0. For kitchen equipment, the heat gain multipliers are set as follows:
Code Appliance Electric Gas
Hood No Hood Hood No Hood
Sens Lat Sens Lat Sens Lat Sens Lat
1 Broiler (including cheesemelter)
1.00 0.00 N/A N/A 0.56 0.00 N/A N/A
2 Char Broiler 0.34 0.00 N/A N/A 0.16 0.00 N/A N/A
3 Single sided griddle 0.37 0.00 N/A N/A 0.32 0.00 N/A N/A
4 Clam shell griddle 0.44 0.00 N/A N/A 0.38 0.00 N/A N/A
5 Countertop fryer 0.09 0.00 N/A N/A 0.06 0.00 N/A N/A
6 Free-standing fryer 0.09 0.00 N/A N/A 0.06 0.00 N/A N/A
7 Pressure fryer 0.09 0.00 N/A N/A 0.06 0.00 N/A N/A
8 Donut fryer 0.09 0.00 N/A N/A 0.06 0.00 N/A N/A
9 Kettle, Pasta cooker 0.20 0.00 N/A N/A 0.15 0.00 N/A N/A
10 Heat lamps N/A 0.00 1.00 0.00 N/A 0.00 1.00 0.00
11 Range top 0.80 0.00 N/A N/A 0.30 0.00 N/A N/A
12 Pizza or Bake Oven 0.35 0.00 N/A N/A 0.40 0.00 N/A N/A
13 Conveyor oven 0.35 0.00 N/A N/A 0.40 0.00 N/A N/A
14 Range Oven 0.35 0.00 N/A N/A 0.40 0.00 N/A N/A
15 Convection, combi, retherm oven, steamer
0.35 0.00 N/A N/A 0.40 0.00 N/A N/A
16 Food warmer 0.53 0.00 0.67 0.33 N/A 0.00 N/A N/A
17 Heated display case N/A 0.00 1.00 0.00 N/A 0.00 N/A N/A
18 Microwave oven N/A 0.00 1.00 0.00 N/A 0.00 N/A N/A
19 Pop-up Toaster 1.00 0.00 1.00 1.00 N/A 0.00 N/A N/A
20 Conveyor Toaster 0.80 0.00 1.00 1.00 N/A 0.00 N/A N/A
21 Coffee pot N/A 0.00 1.00 1.00 N/A 0.00 N/A N/A
22 Steam table 1.00 0.00 1.00 1.00 N/A 0.00 N/A N/A
23 Single Tank Dishwasher 0.40 0.00 0.25 0.75 N/A 0.00 N/A N/A

NBI Pier Element Four Impact Analysis Appendix A.
24
Code Appliance Electric Gas
Hood No Hood Hood No Hood
Sens Lat Sens Lat Sens Lat Sens Lat
24 Conveyor Dishwasher 0.40 0.00 0.25 0.75 N/A 0.00 N/A N/A
25 Steam jacketed kettle 0.20 0.00 N/A N/A 0.15 0.00 N/A N/A
26 Braising pan/skillet 0.25 0.00 N/A N/A 0.20 0.00 N/A N/A
Space Each space in the DOE-2 model corresponds to a zone defined in the on-site survey. Each survey zone can consist of multiple survey “spaces.” The space conditions parameters developed on a zone by zone basis are included in the description of each space. Enclosing surfaces, as defined by the on-site surveyors, are also defined. The DOE-2 input parameters considered, and their associated data sources are listed as follows:
General Parameters
DOE-2 input parameter Data source Comments
Zone type Conditioned Only conditioned zones surveyed for this project
Area On-site survey
Volume Floor area, average wall height from on-site survey
Space conditions Space conditions as defined above.
Exterior Walls
DOE-2 input parameter Data source Comments
Wall height On-site survey Height is defined as space enclosed by insulation, including plenum if insulation is located at roof level. Plenums surveyed separately if insulation is at ceiling level
Wall width On-site survey
Wall construction Construction as defined in section 2.1.3 above.
Wall azimuth Surface orientation, from on-site survey
Limited to N, NE, E, SE, S, SW, W, NW.
Tilt 90 degrees Constant
Window height On-site survey Associated to wall surface based on surveyed orientation.
Window width On-site survey
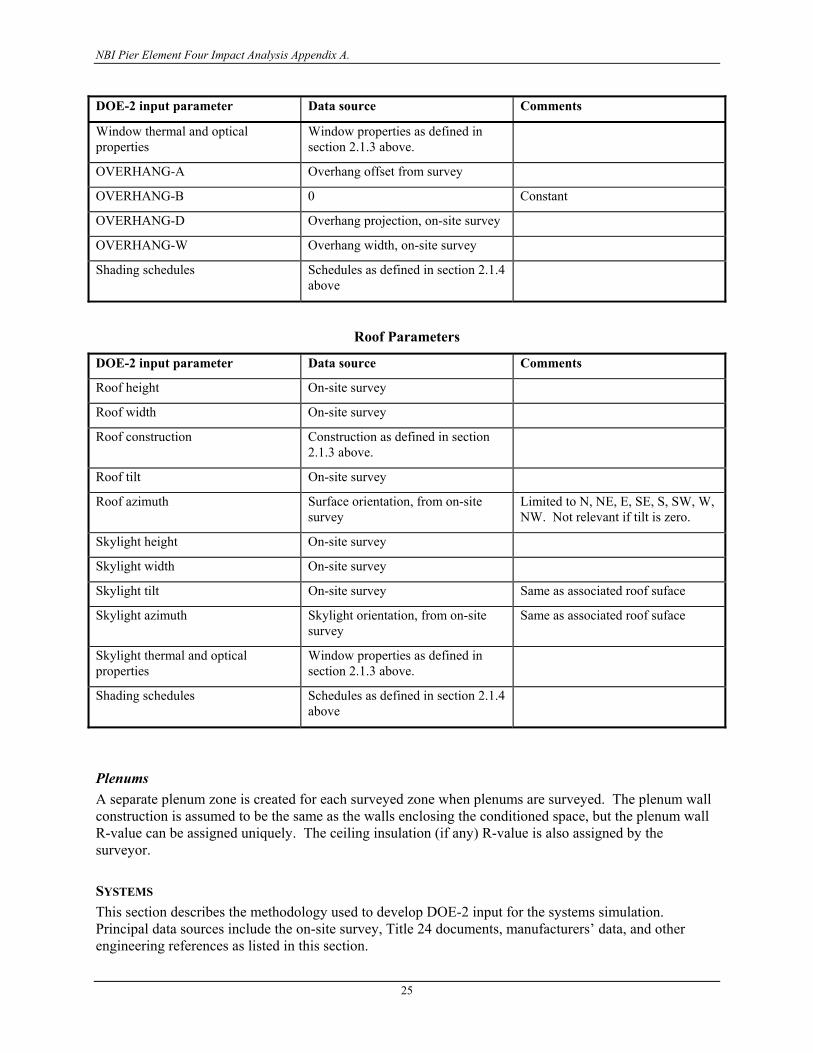
NBI Pier Element Four Impact Analysis Appendix A.
25
DOE-2 input parameter Data source Comments
Window thermal and optical properties
Window properties as defined in section 2.1.3 above.
OVERHANG-A Overhang offset from survey
OVERHANG-B 0 Constant
OVERHANG-D Overhang projection, on-site survey
OVERHANG-W Overhang width, on-site survey
Shading schedules Schedules as defined in section 2.1.4 above
Roof Parameters
DOE-2 input parameter Data source Comments
Roof height On-site survey
Roof width On-site survey
Roof construction Construction as defined in section 2.1.3 above.
Roof tilt On-site survey
Roof azimuth Surface orientation, from on-site survey
Limited to N, NE, E, SE, S, SW, W, NW. Not relevant if tilt is zero.
Skylight height On-site survey
Skylight width On-site survey
Skylight tilt On-site survey Same as associated roof suface
Skylight azimuth Skylight orientation, from on-site survey
Same as associated roof suface
Skylight thermal and optical properties
Window properties as defined in section 2.1.3 above.
Shading schedules Schedules as defined in section 2.1.4 above
Plenums A separate plenum zone is created for each surveyed zone when plenums are surveyed. The plenum wall construction is assumed to be the same as the walls enclosing the conditioned space, but the plenum wall R-value can be assigned uniquely. The ceiling insulation (if any) R-value is also assigned by the surveyor.
SYSTEMS This section describes the methodology used to develop DOE-2 input for the systems simulation. Principal data sources include the on-site survey, Title 24 documents, manufacturers’ data, and other engineering references as listed in this section.

NBI Pier Element Four Impact Analysis Appendix A.
26
Throughout the systems simulation, input power for pumps, fans and other motor-driven equipment is required. Most motor nameplate data are listed in terms of rated shaft horsepower. Thus, a conversion from motor hp to input power is required. The general equation used to perform this conversion is listed below:
motor
hpkWη
746.0×=
where:
kW = input power
hp = nameplate motor hp
ηmotor = motor efficiency
The motor efficiency is generally a function of the motor hp. Motor efficiencies as observed by the surveyors are used to calculate input power. In the absence of motor efficiency observations, efficiencies are assigned as shown below:
Single Phase Motors
hp Efficiency hp Efficiency
0.50 70 3.00 81
0.75 72 5.00 82
1.00 79 7.50 85
1.50 80 10.00 85
2.00 80
Three Phase Motors
hp Efficiency hp Efficiency
1.00 79 30.00 89
1.50 80 40.00 89
2.00 80 50.00 89
3.00 81 60.00 89
5.00 82 75.00 90
7.50 85 100.00 90
10.00 85 125.00 90
15.00 86 150.00 91
20.00 87 200.00 91
25.00 88
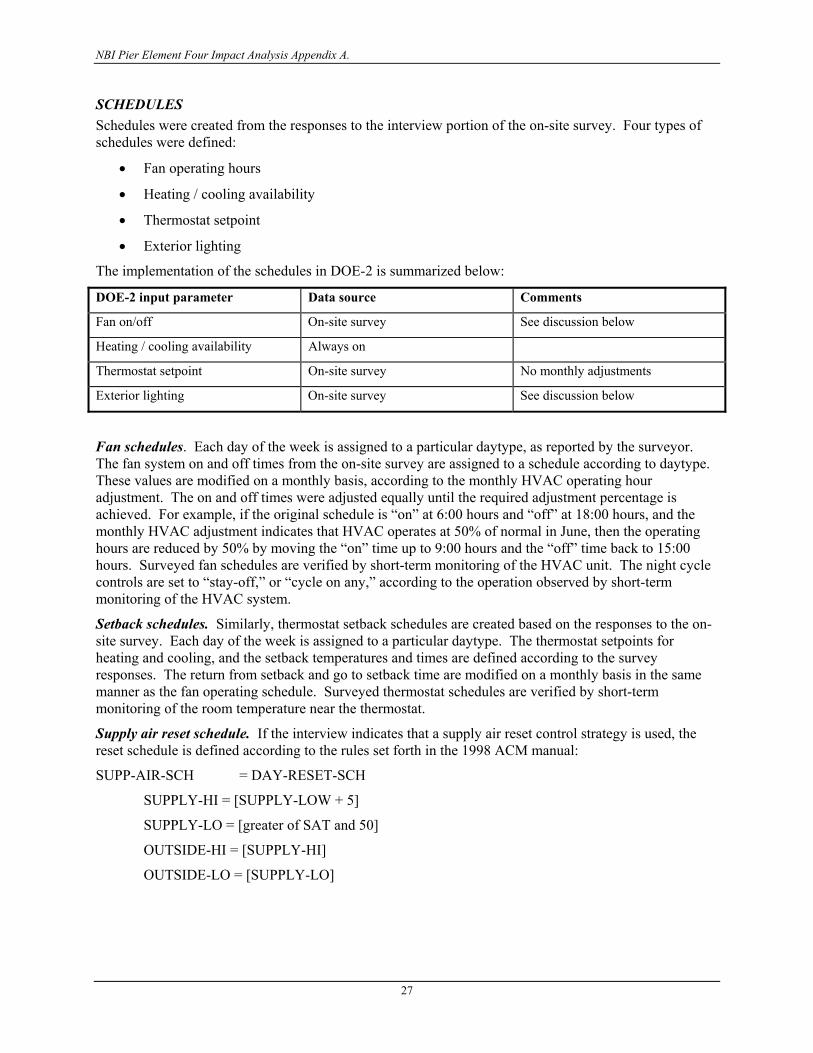
NBI Pier Element Four Impact Analysis Appendix A.
27
SCHEDULES Schedules were created from the responses to the interview portion of the on-site survey. Four types of schedules were defined:
• Fan operating hours
• Heating / cooling availability
• Thermostat setpoint
• Exterior lighting
The implementation of the schedules in DOE-2 is summarized below:
DOE-2 input parameter Data source Comments
Fan on/off On-site survey See discussion below
Heating / cooling availability Always on
Thermostat setpoint On-site survey No monthly adjustments
Exterior lighting On-site survey See discussion below
Fan schedules. Each day of the week is assigned to a particular daytype, as reported by the surveyor. The fan system on and off times from the on-site survey are assigned to a schedule according to daytype. These values are modified on a monthly basis, according to the monthly HVAC operating hour adjustment. The on and off times were adjusted equally until the required adjustment percentage is achieved. For example, if the original schedule is “on” at 6:00 hours and “off” at 18:00 hours, and the monthly HVAC adjustment indicates that HVAC operates at 50% of normal in June, then the operating hours are reduced by 50% by moving the “on” time up to 9:00 hours and the “off” time back to 15:00 hours. Surveyed fan schedules are verified by short-term monitoring of the HVAC unit. The night cycle controls are set to “stay-off,” or “cycle on any,” according to the operation observed by short-term monitoring of the HVAC system.
Setback schedules. Similarly, thermostat setback schedules are created based on the responses to the on-site survey. Each day of the week is assigned to a particular daytype. The thermostat setpoints for heating and cooling, and the setback temperatures and times are defined according to the survey responses. The return from setback and go to setback time are modified on a monthly basis in the same manner as the fan operating schedule. Surveyed thermostat schedules are verified by short-term monitoring of the room temperature near the thermostat.
Supply air reset schedule. If the interview indicates that a supply air reset control strategy is used, the reset schedule is defined according to the rules set forth in the 1998 ACM manual:
SUPP-AIR-SCH = DAY-RESET-SCH
SUPPLY-HI = [SUPPLY-LOW + 5]
SUPPLY-LO = [greater of SAT and 50]
OUTSIDE-HI = [SUPPLY-HI]
OUTSIDE-LO = [SUPPLY-LO]
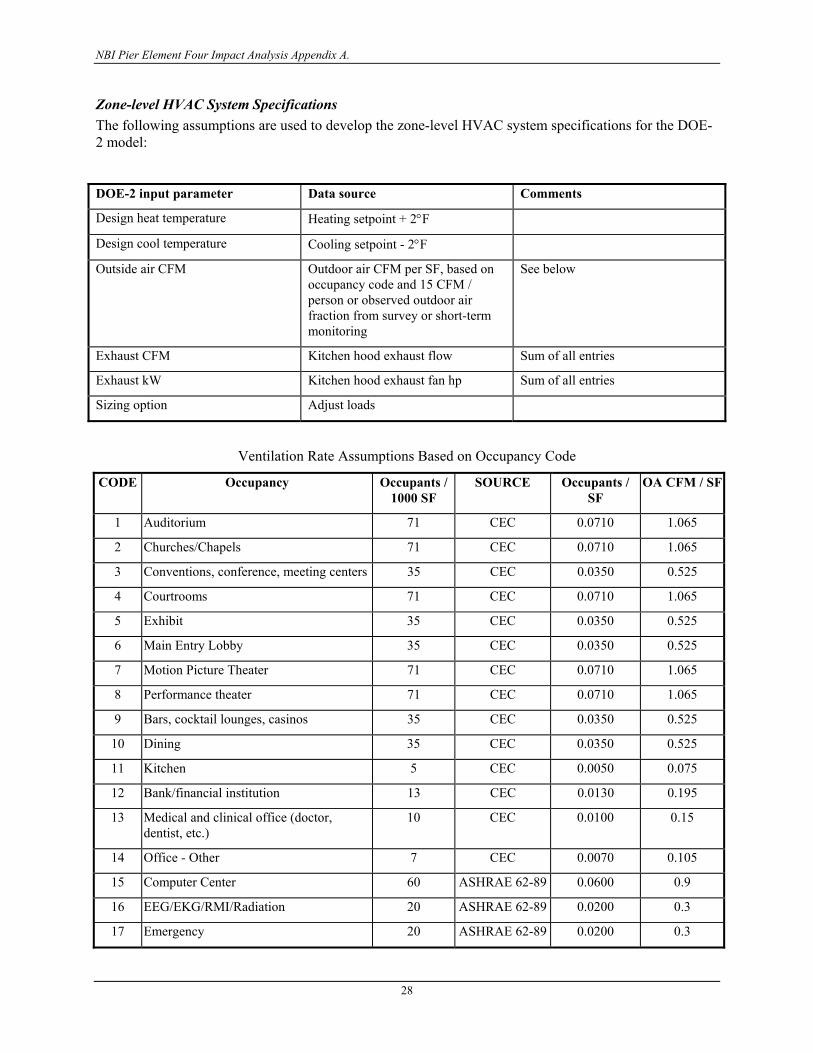
NBI Pier Element Four Impact Analysis Appendix A.
28
Zone-level HVAC System Specifications The following assumptions are used to develop the zone-level HVAC system specifications for the DOE-2 model:
DOE-2 input parameter Data source Comments
Design heat temperature Heating setpoint + 2°F
Design cool temperature Cooling setpoint - 2°F
Outside air CFM Outdoor air CFM per SF, based on occupancy code and 15 CFM / person or observed outdoor air fraction from survey or short-term monitoring
See below
Exhaust CFM Kitchen hood exhaust flow Sum of all entries
Exhaust kW Kitchen hood exhaust fan hp Sum of all entries
Sizing option Adjust loads
Ventilation Rate Assumptions Based on Occupancy Code
CODE Occupancy Occupants / 1000 SF
SOURCE Occupants / SF
OA CFM / SF
1 Auditorium 71 CEC 0.0710 1.065
2 Churches/Chapels 71 CEC 0.0710 1.065
3 Conventions, conference, meeting centers 35 CEC 0.0350 0.525
4 Courtrooms 71 CEC 0.0710 1.065
5 Exhibit 35 CEC 0.0350 0.525
6 Main Entry Lobby 35 CEC 0.0350 0.525
7 Motion Picture Theater 71 CEC 0.0710 1.065
8 Performance theater 71 CEC 0.0710 1.065
9 Bars, cocktail lounges, casinos 35 CEC 0.0350 0.525
10 Dining 35 CEC 0.0350 0.525
11 Kitchen 5 CEC 0.0050 0.075
12 Bank/financial institution 13 CEC 0.0130 0.195
13 Medical and clinical office (doctor, dentist, etc.)
10 CEC 0.0100 0.15
14 Office - Other 7 CEC 0.0070 0.105
15 Computer Center 60 ASHRAE 62-89 0.0600 0.9
16 EEG/EKG/RMI/Radiation 20 ASHRAE 62-89 0.0200 0.3
17 Emergency 20 ASHRAE 62-89 0.0200 0.3

NBI Pier Element Four Impact Analysis Appendix A.
29
CODE Occupancy Occupants / 1000 SF
SOURCE Occupants / SF
OA CFM / SF
18 General Area 20 ASHRAE 62-89 0.0200 0.3
19 Laboratory 20 ASHRAE 62-89 0.0200 0.3
20 Patient Room/ nursery 10 ASHRAE 62-89 0.0100 0.15
21 Occupational therapy/physical therapy 20 ASHRAE 62-89 0.0200 0.3
22 Pharmacy 20 ASHRAE 62-89 0.0200 0.3
23 Radiology 20 ASHRAE 62-89 0.0200 0.3
24 Recovery 20 ASHRAE 62-89 0.0200 0.3
25 Surgical & OB suite 20 ASHRAE 62-89 0.0200 0.3
26 Hotel Function 71 CEC 0.0710 1.065
27 Hotel Guest Room 3 CEC 0.0030 0.045
28 Hotel lobby 35 CEC 0.0350 0.525
29 Barber, beauty shops 10 CEC 0.0100 0.15
30 Bowling alley 70 ASHRAE 62-89 0.0700 1.05
31 Coin op laundry 10 CEC 0.0100 0.15
32 Commercial dry cleaners 15 CEC 0.0150 0.225
33 Grocery 17 CEC 0.0170 0.255
34 Malls, Arcades, Atria 17 CEC 0.0170 0.255
35 Retail sales, wholesale showrooms 13 CEC 0.0130 0.195
36 Classrooms 25 CEC 0.0250 0.375
37 Day Care 25 CEC 0.0250 0.375
38 Dormitories 20 ASHRAE 62-89 0.0200 0.3
39 Gymnasiums 30 ASHRAE 62-89 0.0300 0.45
40 Library 20 CEC 0.0200 0.3
41 Locker Room 33 ASHRAE 62-89 0.0330 0.495
42 School shops 30 CEC 0.0300 0.45
43 Swimming pools 33 ASHRAE 62-89 0.0330 0.495
44 Aircraft hangers 5 CEC 0.0050 0.075
45 Auto repair workshops 5 CEC 0.0050 0.075
46 General commercial and industrial work 10 CEC 0.0100 0.15
47 Precision commercial and/or industrial work
10 CEC 0.0100 0.15
48 Storage, warehouse 2 CEC 0.0020 0.03
49 Other spaces not listed 4 CEC 0.0040 0.06

NBI Pier Element Four Impact Analysis Appendix A.
30
Zone-level HVAC Controls
Zone-level HVAC control specifications are defined as summarized below:
DOE-2 input parameter Data source Comments
Cooling setpoint schedule As defined in section 2.2.1
Heating setpoint schedule As defined in section 2.2.1
Thermostat type Reverse action
Throttling range 2°F
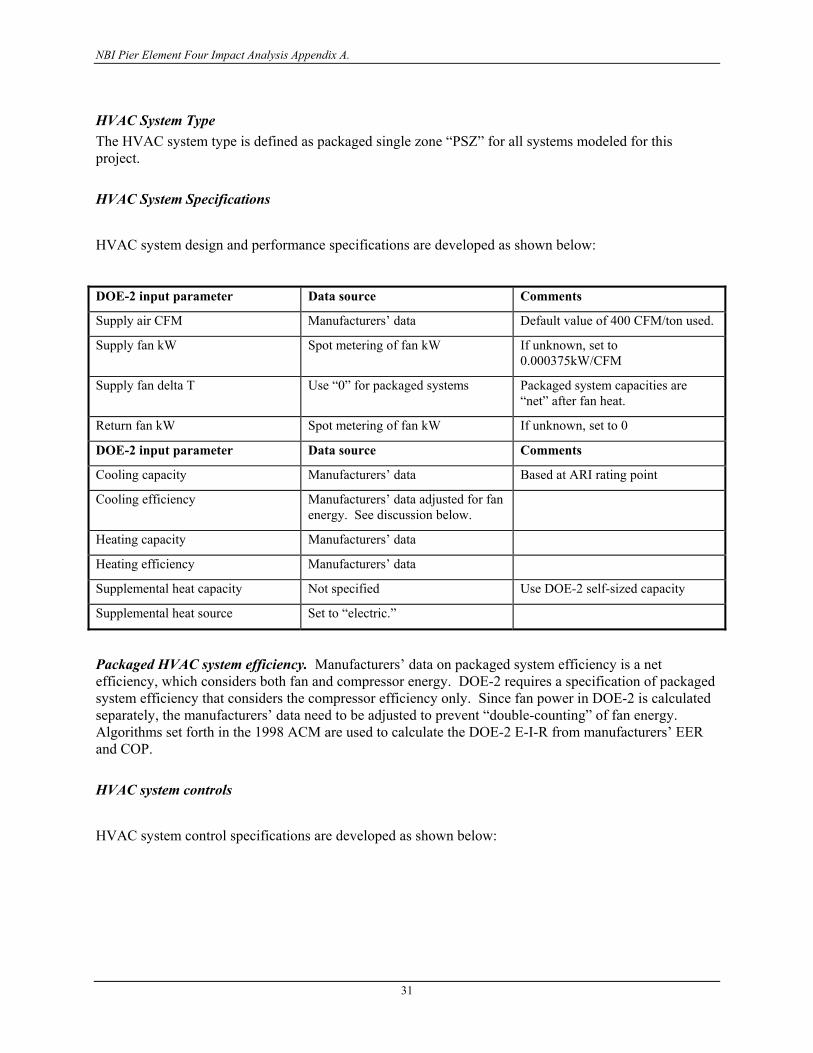
NBI Pier Element Four Impact Analysis Appendix A.
31
HVAC System Type The HVAC system type is defined as packaged single zone “PSZ” for all systems modeled for this project.
HVAC System Specifications
HVAC system design and performance specifications are developed as shown below:
DOE-2 input parameter Data source Comments
Supply air CFM Manufacturers’ data Default value of 400 CFM/ton used.
Supply fan kW Spot metering of fan kW If unknown, set to 0.000375kW/CFM
Supply fan delta T Use “0” for packaged systems Packaged system capacities are “net” after fan heat.
Return fan kW Spot metering of fan kW If unknown, set to 0
DOE-2 input parameter Data source Comments
Cooling capacity Manufacturers’ data Based at ARI rating point
Cooling efficiency Manufacturers’ data adjusted for fan energy. See discussion below.
Heating capacity Manufacturers’ data
Heating efficiency Manufacturers’ data
Supplemental heat capacity Not specified Use DOE-2 self-sized capacity
Supplemental heat source Set to “electric.”
Packaged HVAC system efficiency. Manufacturers’ data on packaged system efficiency is a net efficiency, which considers both fan and compressor energy. DOE-2 requires a specification of packaged system efficiency that considers the compressor efficiency only. Since fan power in DOE-2 is calculated separately, the manufacturers’ data need to be adjusted to prevent “double-counting” of fan energy. Algorithms set forth in the 1998 ACM are used to calculate the DOE-2 E-I-R from manufacturers’ EER and COP.
HVAC system controls
HVAC system control specifications are developed as shown below:

NBI Pier Element Four Impact Analysis Appendix A.
32
DOE-2 input parameter Data source Comments
Max supply air temp 100°F Constant
Minimum supply air temp On-site survey 55°F if unknown
Economizer high limit temp Onsite survey Varies based on observed economizer controller setpoint. See below
Economizer lockout Onsite survey Varies based on system size
Outdoor air control On-site survey, as listed for each system
Fixed, single point temperature, differential temperature, single point enthalpy, differential enthalpy
Supply air temperature reset control (cooling mode)
On-site survey. Use “warmest” if response is “zone temp,” “reset” if response is “outside temp.”
Reset schedule defined in section 2.2.1 above.
Preheat coil setpoint -50°F Assume no preheat
Fan schedule As defined in section 2.2.1
Fan control On-site survey, as defined for each system type
Night cycle control Onsite survey “Stay off” or “cycle on any”
Defrost type Set to “electric.” Heat pump only
Defrost control On-demand Heat pump only.
Economizer high limit setpoints are specified based on the controller setpoint observed in the field. For Honeywell controllers, the setpoint is designated by an A, B, C or D setting on the controller. The DOE-2 model specifications for each of these setpoint choices is shown below:
Honeywell Controller Setting Enthalpy Limit Drybulb Limit
A 28.0 Btu/lb 78°F
B 25.0 Btu/lb 74°F
C 22.0 Btu/lb 68°F
D 20.0 Btu/lb 63°F
Duct losses are modeled only in buildings where the ducts are located in an unconditioned space or outdoors. The losses are modeled using the following DOE-2 commands:

NBI Pier Element Four Impact Analysis Appendix A.
33
DOE-2 input parameter Data source Comments
DUCT-AIR-LOSS Defaults to 36% total leakage, split evenly between supply and return systems
Not measured; default values based on Modera and Proctor study.
DUCT-UA Onsite survey Supply duct area and duct insulation R-values are summed for each supply duct entry. Supply losses only modeled by DOE-2.2
DUCT-AIR-LOSS-OA Onsite survey Set to 0.0 for ducts located in an unconditioned plenum; set to 1.0 for ducts located outdoors
DUCT-ZONE Defaults to plenum zone assigned to thermal zone conditioned by each system
A separate plenum is assigned to each system, as required by DOE-2.2.
Refrigeration Systems.
Detailed simulation of refrigeration systems is done for all commercial buildings with remote refrigeration condensers. Refrigeration cases are grouped into three systems which are defined by their operating temperature: ice cream cases, frozen food cases, and all others. For each operating temperature, the following input data are defined:
DOE-2 input parameter Data source Comments
Refrigeration zone load Function of case type and product code. Manufacturers’ or program data used when available. See below for default values
Total load calculated from unit load, size and quantity. Not used for walk-in cases. Case performance data abstracted from Hussman catalog.
Refrigeration zone sensible heat ratio
0.8 Default
Refrigeration supply air discharge temp
Function of case type and product code. Temperature defined according to surveyed case lineup and standard values as shown below.
Weighted average of all cases in lineup used.
Refrigeration evaporator temperature
Function of case type and product code. Temperature defined according to surveyed case lineup and standard values as shown below.
Minimum value of all cases in lineup used.
Refrigeration auxiliary kW Function of case type and product code. Temperature defined according to surveyed case lineup and standard values as shown below.
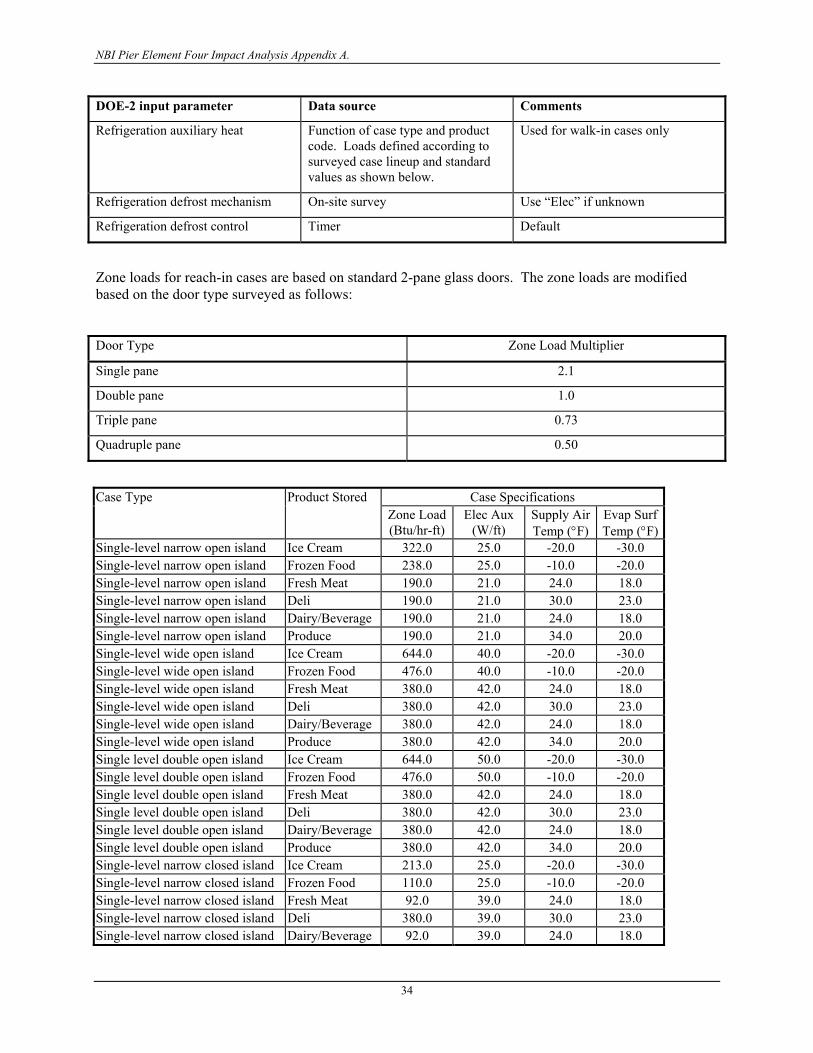
NBI Pier Element Four Impact Analysis Appendix A.
34
DOE-2 input parameter Data source Comments
Refrigeration auxiliary heat Function of case type and product code. Loads defined according to surveyed case lineup and standard values as shown below.
Used for walk-in cases only
Refrigeration defrost mechanism On-site survey Use “Elec” if unknown
Refrigeration defrost control Timer Default
Zone loads for reach-in cases are based on standard 2-pane glass doors. The zone loads are modified based on the door type surveyed as follows:
Door Type Zone Load Multiplier
Single pane 2.1
Double pane 1.0
Triple pane 0.73
Quadruple pane 0.50
Case Type Product Stored Case Specifications Zone Load
(Btu/hr-ft) Elec Aux
(W/ft) Supply Air Temp (°F)
Evap Surf Temp (°F)
Single-level narrow open island Ice Cream 322.0 25.0 -20.0 -30.0 Single-level narrow open island Frozen Food 238.0 25.0 -10.0 -20.0 Single-level narrow open island Fresh Meat 190.0 21.0 24.0 18.0 Single-level narrow open island Deli 190.0 21.0 30.0 23.0 Single-level narrow open island Dairy/Beverage 190.0 21.0 24.0 18.0 Single-level narrow open island Produce 190.0 21.0 34.0 20.0 Single-level wide open island Ice Cream 644.0 40.0 -20.0 -30.0 Single-level wide open island Frozen Food 476.0 40.0 -10.0 -20.0 Single-level wide open island Fresh Meat 380.0 42.0 24.0 18.0 Single-level wide open island Deli 380.0 42.0 30.0 23.0 Single-level wide open island Dairy/Beverage 380.0 42.0 24.0 18.0 Single-level wide open island Produce 380.0 42.0 34.0 20.0 Single level double open island Ice Cream 644.0 50.0 -20.0 -30.0 Single level double open island Frozen Food 476.0 50.0 -10.0 -20.0 Single level double open island Fresh Meat 380.0 42.0 24.0 18.0 Single level double open island Deli 380.0 42.0 30.0 23.0 Single level double open island Dairy/Beverage 380.0 42.0 24.0 18.0 Single level double open island Produce 380.0 42.0 34.0 20.0 Single-level narrow closed island Ice Cream 213.0 25.0 -20.0 -30.0 Single-level narrow closed island Frozen Food 110.0 25.0 -10.0 -20.0 Single-level narrow closed island Fresh Meat 92.0 39.0 24.0 18.0 Single-level narrow closed island Deli 380.0 39.0 30.0 23.0 Single-level narrow closed island Dairy/Beverage 92.0 39.0 24.0 18.0
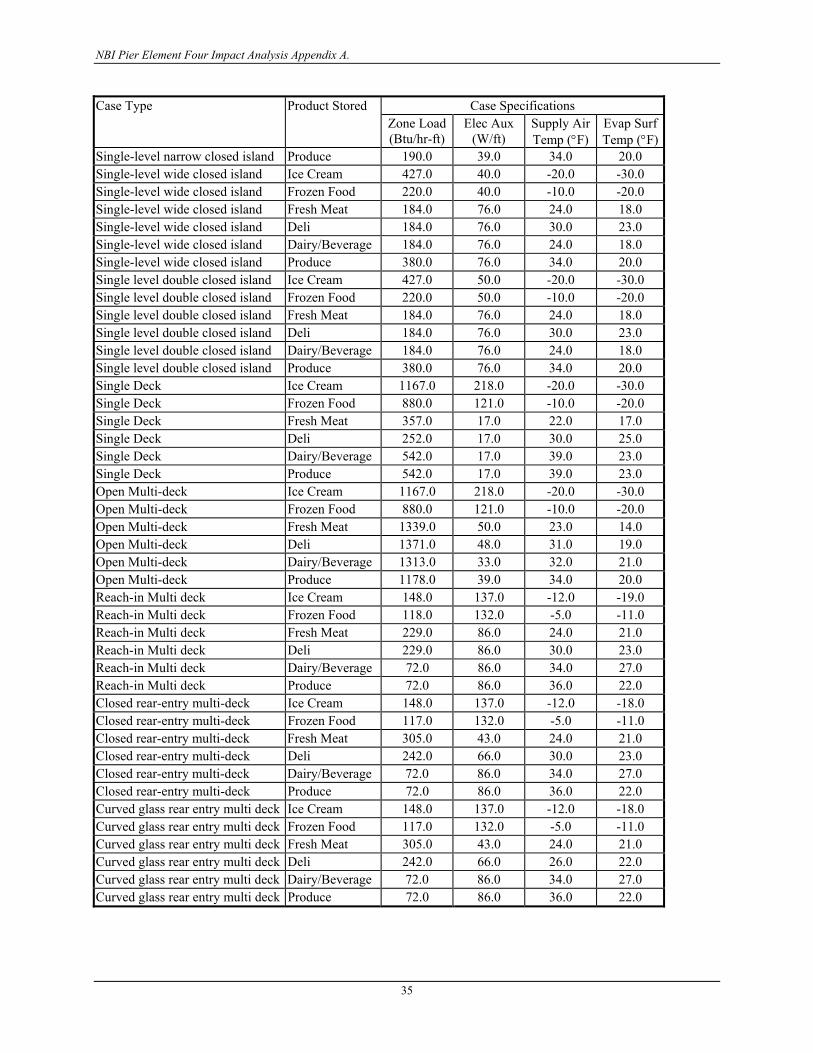
NBI Pier Element Four Impact Analysis Appendix A.
35
Case Type Product Stored Case Specifications Zone Load
(Btu/hr-ft) Elec Aux
(W/ft) Supply Air Temp (°F)
Evap Surf Temp (°F)
Single-level narrow closed island Produce 190.0 39.0 34.0 20.0 Single-level wide closed island Ice Cream 427.0 40.0 -20.0 -30.0 Single-level wide closed island Frozen Food 220.0 40.0 -10.0 -20.0 Single-level wide closed island Fresh Meat 184.0 76.0 24.0 18.0 Single-level wide closed island Deli 184.0 76.0 30.0 23.0 Single-level wide closed island Dairy/Beverage 184.0 76.0 24.0 18.0 Single-level wide closed island Produce 380.0 76.0 34.0 20.0 Single level double closed island Ice Cream 427.0 50.0 -20.0 -30.0 Single level double closed island Frozen Food 220.0 50.0 -10.0 -20.0 Single level double closed island Fresh Meat 184.0 76.0 24.0 18.0 Single level double closed island Deli 184.0 76.0 30.0 23.0 Single level double closed island Dairy/Beverage 184.0 76.0 24.0 18.0 Single level double closed island Produce 380.0 76.0 34.0 20.0 Single Deck Ice Cream 1167.0 218.0 -20.0 -30.0 Single Deck Frozen Food 880.0 121.0 -10.0 -20.0 Single Deck Fresh Meat 357.0 17.0 22.0 17.0 Single Deck Deli 252.0 17.0 30.0 25.0 Single Deck Dairy/Beverage 542.0 17.0 39.0 23.0 Single Deck Produce 542.0 17.0 39.0 23.0 Open Multi-deck Ice Cream 1167.0 218.0 -20.0 -30.0 Open Multi-deck Frozen Food 880.0 121.0 -10.0 -20.0 Open Multi-deck Fresh Meat 1339.0 50.0 23.0 14.0 Open Multi-deck Deli 1371.0 48.0 31.0 19.0 Open Multi-deck Dairy/Beverage 1313.0 33.0 32.0 21.0 Open Multi-deck Produce 1178.0 39.0 34.0 20.0 Reach-in Multi deck Ice Cream 148.0 137.0 -12.0 -19.0 Reach-in Multi deck Frozen Food 118.0 132.0 -5.0 -11.0 Reach-in Multi deck Fresh Meat 229.0 86.0 24.0 21.0 Reach-in Multi deck Deli 229.0 86.0 30.0 23.0 Reach-in Multi deck Dairy/Beverage 72.0 86.0 34.0 27.0 Reach-in Multi deck Produce 72.0 86.0 36.0 22.0 Closed rear-entry multi-deck Ice Cream 148.0 137.0 -12.0 -18.0 Closed rear-entry multi-deck Frozen Food 117.0 132.0 -5.0 -11.0 Closed rear-entry multi-deck Fresh Meat 305.0 43.0 24.0 21.0 Closed rear-entry multi-deck Deli 242.0 66.0 30.0 23.0 Closed rear-entry multi-deck Dairy/Beverage 72.0 86.0 34.0 27.0 Closed rear-entry multi-deck Produce 72.0 86.0 36.0 22.0 Curved glass rear entry multi deck Ice Cream 148.0 137.0 -12.0 -18.0 Curved glass rear entry multi deck Frozen Food 117.0 132.0 -5.0 -11.0 Curved glass rear entry multi deck Fresh Meat 305.0 43.0 24.0 21.0 Curved glass rear entry multi deck Deli 242.0 66.0 26.0 22.0 Curved glass rear entry multi deck Dairy/Beverage 72.0 86.0 34.0 27.0 Curved glass rear entry multi deck Produce 72.0 86.0 36.0 22.0
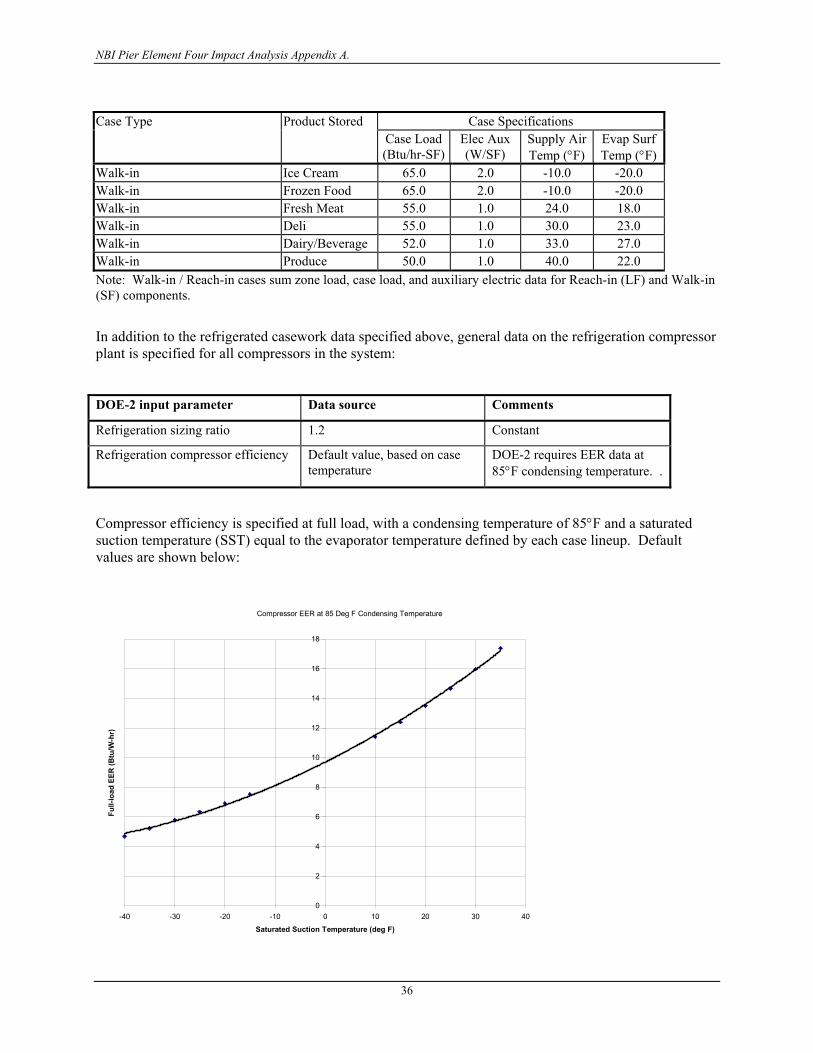
NBI Pier Element Four Impact Analysis Appendix A.
36
Case Type Product Stored Case Specifications Case Load
(Btu/hr-SF)Elec Aux (W/SF)
Supply Air Temp (°F)
Evap Surf Temp (°F)
Walk-in Ice Cream 65.0 2.0 -10.0 -20.0 Walk-in Frozen Food 65.0 2.0 -10.0 -20.0 Walk-in Fresh Meat 55.0 1.0 24.0 18.0 Walk-in Deli 55.0 1.0 30.0 23.0 Walk-in Dairy/Beverage 52.0 1.0 33.0 27.0 Walk-in Produce 50.0 1.0 40.0 22.0 Note: Walk-in / Reach-in cases sum zone load, case load, and auxiliary electric data for Reach-in (LF) and Walk-in (SF) components.
In addition to the refrigerated casework data specified above, general data on the refrigeration compressor plant is specified for all compressors in the system:
DOE-2 input parameter Data source Comments
Refrigeration sizing ratio 1.2 Constant
Refrigeration compressor efficiency Default value, based on case temperature
DOE-2 requires EER data at 85°F condensing temperature. .
Compressor efficiency is specified at full load, with a condensing temperature of 85°F and a saturated suction temperature (SST) equal to the evaporator temperature defined by each case lineup. Default values are shown below:
Compressor EER at 85 Deg F Condensing Temperature
0
2
4
6
8
10
12
14
16
18
-40 -30 -20 -10 0 10 20 30 40
Saturated Suction Temperature (deg F)
Full-
load
EER
(Btu
/W-h
r)

NBI Pier Element Four Impact Analysis Appendix A.
37
DOE-2 input parameter Data source Comments
Refrigeration condenser fan kW Default
Minimum condensing temperature 82 deg F
Refrigeration condenser type Air
Condenser fan control On-site survey 1 speed,.
Nominal condenser capacity Self-sized
HVAC System Sizing
HVAC system sizing for the as-built case is determined by direct observation of the nameplate capacities of the HVAC equipment. The installed HVAC system capacity is compared to the design loads imposed on the system to determine a sizing ratio for the as-built building. The design cooling loads are calculated from a design-day simulation. The specification of the design-day simulation is described below:
DOE-2 input parameter Data source Comments
Run period Sep 1 through Sep 8
Clearness 1.0 Same for heating and cooling
Cloud amount 0.0 Same for heating and cooling
Cloud type Cirrus
Daily maximum drybulb temp Summer design drybulb temperature for particular location.
Daily maximum dewpoint temp Summer design wet bulb temperature for particular location, converted to dewpoint
Hour of maximum temperature 16:00
Hour of minimum temperature 04:00
Diurnal temperature swing 10 °F
Wind speed 0
Lighting, equipment, and occupancy schedules
Schedules set to 1 for all hours
Window shading schedules Windows unshaded for all hours.
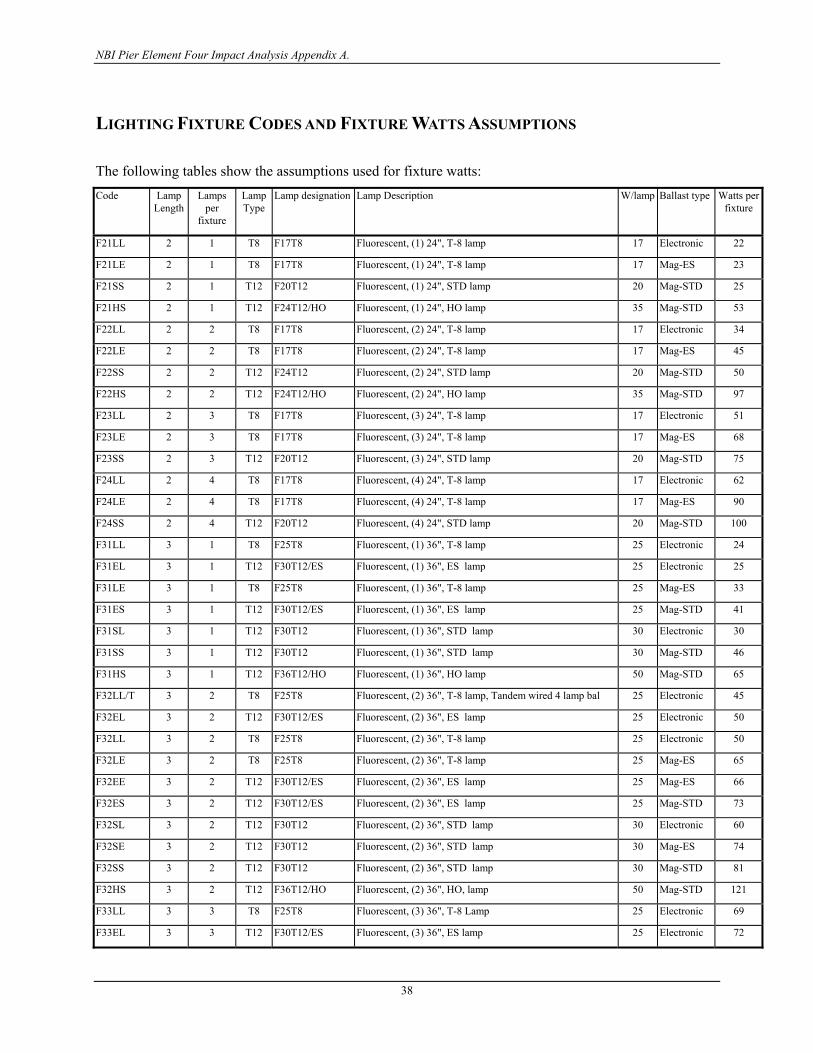
NBI Pier Element Four Impact Analysis Appendix A.
38
LIGHTING FIXTURE CODES AND FIXTURE WATTS ASSUMPTIONS
The following tables show the assumptions used for fixture watts: Code Lamp
Length Lamps
per fixture
Lamp Type
Lamp designation Lamp Description W/lamp Ballast type Watts per fixture
F21LL 2 1 T8 F17T8 Fluorescent, (1) 24", T-8 lamp 17 Electronic 22
F21LE 2 1 T8 F17T8 Fluorescent, (1) 24", T-8 lamp 17 Mag-ES 23
F21SS 2 1 T12 F20T12 Fluorescent, (1) 24", STD lamp 20 Mag-STD 25
F21HS 2 1 T12 F24T12/HO Fluorescent, (1) 24", HO lamp 35 Mag-STD 53
F22LL 2 2 T8 F17T8 Fluorescent, (2) 24", T-8 lamp 17 Electronic 34
F22LE 2 2 T8 F17T8 Fluorescent, (2) 24", T-8 lamp 17 Mag-ES 45
F22SS 2 2 T12 F24T12 Fluorescent, (2) 24", STD lamp 20 Mag-STD 50
F22HS 2 2 T12 F24T12/HO Fluorescent, (2) 24", HO lamp 35 Mag-STD 97
F23LL 2 3 T8 F17T8 Fluorescent, (3) 24", T-8 lamp 17 Electronic 51
F23LE 2 3 T8 F17T8 Fluorescent, (3) 24", T-8 lamp 17 Mag-ES 68
F23SS 2 3 T12 F20T12 Fluorescent, (3) 24", STD lamp 20 Mag-STD 75
F24LL 2 4 T8 F17T8 Fluorescent, (4) 24", T-8 lamp 17 Electronic 62
F24LE 2 4 T8 F17T8 Fluorescent, (4) 24", T-8 lamp 17 Mag-ES 90
F24SS 2 4 T12 F20T12 Fluorescent, (4) 24", STD lamp 20 Mag-STD 100
F31LL 3 1 T8 F25T8 Fluorescent, (1) 36", T-8 lamp 25 Electronic 24
F31EL 3 1 T12 F30T12/ES Fluorescent, (1) 36", ES lamp 25 Electronic 25
F31LE 3 1 T8 F25T8 Fluorescent, (1) 36", T-8 lamp 25 Mag-ES 33
F31ES 3 1 T12 F30T12/ES Fluorescent, (1) 36", ES lamp 25 Mag-STD 41
F31SL 3 1 T12 F30T12 Fluorescent, (1) 36", STD lamp 30 Electronic 30
F31SS 3 1 T12 F30T12 Fluorescent, (1) 36", STD lamp 30 Mag-STD 46
F31HS 3 1 T12 F36T12/HO Fluorescent, (1) 36", HO lamp 50 Mag-STD 65
F32LL/T 3 2 T8 F25T8 Fluorescent, (2) 36", T-8 lamp, Tandem wired 4 lamp bal 25 Electronic 45
F32EL 3 2 T12 F30T12/ES Fluorescent, (2) 36", ES lamp 25 Electronic 50
F32LL 3 2 T8 F25T8 Fluorescent, (2) 36", T-8 lamp 25 Electronic 50
F32LE 3 2 T8 F25T8 Fluorescent, (2) 36", T-8 lamp 25 Mag-ES 65
F32EE 3 2 T12 F30T12/ES Fluorescent, (2) 36", ES lamp 25 Mag-ES 66
F32ES 3 2 T12 F30T12/ES Fluorescent, (2) 36", ES lamp 25 Mag-STD 73
F32SL 3 2 T12 F30T12 Fluorescent, (2) 36", STD lamp 30 Electronic 60
F32SE 3 2 T12 F30T12 Fluorescent, (2) 36", STD lamp 30 Mag-ES 74
F32SS 3 2 T12 F30T12 Fluorescent, (2) 36", STD lamp 30 Mag-STD 81
F32HS 3 2 T12 F36T12/HO Fluorescent, (2) 36", HO, lamp 50 Mag-STD 121
F33LL 3 3 T8 F25T8 Fluorescent, (3) 36", T-8 Lamp 25 Electronic 69
F33EL 3 3 T12 F30T12/ES Fluorescent, (3) 36", ES lamp 25 Electronic 72

NBI Pier Element Four Impact Analysis Appendix A.
39
Code Lamp
Length Lamps
per fixture
Lamp Type
Lamp designation Lamp Description W/lamp Ballast type Watts per fixture
F33LE 3 3 T8 F25T8 Fluorescent, (3) 36", T-8 lamp 25 Mag-ES 98
F33ES 3 3 T12 F30T12/ES Fluorescent, (3) 36", ES lamp 25 Mag-STD 115
F33SL 3 3 T12 F30T12 Fluorescent, (3) 36", STD lamp 30 Electronic 86
F33SS 3 3 T12 F30T12 Fluorescent, (3) 36", STD lamp 30 Mag-STD 127
F33HS 3 3 T12 F36T12/HO Fluorescent, (3) 36", HO, lamp 50 Mag-STD 186
F34LL 3 4 T8 F25T8 Fluorescent, (4) 36", T-8 lamp 25 Electronic 90
F34LE 3 4 T8 F25T8 Fluorescent, (4) 36", T-8 lamp 25 Mag-ES 130
F34ES 3 4 T12 F30T12/ES Fluorescent, (4) 36", ES lamp 25 Mag-STD 146
F34SL 3 4 T12 F30T12 Fluorescent, (4) 36", STD lamp 30 Electronic 120
F34SE 3 4 T12 F30T12 Fluorescent, (4) 36", STD lamp 30 Mag-ES 148
F34SS 3 4 T12 F30T12 Fluorescent, (4) 36", STD lamp 30 Mag-STD 162
F34HS 3 4 T12 F36T12/HO Fluorescent, (4) 36", HO, lamp 50 Mag-STD 242
F41EIS 4 1 T12 F48T12/ES Fluorescent, (1) 48", ES IS lamp 30 Mag-STD 51
F41LL/T4 4 1 T8 F32T8 Fluorescent, (1) 48", T-8 lamp, Tandem Wired (4 lamp ba 32 Electronic 28
F41LL/T3 4 1 T8 F32T8 Fluorescent, (1) 48", T-8 lamp, Tandem Wired (3 lamp ba 32 Electronic 30
F41LL 4 1 T8 F32T8 Fluorescent, (1) 48", T-8 lamp 32 Electronic 30
F41LL/T2 4 1 T8 F32T8 Fluorescent, (1) 48", T-8 lamp, Tandem Wired (2 lamp ba 32 Electronic 31
F41LE 4 1 T8 F32T8 Fluorescent, (1) 48", T-8 lamp 32 Mag-ES 37
F41EL 4 1 T12 F40T12/ES Fluorescent, (1) 48", ES lamp 34 Electronic 30
F41EE 4 1 T12 F40T12/ES Fluorescent, (1) 48", ES lamp 34 Mag-ES 43
F41ES 4 1 T12 F40T12/ES Fluorescent, (1) 48", ES lamp 34 Mag-STD 50
F41SL 4 1 T12 F40T12 Fluorescent, (1) 48", STD lamp 40 Electronic 37
F41SE 4 1 T12 F40T12 Fluorescent, (1) 48", STD lamp 40 Mag-ES 50
F41SE/2 4 1 T12 F40T12 Fluorescent, (1) 48", STD lamp, 2 ballasts (delamped) 40 Mag-ES 52
F41SS 4 1 T12 F40T12 Fluorescent, (1) 48", STD lamp 40 Mag-STD 57
F41TS 4 1 T10 F40T10 Fluorescent, (1) 48", T-10 lamp 40 Mag-STD 58
F41SIS 4 1 T12 F48T12 Fluorescent, (1) 48", STD IS lamp 40 Mag-STD 59
F41EHS 4 1 T12 F48T12/HO/ES Fluorescent, (1) 48", ES HO lamp 55 Mag-STD 80
F41SHS 4 1 T12 F48T12/HO Fluorescent, (1) 48", STD HO lamp 60 Mag-STD 85
F41SVS 4 1 T12 F48T12/VHO Fluorescent, (1) 48", STD VHO lamp 110 Mag-STD 134
F42EIS 4 2 T12 F48T12/ES Fluorescent, (2) 48", ES IS lamp 30 Mag-STD 81
F42LL/T 4 2 T8 F32T8 Fluorescent, (2) 48", T-8 lamp, Tandem Wired 32 Electronic 55
F42LL 4 2 T8 F32T8 Fluorescent, (2) 48", T-8 lamp 32 Electronic 62
F42LE 4 2 T8 F32T8 Fluorescent, (2) 48", T-8 lamp 32 Mag-ES 71
F42EL 4 2 T12 F40T12/ES Fluorescent, (2) 48", ES lamp 34 Electronic 59
F42EE 4 2 T12 F40T12/ES Fluorescent, (2) 48", ES lamp 34 Mag-ES 72
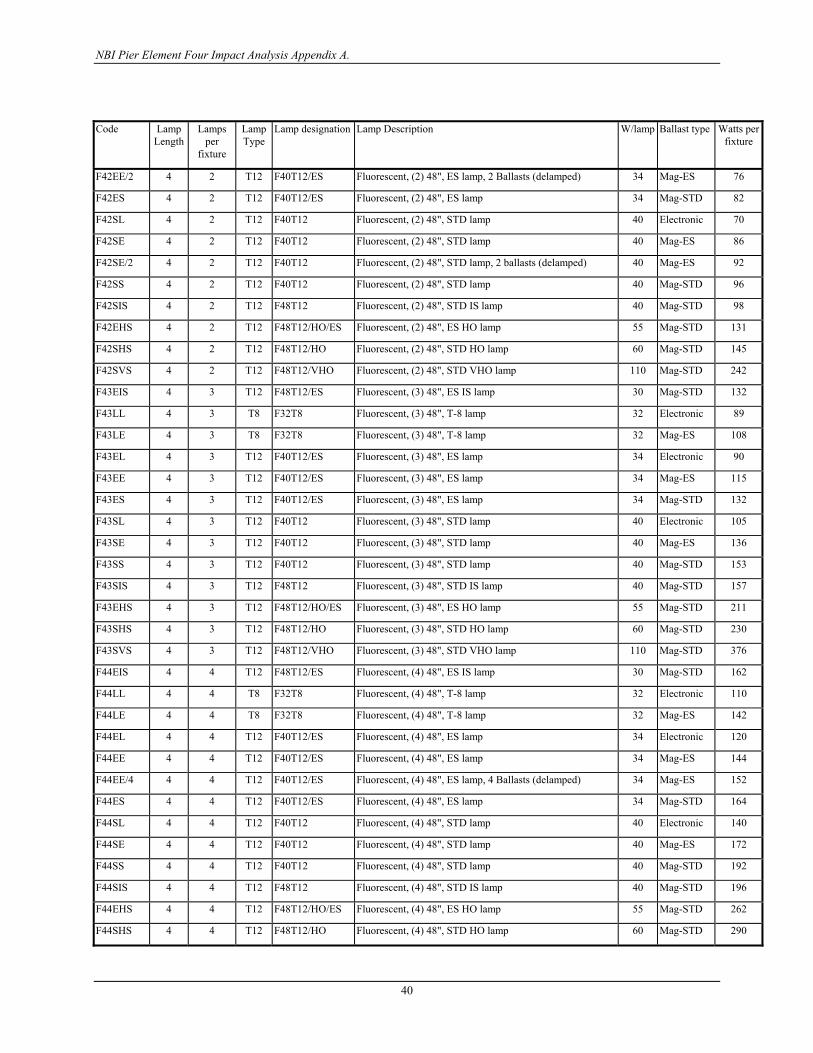
NBI Pier Element Four Impact Analysis Appendix A.
40
Code Lamp
Length Lamps
per fixture
Lamp Type
Lamp designation Lamp Description W/lamp Ballast type Watts per fixture
F42EE/2 4 2 T12 F40T12/ES Fluorescent, (2) 48", ES lamp, 2 Ballasts (delamped) 34 Mag-ES 76
F42ES 4 2 T12 F40T12/ES Fluorescent, (2) 48", ES lamp 34 Mag-STD 82
F42SL 4 2 T12 F40T12 Fluorescent, (2) 48", STD lamp 40 Electronic 70
F42SE 4 2 T12 F40T12 Fluorescent, (2) 48", STD lamp 40 Mag-ES 86
F42SE/2 4 2 T12 F40T12 Fluorescent, (2) 48", STD lamp, 2 ballasts (delamped) 40 Mag-ES 92
F42SS 4 2 T12 F40T12 Fluorescent, (2) 48", STD lamp 40 Mag-STD 96
F42SIS 4 2 T12 F48T12 Fluorescent, (2) 48", STD IS lamp 40 Mag-STD 98
F42EHS 4 2 T12 F48T12/HO/ES Fluorescent, (2) 48", ES HO lamp 55 Mag-STD 131
F42SHS 4 2 T12 F48T12/HO Fluorescent, (2) 48", STD HO lamp 60 Mag-STD 145
F42SVS 4 2 T12 F48T12/VHO Fluorescent, (2) 48", STD VHO lamp 110 Mag-STD 242
F43EIS 4 3 T12 F48T12/ES Fluorescent, (3) 48", ES IS lamp 30 Mag-STD 132
F43LL 4 3 T8 F32T8 Fluorescent, (3) 48", T-8 lamp 32 Electronic 89
F43LE 4 3 T8 F32T8 Fluorescent, (3) 48", T-8 lamp 32 Mag-ES 108
F43EL 4 3 T12 F40T12/ES Fluorescent, (3) 48", ES lamp 34 Electronic 90
F43EE 4 3 T12 F40T12/ES Fluorescent, (3) 48", ES lamp 34 Mag-ES 115
F43ES 4 3 T12 F40T12/ES Fluorescent, (3) 48", ES lamp 34 Mag-STD 132
F43SL 4 3 T12 F40T12 Fluorescent, (3) 48", STD lamp 40 Electronic 105
F43SE 4 3 T12 F40T12 Fluorescent, (3) 48", STD lamp 40 Mag-ES 136
F43SS 4 3 T12 F40T12 Fluorescent, (3) 48", STD lamp 40 Mag-STD 153
F43SIS 4 3 T12 F48T12 Fluorescent, (3) 48", STD IS lamp 40 Mag-STD 157
F43EHS 4 3 T12 F48T12/HO/ES Fluorescent, (3) 48", ES HO lamp 55 Mag-STD 211
F43SHS 4 3 T12 F48T12/HO Fluorescent, (3) 48", STD HO lamp 60 Mag-STD 230
F43SVS 4 3 T12 F48T12/VHO Fluorescent, (3) 48", STD VHO lamp 110 Mag-STD 376
F44EIS 4 4 T12 F48T12/ES Fluorescent, (4) 48", ES IS lamp 30 Mag-STD 162
F44LL 4 4 T8 F32T8 Fluorescent, (4) 48", T-8 lamp 32 Electronic 110
F44LE 4 4 T8 F32T8 Fluorescent, (4) 48", T-8 lamp 32 Mag-ES 142
F44EL 4 4 T12 F40T12/ES Fluorescent, (4) 48", ES lamp 34 Electronic 120
F44EE 4 4 T12 F40T12/ES Fluorescent, (4) 48", ES lamp 34 Mag-ES 144
F44EE/4 4 4 T12 F40T12/ES Fluorescent, (4) 48", ES lamp, 4 Ballasts (delamped) 34 Mag-ES 152
F44ES 4 4 T12 F40T12/ES Fluorescent, (4) 48", ES lamp 34 Mag-STD 164
F44SL 4 4 T12 F40T12 Fluorescent, (4) 48", STD lamp 40 Electronic 140
F44SE 4 4 T12 F40T12 Fluorescent, (4) 48", STD lamp 40 Mag-ES 172
F44SS 4 4 T12 F40T12 Fluorescent, (4) 48", STD lamp 40 Mag-STD 192
F44SIS 4 4 T12 F48T12 Fluorescent, (4) 48", STD IS lamp 40 Mag-STD 196
F44EHS 4 4 T12 F48T12/HO/ES Fluorescent, (4) 48", ES HO lamp 55 Mag-STD 262
F44SHS 4 4 T12 F48T12/HO Fluorescent, (4) 48", STD HO lamp 60 Mag-STD 290
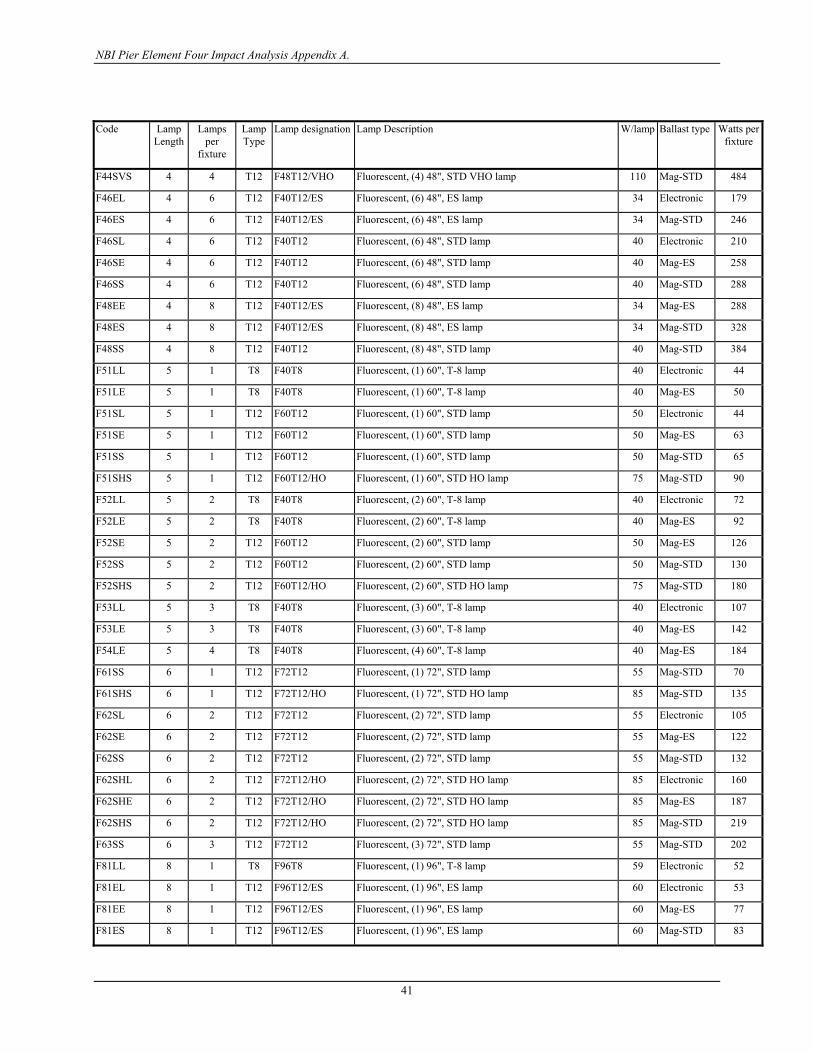
NBI Pier Element Four Impact Analysis Appendix A.
41
Code Lamp
Length Lamps
per fixture
Lamp Type
Lamp designation Lamp Description W/lamp Ballast type Watts per fixture
F44SVS 4 4 T12 F48T12/VHO Fluorescent, (4) 48", STD VHO lamp 110 Mag-STD 484
F46EL 4 6 T12 F40T12/ES Fluorescent, (6) 48", ES lamp 34 Electronic 179
F46ES 4 6 T12 F40T12/ES Fluorescent, (6) 48", ES lamp 34 Mag-STD 246
F46SL 4 6 T12 F40T12 Fluorescent, (6) 48", STD lamp 40 Electronic 210
F46SE 4 6 T12 F40T12 Fluorescent, (6) 48", STD lamp 40 Mag-ES 258
F46SS 4 6 T12 F40T12 Fluorescent, (6) 48", STD lamp 40 Mag-STD 288
F48EE 4 8 T12 F40T12/ES Fluorescent, (8) 48", ES lamp 34 Mag-ES 288
F48ES 4 8 T12 F40T12/ES Fluorescent, (8) 48", ES lamp 34 Mag-STD 328
F48SS 4 8 T12 F40T12 Fluorescent, (8) 48", STD lamp 40 Mag-STD 384
F51LL 5 1 T8 F40T8 Fluorescent, (1) 60", T-8 lamp 40 Electronic 44
F51LE 5 1 T8 F40T8 Fluorescent, (1) 60", T-8 lamp 40 Mag-ES 50
F51SL 5 1 T12 F60T12 Fluorescent, (1) 60", STD lamp 50 Electronic 44
F51SE 5 1 T12 F60T12 Fluorescent, (1) 60", STD lamp 50 Mag-ES 63
F51SS 5 1 T12 F60T12 Fluorescent, (1) 60", STD lamp 50 Mag-STD 65
F51SHS 5 1 T12 F60T12/HO Fluorescent, (1) 60", STD HO lamp 75 Mag-STD 90
F52LL 5 2 T8 F40T8 Fluorescent, (2) 60", T-8 lamp 40 Electronic 72
F52LE 5 2 T8 F40T8 Fluorescent, (2) 60", T-8 lamp 40 Mag-ES 92
F52SE 5 2 T12 F60T12 Fluorescent, (2) 60", STD lamp 50 Mag-ES 126
F52SS 5 2 T12 F60T12 Fluorescent, (2) 60", STD lamp 50 Mag-STD 130
F52SHS 5 2 T12 F60T12/HO Fluorescent, (2) 60", STD HO lamp 75 Mag-STD 180
F53LL 5 3 T8 F40T8 Fluorescent, (3) 60", T-8 lamp 40 Electronic 107
F53LE 5 3 T8 F40T8 Fluorescent, (3) 60", T-8 lamp 40 Mag-ES 142
F54LE 5 4 T8 F40T8 Fluorescent, (4) 60", T-8 lamp 40 Mag-ES 184
F61SS 6 1 T12 F72T12 Fluorescent, (1) 72", STD lamp 55 Mag-STD 70
F61SHS 6 1 T12 F72T12/HO Fluorescent, (1) 72", STD HO lamp 85 Mag-STD 135
F62SL 6 2 T12 F72T12 Fluorescent, (2) 72", STD lamp 55 Electronic 105
F62SE 6 2 T12 F72T12 Fluorescent, (2) 72", STD lamp 55 Mag-ES 122
F62SS 6 2 T12 F72T12 Fluorescent, (2) 72", STD lamp 55 Mag-STD 132
F62SHL 6 2 T12 F72T12/HO Fluorescent, (2) 72", STD HO lamp 85 Electronic 160
F62SHE 6 2 T12 F72T12/HO Fluorescent, (2) 72", STD HO lamp 85 Mag-ES 187
F62SHS 6 2 T12 F72T12/HO Fluorescent, (2) 72", STD HO lamp 85 Mag-STD 219
F63SS 6 3 T12 F72T12 Fluorescent, (3) 72", STD lamp 55 Mag-STD 202
F81LL 8 1 T8 F96T8 Fluorescent, (1) 96", T-8 lamp 59 Electronic 52
F81EL 8 1 T12 F96T12/ES Fluorescent, (1) 96", ES lamp 60 Electronic 53
F81EE 8 1 T12 F96T12/ES Fluorescent, (1) 96", ES lamp 60 Mag-ES 77
F81ES 8 1 T12 F96T12/ES Fluorescent, (1) 96", ES lamp 60 Mag-STD 83
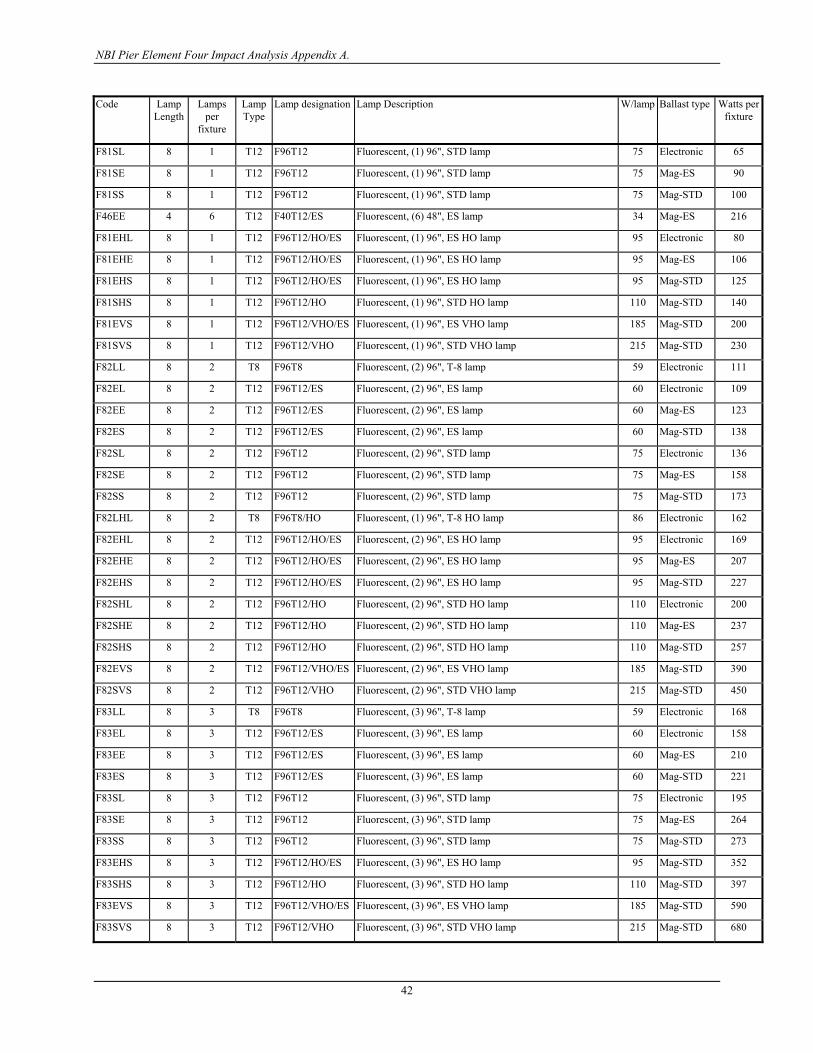
NBI Pier Element Four Impact Analysis Appendix A.
42
Code Lamp Length
Lamps per
fixture
Lamp Type
Lamp designation Lamp Description W/lamp Ballast type Watts per fixture
F81SL 8 1 T12 F96T12 Fluorescent, (1) 96", STD lamp 75 Electronic 65
F81SE 8 1 T12 F96T12 Fluorescent, (1) 96", STD lamp 75 Mag-ES 90
F81SS 8 1 T12 F96T12 Fluorescent, (1) 96", STD lamp 75 Mag-STD 100
F46EE 4 6 T12 F40T12/ES Fluorescent, (6) 48", ES lamp 34 Mag-ES 216
F81EHL 8 1 T12 F96T12/HO/ES Fluorescent, (1) 96", ES HO lamp 95 Electronic 80
F81EHE 8 1 T12 F96T12/HO/ES Fluorescent, (1) 96", ES HO lamp 95 Mag-ES 106
F81EHS 8 1 T12 F96T12/HO/ES Fluorescent, (1) 96", ES HO lamp 95 Mag-STD 125
F81SHS 8 1 T12 F96T12/HO Fluorescent, (1) 96", STD HO lamp 110 Mag-STD 140
F81EVS 8 1 T12 F96T12/VHO/ES Fluorescent, (1) 96", ES VHO lamp 185 Mag-STD 200
F81SVS 8 1 T12 F96T12/VHO Fluorescent, (1) 96", STD VHO lamp 215 Mag-STD 230
F82LL 8 2 T8 F96T8 Fluorescent, (2) 96", T-8 lamp 59 Electronic 111
F82EL 8 2 T12 F96T12/ES Fluorescent, (2) 96", ES lamp 60 Electronic 109
F82EE 8 2 T12 F96T12/ES Fluorescent, (2) 96", ES lamp 60 Mag-ES 123
F82ES 8 2 T12 F96T12/ES Fluorescent, (2) 96", ES lamp 60 Mag-STD 138
F82SL 8 2 T12 F96T12 Fluorescent, (2) 96", STD lamp 75 Electronic 136
F82SE 8 2 T12 F96T12 Fluorescent, (2) 96", STD lamp 75 Mag-ES 158
F82SS 8 2 T12 F96T12 Fluorescent, (2) 96", STD lamp 75 Mag-STD 173
F82LHL 8 2 T8 F96T8/HO Fluorescent, (1) 96", T-8 HO lamp 86 Electronic 162
F82EHL 8 2 T12 F96T12/HO/ES Fluorescent, (2) 96", ES HO lamp 95 Electronic 169
F82EHE 8 2 T12 F96T12/HO/ES Fluorescent, (2) 96", ES HO lamp 95 Mag-ES 207
F82EHS 8 2 T12 F96T12/HO/ES Fluorescent, (2) 96", ES HO lamp 95 Mag-STD 227
F82SHL 8 2 T12 F96T12/HO Fluorescent, (2) 96", STD HO lamp 110 Electronic 200
F82SHE 8 2 T12 F96T12/HO Fluorescent, (2) 96", STD HO lamp 110 Mag-ES 237
F82SHS 8 2 T12 F96T12/HO Fluorescent, (2) 96", STD HO lamp 110 Mag-STD 257
F82EVS 8 2 T12 F96T12/VHO/ES Fluorescent, (2) 96", ES VHO lamp 185 Mag-STD 390
F82SVS 8 2 T12 F96T12/VHO Fluorescent, (2) 96", STD VHO lamp 215 Mag-STD 450
F83LL 8 3 T8 F96T8 Fluorescent, (3) 96", T-8 lamp 59 Electronic 168
F83EL 8 3 T12 F96T12/ES Fluorescent, (3) 96", ES lamp 60 Electronic 158
F83EE 8 3 T12 F96T12/ES Fluorescent, (3) 96", ES lamp 60 Mag-ES 210
F83ES 8 3 T12 F96T12/ES Fluorescent, (3) 96", ES lamp 60 Mag-STD 221
F83SL 8 3 T12 F96T12 Fluorescent, (3) 96", STD lamp 75 Electronic 195
F83SE 8 3 T12 F96T12 Fluorescent, (3) 96", STD lamp 75 Mag-ES 264
F83SS 8 3 T12 F96T12 Fluorescent, (3) 96", STD lamp 75 Mag-STD 273
F83EHS 8 3 T12 F96T12/HO/ES Fluorescent, (3) 96", ES HO lamp 95 Mag-STD 352
F83SHS 8 3 T12 F96T12/HO Fluorescent, (3) 96", STD HO lamp 110 Mag-STD 397
F83EVS 8 3 T12 F96T12/VHO/ES Fluorescent, (3) 96", ES VHO lamp 185 Mag-STD 590
F83SVS 8 3 T12 F96T12/VHO Fluorescent, (3) 96", STD VHO lamp 215 Mag-STD 680
NBI Pier Element Four Impact Analysis Appendix A.
43
Code Lamp Length
Lamps per
fixture
Lamp Type
Lamp designation Lamp Description W/lamp Ballast type Watts per fixture
F84LL 8 4 T8 F96T8 Fluorescent, (4) 96", T-8 lamp 59 Electronic 216
F84EL 8 4 T12 F96T12/ES Fluorescent, (4) 96", ES lamp 60 Electronic 210
F84EE 8 4 T12 F96T12/ES Fluorescent, (4) 96", ES lamp 60 Mag-ES 246
F84ES 8 4 T12 F96T12/ES Fluorescent, (4) 96", ES lamp 60 Mag-STD 276
F84SL 8 4 T12 F96T12 Fluorescent, (4) 96", STD lamp 75 Electronic 260
F84SE 8 4 T12 F96T12 Fluorescent, (4) 96", STD lamp 75 Mag-ES 316
F84SS 8 4 T12 F96T12 Fluorescent, (4) 96", STD lamp 75 Mag-STD 346
F84EHL 8 4 T12 F96T12/HO/ES Fluorescent, (4) 96", ES HO lamp 95 Electronic 360
F84EHE 8 4 T12 F96T12/HO/ES Fluorescent, (4) 96", ES HO lamp 95 Mag-ES 414
F84EHS 8 4 T12 F96T12/HO/ES Fluorescent, (4) 96", ES HO lamp 95 Mag-STD 454
F84SHL 8 4 T12 F96T12/HO Fluorescent, (4) 96", STD HO lamp 110 Electronic 386
F84SHE 8 4 T12 F96T12/HO Fluorescent, (4) 96", STD HO lamp 110 Mag-ES 474
F84SHS 8 4 T12 F96T12/HO Fluorescent, (4) 96", STD HO lamp 110 Mag-STD 514
F84EVS 8 4 T12 F96T12/VHO/ES Fluorescent, (4) 96", ES VHO lamp 185 Mag-STD 780
F84SVS 8 4 T12 F96T12/VHO Fluorescent, (4) 96", STD VHO lamp 215 Mag-STD 900
FU1LL 1 T8 FU32T8 Fluorescent, (1) T8 U-Tube, STD lamp 32 Electronic 32
FU1LE 1 T8 FU32T8 Fluorescent, (1) T8 U-Tube, STD lamp 32 Mag-ES 37
FU1EL 1 T12 FU40T12/ES Fluorescent, (1) U-Tube, ES lamp 35 Electronic 31
FU1EE 1 T12 FU40T12/ES Fluorescent, (1) U-Tube, ES lamp 35 Mag-ES 43
FU1ES 1 T12 FB40T12/ES Fluorescent, (1) U-Tube, ES lamp 35 Mag-STD 50
FU1SL 1 T12 FU40T12 Fluorescent, (1) U-Tube, STD lamp 40 Electronic 38
FU1SE 1 T12 FU40T12 Fluorescent, (1) U-Tube, STD lamp 40 Mag-ES 50
FU1SS 1 T12 FB40T12 Fluorescent, (1) U-Tube, STD lamp 40 Mag-STD 57
FU2LL 2 T8 FU32T8 Fluorescent, (2) T8 U-Tube, STD lamp 32 Electronic 62
FU2LE 2 T8 FU32T8 Fluorescent, (2) T8 U-Tube, STD lamp 32 Mag-ES 71
FU2EL 2 T12 FU40T12/ES Fluorescent, (2) U-Tube, ES lamp 35 Electronic 60
FU2EE 2 T12 FU40T12/ES Fluorescent, (2) U-Tube, ES lamp 35 Mag-ES 72
FU2ES 2 T12 FB40T12/ES Fluorescent, (2) U-Tube, ES lamp 35 Mag-STD 82
FU2SL 2 T12 FU40T12 Fluorescent, (2) U-Tube, STD lamp 40 Electronic 72
FU2SE 2 T12 FU40T12 Fluorescent, (2) U-Tube, STD lamp 40 Mag-ES 86
FU2SS 2 T12 FB40T12 Fluorescent, (2) U-Tube, STD lamp 40 Mag-STD 96
FU3LL 3 T8 FU32T8 Fluorescent, (3) T8 U-Tube, STD lamp 32 Electronic 94
FU3EL 3 T12 FU40T12/ES Fluorescent, (3) U-Tube, ES lamp 35 Electronic 107
FU3EE 3 T12 FU40T12/ES Fluorescent, (3) U-Tube, ES lamp 35 Mag-ES 115
FU3ES 3 T12 FU40T12/ES Fluorescent, (3) U-Tube, ES lamp 35 Mag-STD 132
FU3SL 3 T12 FU40T12 Fluorescent, (3) U-Tube, STD lamp 40 Electronic 107
FU3SE 3 T12 FU40T12 Fluorescent, (3) U-Tube, STD lamp 40 Mag-ES 136

NBI Pier Element Four Impact Analysis Appendix A.
44
Code Lamp Length
Lamps per
fixture
Lamp Type
Lamp designation Lamp Description W/lamp Ballast type Watts per fixture
FU3SS 3 T12 FU40T12 Fluorescent, (3) U-Tube, ES lamp 40 Mag-STD 140
FU3SS 3 T12 FB40T12 Fluorescent, (3) U-Tube, STD lamp 40 Mag-STD 153
FU4LL 4 T8 FU32T8 Fluorescent, (4) T8 U-Tube, STD lamp 32 Electronic 108
FU4ES 4 T12 FB40T12/ES Fluorescent, (4) U-Tube, ES lamp 35 Mag-STD 164
FU4SS 4 T12 FB40T12 Fluorescent, (4) U-Tube, STD lamp 40 Mag-STD 192
FC6/1 1 T9 FC6T9 Fluorescent, (1) 6" circular lamp 20 Mag-STD 22
FC20 1 T12 FC20W Fluorescent, Circlite, (1) 20W lamp 20 Mag-STD 22
FC22 1 T12 FC22W Fluorescent, Circlite, (1) 22W lamp 22 Mag-STD 24
FC8/1 1 T9 FC8T9 Fluorescent, (1) 8" circular lamp 22 Mag-STD 35
FC27 1 T12 FC27W Fluorescent, Circlite, (1) 27W lamp 27 Mag-STD 29
FC12/1 1 T9 FC12T9 Fluorescent, (1) 12" circular lamp 32 Mag-STD 34
FC16/1 1 T9 FC16T9 Fluorescent, (1) 16" circular lamp 40 Mag-STD 44
FC8/2 2 T9 FC8T9 Fluorescent, (2) 8" circular lamp 22 Mag-STD 70
FC12/2 2 T9 FC12T9 Fluorescent, (2) 12" circular lamp 32 Mag-STD 68
CFT5/1 1 CFT5W Compact Fluorescent, twin, (1) 5W lamp 5 Mag-STD 9
CF7/INT 1 CFI7W Compact Fluorescent, Integral, (1) 7W lamp 7 Mag-STD 9
CFT7/1 1 CFT7W Compact Fluorescent, twin, (1) 7W lamp 7 Mag-STD 11
CF9/INT 1 CFI9W Compact Fluorescent, Integral, (1) 9W lamp 9 Mag-STD 11
CFQ9/1 1 CFQ9W Compact Fluorescent, quad, (1) 9W lamp 9 Mag-STD 13
CFT9/1 1 CFT9W Compact Fluorescent, twin, (1) 9W lamp 9 Mag-STD 13
CF10/2D 1 CFD10W Compact Fluorescent, 2D, (1) 10W lamp 10 Mag-STD 12
CFQ10A/1 1 CFQ10W Compact Fluorescent, quad, (1) 10W lamp, Autotransforme 10 Mag-STD 16
CF11/GL 1 CFG11W Compact Fluorescent, Globe, (1) 11W lamp 11 Mag-STD 11
CF13/CAP 1 CFC13W Compact Fluorescent, Capsule, (1) 13W lamp 13 Mag-STD 13
CF13/INT 1 CFI13W Compact Fluorescent, Integral, (1) 13W lamp 13 Mag-STD 15
CF15/GL 1 CFG15W Compact Fluorescent, Globe, (1) 15W lamp 13 Mag-STD 15
CFT13/1 1 CFT13W Compact Fluorescent, twin, (1) 13W lamp 13 Mag-STD 17
CFQ13/1 1 CFQ13W Compact Fluorescent, quad, (1) 13W lamp 13 Mag-STD 18
CFQ15/1 1 CFQ15W Compact Fluorescent, quad, (1) 15W lamp 15 Mag-STD 20
CF16/2D 1 CFD16W Compact Fluorescent, 2D, (1) 16W lamp 16 Mag-STD 18
CF18/CAP 1 CFC18W Compact Fluorescent, Capsule, (1) 18W lamp 18 Mag-STD 18
BX18/1 1 FT18T5 Fluorescent, Biax, (1) 18W lamp 18 Mag-STD 20
CFQ18R/1 1 CFQ18W Compact Fluorescent, quad, (1) 18W lamp, Reactor 18 Mag-STD 22
CFT18IS/1 1 CFT18W Compact Fluorescent, twin, instant start (1) 18W lamp 18 Mag-STD 22
CFQ18A/1 1 CFQ18W Compact Fluorescent, quad, (1) 18W lamp, Autotransforme 18 Mag-STD 25
CFT18RS/1 1 CFT18W Compact Fluorescent, twin, rapid start (1) 18W lamp 18 Mag-STD 25
CF20/INT 1 CFI20W Compact Fluorescent, Integral, (1) 20W lamp 20 Mag-STD 20
NBI Pier Element Four Impact Analysis Appendix A.
45
Code Lamp Length
Lamps per
fixture
Lamp Type
Lamp designation Lamp Description W/lamp Ballast type Watts per fixture
CF26/INT 1 CFI26W Compact Fluorescent, Integral, (1) 26W lamp 20 Mag-STD 26
CFQ20/1 1 CFQ20W Compact Fluorescent, quad, (1) 20W lamp 20 Mag-STD 27
CF21/2D 1 CFD21W Compact Fluorescent, 2D, (1) 21W lamp 21 Mag-STD 23
BX24/1 1 FT24T5 Fluorescent, Biax, (1) 24W lamp 24 Mag-STD 26
CFQ26/1 1 CFQ26W Compact Fluorescent, quad, (1) 26W lamp 26 Electronic 25
CFQ26R/1 1 CFQ26W Compact Fluorescent, quad, (1) 26W lamp, Reactor 26 Mag-STD 31
CFQ26A/1 1 CFQ26W Compact Fluorescent, quad, (1) 26W lamp, Autotransforme 26 Mag-STD 37
CFT27IS/1 1 CFT27W Compact Fluorescent, twin, instant start (1) 27W lamp 27 Mag-STD 28
CFT27RS/1 1 CFT27W Compact Fluorescent, twin, rapid start (1) 27W lamp 27 Mag-STD 32
CFQ27/1 1 CFQ27W Compact Fluorescent, quad, (1) 27W lamp 27 Mag-STD 34
CF28/2D 1 CFD28W Compact Fluorescent, 2D, (1) 28W lamp 28 Mag-STD 30
BX36/1 1 FT36T5 Fluorescent, Biax, (1) 36W lamp 36 Mag-STD 40
CFT36/1 1 CFT36W Compact Fluorescent, twin, (1) 36W lamp 36 Mag-STD 51
CF38/2D 1 CFD38W Compact Fluorescent, 2D, (1) 38W lamp 38 Mag-STD 44
CFT40/1 1 CFT40W Compact Fluorescent, twin, (1) 40W lamp 40 Mag-STD 48
CFT50/1 1 CFT50W Compact Fluorescent, twin, (1) 50W lamp 50 Mag-STD 46
CFT5/2 2 CFT5W Compact Fluorescent, twin, (2) 5W lamp 5 Mag-STD 14
CFT7/2 2 CFT7W Compact Fluorescent, twin, (2) 7W lamp 7 Mag-STD 18
CFT9/2 2 CFT9W Compact Fluorescent, twin, (2) 9W lamp 9 Mag-STD 22
CFQ13/2 2 CFQ13W Compact Fluorescent, quad, (2) 13W lamp 13 Mag-STD 34
CFT13/2 2 CFT13W Compact Fluorescent, twin, (2) 13W lamp 13 Mag-STD 34
CFQ18/2 2 CFQ18W Compact Fluorescent, quad, (2) 18W lamp 18 Mag-STD 42
CFT18IS/2 2 CFT18W Compact Fluorescent, twin, instant start (2) 18W lamp 18 Mag-STD 46
CFT18RS/2 2 CFT18W Compact Fluorescent, twin, rapid start (2) 18W lamp 18 Mag-STD 46
CFQ18/4 2 CFQ18W Compact Fluorescent, quad, (4) 18W lamp 18 Mag-STD 84
CFQ26/2 2 CFQ26W Compact Fluorescent, quad, (2) 26W lamp 26 Electronic 50
CFT27IS/2 2 CFT27W Compact Fluorescent, twin, instant start (2) 27W lamp 27 Mag-STD 60
CFT27RS/2 2 CFT27W Compact Fluorescent, twin, rapid start (2) 27W lamp 27 Mag-STD 66
CFT36/2 2 CFT36W Compact Fluorescent, twin, (2) 36W lamp 36 Mag-STD 88
CFT40/2 2 CFT40W Compact Fluorescent, twin, (2) 40W lamp 40 Mag-STD 82
CFT50/2 2 CFT50W Compact Fluorescent, twin, (2) 50W lamp 50 Mag-STD 82
ELED2/1 1 LED2W EXIT Light Emitting Diode, (1) 2W lamp, Single Sided 2 2
EI5/1 1 EXIT Incandescent, (1) 5W lamp 5 5
EMFL5/1 1 F5TT EXIT Emergency Fluorescent, (1) 5W Twin tube lamp 5 20
EFL7/1 1 F7TT EXIT Fluorescent, (1) 7W Twin tube lamp 7 10
EMFL7/1 1 F7TT EXIT Emergency Fluorescent, (1) 7W Twin tube lamp 7 16
EFL8/1 1 F8T5 EXIT Fluorescent, (1) 8W T5 Min. Bipin lamp 8 10

NBI Pier Element Four Impact Analysis Appendix A.
46
Code Lamp Length
Lamps per
fixture
Lamp Type
Lamp designation Lamp Description W/lamp Ballast type Watts per fixture
EMFL8/1 1 F8T5 EXIT Emergency Fluorescent, (1) 8W T5 Min. Bipin lamp 8 14
EI15/1 1 EXIT Incandescent, (1) 15W lamp 15 15
EI25/1 1 EXIT Incandescent, (1) 25W lamp 25 25
ELED2/2 2 LED2W EXIT Light Emitting Diode, (2) 2W lamp, Dual Sided 2 4
EI5/2 2 EXIT Incandescent, (2) 5W lamp 5 10
EFL5/2 2 F5TT EXIT Fluorescent, (2) 5W Twin tube lamp 5 16
EMFL5/2 2 F5TT EXIT Emergency Fluorescent, (2) 5W Twin tube lamp 5 22
EFL7/2 2 F7TT EXIT Fluorescent, (2) 7W Twin tube lamp 7 19
EFL8/2 2 F8T5 EXIT Fluorescent, (2) 8W T5 Min. Bipin lamp 8 20
EMFL8/2 2 F8T5 EXIT Emergency Fluorescent, (2) 8W T5 Min. Bipin lamp 8 24
EI15/2 2 EXIT Incandescent, (2) 15W lamp 15 30
EI25/2 2 EXIT Incandescent, (2) 25W lamp 25 50
EI50/2 2 EXIT Incandescent, (2) 50W lamp 50 100
H45/1 1 H45 Halogen Incandescent, (1) 45W lamp 45 45
H50/1 1 H50 Halogen Incandescent, (1) 50W lamp 50 50
H52/1 1 H52 Halogen Incandescent, (1) 52W lamp 52 52
H72/1 1 H72 Halogen Incandescent, (1) 72W lamp 72 72
H90/1 1 H90 Halogen Incandescent, (1) 90W lamp 90 90
HPS35/1 1 HPS35 High Pressure Sodium, (1) 35W lamp 35 44
HPS50/1 1 HPS50 High Pressure Sodium, (1) 50W lamp 50 61
HPS70/1 1 HPS70 High Pressure Sodium, (1) 70W lamp 70 83
HPS100/1 1 HPS100 High Pressure Sodium, (1) 100W lamp 100 116
HPS150/1 1 HPS150 High Pressure Sodium, (1) 150W lamp 150 173
HPS200/1 1 HPS200 High Pressure Sodium, (1) 200W lamp 200 240
HPS250/1 1 HPS250 High Pressure Sodium, (1) 250W lamp 250 302
HPS310/1 1 HPS310 High Pressure Sodium, (1) 310W lamp 310 355
HPS360/1 1 HPS360 High Pressure Sodium, (1) 360W lamp 360 395
HPS400/1 1 HPS400 High Pressure Sodium, (1) 400W lamp 400 469
HPS1000/1 1 HPS1000 High Pressure Sodium, (1) 1000W lamp 1000 1090
I25/1 1 I25 Incandescent, (1) 25W lamp 25 25
I40E/1 1 I40/ES Incandescent, (1) 40W ES lamp 34 34
I40EL/1 1 I40/ES/LL Incandescent, (1) 40W ES/LL lamp 34 34
I40/1 1 I40 Incandescent, (1) 40W lamp 40 40
I50/1 1 I50 Incandescent, (1) 50W lamp 50 50
I60E/1 1 I60/ES Incandescent, (1) 60W ES lamp 52 52
I60EL/1 1 I60/ES/LL Incandescent, (1) 60W ES/LL lamp 52 52
I60/1 1 I60 Incandescent, (1) 60W lamp 60 60

NBI Pier Element Four Impact Analysis Appendix A.
47
Code Lamp Length
Lamps per
fixture
Lamp Type
Lamp designation Lamp Description W/lamp Ballast type Watts per fixture
I75E/1 1 I75/ES Incandescent, (1) 75W ES lamp 67 67
I75EL/1 1 I75/ES/LL Incandescent, (1) 75W ES/LL lamp 67 67
I75/1 1 I75 Incandescent, (1) 75W lamp 75 75
I100E/1 1 I100/ES Incandescent, (1) 100W ES lamp 90 90
I100EL/1 1 I100/ES/LL Incandescent, (1) 100W ES/LL lamp 90 90
I100/1 1 I100 Incandescent, (1) 100W lamp 100 100
I150E/1 1 I150/ES Incandescent, (1) 150W ES lamp 135 135
I150EL/1 1 I150/ES/LL Incandescent, (1) 150W ES/LL lamp 135 135
I150/1 1 I150 Incandescent, (1) 150W lamp 150 150
I200/1 1 I200 Incandescent, (1) 200W lamp 200 200
I200L/1 1 I200/LL Incandescent, (1) 200W LL lamp 200 200
I250/1 1 I250 Incandescent, (1) 250W lamp 250 250
I300/1 1 I300 Incandescent, (1) 300W lamp 300 300
I400/1 1 I400 Incandescent, (1) 400W lamp 400 400
I500/1 1 I500 Incandescent, (1) 500W lamp 500 500
I55/1 1 I55 Incandescent, (1) 55W lamp 500 500
I1000/1 1 I1000 Incandescent, (1) 1000W lamp 1000 1000
I40/2 2 I40 Incandescent, (2) 40W lamp 40 80
I50/2 2 I50 Incandescent, (2) 50W lamp 50 100
I60/2 2 I60 Incandescent, (2) 60W lamp 60 120
I75/2 2 I75 Incandescent, (2) 75W lamp 75 150
I100/2 2 I100 Incandescent, (2) 100W lamp 100 200
I150/2 2 I150 Incandescent, (2) 150W lamp 150 300
I100/3 3 I100 Incandescent, (3) 100W lamp 100 300
I100/4 4 I100 Incandescent, (4) 100W lamp 100 400
MH32/1 1 MH32 Metal Halide, (1) 32W lamp 32 40
MH50/1 1 MH50 Metal Halide, (1) 50W lamp 50 72
MH70/1 1 MH70 Metal Halide, (1) 70W lamp 70 89
MH100/1 1 MH100 Metal Halide, (1) 100W lamp 100 129
MH150/1 1 MH150 Metal Halide, (1) 150W lamp 150 185
MH175/1 1 MH175 Metal Halide, (1) 175W lamp 175 210
MH250/1 1 MH250 Metal Halide, (1) 250W lamp 250 295
MH400/1 1 MH400 Metal Halide, (1) 400W lamp 400 461
MH1000/1 1 MH1000 Metal Halide, (1) 1000W lamp 1000 1070
MH1500/1 1 MH1500 Metal Halide, (1) 1500W lamp 1500 1610
MV40/1 1 MV40 Mercury Vapor, (1) 40W lamp 40 51
MV50/1 1 MV50 Mercury Vapor, (1) 50W lamp 50 63

NBI Pier Element Four Impact Analysis Appendix A.
48
Code Lamp Length
Lamps per
fixture
Lamp Type
Lamp designation Lamp Description W/lamp Ballast type Watts per fixture
MV75/1 1 MV75 Mercury Vapor, (1) 75W lamp 75 88
MV100/1 1 MV100 Mercury Vapor, (1) 100W lamp 100 119
MV175/1 1 MV175 Mercury Vapor, (1) 175W lamp 175 197
MV250/1 1 MV250 Mercury Vapor, (1) 250W lamp 250 285
MV400/1 1 MV400 Mercury Vapor, (1) 400W lamp 400 450
MV700/1 1 MV700 Mercury Vapor, (1) 700W lamp 700 780
MV1000/1 1 MV1000 Mercury Vapor, (1) 1000W lamp 1000 1080