small enterprises as innovators: shift from a low performer to a high performer
TRANSCRIPT
154 Int. J. Technology Management, Vol. 56, Nos. 2/3/4, 2011
Copyright © 2011 Inderscience Enterprises Ltd.
Small enterprises as innovators: shift from a low performer to a high performer
Helena Forsman* and Ulla Annala Lappeenranta University of Technology, Lahti School of Innovation, Saimaankatu 11, 15140 Lahti, Finland E-mail: [email protected] E-mail: [email protected] *Corresponding author
Abstract: This paper focuses on innovation development in small enterprises. It explores what kinds of innovations have been developed in small enterprises and what is the diversity of innovation types. In addition, this paper examines the features characterising the journey of a small enterprise from a non-innovator to a diversified innovator. The empirical evidence is based on quantitative data gathered through an e-mail questionnaire, which yielded 733 qualified responses from the representatives of Finnish small enterprises with fewer than 50 employees. The results suggest that the degree of innovation capabilities, R&D investments and profitability are associated with the diversity of developed innovation types. The findings display four alternative routes when a small enterprise moves from a non-innovator to a diversified innovator. Applying these results will provide more specific questions for studying innovation development in the smallest enterprises.
Keywords: diversity of innovation types; innovation capabilities; profitability; R&D investments; small enterprises.
Reference to this paper should be made as follows: Forsman, H. and Annala, U. (2011) ‘Small enterprises as innovators: shift from a low performer to a high performer’, Int. J. Technology Management, Vol. 56, Nos. 2/3/4, pp.154–171.
Biographical notes: Helena Forsman has a DSc (Tech.) degree in Engineering and Technology Management. She is working as a Senior Researcher at Lappeenranta University of Technology, Lahti School of Innovation. Her research interest focuses on business development and innovation management in the context of small business.
Ulla Annala has an MSc (Tech.) degree in Industrial Management. She is working as a Researcher at Lappeenranta University of Technology, Lahti School of Innovation. Her current research focuses on performance measurement and performance management in private enterprises and public organisations.

Small enterprises as innovators 155
1 Introduction
Despite their important role in an economy, innovation development in the smallest enterprises has received only scant attention. The majority of the studies are focused on medium-size and large enterprises in high-technology industries. This paper aims at contributing to filling the above gap. It explores innovation development in small enterprises with fewer than 50 employees.
The innovation types developed by small enterprises have been examined in current literature with inconclusive results. Some researchers have found that smaller enterprises invest more in product innovations while large enterprises invest more in process innovations (cf. Cohen and Klepper, 1996). Contrary to this, de Jong and Marsili (2006) found that process innovations are more widespread in small enterprises than product innovations. Finally, some researchers have suggested that innovation patterns are as rich in small enterprises as they are in larger enterprises (cf. Bertschek and Entorf, 1996; Turner et al., 2009). Meanwhile, the question of how innovation development diversifies in small enterprises is an almost unexplored field.
Literature also introduces a variety of research results of the needed resources and capabilities which predict successful innovation development. Most of these studies have explored the impact of individual factors on product and service innovations. There is, however, a need to examine innovation capabilities and other resources more holistically in relation to the diversity of developed innovations.
Challenged by the above inferences, this paper seeks answers to the questions: what kinds of innovations have been developed in small enterprises and what is the diversity of developed innovation types. In addition, it examines the features characterising the journey of a small enterprise from a non-innovator to a diversified innovator. The features are examined based on the degree of innovation capabilities, R&D investments and the trend of profitability. To study innovation development in small enterprises, an email questionnaire was developed. It yielded 733 qualified responses from the representatives of small enterprises with fewer than 50 employees.
The structure of this paper is as follows: The next section introduces the challenges of innovation development in small enterprises. Subsequently, the methodology is presented followed by the findings. The results are discussed with the aim of answering the proposed research questions. The final section summarises the conclusions of the study and provides the implications for future research.
2 Innovation development as a challenge in small enterprises
Researchers have developed a variety of theories of innovation types separating radical innovations from incremental innovations (Dewar and Dutton, 1986), product innovations from process innovations (Damanpour and Gopalakrishnan, 2001), component modifications from architectural innovations (Henderson and Clark, 1990) and sustaining innovations from disruptive ones (Christensen, 2003). A commonly studied typology is the distinction between product and process innovations. Product innovation reflects changes in end products or services while process innovation represents changes in the way an enterprise produces products and services (Dibrell et al., 2008). Instead, the distinction between product and service innovations is not clear. Quite

156 H. Forsman and U. Annala
often, the services provided by the enterprises of the service industries are equated with the product innovations developed by the enterprises of the manufacturing industries (McAdam et al., 2004). Another common typology is the distinction between incremental and radical innovations. Incremental innovations are often aimed to improve processes, make operations more effective, enhance the quality and decrease costs while radical innovations are characterised by discontinuity in technology and the market (Garcia and Calantone, 2002).
Studying innovation development in small enterprises is challenging not only because of the above mentioned ambiguity between the different innovation types but also because innovations are not necessarily the result of formal R&D. They may be the result of daily business development, customer and supplier collaboration or optimisation of processes (Forsman, 2008; Santamaría et al., 2009). This could result in difficulties in distinguishing innovation development from other business activities. If the distinction between conventional business and innovation development is not clear, it also leads to difficulties in assessing the contribution of innovation development to performance (Nystrom et al., 2002).
There are multiple studies of the relationship between innovation development and profitability of enterprises. Their focus is primarily on studying the impact of formal R&D activities and R&D investments on profitability. In the main, the findings of these studies support the assumption of a positive relationship, but there are also some diverging observations among researchers. Leiponen (2000) has studied the profitability effects of both process and product innovations and states that process innovation has a positive effect on profitability while product innovation tends to have a negative effect. Instead of a return on individual innovations, Geroski et al. (1993) found that the innovation process mattered for profitability. This is supported by Love et al. (2009), who found that the capabilities improved through innovation process explain why innovators earn higher profits than non-innovators.
Literature provides a substantial number of research results of the capabilities that predict successful innovation development. The concept of absorptive capacity has been a commonly used framework which Cohen and Levinthal (1990) define as an ability of an enterprise to identify the relevant new knowledge, assimilate it and combine with internal knowledge and to transform the knowledge into competitive advantage (see also Zahra and George, 2002). Several authors have utilised the theory of absorptive capacity and introduced results of the needed capabilities for developing certain types of innovations. Damanpour and Wischnevsky (2006) emphasise that adopting innovations relies on managerial and organisational capabilities to select and assimilate knowledge while generating innovations rests heavily on capabilities to acquire new knowledge and on capabilities to exploit the developed innovations. This is supported by Herrmann et al. (2007), who suggest that transformation capabilities are essential for developing radical innovations in established companies. They also highlight the importance of risk-propensity and customer orientation. Gruenberg-Bochard and Kreis-Hoyer (2009) stress interaction-oriented capabilities for ensuring success in collaborative networks, and Leskovar-Spacapan and Bastic (2007) finalise the list of the capabilities by entrepreneurial orientation needed to recognise and exploit opportunities. Forsman (2009) argues that, instead of one or few capability dimensions, the composition of capabilities predict innovation success in small enterprises. In line with Love et al. (2009), she emphasises the interaction between capabilities and innovation development in a way that innovation development drives capability creation while improved capabilities enable
Small enterprises as innovators 157
adopting even more challenging innovation goals. Also, Damanpour et al. (2009) have found that the synergy achieved from innovating across types affects the firm’s abilities. This leads to suggest that the diversity of developed innovation types is associated with the innovation capabilities of an enterprise.
3 Methodology and findings
The aim of this study is to examine what kinds of innovations have been developed in small enterprises and what is the diversity of developed innovation types. In addition, this paper examines what are the features that characterise the journey of a small enterprise from a non-innovator (Low Performer) to a diversified innovator (High Performer). The features will be examined building on the degree of innovation capabilities, R&D investments and the trend of profitability.
3.1 Data and variables
The empirical evidence is based on quantitative data gathered through an e-mail questionnaire which yielded 733 qualified responses from the representatives of Finnish small enterprises with fewer than 50 employees (the response rate was 13.5%).
The respondents of the questionnaire reported what types of innovations have been developed in their enterprises during the past four years. The given options for innovation types were: service, product, process, production method and single action. The respondents were also asked to specify whether the developed innovations were radical or incremental. A radical innovation was defined as a concept that differs dramatically from the competitors’ concepts while an incremental innovation was defined as an improvement to an existing product or service (cf. Dewar and Dutton, 1986). The data has been grouped to four innovator categories based on the radicalness of developed innovations: a Low Performer, an Incremental Performer, a Radical Performer or a Balanced Performer. The category of Low Performers consists of non-innovators, i.e., enterprises that have not developed any innovations during the past four years. The category of Incremental Performers is comprised of enterprises in which innovation development is characterised exclusively by incremental improvements while the category of Radical Performers consists of enterprises in which innovation development is biased towards radical innovations. Finally, the fourth category consists of enterprises that have developed both radical and incremental innovations.
The diversity of developed innovation types was studied by examining how many different kinds of innovation types had been developed in enterprises. The results are graded into four diversity levels. At Level 0, the enterprises have not developed any innovations during the past four years. Level 1 consists of enterprises which have developed 1–2 different innovation types. At Level 2, enterprises have developed 3–4 innovation types and finally, the enterprises which have developed more than four innovation types belong to Level 3. In this study, the enterprises at Level 0 are called Low Performers and the enterprises which have achieved Level 3 are called High Performers.
The features that characterise the journey from a Low Performer to a High Performer are examined based on R&D investments, profitability and the degree of innovation

158 H. Forsman and U. Annala
capabilities. The rate of R&D investments was reported by respondents as a percentage of sales. Profitability was reported as a trend of profitability during the past four years. In order to examine innovation capabilities, seven capability dimensions were specified: entrepreneurial capabilities, networking capabilities, utilisation of knowledge, risk propensity and risk management capabilities, capabilities to implement change, business development capabilities as well as customer and market knowledge (cf. Damanpour and Wischnevsky, 2006; Forsman, 2009; Herrmann et al., 2007; Gruenberg-Bochard and Kreis-Hoyer, 2009; Leskovar-Spacapan and Bastic, 2007). Each capability dimension consists of three items into which the concept of absorptive capacity was incorporated (Zahra and George, 2002). The first item assesses the capability to acquire and assimilate knowledge in relation to the dimension in question, the second item assesses the capability to transform and utilise knowledge for developing new concepts and solutions, and the third item assesses the capabilities to exploit knowledge and developed solutions in business. The dimension of the capabilities to implement change is an exception. It was reported based on one item in which the respondents assessed the abilities of their enterprise to quickly incorporate new procedures and processes.
The degree of capabilities was reported based on a three-point scale: 1 = low, 2 = medium and 3 = high. A sum factor consisting of a set of three items was calculated to every capability dimension. The applicability of the sets of the items to measure new latent factors was examined by using correlations and explorative factor analysis. The results supported the use of sum factors. The internal consistency was measured with Cronbach’s alpha. The values for the sum factors are above the critical limit of 0.6 (cf. Jokivuori and Hietala, 2007).
Because the data exhibits skewness, which implies departures from normality, the distribution-free non-parametric tests are used to examine whether there exist significant differences across the diversity levels within innovator categories. The Mann-Whitney test is used for two group comparisons and the Kruskal-Wallis test is used for multigroup comparisons. The research questions for the comparisons are: RQ1 Are there differences in developed innovation types across the diversity levels
within the innovator categories? RQ2 Are there differences in innovation capabilities across the diversity levels within
the innovator categories? RQ3 Are there differences in R&D investments across the diversity levels within the
innovator categories? RQ4 Are there differences in the trends of profitability across the diversity levels
within the innovator categories? The null hypothesis is that there are no differences and it is rejected if Sig. ≤ .05.
3.2 The types and diversity of developed innovations
The most common developed innovation types are incremental in nature. Slightly less than half of the respondents reported that they had developed exclusively incremental innovations while only 7.5% had developed merely radical innovations. One-third of the enterprises had developed both radical and incremental innovations and the rest, approximately 8% of the enterprises, had not developed any innovations during the past four years.

Small enterprises as innovators 159
Table 1 Summary of the developed innovations, R&D investments and the trend of profitability (N = 733)
Leve
l 0
Le
vel 1
(1–2
inno
vatio
n ty
pes)
Leve
l 2 (3
–4 in
nova
tion
type
s)
Le
vel 3
(> 4
inno
vatio
n ty
pes)
Bala
nced
pe
rfor
mer
Low
pe
rfor
mer
Radi
cal
perf
orm
er
Bala
nced
pe
rfor
mer
In
crem
enta
l pe
rfor
mer
Radi
cal
perf
orm
er
Bala
nced
pe
rfor
mer
In
crem
enta
l pe
rfor
mer
Radi
cal
perf
orm
er
(R)
(I)
Incr
emen
tal
perf
orm
er
Dev
elop
ed ra
dica
l inn
ovat
ion
type
s
Pr
oduc
ts
-
56.0
%
73.7
%
-
100.
0%
53.0
%
-
100.
0%
68.3
%
47.3
%-
Se
rvic
es
-
36.0
%
21.1
%
-
66.7
%
40.9
%
-
100.
0%
70.0
%
35.7
%-
Pr
oces
ses
-
20.0
%
- -
88
.9%
16
.7%
-
10
0.0%
60
.0%
20
.5%
-
M
etho
ds
-
20.0
%
5.3%
-
22
.2%
7.
6%
-
100.
0%
65.0
%
15.2
%-
Fu
nctio
ns
-
16.0
%
- -
77
.8%
30
.3%
-
10
0.0%
66
.7%
36
.6%
-
Dev
elop
ed in
crem
enta
l inn
ovat
ion
type
s
Pr
oduc
ts
-
- 10
.5%
33
.8%
- 27
.3%
76
.3%
- 35
.0%
53
.6%
100.
0%
Se
rvic
es
-
- 42
.1%
39
.9%
- 43
.9%
82
.8%
- 33
.3%
66
.1%
100.
0%
Pr
oces
ses
-
- 5.
3%
14.2
%
-
43.9
%
40.9
%
-
40.0
%
78.6
%10
0.0%
M
etho
ds
-
- 5.
3%
13.5
%
-
36.4
%
43.0
%
-
36.7
%
83.9
%10
0.0%
Fu
nctio
ns
-
- 36
.8%
56
.8%
- 56
.1%
89
.2%
- 33
.3%
64
.3%
100.
0%
Not
e: P
erce
ntag
e in
dica
tes t
he sh
are
of e
nter
pris
es th
at h
ave
deve
lope
d th
e in
nova
tion
type
in q
uest
ion.

160 H. Forsman and U. Annala
Table 1 Summary of the developed innovations, R&D investments and the trend of profitability (N = 733) (continued)
Leve
l 0
Le
vel 1
(1–2
inno
vatio
n ty
pes)
Leve
l 2 (3
–4 in
nova
tion
type
s)
Le
vel 3
(> 4
inno
vatio
n ty
pes)
Bala
nced
pe
rfor
mer
Low
pe
rfor
mer
Radi
cal
perf
orm
er
Bala
nced
pe
rfor
mer
In
crem
enta
l pe
rfor
mer
Radi
cal
perf
orm
er
Bala
nced
pe
rfor
mer
In
crem
enta
l pe
rfor
mer
Radi
cal
perf
orm
er
(R)
(I)
Incr
emen
tal
perf
orm
er
Inve
stm
ent i
n de
velo
pmen
t (%
of r
even
ues)
<
1%
43.1
%
28
.0%
21
.1%
50
.0%
22.2
%
19.7
%
37.6
%
14
.3%
15
.0%
19
.6%
41.0
%
1–
2%
10.3
%
20
.0%
31
.6%
20
.9%
- 27
.3%
26
.9%
19.0
%
21.7
%
30.4
%24
.6%
3–
5%
3.4%
12.0
%
26.3
%
7.4%
22.2
%
21.2
%
14.0
%
14
.3%
23
.3%
17
.0%
15.6
%
>
5%
5.2%
24.0
%
10.5
%
2.0%
44.4
%
18.2
%
4.3%
38.1
%
28.3
%
25.0
%3.
3%
C
anno
t ans
wer
37
.9%
16.0
%
10.5
%
19.6
%
11
.1%
13
.6%
17
.2%
14.3
%
11.7
%
8.0%
15
.6%
To
tal
100%
100%
10
0%
100%
100%
10
0%
100%
100%
10
0%
100%
10
0%
Tren
d of
pro
fitab
ility
Im
prov
ed
22.4
%
36
.0%
52
.6%
41
.9%
44.4
%
51.5
%
46.2
%
52
.4%
63
.3%
54
.5%
42.6
%
N
o ch
ange
s 36
.2%
24.0
%
21.1
%
28.4
%
33
.3%
22
.7%
29
.0%
14.3
%
13.3
%
18.8
%32
.8%
Fl
uctu
atin
g 25
.9%
28.0
%
15.8
%
18.9
%
22
.2%
19
.7%
20
.5%
14.3
%
20.0
%
17.9
%16
.4%
Im
paire
d 12
.1%
12.0
%
- 6.
1%
-
6.1%
2.
2%
9.
5%
1.7%
7.
1%
2.5%
N
/A
3.4%
- 10
.5%
4.
7%
-
- 2.
2%
9.
5%
1.7%
1.
8%
5.7%
To
tal
100%
100%
10
0%
100%
100%
10
0%
100%
100%
10
0%
100%
10
0%
N
58
25
19
14
8
9 66
93
21
60
112
122
Not
e: P
erce
ntag
e in
dica
tes t
he sh
are
of e
nter
pris
es th
at h
ave
deve
lope
d th
e in
nova
tion
type
in q
uest
ion.
Small enterprises as innovators 161
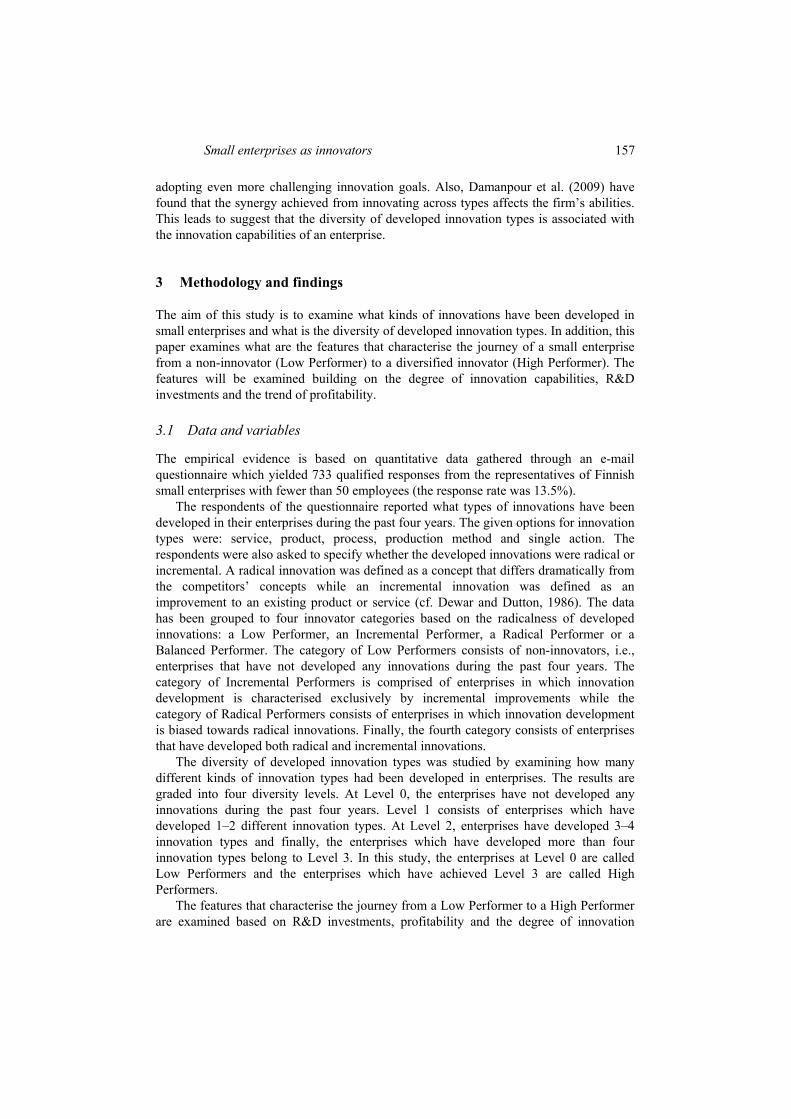
As Table 1 demonstrates, 86% of the enterprises at diversity Level 1 have developed only incremental innovations. Correspondingly, the incidence of radical innovations increases while the diversity level increases. More than half of the enterprises at diversity Level 3 have developed both incremental and radical innovations.
Figure 1 illustrates how the developed innovation types diversify within different innovator categories. There are two extremities for shifting from diversity Level 0 (Low Performer) to Level 3 (High Performer): diversifying exclusively through radical innovations or diversifying solely through incremental innovations. Balanced Performers who have developed both incremental and radical innovations can be found between these two extremities.
At Levels 1 and 2, Balanced Performers comprise quite a homogenous group in terms of developed innovation types whereas at Level 3 they start to diverge to two different routes: two-thirds of Balanced Performers lean towards incremental innovation development abbreviated by (I) while the rest of Balanced Performers lean towards radical innovation development abbreviated by (R).
As Figure 1 displays, Radical Performers have focused at diversity level 1 on product development. When moving to Level 2, innovation development extends to radical processes and single functions. The shares of radical production methods and services increase at diversity Level 3. Accordingly, Incremental Performers have started by developing single functions. The share of incremental products and services increases at Level 2, and at Level 3 innovation development has diversified into incremental processes and methods. Balanced Performers have developed radical products accompanied with incremental services and single functions at Level 1. When moving to Level 2, the shares of radical functions, incremental processes and methods increase. At diversity Level 3, the enterprises biased towards the radical wing (R) have diversified their innovation development into radical processes, services and methods while the enterprises biased towards the incremental wing (I) have diversified innovation development into incremental products.
Figure 1 Alternative routes from a Low Performer to a High Performer

162 H. Forsman and U. Annala
Table 2 The results of non-parametric tests for the developed innovations types
Level 1 Level 2 Level 3 K-W Sig. Mean Std. d Mean Std. d Mean Std. d
Radical performer Radical
products 1.56 .507 2.00* .000 2.00 .000 .000
Radical services
1.36 .490 1.67 .500 2.00* .000 .000
Radical processes 1.20 .408 1.89* .333 2.00 .000 .000 Radical
methods 1.20 .408 1.22 .441 2.00* .000 .000
Radical functions 1.16 .374 1.78* .441 2.00* .000 .000 Incremental performer Incremental
products 1.34 .475 1.76* .427 2.00* .000 .000
Incremental services
1.40 .491 1.83* .379 2.00* .000 .000
Incremental processes
1.14 .350 1.41* .494 2.00* .000 .000
Incremental methods
1.14 .343 1.43* .498 2.00* .000 .000
Incremental functions
1.57 .497 1.89* .311 2.00* .000 .000
Level 1 Level 2 Level 3 (I) Level 3 (R) K-W Sig
Mean Std. d Mean Std. d Mean Std. d Mean Std. d
Balanced performer Radical
products 1.74 .452 1.53 .503 1.47 .502 1.68 .469 .102 .114
Radical services
1.21 .419 1.41 .495 1.36 .481 1.70* .462 .283 .000
Radical processes
1.00 .000 1.17 .376 1.21 .406 1.60* .494 .091 .000
Radical methods
1.05 .229 1.08 .267 1.15 .360 1.65* .481 .207 .000
Radical functions
1.00 .000 1.30* .463 1.37 .484 1.67* .475 .006 .000
Incremental products
1.11 .315 1.27 .449 1.54* .501 1.35 .481 .000 .117
Incremental services
1.42 .507 1.44 .500 1.66* .476 1.33 .475 .007 .462
Incremental processes
1.05 .229 1.44* .500 1.79* .412 1.40 .494 .000 .008
Incremental methods
1.05 .229 1.36* .485 1.84* .369 1.37 .486 .000 .026
Incremental functions
1.37 .496 1.56 .500 1.64 .481 1.33* .475 .069 .030
Note: *Mann-Whitney test indicates statistically significant differences (Sig. ≤ .05) in means between a level and the previous level above it.

Small enterprises as innovators 163
Table 2 introduces the results of the Kruskal-Wallis tests indicating if the differences across the diversity levels are statistically significant within the innovator categories (Research Question 1). As Table 2 illustrates, the differences in innovation types across the diversity levels are statistically significant within the Incremental Performers related to all incremental innovation types. Correspondingly, the differences across the diversity levels within the Radical Performers are statistically significant related to all radical innovation types. Amid Balanced Performers (I), which are biased towards incremental innovation development, the differences are statistically significant with incremental products, services, processes and methods, and with radical single functions. Meanwhile, within the Balanced Performers (R), which are biased towards radical innovation development, the differences are statistically significant related to radical services, processes, methods, single functions and incremental processes, methods and functions.
In Table 2, the results of the Mann-Whitney test indicating statistically significant differences between two adjoining levels are marked by an asterisk sign (*) after the mean value. The results demonstrate that within Radical and Incremental Performers there are statistically significant differences related to all developed innovation types between diversity Levels 1 and 2 or between Levels 2 and 3. Instead, within Balanced Performers most of the statistically significant differences can be found between diversity Levels 2 and 3.
3.3 Innovation capabilities and the diversity of developed innovations
The features that characterise the journey from a Low Performer to a High Performer are examined based on the innovation capabilities of small enterprises, their R&D investments and profitability. Table 3 introduces the mean values of capability dimensions grouped by innovator categories and further by diversity levels. In addition, the accumulation of capabilities has been illustrated by the sum of all capability dimensions. The results of the Kruskal-Wallis tests indicating if the differences across the diversity levels are statistically significant within the innovator categories are introduced in column K-W Sig. while the results of the Mann-Whitney tests, which indicate statistically significant differences between two adjoining levels, are marked by an asterisk sign (*) after the mean value (Research Question 2).
In general, the mean values indicate that when an enterprise moves from a Low Performer towards a High Performer (diversity Level 3), the degree of innovation capabilities becomes higher regarding all the capability dimensions. Based on the results of the Kruskal-Wallis tests, the differences in innovation capabilities are statistically significant related to all capability dimensions when the Low Performer shifts to the High Radical Performer or to the High Balanced Performer (R). During the journey from the Low Performer to the High Balanced Performer (I), the differences are statistically significant with all the other capability dimensions but not with the change management capabilities. Finally, when the Low Performer shifts to the High Incremental Performer, the differences in innovation capabilities are statistically significant related to entrepreneurial capabilities, development capabilities, customer and market knowledge and accumulation of capabilities.

164 H. Forsman and U. Annala
Table 3 The results of non-parametric tests for the innovation capabilities
Le
vel 0
Leve
l 1
Le
vel 2
Leve
l 3
M
ean
Std.
d
M
ean
Std.
d
M
ean
Std.
d
M
ean
Std.
d
K
-W. S
ig
From
Low
Per
form
er to
Hig
h In
crem
enta
l Per
form
er
K
now
ledg
e 1.
92
0.85
1.98
0.
78
2.
11
0.78
2.16
0.
80
.1
49
En
trepr
eneu
rial
1.65
0.
79
1.
87
0.76
1.99
0.
77
2.
10
0.75
.003
Ris
k m
gt
1.57
0.
77
1.
59
0.71
1.56
0.
68
1.
66
0.75
.791
Net
wor
king
1.
91
0.89
2.10
0.
82
2.
07
0.79
2.13
0.
86
.5
09
D
evel
opm
ent
1.50
0.
80
1.
69
0.78
1.93
* 0.
78
1.
96
0.79
.001
Cha
nge
mgt
1.
98
0.81
1.96
0.
73
2.
09
0.71
2.09
0.
65
.4
09
C
usto
mer
and
Mar
ket
1.59
0.
80
1.
71
0.81
1.71
0.
77
1.
97*
0.77
.007
Sum
of c
apab
ilitie
s 11
.92
3.75
12.9
9 3.
66
13
.57
3.46
14.0
9 3.
70
.0
11
From
Low
Per
form
er to
Hig
h R
adic
al P
erfo
rmer
Kno
wle
dge
1.92
0.
85
2.
32
0.78
2.71
0.
49
2.
47
0.70
.014
Entre
pren
euria
l 1.
65
0.79
2.27
* 0.
77
2.
86
0.38
2.61
0.
61
.0
00
R
isk
mgt
1.
57
0.77
1.86
0.
85
2.
33
0.82
2.42
0.
77
.0
02
N
etw
orki
ng
1.91
0.
89
2.
33
0.80
2.67
0.
52
2.
50
0.82
.035
Dev
elop
men
t 1.
50
0.80
2.20
* 0.
77
2.
57
0.53
2.56
0.
70
.0
00
C
hang
e m
gt
1.98
0.
81
2.
09
0.73
2.71
* 0.
49
2.
42
0.77
.039
Cus
tom
er a
nd m
arke
t 1.
59
0.80
2.04
* 0.
82
2.
50
0.55
2.41
0.
71
.0
01
Su
m o
f cap
abili
ties
11.9
2 3.
75
14
.68*
4.
24
18
.17
1.72
17.1
4 4.
13
.0
00
Not
e: *
Man
n-W
hitn
ey te
st in
dica
tes s
tatis
tical
ly si
gnifi
cant
diff
eren
ces (
Sig.
≤ .0
5) in
mea
ns b
etw
een
a le
vel a
nd th
e pr
evio
us le
vel a
bove
it.

Small enterprises as innovators 165
Table 3 The results of non-parametric tests for the innovation capabilities (continued)
Le
vel 0
Leve
l 1
Le
vel 2
Leve
l 3
M
ean
Std.
d
M
ean
Std.
d
M
ean
Std.
d
M
ean
Std.
d
K
-W. S
ig
From
Low
Per
form
er to
Hig
h B
alan
ced
Perf
orm
er (I
)
Kno
wle
dge
1.92
0.
85
2.
56*
0.62
2.38
0.
78
2.
29
0.79
.007
Entre
pren
euria
l 1.
65
0.79
2.06
0.
87
2.
18
0.74
2.26
0.
79
.0
00
R
isk
mgt
1.
57
0.77
1.94
0.
83
2.
09
0.85
1.95
0.
82
.0
11
N
etw
orki
ng
1.91
0.
89
2.
50*
0.71
2.43
0.
75
2.
31
0.79
.010
Dev
elop
men
t 1.
50
0.80
1.94
* 0.
77
2.
49*
0.74
2.17
* 0.
81
.0
00
C
hang
e m
gt
1.98
0.
81
2.
00
0.75
2.05
0.
73
2.
24
0.69
.127
Cus
tom
er a
nd m
arke
t 1.
59
0.80
1.89
0.
94
2.
11
0.87
2.26
0.
79
.0
00
Su
m o
f cap
abili
ties
11.9
2 3.
75
15
.36*
3.
56
15
.72
3.43
15.5
9 4.
01
.0
00
From
Low
Per
form
er to
Hig
h B
alan
ced
Perf
orm
er (R
)
Kno
wle
dge
1.92
0.
85
2.
56*
0.62
2.38
0.
78
2.
57
0.65
.000
Entre
pren
euria
l 1.
65
0.79
2.06
0.
87
2.
18
0.74
2.48
* 0.
72
.0
00
R
isk
mgt
1.
57
0.77
1.94
0.
83
2.
09
0.85
2.19
0.
78
.0
01
N
etw
orki
ng
1.91
0.
89
2.
50*
0.71
2.43
0.
75
2.
46
0.73
.004
Dev
elop
men
t 1.
50
0.80
1.94
* 0.
77
2.
49*
0.74
2.58
0.
67
.0
00
C
hang
e m
gt
1.98
0.
81
2.
00
0.75
2.05
0.
73
2.
43*
0.67
.005
Cus
tom
er a
nd m
arke
t 1.
59
0.80
1.89
0.
94
2.
11
0.87
2.16
0.
83
.0
04
Su
m o
f cap
abili
ties
11.9
2 3.
75
15
.36*
3.
56
15
.72
3.43
17.0
4*
3.13
.000
Not
e: *
Man
n-W
hitn
ey te
st in
dica
tes s
tatis
tical
ly si
gnifi
cant
diff
eren
ces (
Sig.
≤ .0
5) in
mea
ns b
etw
een
a le
vel a
nd th
e pr
evio
us le
vel a
bove
it.

166 H. Forsman and U. Annala
It seems that when innovation development expands and diversifies in enterprises, it puts a great strain on capability building. The most substantial capability creation is needed with those enterprises that choose the route from a Low Performer to a Radical Performer or to a Balanced Performer (R). The need for capability creation is topical especially when moving from diversity Level 0 to Level 1. In addition, Radical Performers have a leap in capabilities between Levels 1 and 2 while Balanced Performers (R) have a leap between Levels 2 and 3. Instead, the enterprises biased towards incremental innovation development have not been confronted with such a demanding situation. The Incremental Performer and the Balanced Performer (I) exhibit only minor changes in the degrees of capabilities.
3.4 R&D investments and profitability
Table 4 introduces the mean values of R&D investments and profitability grouped by innovator categories and further by diversity levels. The results of the Kruskal-Wallis tests indicating if the differences across the diversity levels are statistically significant within the innovator categories are introduced in column K-W Sig. while the results of the Mann-Whitney tests which indicate statistically significant differences between two adjoining levels are marked by an asterisk sign (*) after the mean value (Research Questions 3 and 4).
With regard to R&D investments, radical innovation development is associated with considerably bigger inputs than incremental innovation development. It also seems that when moving to the upper diversity levels, the investments tend to be bigger. As Table 4 demonstrates, there are some leaps in R&D investments across the diversity levels within the innovator categories. With Incremental Performers a statistically significant increase can be found between diversity Levels 1 and 2, while Radical Performers have a statistically significant leap between Levels 0 and 1. Also, Balanced Performers increase their R&D investments considerably when shifting from Level 0 to Level 1 followed by a smooth increase along the journey to Level 3. The differences in R&D investments across the diversity levels are statistically significant within all innovator categories.
The relationship between the trend of profitability and the diversity of developed innovations types is not as clear as it is between R&D investments and diversity levels. In general, it can be noticed from Table 4 that the trend of profitability has the lowest values at diversity Level 0, but it varies across Levels 1 to 3. The differences in profitability across Levels 0 to 3 within the innovator categories are statistically significant within Incremental and Balanced Performers but not within Radical Performers. The results of the Mann-Whitney tests suggest that profitability of Incremental and Balanced Performers increases when they shift from diversity Level 0 to Level 1, but after that there are only minor changes.

Small enterprises as innovators 167
Table 4 The results of non-parametric tests for R&D investments and profitability
Fr
om L
ow P
erfo
rmer
To H
igh
Perf
orm
er
Le
vel 0
Leve
l 1
Le
vel 2
Leve
l 3
K-W
Sig
M
ean
Std.
d
M
ean
Std.
d
M
ean
Std.
d
M
ean
Std.
d
Lev
0–3
Incr
emen
tal P
erfo
rmer
s
R&
D in
vest
men
ts
1.53
.9
4
1.52
.7
7
1.82
* .9
0
1.78
.8
9 .0
18
Th
e tre
nd o
f pro
fitab
ility
2.
11
.59
2.
38*
.60
2.
45
.54
2.
40
.54
.006
R
adic
al P
erfo
rmer
s
R&
D in
vest
men
ts
1.53
.9
4
2.38
* 1.
24
3.
00
1.31
2.89
1.
18
.000
The
trend
of p
rofit
abili
ty
2.11
.5
9
2.24
.6
6
2.44
.5
3
2.47
.7
0 .0
85
Bal
ance
d Pe
rfor
mer
s (I)
R&
D in
vest
men
ts
1.53
.9
4
2.29
* .9
9
2.44
1.
07
2.
51
1.11
.0
00
Th
e tre
nd o
f pro
fitab
ility
2.
11
.59
2.
59*
.51
2.
45
.61
2.
48
.63
.001
B
alan
ced
Perf
orm
ers (
R)
R
&D
inve
stm
ents
1.
53
.94
2.
29*
.99
2.
44
1.07
2.74
1.
10
.000
The
trend
of p
rofit
abili
ty
2.11
.5
9
2.59
* .5
1
2.45
.6
1
2.62
.5
2 .0
00
Not
e: *
Man
n-W
hitn
ey te
st in
dica
tes s
tatis
tical
ly si
gnifi
cant
diff
eren
ces (
Sig.
≤ .0
5) in
mea
ns b
etw
een
a le
vel a
nd th
e
prev
ious
leve
l abo
ve it
.
168 H. Forsman and U. Annala
4 Discussion and conclusions
The findings of this study are in line with the previous research results validating that small enterprises do not comprise a homogenous group of innovators (cf. Kirner et al., 2009). In accordance with Bertschek and Entorf (1996), the evidence demonstrates a rich diversity of developed innovations in small enterprises. In relation to innovation types, the majority of the enterprises are biased towards incremental innovation development. It has resulted in a variety of innovation types: products, services, processes, production methods and single functions. Instead, radical innovation development has most often yielded new products, services or single functions. These results are somehow conflicting with the findings introduced by de Jong and Marsili (2006). They found that process innovations are more widespread in small enterprises than product innovations. The findings of this study suggest that both the radical and incremental product innovations are more common in small enterprises than process innovations. Instead, the share of process innovations increases at the higher diversity levels when an enterprise has already developed other innovation types.
Based on the diversity of the developed innovation types, four alternative routes for the journey from a Low Innovation Performer to a High Innovation Performer can be illustrated. The most common routes run through solely incremental innovation development or through development which is strongly biased towards incremental innovations. Approximately 75% of High Performers have chosen these options. Less than 10% of small enterprises which have developed innovations during the past four years follow the route characterised exclusively by radical innovation development. When enterprises have developed one or two different innovation types, 86% of them have developed only incremental innovations with emphasis on products, services and single functions. The share of radical innovations starts to increase among the enterprises which have developed at least three different innovation types, but still more than half of the enterprises have developed only incremental innovation types. Finally, more than half of the High Performers have developed both incremental and radical innovations. The evidence suggests that the share of radical innovations increases while the diversity of innovations increases.
Innovation capabilities were studied building upon seven dimensions: knowledge exploitation, entrepreneurial capabilities, risk management capabilities, networking capabilities, business development capabilities, and the capabilities to implement change as well as customer and market knowledge. The results indicate statistically significant differences in innovation capabilities across the diversity levels. When the diversity of developed innovation types increases the degree of capabilities increases. The Low Performers have the lowest capability values while the High Performers, i.e., enterprises which had developed more than four innovation types, have the highest capability values. This finding is in line with Damanpour et al. (2009), who suggest that the synergy achieved from developing different innovation types affects the abilities of enterprises. This study proposes that the capabilities can be improved especially through radical innovation development. Instead, the incremental innovation development affects capability profiles only slightly. When innovation development expands and diversifies in small enterprises, it also puts a great strain on capability building. The shift from a Low Performer to an Incremental Performer seems to be a common choice for small enterprises and it is a journey characterised by smooth capability improvements. Instead, the shift from a Low Performer to a Radical Performer is more challenging and it

Small enterprises as innovators 169
demands substantial capability creation especially when taking the first steps for developing radical innovations.
In relation to R&D investments and the trend of profitability, statistically significant differences can be found when a Low Performer at diversity Level 0 shifts to Level 1. A considerable increase in R&D investments takes place when an enterprise develops its first radical innovation. After that the investments have only minor changes. The category of Incremental Performers is an exception to this. The share of investments has a leap value between diversity Levels 1 and 2, i.e., a situation in which innovation development diversifies to incremental products and services. The relationship between profitability and diversity level is not as clear. In line with Love et al. (2009), profitability improves when an enterprise shifts from a non-innovator to an innovator, i.e., in this study from diversity Level 0 to Level 1. After that the trend of profitability remains similar. Radical Performers are exceptions. Their profitability has only minor, non-significant changes when moving from a Low Performer to a High Performer. Table 5 summarises the findings of the basic characteristics of the four alternative routes from a Low Performer to a High Performer. Table 5 Summary of the routes from a Low Performer to a High Performer
From a Low Performer to a High
Incremental Performer
to a High Balanced
Performer (I)
to a High Balanced
Performer (R)
to a High Radical
Performer Developed innovation types Level 1 Incremental
functions Radical products and incremental services and functions
Radical products
Level 2 Incremental products and services
Radical functions and incremental processes and methods
Radical processes and single functions
Level 3 Incremental processes and methods
Incremental products
Radical services, processes and methods
Radical services and methods
Capabilities Minor improvements
Significant improvements between Levels 0 and 1
Significant improvements when shifting from Level 0 to Level 1 followed by noticeable improvements when shifting towards High Performer
R&D investments
Significant increase when shifting from Level 1 to Level 2
Significant increase between Levels 0 and 1 followed by a noticeable increase between Levels 1 and 3
The trend of profitability
Significant improvement when shifting from Level 0 to Level 1
Insignificant changes
This study suggests a number of implications with regard to further research. The empirical evidence is based on cross-sectional data. A longitudinal study may be useful in order to gain a deep understanding of the progress of enhancing innovation activity in small enterprises. The research data has been provided by single informants. Reliance on small business owner-managers is justified with the prior evidence because they possess the most complete information about innovation development in their enterprises. Further

170 H. Forsman and U. Annala
studies may attempt to gather information from multiple respondents. The empirical evidence is gathered from Finland. It would be interesting to extend the analysis to other countries. Finally, this paper has studied innovation patterns based on innovation input and innovation output. There is a need to study how innovation input has been transformed into innovation output, and thus the innovation process of small enterprises should be studied further.
The value of the present study lies in the better understanding of innovation development in small enterprises. It suggests that in the context of small business the degree of innovation capabilities, R&D investments and profitability are associated with the diversity of developed innovation types. The application of these results may provide more specific questions for studying the characteristics of innovation development in small enterprises. In addition, the results may give new insights for those responsible for designing public policies on how to support small enterprises to exploit their potential in innovation development.
Acknowledgements
The corresponding author gratefully acknowledges the financial support from the Finnish Cultural Foundation, Päijät-Häme Regional Fund (Suomen Kulttuurirahasto, Päijät-Hämeen Maakuntarahasto). In addition, we would like to thank the reviewers for their detailed and highly valuable feedback, which significantly improved the quality of this paper. The researchers would also like to express their gratitude to Mrs. Pirkko Airas for reviewing their English.
References Bertschek, I. and Entorf, H. (1996) ‘On nonparametric estimation of the Schumpeterian link
between innovation and firm size: evidence from Belgium, France, and Germany’, Empirical Economics, Vol. 21, No. 3, pp.401–426.
Christensen, C. (2003) The Innovator’s Dilemma, HarperBusiness Essentials, New York. Cohen, W.M. and Klepper, S. (1996) ‘Firm size and the nature of innovation within industries: the
case of process and product R&D’, The Review of Economics and Statistics, Vol. 78, No. 2, pp.232–243.
Cohen, W.M. and Levinthal, D.A. (1990) ‘Absorptive capacity: a new perspective on learning and innovation’, Administrative Science Quarterly, Vol. 35, No. 1, pp.28–152.
Damanpour, F. and Gopalakrishnan, S. (2001) ‘The dynamics of the adoption of product and process innovations in organizations’, Journal of Management Studies, Vol. 38, No. 1, pp.45–65.
Damanpour, F. and Wischnevsky, J.D. (2006) ‘Research on innovation in organizations: distinguishing innovation-generating from innovation-adopting organizations’, Journal of Engineering and Technology Management, Vol. 23, No. 4, pp.269–291.
Damanpour, F., Walker, R.M. and Avellaneda, C.N. (2009) ‘Combinative effects of innovation types and organizational performance: a longitudinal study of service organizations’, Journal of Management Studies, Vol. 46, No. 4, pp.650–675.
de Jong, J.P.J. and Marsili, O. (2006) ‘The fruit flies of innovations: a taxonomy of innovative small firms’, Research Policy, Vol. 35, No. 2, pp.213–229.
Dewar, R.D. and Dutton, J.E. (1986) ‘The adoption of radical and incremental innovations: an empirical analysis’, Management Science, Vol. 32, No. 11, pp.1422–1433.

Small enterprises as innovators 171
Dibrell, C., Davis, P.S. and Craig, J. (2008) ‘Fueling innovation through information technology in SMEs’, Journal of Small Business Management, Vol. 46, No. 2, pp.203–218.
Forsman, H. (2008) ‘Business development success in SMEs. A case study approach’, Journal of Small Business and Enterprise Development, Vol. 15, No. 3, pp.606–622.
Forsman, H. (2009) ‘Improving innovation capabilities of small enterprises. A cluster strategy as a tool’, International Journal of Innovation Management, Vol. 13, No. 2, pp.221–243.
Garcia, R. and Calantone, R. (2002) ‘A critical look at technological innovation typology and innovativeness terminology: a literature review’, Journal of Product Innovation Management, Vol. 19, No. 2, pp.110–132.
Geroski, P., Machin, S. and Van Reenen, J. (1993) ‘The profitability of innovating firms’, RAND Journal of Economics, Vol. 24, No. 2, pp.198–211.
Gruenberg-Bochard, J. and Kreis-Hoyer, P. (2009) ‘Knowledge-networking capability in German SMEs: a model for empirical investigation’, International Journal of Technology Management, Vol. 45, Nos. 3−4, pp.364–379.
Henderson, R.M. and Clark, K.B. (1990) ‘Architectural innovation: the reconfiguration of existing product technologies and the failure of established firms’, Administrative Science Quarterly, Vol. 35, No. 1, pp.9–30.
Herrmann, A., Gassmann, O. and Eisert, U. (2007) ‘An empirical study of the antecedents for radical product innovations and capabilities for transformation’, Journal of Engineering and Technology Management, Vol. 24, Nos. 1−2, pp.92–120.
Jokivuori, P. and Hietala, R. (2007) Määrällisiä tarinoita: Monimuuttujamenetelmien käyttö ja tulkinta, WSOY, Helsinki.
Kirner, E., Kinkel, S. and Jaeger, A. (2009) ‘Innovation paths and the innovation performance of low-technology firms – an empirical analysis of German industry’, Research Policy, Vol. 38, No. 3, pp.447–458.
Leiponen, A. (2000) ‘Competencies, innovation and profitability of firms’, Economics of Innovation and New Technology, Vol. 9, No. 1, pp.1–24.
Leskovar-Spacapan, G. and Bastic, M. (2007) ‘Differences in organizations’ innovation capability in transition economy: internal aspect of the organizations’ strategic orientation’, Technovation, Vol. 27, No. 9, pp.533–546.
Love, J.H., Roper, S. and Du, J. (2009) ‘Innovation, ownership and profitability’, International Journal of Industrial Organization, Vol. 27, No. 3, pp.424–434.
McAdam, R., McConvery, T. and Armstrong, G. (2004) ‘Barriers to innovation within small firms in a peripheral location’, International Journal of Entrepreneurial Behaviour & Research, Vol. 10, No. 3, pp.206–221.
Nystrom, P.C., Ramamurthy, K. and Wilson, A.L. (2002) ‘Organizational context, climate and innovativeness: adoption of imaging technology’, Journal of Engineering and Technology Management, Vol. 19, Nos. 3−4, pp.221–247.
Santamaría, L., Nieto, M.J. and Barge-Gil, A. (2009) ‘Beyond formal R&D: taking advantage of other sources of innovation in low- and medium-technology industries’, Research Policy, Vol. 38, No. 3, pp.507–517.
Turner, J.R., Ledwith, A. and Kelly, J. (2009) ‘Project management in small to medium-sized enterprises. A comparison between firms by size and industry’, International Journal of Managing Projects in Business, Vol. 2, No. 2, pp.282–296.
Zahra, S.A. and George, G. (2002) ‘Absorptive capacity: a review, reconceptualization, and extension’, The Academy of Management Review, Vol. 27, No. 2, pp.185–203.