small business mg1
TRANSCRIPT

0
0
IFLIP Research Paper 01-5
Impact Of Micro-Finance Enterprises On The Efficiency Of Micro-Enterprises In Cape Coast.
Vijay K. Bhasin Wisdom Akpalu November 2001
Copyright. International Labour Organization 2002
ISBN 92-2-112819-9 ISSN 1609-8382

1
1
IMPACT OF MICRO-FINANCE ENTERPRISES ON THE
EFFICIENCY OF MICRO-ENTERPRISES IN CAPE COAST.
DR VIJAY K. BHASIN, DEPARTMENT OF ECONOMICS,
UNIVERSITY OF CAPE COAST
AND
WISDOM AKPALU, DEPARTMENT OF ECONOMICS,
UNIVERSITY OF CAPE COAST
October 2001
Abstract: It has been observed that the NBSSI has been performing very well as far as the training services are concerned. As far as the provision of credit is concerned, NBSSI has not performed well according to the expectations of hairdressers, dressmakers and wood-processors because of lack of funds. It has been observed that the informal sector caters for the needs of these micro-enterprises and they generally take loans from their friends/relatives and suppliers/clients. There exist many variations in the efficiency of hairdressers, dressmakers and wood-processors within each group and across these groups, which indicates that there is ample scope for raising the level of efficiency in these micro-enterprises. The most significant determinants of technical efficiencies of hairdressers, dressmakers and wood-processors are the age of operator, business experience, level of education, training programmes, credit, and contact with the lender. JEL Classification Numbers: Keywords: NBSSI, training programmes, credit services, PAMSCAD, Revolving Fund, stochastic frontier production function, technical efficiency, hairdressers, dressmakers, wood-processors, micro-enterprises. Corresponding author: Dr. VIJAY K. BHASIN, Department of Ec onomics, University of Cape Coast, Cape Coast, Ghana. Telephone: 233-24-364881 (mobile). E-mail: [email protected] Fax: 233-42-32484.
* We gratefully acknowledge the financial support that was provided by the Bank of Ghana under the IFLIP research programme. We would also like to thank all the participants who took part in various workshops and provided valuable comments and suggestions. We are also thankful to the anonymous referee who provided useful comments. However, we are responsible for any remaining errors.
2
2
TABLE OF CONTENTS
1.0 Introduction………………………………………………………………2
1.1 Background……………………………………………………………..2
1.2 Problem Statement…………………………………………………… 4
1.3 Objectives of the Study……………………………………………… 6
1.4 Organisation of the Study………………………………………………6
2.0 Literature Review……………………………………………………… 7
2.1 The Theoretical Literature…………………………………………… 7
2.2 The Empirical Literature………………………………………………11
3.0 Analytical Framework………………………………………………… 13
4.0 Sampling Procedure……………………………………………………15
5.0 Performance of NBSSI in Cape Coast…………………………………16
5.1 Training Services…………………………………………………… 16
5.2 Credit Services……………………………………………………… 18
6.0 Descriptive Data Analysis………………………………………………19 7.0 Analysis of Estimated Results………………………………………… 24 7.1 Maximum Likelihood Estimates of Frontier Production Functions… 24
7.2 Technical Efficiency Estimates……………………………………….26 7.3 Determinants of Technical Efficiency……………………………….28 8.0 Conclusions and Policy Recommendations……………….……………31 Appendix1 ………………………………………………………………… 34 Appendix 2………………………………………………………………… 35 References………………………………………………………………… 39

3
3
Executive Summary
Output growth could result from technological progress, increase in technical
efficiency and increase in input usage. The credit constraint and high cost of capital facing micro-enterprises in Ghana in general, and Cape Coast in particular, limit output growth through different technological regimes and increases in input usage. The challenge to policy makers is how to improve technical efficiency so that large gains in output can be attained given current level of technology. This can only be done when we know the factors that influence the technical efficiencies of the micro-enterprises.
It is argued that technical efficiency is determined by individual characteristics of
the entrepreneurs. Factors influencing such characteristics ma y be divided into two groups -human capital variables that dominate the decision -making process of the entrepreneurs, and institutional and socio-economic variables that could influence an entrepreneur’s capacity to apply his/her decisions at the enterprise level without any constraints. The human capital variables are: age of operator, level of education, and business experience; institutional variables are training programs, training experience, and access to credit and socio-economic variables are interest on loan, contact with the lender. The objective of the study is to find out which ones are the most significant determinants of technical efficiency of hairdressers, dressmakers and wood-processors.
The empirical literature on the measurement of technical and allocative efficiency
in the agricultural, manufacturing and services sectors of sub-Saharan African countries is very limited. Njikam (1998) has examined the impact of trade liberalisation on the technical efficiency of electrical industry of Cameroon and found a positive effect of trade policy liberalisation on this technical efficiency. Ajibefun and Daramola (1999) have shown that the significant determinants of technical efficiency of block-makers and saw-millers in Nigeria are age of operator, level of education, business experience, and number of employees and level of investment. The significant determinants of technical efficiency of metal fabricators in Nigeria are age of business, level of education, business experience and number of employees. Obwona (2000) has shown that the significant determinants of tobacco growers in Uganda are the family size, level of education, health status, hired workforce, and credit accessibility, fragmentation of land and extension services.
Many surveys of enterprise finance in Africa indicate that start-ups of micro-
businesses in most countries are primarily funded by landlords, neighbours, friends and relations (RPED, 1993). Moreover, Hyuha et al. (1993) have noted that informal finance through friends and relations in Tanzania was a significant source of agricultural financing. Atieno (1998) has observed in a survey done in Kenya that about 70% of the respondents got their initial capital from family friends and relatives, while 81% got their operating capital from the same source. In both Ghana and Nigeria, steady growth in the flow of loan applications to informal lenders has been observed, and has been matched by steady increases in the numbers of loans granted by various informal lenders (Aryeetey, 1994; Soyibo, 1994). In Africa, it has been established that the informal finance is more important than the formal finance (Chipeta and Mkandawire (1991) for Malawi; Aryeetey and Gockel (1991) for Ghana; and Hyuha et. el. (1993) for Tanzania). Aryeetey (1992) in Ghana and Soyibo (1994) in Nigeria have observed that informal finance is rarely used for

4
4
the expansion of micro-businesses. The other objectives of the study are to examine the role of micro-finance enterprises and evaluate the performance of NBSSI with regard to the provision of training services and credit services.
Aryeetey (1992) in Ghana and Soyibo (1994) in Nigeria have observed that informal finance is rarely used for the expansion of micro-businesses. The finding that hairdressers have used different sources of informal finance for the expansion of their businesses stands in contrast with their findings. Our finding that majority of Hairdressers, Dressmakers, and Wood-processors took loans from their friends/relatives and suppliers/clients is in conformity with the findings of RPED (1993), Hyuha et al (1993), and Atieno (1998). Our finding that it is only the informal sector that caters for the needs of hairdressers, dressmakers, and wood-processors in Cape Coast is in conformity with the findings of Aryeetey (1994), Soyibo (1994), Chipeta and Mkandawire (1991), Aryeetey and Gockel (1991), and Hyuha et. el. (1993). Respondents indicated that the most important reasons for borrowing are favourable terms of lending, easier formalities and no collateral required. Respondents also indicated that they face credit interruption, get persistent request for repayment and rescheduling whenever they are unable to pay back the loans.
The estimated technical efficiencies of hairdressers lie between 39.3% and 94.4%,
with mean technical efficiency of 75.7%. The estimated technical efficiencies of dressmakers lie between 41.9% and 99.0%, with mean technical efficiency of 83.4%. The estimated technical efficiencies of wood processors lie between 69.7% and 100.0%, with mean technical efficiency of 89.1%. Thus, we have noticed variations of technical efficiencies within each group and across the three groups. There is ample scope for the improvement of technical efficiencies of hairdressers, dressmakers and wood-processors in Cape Coast. Our findings for technical efficiencies are very similar to the findings of Njikam (1998), Ajibefun and Daramola (1999) and Obwona (2000). For example, Njikam (1998) observed that the technical efficiency of electrical firms in Cameroon varied from 50.98% to 94.39% with a mean efficiency level of 81.91% before trade liberalisation. It remained between 38.85% and 95.76% with a mean efficiency level of 76.87% after trade liberalisation. Ajibefun and Daramola (1999) have observed that the technical efficiency of block makers in Nigeria varied between 19.0% and 85.0% with a mean efficiency level of 72.0%. The technical efficiency of metal fabricators in Nigeria was found to lie between 27.0% and 92.0% with a mean technical efficiency of 80.0%. The technical efficiency of saw millers in Nigeria varied between 30.0% and 90.0% with mean technical efficiency of 78.0%. Obwona (2000) has observed that the technical efficiency of tobacco growers in Uganda varied between 44.8% and 97.3% with mean technical efficiency level of 76.2%. In hairdressing, the significant variables that influence the technical efficiency are age of operator, business experience, credit and the contact with the lender. In dressmaking, the significant variables that influence the technical efficiency are age of operator, education and credit. In wood processing, the significant variables that influence the technical efficiency are age of operator, business experience, training programmes, credit and the contact with the lender.
5
5
Our findings with regard to the determinants of technical efficiency are in conformity with some of the findings of Ajibefun and Daramola (1999) and Obwona (2000).
Based on the findings of our study, we recommend that the efforts should be made to increase the access to credit through the informal and formal financial institutions. Group lending should be encouraged so that the default risk is reduced and the rate of loan recovery could be increased. The government should try to implement policies through which cordial relations can be established in the society. The government of Ghana should establish more vocational training centres. The NBSSI should organise more training programs for the wood processors. The government of Ghana should design policies that will sustain employment in hairdressing and wood processing.
The NBSSI has been performing very well as far as the training services are
concerned. As far as the provision of credit is concerned, NBSSI has not come upto the expectations of hairdressers, dressmakers and wood-processors because of lack of funds. Hairdressers have used different sources of informal finance for the expansion of their businesses. The major sources of loans are friends/relatives and suppliers/clients. The informal sector caters for the needs of the selected micro-enterprises in Cape Coast. The most important reasons for borrowing are favourable terms of lending, easier formalities and no collateral required. The owners face credit interruption, get persistent request for repayment and rescheduling whenever they are unable to repay the loans.
On the front of efficiency measurement, we observed that the stochastic frontier
production functions are preferred to average production functions in all the three micro-enterprises. We observed many variations in the efficiency of hairdressers, dressmakers and wood-processors within each group and across these groups, which indicates that there is ample scope for raising the level of efficiency in these micro-enterprises. The most significant determinants of technical efficiencies of these micro-enterprises were identified as age of operator, business experience, level of education, training programmes, credit and the contact with the lender.
One of the shortcomings of this study is that the efficiency model that we estimated
is static one. Secondly, we have not examined credit rationing, moral hazard and adverse selection problems. Thirdly, the efficiency model could not be estimated in simultaneous equation form because of the non-availability of the software. Fourthly, the model could have also been estimated by using the DEA (Data Envelope Analysis) software to verify the differences in results. We suggest that similar studies be conducted for other micro-enterprises in Cape Coast and other areas of Ghana.

6
6
1.0 INTRODUCTION
1.1. BACKGROUND
Studies on industrial development of different countries have shown that small and micro-
enterprises constitute an integral part of the over-all industrial sector and play an active and
significant role in the growth and development of these countries. These enterprises contribute
significantly to employment generation and output growth of different countries of which
Ghana is not an exception. When launching a new financial package titled “Smile” in 1997,
Dr. K. Duffuor, the governor of Bank of Ghana stated, “As long as we neglect the small
business sector we will always have problem of unemployment as well as underdeveloped non-
traditional sector and we shall always remain a dependent economy and vision 2020 will
remain a dream”. Over the years, various governments of Ghana have recognised the need to
develop the small and micro enterprises.
The generation of self -employment in the small and micro-enterprises requires investment in
working capital. However, at low levels of income, the accumulation of such capital may be
difficult. Under such circumstances, loans, by increasing family income, can help the poor to
accumulate capital and investment in employment generating activities (Hossain, 1988).
Commercial banks and other formal financial institutions, however, fail to cater for the credit
needs of self -employed persons mainly due to their lending terms and conditions. They require
collateral, which the poor find difficult to provide. The financial institutions prefer handling
large loans than the small ones needed by the poor, and their loan application procedures are

7
7
too cumbersome for the poor. It is mainly such rules and regulations of the formal financial
institutions, which have created the myth that the poor are not bank-able, and since they cannot
afford the required collateral, they are not considered credit-worthy (Adera ,1995).
Although informal credit institutions have proved relatively successful in meeting the credit
needs of small and micro-enterprises in some countries, their limited resources limit the extent
to which they can effectively and sustainably satisfy the credit needs of these entrepreneurs
(Nappon and Huddlestone, 1993). This is because as micro-enterprises expand in size, the
characteristics of loans they require become increasingly difficult for the informal credit
sources to satisfy, yet they remain too small for the formal lenders (Aryeetey, 1996a).
Access to financial services by self-employed persons in small and micro-enterprises is
normally seen as one of the constraints limiting their benefits from credit facilities. However,
in most cases the access problem is one created by the institutions mainly through their lending
policies. This is displayed in the form of prescribed minimum loan amounts, complicated
application procedures and restricting credit for specific purposes (Schmidt and Kropp, 1987).
For small and micro-enterprises, reliable access to short-term credit and small amounts of credit
is more valuable, and emphasising it may be more appropriate in credit programmes aimed at
such enterprises (Adams and Von Pischke, 1992).
Accordingly, various efforts have been made by the government of Ghana to address the
institutional, financial and technological needs of this sector. Some of the measures taken in
this direction are the revision of the investment code, adoption of trade liberalisation policy,
restructuring of the financial sector and the upgrading of traditional technologies. An example
of an effort made by the government of Ghana to meet the institutional and financial needs of

8
8
this sector was the establishment of National Board for small scale Industries (NBSSI) in 1981
by Act 434 as apex body for the promotion and deve lopment of micro and small enterprises.1
1. In Ghana, NBSSI defines small-scale industries as production units that are engaged primarily in manufacturing outside the residence, with an investment and tools of not less than ¢10 million and which engage less than nine people. In the present study, we are defining micro-enterprises engaged in manufacturing and services’ sectors whose investment is less than ¢ 7 million.
In 1991, the Ghanaian Enterprises Development Commission was merged with NBSSI. This
brought in the financial assistance to the Micro and Small Scale industries. In 1994, the Cottage
Industries Section of the Department of Rural Housing & Cottage Industries was also merged
with the Board. The main objectives of the Board were: to make policy recommendations and
develop strategies towards the promotion of small and micro enterprises; to promote the
formation of sectors associations and develop existing ones; to mobilise funding for the
development of the small business sector; to develop the entrepreneurial, technical and
managerial capabilities of small business people; and to implement programmes and action
plans in collaboration with governmental and non-governmental organisations whose activities
have some impact on the promotion and development of small businesses.
The Friedrich Ebert Foundation in collaboration with NBSSI opened a Business Advisory
Centre in Cape Coast in 1991. The Business Advisory Centre (BAC) of the NBSSI provides
training, counselling and advisory services. The credit department of NBSSI has been
providing access to credit through the administration of the two very active credit schemes such
as PAMSCAD Credit-line scheme and the Revolving Fund scheme.
1.2. PROBLEM STATEMENT
Output growth could result from technological progress, increase in technical efficiency and
increase in input usage.2 The credit constraint and high cost of capital facing micro-enterprises

9
9
in Ghana in general, and Cape Coast in particular, limit output growth through different
technological regimes and increases in input usage.
2. The notion of how close the individual production plans are to the maximum levels as defined by the
production frontier, given input levels, is the measure of technical efficiency.
The challenge to policy makers is how to improve technical efficiency so that large gains in
output can be attained given current level of technology. This can only be done when we know
the factors that influence the technical efficiencies of the micro-enterprises.
A few studies have examined the effect of financial liberalisation on the distribution of credit
among firms of varying degrees of efficiency. Such studies use firm-level data to estimate
stochastic frontier production functions, and then measure each firm’s technical effic iency and
relate it to the distribution of credit. Studies of this type, cited in King and Levine (1993), found
that financial liberalisation tended to redirect credit to the more efficient firms. On the other
hand, it could be possible that firms that have better access to credit are more efficient. Thus,
we want to examine which form of this bi-directional causality between credit and technical
efficiency holds true for the three micro-enterprises, i.e. hairdressers, dressmakers and wood-
processors located in the Cape Coast municipality.
It is argued that technical efficiency is determined by individual characteristics of the
entrepreneurs. Factors influencing such characteristics may be divided into two groups -human
capital variables that dominate the decision -making process of the entrepreneurs, and
institutional and socio-economic variables that could influence an entrepreneur’s capacity to
apply his/her decisions at the enterprise level without any constraints. The human capital
variables are: age of operator, level of education, and business experience; institutional

10
10
variables are training programs, training experience, and access to credit and socio-economic
variables are interest on loan, contact with the lender.
This research, therefore, seeks to investigate the relationship between access to credit and
technical efficiency and point out the other relevant factors that determine the level of technical
efficiency in the Hairdressing, Dressmaking, and Wood processing micro-enterprises.
Moreover, we also evaluate the performance of NBSSI with regard to the provision of training
services and the performance of micro-finance enterprises with regard to the provision of credit
services.
1.3 OBJECTIVES OF THE STUDY
The present study tried to answer the following questions with regard to the above mentioned
selected micro-enterprises: What is the current level of technical efficiency? Is there any scope
in the improvement of technical efficiency? Can we identify the factors that influence this
current level of technical efficiency? Can we identify the factors that make these micro-
enterprises technically inefficient? Can the amount of credit provided by the micro-finance
enterprises and training services provided by NBSSI be considered as significant factors that
make these micro-enterprises technically inefficient?
1.4. ORGANISATION OF THE STUDY
Section 1 deals with introduction, problem statement, objectives of the study, and organisation
of the study. Section 2 presents the literature review. This section is further sub-divided into
two sub-sections. Section 2.1 deals with theoretical literature on technical efficiency, informal
finance and NBSSI. Section 2.2 deals with the empirical literature. In Section 3, we present
the analytical framework. Section 4 discuses the sampling procedure. The performance of

11
11
NBSSI is discussed in Section 5. In Section 6, we present the descriptive data analysis. Section
7 presents the estimated results. This section is further sub-divided into three sections. Section
7.1 presents the maximum likelihood estimates of frontier production functions. Section 7.2
presents estimates for the technical efficiency. Section 7.3 analyses the determinants of
technical efficiency. The last section deals with conclusions and policy recommendations.
2.0 LITERATURE REVIEW
2.1. THE THEORETICAL LITERATURE:
TECHNICAL EFFICIENCY AND ALLOCATIVE EFFICIENCY
The existing literature emphasises two broad approaches to the estimation of stochastic
production frontier and stochastic cost frontier and these are: (a) The non-parametric
programming approach and (b) The Statistical approach. The estimation of stochastic
production frontier provides estimates for the technical efficiency and the estimation of
stochastic cost frontier provides estimates for the allocative efficiency. Technical efficiency
reflects the ability of a firm to obtain maximal output for a given set of inputs. Allocative
efficiency reflects the ability of a firm to use the inputs in optimal proportions, given their
respective prices. In the case of a stochastic production frontier, the value of technical
efficiency lies between zero and one, while the value of allocative efficiency lies between one
and infinity in the stoc hastic cost function case. If the firm operates below the stochastic
production frontier then it is considered as technically inefficient (the value of technical
efficiency is less than one). On the other hand, if the firm operates above the stochastic cos t
frontier then it is considered as allocatively inefficient (the value of allocative efficiency is
more than one).

12
12
The non-parametric programming approach requires one to construct a free disposal convex
hull in the input-output space from a given sample of observations of inputs and outputs. This
approach can be used where a firm produces multiple outputs. In this approach, estimates can
be obtained for technical, allocative and scale efficiencies (Farrell, 1957; Afriat 1972; Hanoch
and Rothchild, 1972; Diewert and Parkan, 1983).
A major criticism of this approach is that the convex hull, representing the maximum possible
output, is derived using only marginal data and not utilising all the observations in the sample.
Thus the production efficiency measures are susceptible to outliers and measurement errors
(Forsund et.al.,l980). Secondly, the method has very demanding data needs. Finally, this being
a non-parametric approach, no statistical inferences from the estimates can be derived.
The statistical approach can be sub-divided into the neutral-shift frontiers and the non-neutral
shift frontiers. The former approach provides estimates for the technical and allocative
efficiencies by specifying composed error formulations to the conventional production and cost
functions (Aigner et. al., 1977; Meeusen and van den Broeck, 1977, Schmidt and Lovell 1979).
The latter approach uses a varying coefficients production function formulation (Kalirajan and
Obwona, 1994; Obwona, 1995). A major criticism of the statistical approach is that it cannot
provide estimates for the technical and allocative efficiencies for those firms that produce
multiple outputs.
INFORMAL FINANCE
A large part of financial transactions in Africa occur within the formal and informal financial
sectors. Informal finance has been defined to refer to all transactions, loans, and deposits
occurring outside the regulations of a central monetary authority. In Africa, it has been defined
as the operations of savings and credit associations, professional money lenders, part-time

13
13
money lenders like traders, grain millers, small holder farmers, employers, relatives and
friends, as well as co-operative societies (Aryeetey et. al., 1997; Aryeetey and Udry, 1997)
.Three types of informal units in Africa have been identified: savings mobilisation units with
little or no lending; lending units that do not engage in any savings; and those units that
combine deposit mobilisation and lending (Aryeetey and Udry, 1997) Studies on informal
finance in Africa ha ve demonstrated that both in the urban and rural areas, the informal sector
has been a veritable source of credit for production and consumption purposes (Tapsoba, 1981;
Seibel, 1986; Hyuha et. al., 1993, Aredo, 1993). Inspite of the low transaction costs of the
informal financial sector (Aryeetey, 1996b); the small and micro-enterprises have limited
access to institutional financing because they are considered as too risky (Steel, 1977); have
insurance arrangements which are only partial (Aryeetey, 1996b) or totally absent (Aryeetey
and Udry, 1997); unable to provide collateral security for the loans (Ray and Hutchinson, 1983;
Besley, 1994); and the resources of the lending institutions are too small (Aryeetey, 1996b). In
Africa, it has been established that the informal finance is more important than the formal
finance (Chipeta and Mkandawire (1991) for Malawi; Aryeetey and Gockel (1991) for Ghana;
and Hyuha et. el. (1993) for Tanzania). The NBSSI can be considered as a micro-finance
enterprise belonging to the informal financial sector and category two mentioned above
(lending units that do not engage in any savings).
NBSSI
The potential economic and social benefits of the small and micro-enterprises are that these
enterprises create jobs at relatively low capital cost. They contribute significantly to the
economy in terms of output of goods and services. These enterprises provide opportunity for
the development of an appropriate technology. They offer an excellent breeding ground for

14
14
entrepreneurial and managerial talents. These enterprises also develop a pool of skilled and
semi-skilled workers.
In Ghana, the NBSSI was established to provide financial assistance to small-scale industries.
The Business Advisory Centre (BAC) that operates under the NBSSI was also established to
facilitate access to formal and non-formal sources of credit to small – scale industries. The
BAC promotes access to credit by assisting entrepreneurs to form associations; assisting
associations to start mutual guarantee sche mes; assisting individual association members to
guarantee for bank lending; disseminating knowledge on bank facilities, procedures and
requirements; orienting banking officials with a view to make them conversant with the
potentials and practices of small-scale industrial entrepreneurs; and assisting in the preparations
of business plans of enterprises for funding. Moreover, the NBSSI is also running its own
credit facilities and has it own loan appraisal, approval and monitoring mechanism that is
administered by BAC/NBSSI staff, simultaneously.
Training in entrepreneurship is now generally seen as a strategy to speed the pace of industrial
development in Ghana. Providing entrepreneurship training for micro-enterprises is one of the
major activities of the BAC. The training workshops organised by the BAC include awareness
seminars, entrepreneurship development programs, working capital management workshops,
customer relation seminars, record management workshops, marketing seminars, technical
training workshops, industrial visits and book-keeping workshops. The methods used in these
training programmes include interactive lectures, discussions, case studies, group work, role -
plays and practical exercises.
Various non-governmental organisations (NGOs) have been involved in financing the micro-
enterprises all over Ghana. In Cape Coast, Friedrich Ebert Foundation (NGO) is helping the

15
15
Business Advisory Centre ( BAC) to provide non-financial assistance for the micro and small
enterprises. Most of the NGOs have, however, not been able to provide substantial amounts of
credit to the micro-enterprises. Their inexperience in financial services has limited their
potential. There is little co-ordination among the NGOs resulting in duplication of resources.
Most of them have high credit costs, are donor based and sponsored, lack adequate funding,
and are limited in their geographical coverage.
2.2. THE EMPIRICAL LITERATURE
The empirical literature on the measurement of technical and allocative efficiency in the
agricultural, manufacturing and services’ sectors of sub-Saharan African countries is very
limited. Njikam (1998) has examined the impact of trade liberalisation on the technical
efficiency of electrical industry of Cameroon and found a positive effect of trade policy
liberalisation on this technical efficiency. It has been established by Ajibefun and Daramola
(1999) for the Block Making, Metal Fabricating and Sawmill industries of Nigeria that the age
of operator, level of education and the level of investment are the most significant determinants
of both technical and allocative efficiency. In another study Obwona (2000) has shown for the
Tobacco growers of Uganda that the most significant determinants of technical efficiency are
the family size, level of education, health status, hired workforce, credit accessibility,
fragmentation of land and extension services.
The literature on the theory of credit markets with incomplete markets and imperfect
information is voluminous and largely relevant for the functioning of informal credit markets.
There have been some empirical studies in Ghana, which bring forth the importance of small-
scale industries and examine the credit performance of the informal financial sector.
Steel (1977) conducted a survey, which covered a wide range of activities located in Accra,
Aburi and Nsawam. He asserted that the small-scale sector had the potential for promoting
16
16
economic growth and for absorbing the surplus labour. Thomi and Yankson (1985) in their
study identified the main constraints facing the small-scale industries in Ghana to be inadequate
credit, input supply, and depressed domestic demand for their products and services. They also
observed that most of the small-scale firms in Ghana do not offer much scope for permanent
wage employment but they play a very crucial role in training future entrepreneurs, and in
providing opportunities for self-employment. Sowa et. al. (1992) noted that the number of
workers employed in most of the small firms did not increase over the years. The increased
employment in the sub-sector was achieved through an increase in the number of firms. The
firms relying on specialised agencies such as the Ghanaian Enterprises Development
Commission (GEDC) appeared to have performed slightly better than those relying on the
traditional banks. Abaka and Mayer (1994) in their report on small-scale enterprises observed
that the small enterprises are major creators of employment due to their labour-intensive
technologies. They are the seedbeds for new entrepreneurs, the vehicles to bring development
to the rural areas, and use technologies, which are generally more, appropriate for them.
Looking at the role of informal and formal financial sectors in Ghana, Aryeetey and Gockel
(1991) examined the various factors which influence the demand for formal savings and
lending facilities and observed that incomes, bank formalities, and banks’ preference for large
transactions are the major factors. Travel costs and time are considered important factors that
determine transaction costs to the entrepreneurs. They also estimated that almost half of all
demand deposits held by banks were informally mobilised. According to Aryeetey et. al.
(1997), credit markets in Africa are characterised by problems of information asymmetry,
agency problems, poor contract enforcement mechanisms, and fragmentation. These problems
lead to credit rationing in credit markets, adverse selection and moral hazard (Stiglitz and
Weiss, 1981; Besley, 1994; Udry, 1994; Aryeetey et. al., 1997; Elhiraika and Ahmed ,1998).

17
17
There are virtually no empirical studies in Ghana, which examine the role of micro-finance
enterprises in providing the credit services and NBSSI in providing the training services to
micro-enterprises and at the same time linking it to the measurement of technical efficiency.
3.0 ANALYTICAL FRAMEWORK
In this study, we intend to use the stochastic frontier, also called “Composed error” model of
Aigner et al (1977) and Meeusen and van den Broeck (1977). Consider a firm using k inputs
(x1 , x2 , …,xk) to produce a single output Y. Efficient transformation of inputs into output is
characterised by the production function, which shows the maximum output obtainable from
various input vectors. The stochastic production function is defined as
Yi = xi β + (Vi - Ui) , i = 1, 2,…..N (1) 3
where Yi is the production (or the logarithm of the production) of the i -th firm;
xi is a k X 1 vector of input quantities of the i -th firm;
β is a vector of unknown parameters;
Vi are random variables; and
Ui are non-negative random variables, which are assumed to account for
technical inefficiency in production.
The random errors, Vi, are assumed to be independently and identically distributed as
N (0,σ V 2) independent of Ui’s. The U’s are also assumed to be independently and identically
distributed as, for example, exponential (Meeusen and van den Broeck, 1977) and half normal

18
18
(Aigner et. al., 1977). In the present study, we assume that U’s follow half normal distribution
and use mixed chi-square distribution (Likelihood Ratio Test) to test for the one -sided error.
3. The Stochastic production function assumes the presence of technical inefficiency of production. The term N represents the size of sample (number of firms).
Technical efficiency (TE) of an individual firm in the context of the stochastic frontier
production function (1) is defined as
TEi = E(Yi */ Ui , xi ) / E(Yi */ Ui =0, xi ) (2)
where Yi * is the production of the i -th firm, which will be equal to Yi when the dependent
variable is in original units and will be equal to exp(Yi) when the dependent variable is in logs.
We use the log version of equation (1) for the Hairdressers and the technical efficiency is
defined as exp(-Ui). For the Dressmakers and Wood processors we use the non-log version of
equation (1) and the technical efficiency is defined as (xi β - Ui)/ (xi β).
The maximum likelihood estimates for the parameters of the Stochastic frontier production
functions and the predicted technical efficiency have been obtained by using the Computer
program, FRONTIER 4.1 (Coelli, 1994), in which the variance parameters are expressed in
terms of
σ2 = (σU2+σV
2), and
γ = σU2/(σU
2+σV2) (3)
We have also estimated the technical inefficiency model by regressing the predicted technical
efficiency on a vector of human capital variables (age of operator, level of education, and
business experience), institutional variables (training programmes, training experience, and
19
19
access to credit) and socio-economic variables (interest on loan, contact with the lender). The
technical inefficiency model can be specified as
m
TEi = δ0+ Σδj Hi j+ ε i (4)
j = 1
where H is a vector of exogenous variables and the parameters of this equation will be
estimated by OLS. The statistical significance of δ’s will help us in identifying the
variables which are causing technical inefficiency in the selected micro-enterprises.
Thereafter, we have re-estimated the preferred model by deleting the insignificant policy
variables. The two-stage estimation procedure has been long recognised as one that is
inconsistent in its assumptions regarding the independence of the inefficiency effects in the
two estimation stages. The two-stage estimation procedure is unlikely to provide estimates
that are as efficient as those that could be obtained using a single-stage estimation
procedure ( Reifschneider and Stevenson,1991).
Since the Hairdressers, Dressmakers and Wood-processors produce differentiated products
within each group, we have decided to use the value of output instead of physical output as a
dependent variable in the empirical estimation of production functions. The inputs that are
included in the production functions are the expenditure on equipment, expenditure on
electricity and the man-hours worked.
4.0 SAMPLING PROCEDURE
The data collection process required preliminary surveys in order to construct the sampling
frames and draw various samples. Three pilot surveys were therefore conducted for this

20
20
purpose. Populations of Hairdressers, Dressmakers and Wood-processors located within the
municipality of Cape Coast were identified. In the second stage, populations of Hairdressers,
Dressmakers, and Wood-processors who had benefited from either loan and/or training
programmes were identified. Fifty respondents were randomly selected from these populations
using a random start for each group. Thus, purposive random sampling technique was used in
selecting our respondents.
Research assistants who were very proficient at Fante were selected and trained for one week
so that they could interpret the questionnaires to the entrepreneurs most of whom have only
primary education. Before the final questionnaires were administered, pilot surveys were again
conducted on five respondents from each group. The surveys revealed some weaknesses in the
structure of some of the questions in original questionnaire. The questionnaire was therefore
modified accordingly and was administered by the research assistants. Information was
collected on value of output, physical quantities of inputs, human capital variables, institutional
variables and socio-economic variables. There was a follow up to confirm some of the
responses provided by the respondents.
5.0 PERFORMANCE OF NBSSI IN CAPE COAST
The NBSSI in Cape Coast provides training and financial services to entrepreneurs. In the first
sub-section of this section, we discuss the performance of NBSSI with regard to the training
services and the second sub-section provides information on credit services of NBSSI.
5.1. TRAINING SERVICES
In this section, we present brief information on the types of training programmes organised by
the NBSSI in Cape Coast and the participation rate. Within the year 1997, the NBSSI organised
forty- seven training programmes and seven follow ups, excluding daily counselling and
advisory services to small-scale entrepreneurs. The total number of participants in all the

21
21
programmes was one thousand six hundred and fifty seven. This number was made up of seven
hundred and ninety seven women and eight hundred and sixty men. The programmes included
one entrepreneurship awareness seminar, eleven management appreciation
workshops/seminars; seven improve your business seminars, eight technical management
workshops, three internships and seventeen leadership workshops.
In 1998, the NBSSI organised twenty-three training programmes. The summary statistics of
this is given in Table 1. It could be inferred that twenty-three seminars were organised within
the year 1998. These included two information seminars, two entrepreneurship awareness
seminars, twelve management appreciation seminars, five technical seminars, and two
management development seminars. Furthermore, within the year, twelve leadership meetings
were organised with Forum of Small-Scale Business Associations (FOSSBA) members, which
were attended by 446 people made up of 166 females and 284 males.
During the year 1999, the NBSSI organised seventeen training programmes for the business
community of Cape Coast. These Programmes included Technical workshops, Information
seminars and management development workshops. Seven hundred and nine people
participated in the various workshops, out of which three hundred and seventy were men and
three hundred and thirty-nine were women.
Table 1. Training Programmes Type of Programme No. of
Programmes No. of Participants M F T
Information Seminar 2 47 276 323
Entrepreneurship Awareness Seminar
2 64 19 83
Management Appreciation Seminar
12 183 164 347
Technical Seminar 5 65 80 145 Management Development Seminar
2 1 47 48

22
22
TOTAL 23 360 586 946
Source: NBSSI, Annual Report, 1998. 5.2. CREDIT SERVICES
There are three schemes of credit facilities supervised by NBSSI. They are PAMSCAD,
Revolving Fund and RBAF. Table 2 below gives the data on the loans granted to some sectors
in 1997 under the PAMSCAD and REVOLVING FUND schemes. A total amount of ⊄10.4
million was granted to twenty-eight entrepreneurs under the PAMSCAD credit line scheme.
Out of this amount twelve entrepreneurs in the services sector received an amount of ⊄4.5
million. In the allocation of funds under the PAMSCAD credit line scheme, female
entrepreneurs were given priority. The rate of loan recovery under the PAMSCAD credit line
scheme was 93% in 1997. During the same year, two entrepreneurs benefited from the
Revolving fund scheme with an amount of ⊄3.0 million. One out of the two entrepreneurs who
benefited from the revolving fund scheme came from the services sector. The rate of recovery
under the revolving fund scheme was 43%.
Table 2. Loans to various sectors under PAMSCAD and REVOLVING FUND PAMSCAD REVOLVING FUND Sector
No.
Loans (⊄’m )
NO.
Loans (⊄’m )
Manufacturing Service Fish Smoking Poultry
8 12 6 2
2.7 4.5 2.2 1.0
- 1 - 1
- 1.5 - 1.5
Total 28 10.4 2 3.0 Source: NBSSI, Annual Report, 1997.

23
23
Information on credit to entrepreneurs during the year 1998 was available only for the third
quarter. During this quarter eleven entrepreneurs were given total amount of ⊄1.5 million
under the PAMSCAD credit line scheme. The breakdown of loans given to various sectors is
provided in Table 3.
Table 3. Sectoral allocation of loans Sector No. Amount (⊄M) Manufacturing 3 1.1 Service 7 3.5 Agriculture (Poultry) 1 0.5 Total 11 5.1
Source: NBSSI, Third Quarter Report, 1998. Seven entrepreneurs in the services sector were given total loans amounting to ⊄3.5million.
Females were given priority in the allocation of loans under PAMSCAD credit line scheme in
the third quarter of 1998. The rate of recovery under the PAMSCAD scheme was 93%. One
entrepreneur applied for loan under the revolving fund scheme. The application was further
sent to Accra for final approval. The rate of recovery under the revolving fund scheme was
48%.
In 1999, ⊄5.0 million was disbursed to eleven entrepreneurs under PAMSCAD Credit line
sche me. Eight entrepreneurs in the services sector out of eleven successful applicants received
loans under this scheme. Females were given priority in the allocation of loans. One
entrepreneur applied for loan under the revolving fund scheme and the application was partially
approved and sent to Accra for final approval.
6.0 DESCRIPTIVE DATA ANALYSIS The questionnaires were hand-delivered and carefully read out to the hairdressers, dressmakers
and wood-processors. The response rate was 100% and all the hairdressers and dressmakers
were females, whereas all the wood-processors were males. Common pieces of equipment used

24
24
by the hairdressers were dryers, rollers, mirrors, towels, pins, washing basins, chairs, combs,
hair brushes, towel racks, heaters, scissors, gloves, ear protectors, needles, cups/glasses and
pegs. In addition to these, thirty-two hairdressers used curling irons or tonguing machines, two
had manicure machines, fifteen had fridge, two had television sets, twenty-seven had tape
recorders, five had heaters, and thirty-five had fans. Common consumables used by the
respondents included water, cream, shampoo, conditioner, lotion, pomade, spray, spirit, oil,
treatment cream, dye, gel, hair mousse, powder, artificial hair and thread.
The common pieces of equipment used by the dressmakers were sewing machines, pressing
iron, scissors, needles, measuring tapes and wooden tables. Special equipments owned by
some of the dressmakers were knitting machines, press button machines, industrial machines,
embroidering machines, chain stitching machines and machine motors. The common
consumables were thread, pins, buttons, chalk, and polyester. Other consumables included
chords, posters, textiles, lace, foam, and machine oil.
The common tools used by the wood-processors included plane, saw, chisel, hammer, pincer,
claw bar, mortise, pliers, and measuring tape. In addition to these tools, only two respondents’
used moulding machine and one used plough. Materials (consumables) commonly used by the
wood-processors were boards, nails, polish, glue, sandpaper, and plywood. Four wood-
processors used foam in addition to the stated consumables, one used putting, two used
upholstery materials and one used stuffing material.
The summary statistics for the types of training programmes and the participation rate of
respondents are provided in Table 4. It is clear from Table 4 that majority of the hairdressers
took part in the awareness seminars, customer relation workshops, record management
workshops, and technical training workshops. Most of the dressmakers participated in the
awareness seminars and technical training workshops. The awareness seminar was the most

25
25
highly patronised with the participation of twenty-eight wood processors. This was followed
by technical training workshops, which were attended by eighteen wood processors. The next
was industrial visits in which fifteen wood processors took part.
Table 4. Participation in Training Programmes
PROGRAMME Hairdressers Dressmakers Wood processors Awareness Seminar 48 40 28 Entrepreneurship Development Program
32 1 10
Working capital Management Workshop
42 2 10
Customer Relation Seminar
50 3 6
Record Management Workshop
47 8 3
Marketing Seminar 24 3 3 Technical training workshop
49 36 18
Industrial Visits 24 4 15 Book Keeping 0 3 0
Source: Authors survey Note: The sum of the number of people who participated in the seminars is more than fifty because some entrepreneurs participated in more than one. The purposes of the loans applied for and the corresponding number of the respondents for
each micro-enterprise are given in Table 5. It is evident from Table 5 that majority of the
hairdressers applied for loans to expand their businesses and to increase their working capital.
The majority of the dressmakers applied for loans to increase their working capital. This
indicates that a significant number of the dressmakers in Cape Coast do not have sufficient
working capital. Eleven dressmakers took the loan to expand their businesses. Majority of the
wood-processors applied for the loan to settle outstanding loans, among other purposes.
Twenty-seven wood-processors indicated that the loan, among other things, was to be used for
the purchase of materials. Fifteen wood-processors indicated that the loan was meant to

26
26
increase working capital. Eight wood processors stated that the loans were supposed to be used
for the expansion of business. Aryeetey (1992) in Ghana and Soyibo (1994) in Nigeria have
observed that informal finance is rarely used for the expansion of micro-businesses. The
finding that hairdressers have used different sources of informal finance (as shown in Table 6)
for the expansion of their businesses stands in contrast with the findings of Aryeetey (1992)
and Soyibo (1994).
Table 5. Purpose of Loan PURPOSE OF LOAN Hairdressers Dressmakers Wood processors Working capital 26 30 15 Expansion of business 38 11 8 Payment of Outstanding loan
1 2 31
Materials 0 4 27 Source: Authors Survey Note: Some respondents needed the loan for more than one purpose hence the sum of the number of respondents is greater than fifty.
The classification of respondents according to the sources of loans across different micro-
enterprises is given in Table 6. It is evident from Table 6 that majority of the hairdressers had
loans from relatives/friends and suppliers. None of the hairdressers interviewed received loan
from the NBSSI. The majority of the dressmakers took loans from relatives and friends. Only
four persons took advantage of the credit facilities of the NBSSI. None of the dressmakers was
given loan by the Banks. Majority of the wood processors took loans from relatives/friends and
their clients. One wood-processor had the loan from workers. Many surveys of enterprise
finance in Africa indicate that start-ups of micro-businesses in most countries are primarily
funded by landlords, neighbours, friends and relations (RPED, 1993). Moreover, Hyuha et al.
(1993) have noted that informal finance through friends and relations in Tanzania was a
significant source of agricultural financing. Atieno (1998) has observed in a survey done in
Kenya that about 70% of the respondents got their initial capital from family friends and
relatives, while 81% got their operating capital from the same source. Our finding that majority

27
27
of Hairdressers, Dressmakers, and Wood-processors took loans from their friends/relatives and
suppliers/clients is in conformity with the above mentioned findings. In both Ghana and
Nigeria, steady growth in the flow of loan applications to informal lenders has been observed,
and has been matched by steady increases in the numbers of loans granted by various informal
lenders (Aryeetey, 1994; Soyibo, 1994). Our finding that it is only the informal sector that
caters for the needs of hairdressers, dressmakers, and wood-processors in Cape Coast is in
conformity with the findings of Aryeetey (1994) and Soyibo (1994).
Table 6. Sources of Loans SOURCE OF LOAN Hairdressers Dressmakers Wood processors Banks 4 0 3 NBSSI 0 1 1 Relatives/Friends 28 30 21 Money lenders 3 3 1 Co-operatives 1 3 0 Suppliers 36 8 5 Clients 1 3 20 Workers 1 3 1 Source: Authors survey Note: The sum of the number of people who took loans is more than fifty because some took loans from more than one source.
Respondents were asked to indicate the reasons for borrowing from the various sources and
these are shown in Table 7. It is evident from Table 7 that majority of hairdressers took loans
from relatives/friends and suppliers because of more favourable terms of lending and no
complicated formalities were required. Majority of dressmakers took loans from
relatives/friends because of more favourable terms of lending and no collateral was required.
Majority of the wood-processors took loans from relatives/ friends and clients because of more
favourable terms of lending and no complicated formalities were required. However, majority
of the respondents from each of the three micro-enterprises indicated that the loans they
received were not sufficient.
Table 7: Reasons for Borrowing from Various Sources REASONS HAIRDRESSERS DRESSMAKERS WOOD PROCESSORS More Favourable terms 30 34 45

28
28
Easier Formalities 22 16 30 No Collateral Required 11 36 21 Flexible Payback 8 12 10 Easier To Get A Loan 7 10 5 Others 4 4 4
Source: Authors survey Note: The sum of the number of people who took loans is more than fifty because some took loans from more than one source. Respondents were asked to indicate what happens if they are unable to pay back the loan and
these responses are indicated in Table 8. It is clear from this table that majority of hairdressers
and dressmakers face credit interruption and get persistent request for repayment whenever
Table 8. Action on Defaulters PENALTY HAIRDRESSERS DRESSMAKERS WOOD PROCESSORS Interest Penalty 6 2 0 Interruption Of Credit 22 26 23 Rescheduling 0 15 29 Reduction Of Interest Charges
0 0 0
Debt Forgiveness 0 3 5 Strong Arm Enforcement
2 3 1
Persistent Request For Payment
34 16 15
Others 0 5 9 Source: Authors survey Note: The sum of the number of people who took loans is more than fifty because some took loans from more than one source.
they are unable to pay back the loans. On the other hand, majority of wood-processors
indicated that they face rescheduling and interruption of credit whenever they are unable to pay
back the loans.
7.0 ANALYSIS OF ESTIMATED RESULTS 7.1. Maximum Likelihood Estimates of Frontier Production Functions
The maximum likelihood estimates of preferred frontier production functions are indicated in
Table 9. First of all it is important to note that the Likelihood Ratio test statistics for all the
three enterprises are statistically significant at the 5% level of significance, which imply that
the frontier production function fits the data better than an average production function. 4 This

29
29
point is also buttressed by very significant Variance Ratios for all the three enterprises. It is
evident from the estimated Cobb-Douglas frontier production function for the hairdressers that
4. The average production function assumes only one error term that is normally distributed. it is only electricity and man-hours worked which were found to be the significant determinants
of value of output, with elasticity coefficients of 0.30 and 0.11, respectively. Since the sum of
the elasticities of output with respect to the various inputs is less than one, which either
suggests decreasing returns to scale or perhaps some missing explanatory variables (rent on
land/shops and water).5 The non-log versions of frontier production functions were found to be
Table 9: Maximum Likelihood Estimates of Production Functions Enterprise Variables
Hairdressers (Log Version)
Dressmakers (Non-log Version)
Wood Processors (Non-log Version)
Intercept6 8.6847* (1.4537)
71.696* (19.381)
-42.0433* (8.4908)
Equipment 0.0404 (0.0807)
0.0759* (0.0124)
0.5609* (0.0422)
Electricity 0.3013* (0.1041)
- 0.1341* (0.0503)
Man-hours 0.1081* (0.0602)
3.3503* (0.1913)
0.4563* (0.0277)
Variance Ratio (γ)
0.8565* (0.0932)
0.9297* (0.0386)
0.9999* (0.00003)
Total Variance(σ2) 0.1779* (0.0506)
14247.0* (1.1552)
1900.2* (311.64)
Log-Likelihood Function
-6.5997
-285.21
-226.48
Likelihood Ratio Test
5.15* 10.73* 15.12*
Notes: 1. The figures in the parentheses are the standard errors. 2. * indicates that the statistics is significant at 5% level of significance.

30
30
5. The inclusion of rent on land/shops and water as inputs besides equipment, electricity and man-hours in the production function yielded inconsistent estimates and that is why these two inputs were excluded from the production function.
6. The intercept takes care of the omitted variables in each equation.

31
31
more suitable for dressmakers and wood-processors.7 The estimated frontier production
function for dressmakers indicates that equipment and man-hours worked are the two
significant variables.8 The marginal effects of expenditure on equipment and man-hours
worked on the value of output of dressmakers were found to be 0.08 and 3.35, respectively. The
estimated frontier production function for wood-processors indicates that the coefficients of
equipment, electricity, and man-hours worked are statistically significant.9 The marginal effects
of expenditure on equipment, expenditure on electricity, and man-hours worked on the value of
output of wood-processors were found to be 0.56, 0.13, and 0.45, respectively.
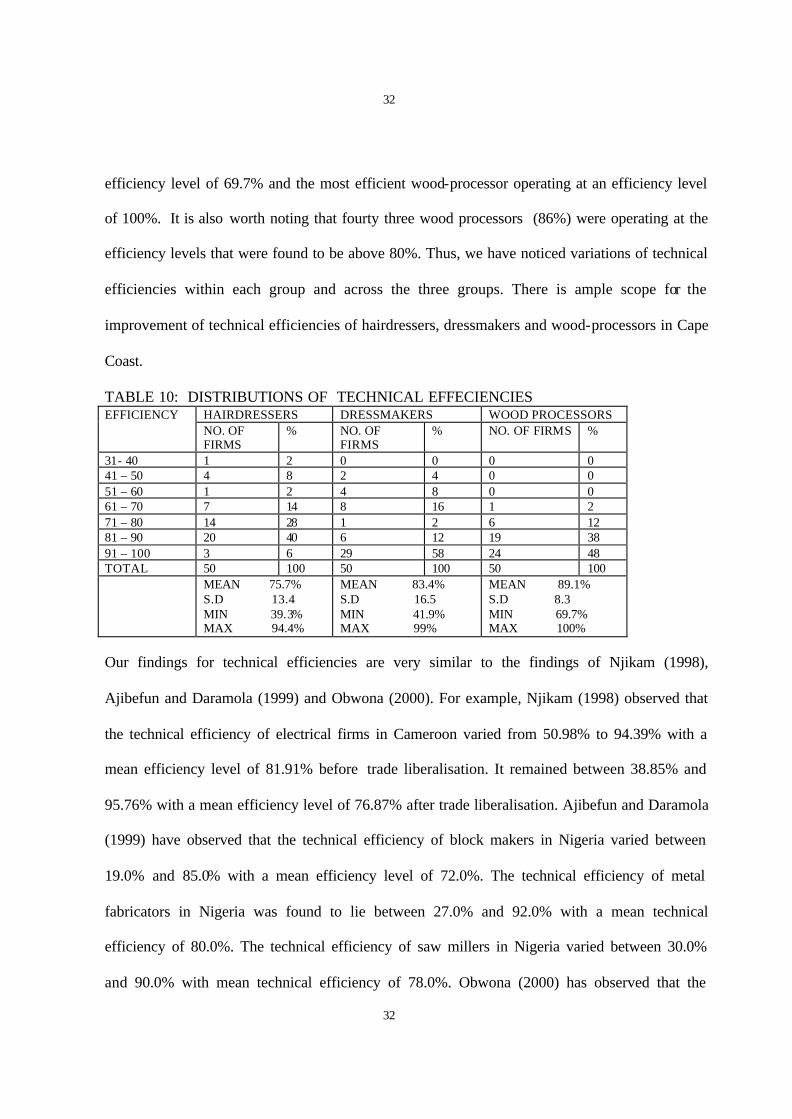
7.2. Technical Efficiency Estimates The distributions of technical efficiencies of hairdressers, dressmakers and wood-processors are
given in Table 10. The mean technical efficiency of the hairdressers was found to be 75.7%,
which was relatively lower than the mean technical efficiency observed for dressmakers’
(83.4%) and wood-processors (89.1%). Only one hairdresser (2%) was found to be operating at
efficiency level of 39.3%, while twenty-three hairdressers (46%) were operating at the technical
efficiency level that was more than 80%, with the maximum efficiency being 94.4%. Only two
dressmakers (4%) were at most 50% technically efficient and 70% of them were operating above
80% technical efficiency level. The least efficient and the most efficient dressmakers were
operating at 41.9% and 99.0% efficiency levels, respectively. Most of the wood processors were
operating at efficiency levels above 69%, with the least efficient wood-processor operating at an
7. The log version of frontier production functions for dressmakers and wood-processors yielded inconsistent estimates for the parameters of the production functions. 8. The inclusion of rent on land/shops and fabrics besides equipment, electricity, and man- hours in the production function yielded inconsistent estimates and that is why rent on land/shops, fabrics and electricity were excluded from the production function. 9. The inclusion of rent on land/shops and wood besides equipment, electricity, and manhours in the production function yielded inconsistent estimates and that is why rent on land/shops and wood were excluded from the production function.
32
32
efficiency level of 69.7% and the most efficient wood-processor operating at an efficiency level
of 100%. It is also worth noting that fourty three wood processors (86%) were operating at the
efficiency levels that were found to be above 80%. Thus, we have noticed variations of technical
efficiencies within each group and across the three groups. There is ample scope for the
improvement of technical efficiencies of hairdressers, dressmakers and wood-processors in Cape
Coast.
TABLE 10: DISTRIBUTIONS OF TECHNICAL EFFECIENCIES HAIRDRESSERS DRESSMAKERS WOOD PROCESSORS EFFICIENCY NO. OF FIRMS
% NO. OF FIRMS
% NO. OF FIRMS %
31- 40 1 2 0 0 0 0 41 – 50 4 8 2 4 0 0 51 – 60 1 2 4 8 0 0 61 – 70 7 14 8 16 1 2 71 – 80 14 28 1 2 6 12 81 – 90 20 40 6 12 19 38 91 – 100 3 6 29 58 24 48 TOTAL 50 100 50 100 50 100 MEAN 75.7%
S.D 13.4 MIN 39.3% MAX 94.4%
MEAN 83.4% S.D 16.5 MIN 41.9% MAX 99%
MEAN 89.1% S.D 8.3 MIN 69.7% MAX 100%
Our findings for technical efficiencies are very similar to the findings of Njikam (1998),
Ajibefun and Daramola (1999) and Obwona (2000). For example, Njikam (1998) observed that
the technical efficiency of electrical firms in Cameroon varied from 50.98% to 94.39% with a
mean efficiency level of 81.91% before trade liberalisation. It remained between 38.85% and
95.76% with a mean efficiency level of 76.87% after trade liberalisation. Ajibefun and Daramola
(1999) have observed that the technical efficiency of block makers in Nigeria varied between
19.0% and 85.0% with a mean efficiency level of 72.0%. The technical efficiency of metal
fabricators in Nigeria was found to lie between 27.0% and 92.0% with a mean technical
efficiency of 80.0%. The technical efficiency of saw millers in Nigeria varied between 30.0%
and 90.0% with mean technical efficiency of 78.0%. Obwona (2000) has observed that the

33
33
technical efficiency of tobacco growers in Uganda varied between 44.8% and 97.3% with mean
technical efficiency level of 76.2%.
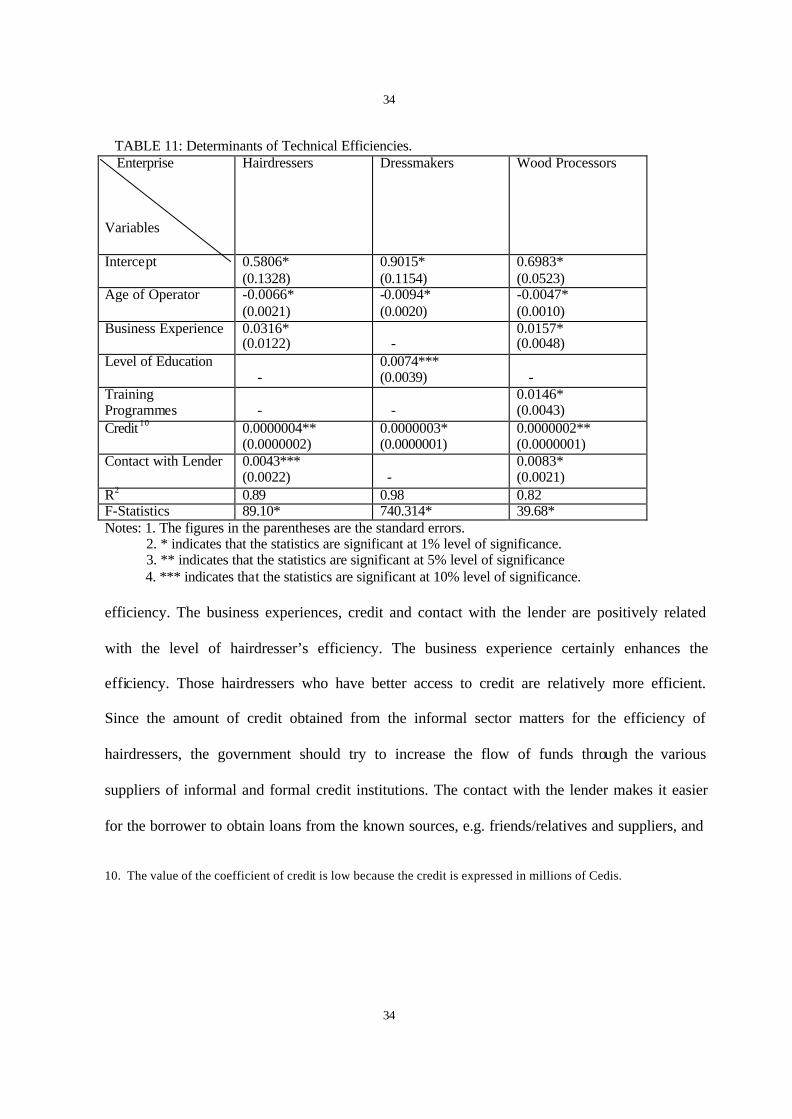
7.3. Determinants of Technical Efficiency Given a technology to transform physical inputs into outputs, some hairdressers, dressmakers
and wood-processors are able to achieve maximum efficiency unto 100% while the others are
technically inefficient. This discrepancy could be because the latter group does not have
adequate technical knowledge compared to first group. On the other hand, this discrepancy may
exist because of human-capital, institutional and socio-economic variables (Shapiro and Muller,
1977; Kalirajan and Shand, 1989). The computed technical efficiencies were modelled to depend
on certain policy variables. We expected to observe a negative relationship between the technical
efficiency and age of operator and interest paid on loans (cost of borrowing). All other policy
variables (business experience, level of education, training programmes, training experience,
access to credit, contact with the lender) were expected to be positively related with the technical
efficiency. The estimated coefficients of the general model for the hairdressers, dressmakers and
wood-processors are presented in Appendix 1. The estimates for the preferred model are given
in Table 11. In hairdressing, the significant variables were age of operator, business experience,
credit and the contact with the lender. While interpreting the results, we should keep in mind that
only one policy variable changes and other variables are kept constant. As expected, age had a
negative impact on efficiency of hairdressers. This is because the older hairdressers are expected
to be less efficient in comparison to the younger ones. Moreover, the later groups of operators
are likely to be more agile and aggressive in business drive than the former groups of operators.
The government should encourage younger people to go into vocational training, especially
unemployed youths since this will bring forth desired increases in the level of hairdressers’
34
34
TABLE 11: Determinants of Technical Efficiencies. Enterprise Variables
Hairdressers Dressmakers Wood Processors
Intercept 0.5806* (0.1328)
0.9015* (0.1154)
0.6983* (0.0523)
Age of Operator -0.0066* (0.0021)
-0.0094* (0.0020)
-0.0047* (0.0010)
Business Experience 0.0316* (0.0122)
-
0.0157* (0.0048)
Level of Education -
0.0074*** (0.0039)
-
Training Programmes
-
-
0.0146* (0.0043)
Credit 10 0.0000004** (0.0000002)
0.0000003* (0.0000001)
0.0000002** (0.0000001)
Contact with Lender 0.0043*** (0.0022)
-
0.0083* (0.0021)
R2 0.89 0.98 0.82 F-Statistics 89.10* 740.314* 39.68* Notes: 1. The figures in the parentheses are the standard errors. 2. * indicates that the statistics are significant at 1% level of significance. 3. ** indicates that the statistics are significant at 5% level of significance 4. *** indicates that the statistics are significant at 10% level of significance. efficiency. The business experiences, credit and contact with the lender are positively related
with the level of hairdresser’s efficiency. The business experience certainly enhances the
efficiency. Those hairdressers who have better access to credit are relatively more efficient.
Since the amount of credit obtained from the informal sector matters for the efficiency of
hairdressers, the government should try to increase the flow of funds through the various
suppliers of informal and formal credit institutions. The contact with the lender makes it easier
for the borrower to obtain loans from the known sources, e.g. friends/relatives and suppliers, and
10. The value of the coefficient of credit is low because the credit is expressed in millions of Cedis.

35
35
ultimately raise the level of efficiency through access to credit. The value of R2 indicates that
about 89% of the variability in the efficiency of hairdressers is being explained by the relevant
policy variables. The significant value of F indicates that the estimated regression is a good fit.
In dressmaking, the significant variables were age of operator, education and access to
credit. As expected, age had a negative impact on efficiency of dressmakers. This is because the
older dressmakers are expected to be less efficient in comparison to the younger ones. Education
was found to be positively related to the efficiency of dressmakers. This is because education
enhances the stock of human knowledge and this consequently increases their efficiency. The
access to credit was again found to be positively related with the level of dressmakers’
efficiency. The value of R2 indicates that about 98% of the variability in the efficiency of
dressmakers is being explained by the relevant policy variables. The significant value of F
indicates that the estimated regression for dressmakers is a good fit.
In wood processing, the significant variables were age of operator, business experience, training
programmes, credit and the contact with the lender. As expected, age had a negative impact on
efficiency of wood-processors too. This is because the older wood-processors are expected to be
less efficient in comparison to the younger ones. Business experience has positive impact on the
efficiency of wood processors because they become more experienced while doing their
business. The training programmes, access to credit and contact with the lender are positively
related with the level of wood-processor’s efficiency. Participation in the training programmes
will certainly enhance the efficiency of wood-processors. The government should encourage the
NBSSI to organise more training programmes for the wood-processors so that their efficiency
could be raised. The access to credit and the level of efficiency of wood-processors are positively
related as expected. The contact with the lender makes it easier for the borrower to obtain loans
from the known sources, e.g. friends/relatives and clients, and ultimately raise the level of

36
36
efficiency through credit. The government should try to implement policies through which co-
ordeal relations can be established in the society. The value of R2 indicates that about 82% of the
variability in the efficiency of wood-processors is being explained by the relevant policy
variables. The significant value of F indicates that the estimated regression for wood-processors
is a good fit.
Our findings with regard to the determinants of technical efficiency are in conformity with some
of the findings of Ajibefun and Daramola (1999) and Obwona (2000). For example, Ajibefun
and Daramola (1999) have shown that the significant determinants of technical efficiency of
block-makers and saw-millers in Nigeria are age of operator, level of education, business
experience, and number of employees and level of investment. The significant determinants of
technical efficiency of metal fabricators in Nigeria are age of business, level of education,
business experience and number of employees. Obwona (2000) has shown that the significant
determinants of tobacco growers in Uganda are the family size, level of education, health status,
hired workforce, and credit accessibility, fragmentation of land and extension services.
8.0 CONCLUSIONS AND POLICY RECOMMENDATIONS In the present study, we have evaluated the performance of the micro-finance enterprises with
regard to the provision of credit services and the performance of NBSSI with regard to the
provision of training services to the hairdressers, dressmakers and wood-processors. The NBSSI
has been performing very well as far as the training services are concerned. As far as the
provision of credit is concerned, NBSSI has not performed well according to the expectations of
hairdressers, dressmakers and wood-processors because of lack of funds.11
11. An interview with the manageress of the NBSSI in Cape Coast revealed that the Board has limited funds available for Micro-Enterprises in Cape Coast. She also mentioned high default rate as an impediment to the expansion of their activities.

37
37
However, group lending should be encouraged so that the default risk is reduced and the rate of
loan recovery could be increased.
During the descriptive analysis, we have observed that hairdressers have used different sources
of informal finance for the expansion of their businesses and this finding stands in contrast with
the findings of Aryeetey (1992) and Soyibo (1994). Our finding that majority of Hairdressers,
Dressmakers, and Wood-processors took loans from their friends/relatives and suppliers/clients
is in conformity with the findings of RPED (1993), Hyuha et al. (1993) and Atieno (1998). Our
finding that it is only the informal sector that caters for the needs of hairdressers, dressmakers,
and wood-processors in Cape Coast is in conformity with the findings of Aryeetey (1994) and
Soyibo (1994). Respondents were asked to indicate the reasons for borrowing from the various
sources and they indicated that the most important reasons are favourable terms of lending,
easier formalities and no collateral required. Respondents were asked to indicate what happens if
they are unable to pay back the loan and they indicated that they face credit interruption, get
persistent request for repayment and rescheduling.
On the front of efficiency measurement, we observed that the stochastic frontier production
functions are preferred to average production functions in all the three micro-enterprises. The
most relevant inputs for the estimation of these frontiers are equipment, electricity and man-
hours worked. We observed many variations in the efficiency of hairdressers, dressmakers and
wood-processors within each group and across these groups, which indicates that there is ample
scope for raising the le vel of efficiency in these micro-enterprises. Our findings for the estimates
of technical efficiencies are very similar to the findings of Njikam (1998), Ajibefun and
Daramola (1999) and Obwona (2000). The most significant determinants of technical
efficiencies of hairdressers, dressmakers and wood-processors were identified as age of operator,
business experience, level of education, training programmes, access to credit, and the contact
38
38
with the lender. Our findings with regard to the determinants of technical efficiency are in
conformity with some of the findings of King and Levine (1993), Ajibefun and Daramola (1999)
and Obwona (2000).
The following recommendations are suggested:
• Group lending should be encouraged so that the default risk is reduced and the rate of loan
recovery could be increased.
• The Government of Ghana should try to implement policies through which cordial relations
can be established in the society.
• Efforts should be made to increase the access to credit through informal and formal financial
institutions.
• The Government of Ghana should establish more vocational training centres.
• The NBSSI should organise more training programs for the wood processors.
• The Government of Ghana should design policies that will sustain employment in
hairdressing and wood processing.

39
39
APPENDIX 1. TABLE 11: Determinants of Technical Efficiencies.
Enterprise Variables
Hairdressers Dressmakers Wood Processors
Intercept 0.5384* (0.1495)
0.8965* (0.1218)
0.6652* (0.0610)
Age of Operator -0.0063* (0.0023)
-0.0091* (0.0021)
-0.0037* (0.0010)
Business Experience 0.0303* (0.0126)
0.0005 (0.0031)
0.0077 (0.0056)
Level of Education 0.0026 (0.0032)
0.0056 (0.0043)
0.0054 (0.0036)
Training Programmes
0.0010 (0.0062)
0.0047 (0.0060)
0.0090* (0.0043)
Training Experience 0.0015 (0.0039)
0.0022 (0.0025)
0.0005 (0.0049)
Credit 0.0000004* (0.0000002)
0.0000002** (0.0000001)
0.0000004* (0.0000001)
Interest on Loan -0.0000002 (0.0000002)
-0.000000008 (0.00000007)
-0.0000002 (0.0000003)
Contact with Lender 0.0046** (0.0024)
0.0002 (0.0025)
0.0059* (0.0028)
R2 0.89 0.98 0.85 F-Statistics 42.86* 247.4* 29.54* Notes: 1. The figures in the parentheses are the standard errors. 2. * indicates that the statistics is significant at 5% level of significance. 3. ** indicates that the statistics is significant at 10% level of significance
40
40
APPENDIX 2.
QUESTIONNAIRE ON THE IMPACT OF NBSSI’S ACTIVITIES ON THE
EFFICIENCY OF MICRO-ENTERPRISES.
Please answer the following questions either by ticking (√) or by providing
appropriate answer.
(A) GENERAL/BACKGROUND INFORMATION 1. Name of business :
2. Location address : Telephone No. 3. Type of business :
(i) Dressmaking (ii) Hair-dressing (iii) Wood and Furniture Processing
4. Year of starting Business 5. Sex: Male [ ] Female [ ] 6. Age of Business operator : 7. Level of Education of owner/operator of business
(i) Primary school Number of years (ii) Secondary school Number of years (iii) College/Polytechnic Number of years (iv) University Number of years (v) Adult Education Number of years (vi) No schooling
8. How did you acquire the skill? (i) Formal education (ii) Apprenticeship scheme (iii) Others (specify)
9. Are you the owner or an employee? 10. How many years have you been involved in this business? 11. Please state the number of workers involved in your business
(i) Number of workers employed (ii) Number of workers under apprenticeship scheme.
12. Please state the average number of working hours per day you normally work. 13. How many days in a week do you work? 14. State the average monthly expenses on the following:
(i) Electricity (iv) Salaries (ii) Rent on land/shops (v) Interest on loan (iii) Water (vi) Materials
(vii) Others (specify)

41
41
(B) BUSINESS 1. Please provide information on types of materials used per month in your
production activity. Materials Quantities Unit cost Total cost
2. Please provide information on the equipment you use in your production activity.
Equipment Quantity Year of Purchase Unit Price
3. How much on the average do you earn per month?
(C) TRAINING SERVICES OF NBSSI AND OTHER INSTITUTIONS 1. Are you a member of any association? Yes [ ] No [ ] 2. If Yes, which association. 3. Are you a registered member of NBSSI? Yes [ ] No [ ] 4. Have you benefited from NBSSI? Yes [ ] No [ ] 5. Indicate the type of benefit(s).
Training [ ] Credit [ ] Others [ ] 6. Have you attended any training programs of NBSSI or other institution?
Yes [ ] No [ ] 7. Please indicate which of the programs given below you have participated in the
last three years: a) Awareness seminar b) Enterpreneurship Development Program c) Working capital management workshop d) Customer relation seminar e) Record Management workshop f) Marketing seminar g) Technical training workshops h) Industrial visits i) Any other (specify)
8. How long have you been on training and counseling programs? (D) CREDIT SERVICES OF NBSSI AND OTHER INSTITUTIONS 1. Did you apply to any formal and informal institution for a loan in the last three
years? Yes [ ] No [ ] 2. If yes, what was the purpose of the loan?
(i) Working capital (ii) Expansion of business (iii) Payment of outstanding loan (iv) Others (Specify)

42
42
3. Give information on the amount of loan and interest rate charged
Type of Institution Year One Year Two Year Three Amount Interest rate Amount Interest rate Amount Interest rate
Banks
NBSSI
Relatives/Friends
Money lenders Co-operatives Suppliers Clients Others (Specify) 4. You decided to borrow from the above-mentioned sources because of
A – More favorable terms B – Easier formalities C – No collateral required D – Flexible payback E – Easier to get a loan F – Others (Specify) Please tick (√) wherever it is appropriate
Terms and Type of conditions Institution
A B C D E F
01 02 03 04 05 06 07 08
5. Are the loans given to you by these institutions enough? Yes [ ] No [ ] 6. If no, suggest a range for loan.
7. Which of the following happens if you are not able to repay the loan taken from these Institutions?
(i) Interest penalties (ii) Interruption of credit (iii) Rescheduling (iv) Reduction of interest charges (v) Debt forgiveness

43
43
(vi) Strong arm enforcement (vii) Persistent request for repayment (viii) Other (Specify)
8. For how long have you known the lender? Years Months
01 Banks
02 NBSSI
03 Relatives/Friends
04 Money lenders
05 Co-operatives
06 Suppliers
07 Clients
Others (Specify)
(E) PROBLEMS FACED BY OWNERS
1 Do you face any problems with regard to
(a) Materials Yes [ ] No [ ] (b) Credit Yes [ ] No [ ] (c) Marketing Yes [ ] No [ ] (d) Training Yes [ ] No [ ]
2. List some of the problems: 3. What are your suggestions?

44
44
REFERENCES
Abaka, K. and P. Mayer, 1994, “ Promotion for Small-scale Enterprises in Ghana.” NBSSI. Adams, D. W. and J.D. von Pischke, 1992, “ Micro-enterprise Credit: De’ Ja Vu.”, World Development .Vol. 20, no. 10. Adera, A., 1995, “Instituting Effective Linkages between Formal and Informal Financial Sector in Africa: A Proposal.” Savings and Development . no. 1. Afriat, S.N., 1972, “Efficiency Estimation of Production Function.” International Economic Review. Vol.13, 569-598. Aigner, D.J., C.A.K.Lovell, and P. Schmidt, 1977, “Formulation and Estimation of Stochastic Frontier Production Function Models.” Journal of Econometrics. Vol.6, 21-37. Ajibefun, I. A., and G. Daramola., 1999, “Efficiency of Micro-enterprises in the Nigerian Economy.” Final Report, AERC Workshop, Kenya. Aredo, D., 1993, “The Informal and Semi-formal Financial Sectors in Ethiopia: A Study of the IQQUB, IDDIR, and Savings and Credit Co-operatives.” AERC Research Paper no. 21. African Economic Research Consortium. Aryeetey, E., 1992, “The Relationship between Formal and Informal Segments of the Financial Sector in Ghana.” AERC Research Paper no. 10. African Economic Research Consortium. Aryeetey, E.,1994, “Financial Integration and Development in Sub-saharan Africa: A Study of Informal Finance in Ghana.” Working Paper no. 78, ODI, London. Aryeetey, E., 1996a, “Informal Financial Markets in Africa in Forging Links: Economic Research and Policy Making in Sub-saharan Africa.” Paper presented at the Senior Policy Seminar. Aryeetey, E., 1996b, “Rural finance in Africa: Institutional Developments and Access for the Poor.” The World Bank Annual Conference on Development Economics, Washington D.C. Aryeetey, E., and F. Gockel., 1991, “Mobilising Domestic Resources for Capital Formation in Ghana: The Role of Informal Financial Sectors.” AERC Research Paper no. 3. African Economic Research Consortium. Aryeetey, E., H. Hettige, M.Nissanke, and W. Steel., 1997, “Financial Market Integration and Reforms in Ghana, Malawi, Nigeria and Tanzania.” World Bank Economic Review. Vol.11, no. 2. 195-218. Aryeetey, E., and C. Urdy, 1997, “The Characteristics of Informal Financial markets in Sub-saharan Africa.” Journal of African Economies. Supplement. Vol.6, no.1. Atieno, R., 1998, “Credit Rationing and Access to Credit: A Study of Formal and Informal Credit Institutions in Kenya.” African Journal of Economic Policy. Vol. 5, no. 2. 29-53. Besley, T., 1994, “How Do Market Failures Justify Intervention in Rural Credit Markets?” The World Bank Research Observer. Vol.9, no.1. 27-47. Coelli, T.J., 1994, “A Guide to FRONTIER Version 4.1: A Computer Program for Stochastic Frontier Production and Cost Function Estimation.” Mimeo, Department of Econometrics. University of New England. Armidale. Chipeta, C., and M.L.C. Mkandawire., 1991, “Links Between the Formal and Informal/ Semi-formal Financial Sectors in Malawi.” AERC Research Paper no. 14. African Economic Research Consortium. Diewert, W.E., and C. Parkan., 1983, “Linear Programming Tests of Regularity Conditions for Production Function.” In Quantitative Studies on Production and Prices. Eichorn, W., R. Henn, K. Neumann and R. W. Shephard eds. (Physica-verlag, Vienna).

45
45
Elhiraika, A.B., and S. A. Ahmed., 1998, “Agricultural Credit under Economic Liberalization and Islamization in Sudan.” AERC Research Paper no. 79. African Economic Research Consortium. Farrell, M.J., 1957, “ The Measurement of Production Efficiency.” Journal of the Royal Statistical Society Series A (General). Vol. 120, 253-281. Forsund, F.R., C.A.K. Lovell, and P. Schmidt.,1980, “A Survey of Frontier Production Functions and their Relationship to Efficiency Measurement.” Journal of Econometrics. Vol. 13, 5-25. Hanoch, G., and M. Rothchild., 1972, “ Testing the Assumptions of Production Theory: A Non-parametric Approach.” Journal of Political Economy. Vol. 80, 256-275. Hossain, M., 1988, “Credit for the Alleviation of Rural Poverty: The Grammen Bank in Bangladesh.” IFPRI Research Report no. 65, Washington, D. C. Hyuha, M., M. O. Ndanshau, and J. P. Kipokola., 1993, “Scope, Structure and Policy Implications of Informal Financial Markets in Tanzania.” AERC Research Paper no. 18. African Economic Research Consortium. Kalirajan, K. P., and M. B. Obwona., 1994, “Frontier Production Function: The Stochastic Coefficients Approach.” Oxford Bulletin of Economics and Statistics.Vol.56, 85-94. Kalirajan, K. P., and R. T. Shand., 1989, “A Generalised Measure of Technical Efficiency.” Applied Economics. Vol. 21, 25-34. King, R. G., and R. Levine., 1993, “Finance, Entrepreneurship and Growth: Theory and Evidence.” Journal of Monetary Economics. Vol. 32, 513-542. Meeusen, W., and J. Van den Broeck., 1977, “Efficiency Estimation from Cobb-Douglas Production Function with Composed Error.” International Economic Review. Vol. 18, 435-44. Nappon, D., and B. Huddlestone., 1993, “Rural Infrastructure Priorities for Food security and Sustainable Development: The Case of Central Africa.” In Regional Food Security and Rural Infrastructure, Vol.2. Thimm-U., and H. Hahn eds. (Lit verlag Munster, Hamburg). Njikam, O., 1998, “Trade Liberalisation and Productive Efficiency of Cameroon Electrical Firms.” African Journal of Economic Policy. Vol.5, no. 1. 21-46. Obwona, M. B., 1995, “Production Frontiers and Efficiency Measures: Concepts and Applications.” Ph. D. Dissertation, Australian National University, Canberra. Obwona, M. B., 2000, “Determinants of Technical Efficiency Differentials among Small and Medium Scale Farmers in Uganda: A Case of Tobacco Growers.” Final Report, AERC Workshop, Kenya. Ray, G.H., and P. J. Hutchinson., 1983, The Financing and Control of Small Enterprises and Development. ( Glover Pub. Co., England).
Reifschneider, D. and R. Stevenson., 1991, “Systematic Departures from the Frontier: A Framework for the Analysis of Firm Inefficiency”, International Economic Review, Vol. 32, 715-723.
Schmidt, R. H., and E. Kropp., 1987, Rural Finance Guiding Principles.( GTZ, Eschborn). Schmidt,P.and C.A.K.Lovell.,1979, Estimating Technical and Allocative Inefficiency Relative to Stochastic Production and Cost Frontiers, Journal of Econometrics ,Vol.9, 343-366.
Seibel, H. D., 1986, “Rural Finance in Africa: The Role of Informal and Formal Financial Institutions.” Development and Change. Vol. 6, 12-14. Shapiro, K. H., and J. Muller., 1977, “Sources of Technical Efficiency: The Role of Modernisation and Information.” Economic Development and Cultural Change. Vol. 25, 293-310

46
46
Sowa, N. K., et. al., 1992, “Small-scale Enterprises and Adjustment: The Impact of Ghana’s Economic Recovery Programme.” University of Ghana, Legon. Soyibo, A., 1994, “Financial Linkage and Development in Sub-Saharan Africa: A Study of Informal Finance in Nigeria”, Report. ODI, London. Steel, W. F., 1977, Small Scale Employment and Production in Developing Countries: Evidence from Ghana.( Praeger Pub. Co., New York). Stiglitz, J., and A. Weiss., 1981, “Credit Rationing in Markets with Imperfect Information.” American Economic Review. Vol.71, No.3. Tapsoba, E. K., 1981, “An Economic and Institutional Analysis of Formal and Informal Credit in Eastern Upper Volta: Empirical Evidence and Policy Implications.” Ph. D. Dissertation, Michigan State University. Thomi, W. H., and P. W. K. Yankson., 1985, Small Industries and Decentralisation in Ghana.(University of Ghana Press, Legon). Udry, C., 1994, “Risk and Insurance in a Rural Credit Market: An Empirical Investigation in Northern Nigeria.” The Review of Economic Studies. Vol. 61, 495-526. World Bank/Regional Program on Enterprise Development (RPED).,1993, “Case Studies of Enterprise Finance in Ghana.” Final Report, Washington, D.C.

47
47