small business adoption of emv technology
TRANSCRIPT

Small Business Adoption of EMV Technology
May, 2015
§ Research was completed online among owners/managers of U.S. small businesses that accept credit cards at storefront/physical locations or via mobile swipers.
§ A total of 504 interviews were completed.
§ Interviewing was conducted by Ebiquity between April 22-27, 2015.
§ The overall results have a margin of error of +/- 4.4 percentage points at the 95% level of confidence.
Research Method
2
Key Takeaways
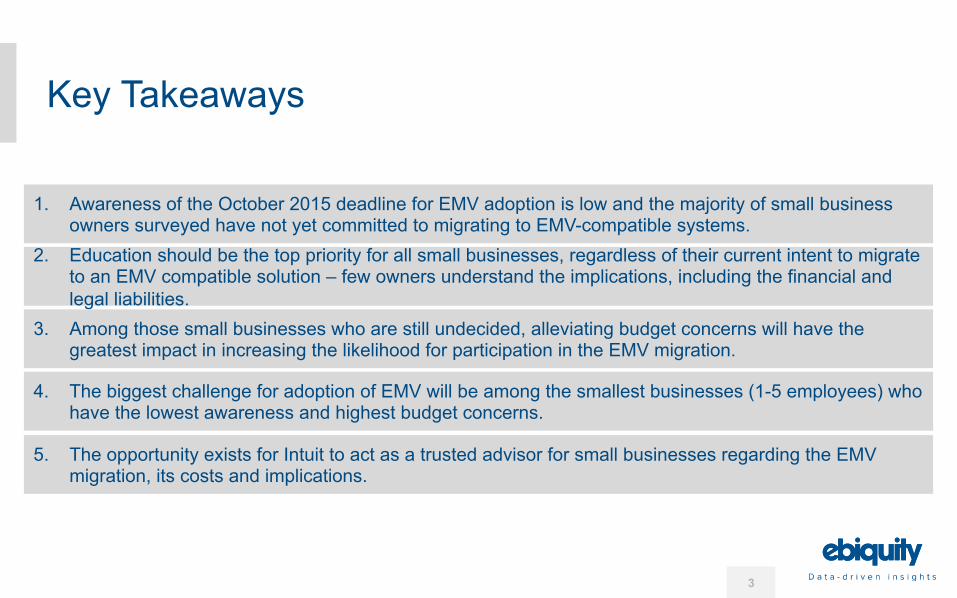
1. Awareness of the October 2015 deadline for EMV adoption is low and the majority of small business owners surveyed have not yet committed to migrating to EMV-compatible systems.
2. Education should be the top priority for all small businesses, regardless of their current intent to migrate to an EMV compatible solution – few owners understand the implications, including the financial and legal liabilities.
3. Among those small businesses who are still undecided, alleviating budget concerns will have the greatest impact in increasing the likelihood for participation in the EMV migration.
4. The biggest challenge for adoption of EMV will be among the smallest businesses (1-5 employees) who have the lowest awareness and highest budget concerns.
5. The opportunity exists for Intuit to act as a trusted advisor for small businesses regarding the EMV migration, its costs and implications.
3
CARD PAYMENT TRANSACTIONS AMONG SMALL BUSINESSES
Card payments account for a significant portion of annual sales for many small businesses
10%
11%
29%
31%
19%
0% 5% 10% 15% 20% 25% 30% 35%
Not Sure
Over 80%
61%-80%
31%-60%
1%-30%
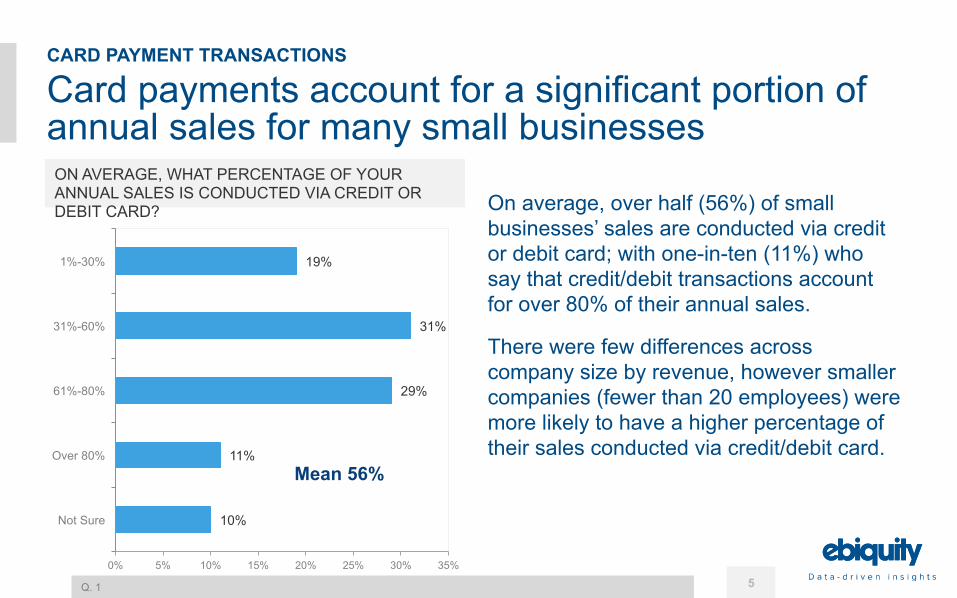
On average, over half (56%) of small businesses’ sales are conducted via credit or debit card; with one-in-ten (11%) who say that credit/debit transactions account for over 80% of their annual sales.
There were few differences across company size by revenue, however smaller companies (fewer than 20 employees) were more likely to have a higher percentage of their sales conducted via credit/debit card.
ON AVERAGE, WHAT PERCENTAGE OF YOUR ANNUAL SALES IS CONDUCTED VIA CREDIT OR DEBIT CARD?
Q. 1 5
CARD PAYMENT TRANSACTIONS
Mean 56%

There is generally a lag time of 1 – 3 business days after a card transaction before businesses have access to funds
3%
4%
14%
37%
42%
0% 5% 10% 15% 20% 25% 30% 35% 40% 45%
5+ business days
4-5 business days
3-4 business days
2-3 business days
1-2 business days
According to the small businesses surveyed, on average it takes 2 business days for credit / debit card transactions to be deposited into their bank accounts.
Over one-third (37%) of small businesses surveyed wait a maximum of 3 business days for card transactions to be posted to their account.
WHEN YOU MAKE A SALES TRANSACTION USING A CREDIT OR DEBIT CARD, ON AVERAGE, HOW LONG DOES IT TAKE FOR IT TO BE DEPOSITED TO YOUR BANK ACCOUNT?
Q. 2 6
CARD PAYMENT TRANSACTIONS
Mean: 2 business days

The majority of small businesses surveyed utilize card payment systems that will be impacted by EMV
42%
44%
66%
0% 10% 20% 30% 40% 50% 60% 70%
Online payment processor (e.g., PayPal, Google Checkout, etc.)
Mobile card reader (e.g., Square)
Desktop / countertop card terminal
Two-thirds (66%) of small businesses surveyed utilize card terminals to process payments.
• Businesses that use POS terminals are more likely to be larger in terms of employee size (75% of companies with 6+ employees and 74% of those with $250K+ in revenue)
A similar proportion of small businesses use mobile readers (44%) and / or online card payment processors (42%).
HOW DO YOU PROCESS YOUR CUSTOMERS’ CREDIT / DEBIT CARD PAYMENTS?
Q. 7 7
CARD PAYMENT TRANSACTIONS
Businesses and their customers both benefit from offering card payment options
33%
41%
47%
49%
54%
58%
0% 10% 20% 30% 40% 50% 60% 70%
I use it as a way to take deposits from my customers
I don't have to wait in bank lines to deposit cash or checks
Less potential for mishandling of cash
I don't lose sales when people don't have enough cash to buy my
product or service
I know that the payment will go through
People tend to buy more when they can pay with credit card
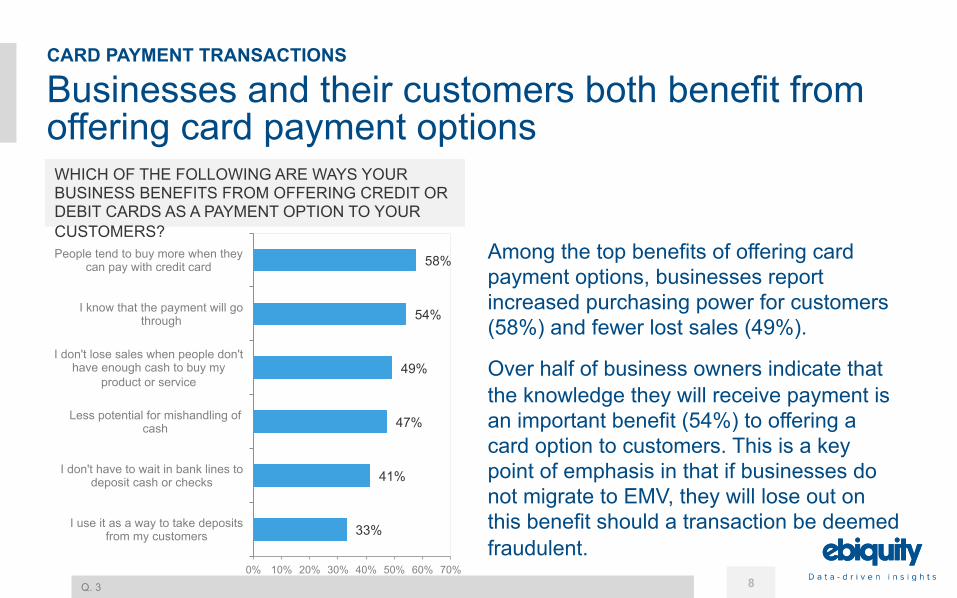
Among the top benefits of offering card payment options, businesses report increased purchasing power for customers (58%) and fewer lost sales (49%).
Over half of business owners indicate that the knowledge they will receive payment is an important benefit (54%) to offering a card option to customers. This is a key point of emphasis in that if businesses do not migrate to EMV, they will lose out on this benefit should a transaction be deemed fraudulent.
WHICH OF THE FOLLOWING ARE WAYS YOUR BUSINESS BENEFITS FROM OFFERING CREDIT OR DEBIT CARDS AS A PAYMENT OPTION TO YOUR CUSTOMERS?
Q. 3 8
CARD PAYMENT TRANSACTIONS
Most small businesses experience fraudulent activity related to credit/debit card sales transactions
21%
12%
13%
18%
37%
0% 5% 10% 15% 20% 25% 30% 35% 40%
Not sure
Over 10%
3%-10%
1%-2%
0%
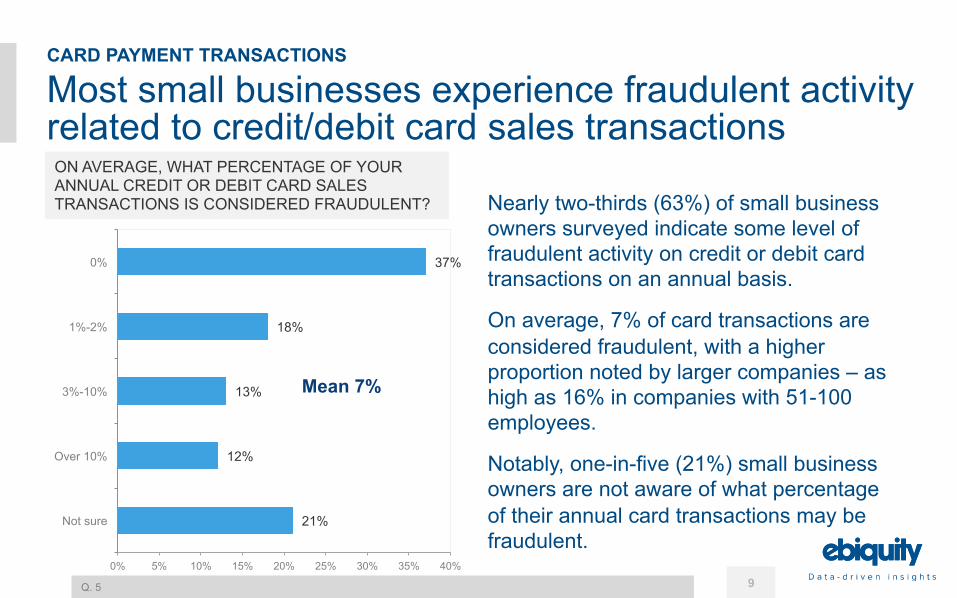
Nearly two-thirds (63%) of small business owners surveyed indicate some level of fraudulent activity on credit or debit card transactions on an annual basis.
On average, 7% of card transactions are considered fraudulent, with a higher proportion noted by larger companies – as high as 16% in companies with 51-100 employees.
Notably, one-in-five (21%) small business owners are not aware of what percentage of their annual card transactions may be fraudulent.
ON AVERAGE, WHAT PERCENTAGE OF YOUR ANNUAL CREDIT OR DEBIT CARD SALES TRANSACTIONS IS CONSIDERED FRAUDULENT?
Q. 5 9
CARD PAYMENT TRANSACTIONS
Mean 7%

The most common form of card fraud is expired credit or debit cards
14%
10%
10%
14%
19%
33%
0% 5% 10% 15% 20% 25% 30% 35%
Some other fraud
Fraudulent credit/debit cards
Data breach/being hacked
Identity theft
Stolen credit/debit cards
Expired credit/debit cards
One-third (33%) of small business owners surveyed indicate expired credit / debit cards as the most common form of card fraud.
Stolen cards are mentioned as most common by one-in-five (19%), followed by identity theft (14%).
One-in-ten cite data breach/hacking or fraudulent cards, respectively, as the most common form of fraud they face.
WHAT IS THE MOST COMMON FORM OF CARD FRAUD YOU FACE?
Q. 6 10
CARD PAYMENT TRANSACTIONS

On average, most small businesses are spending less than $200 annually on maintaining their POS systems
Seven-in-ten (70%) small businesses spend less than $200 per year on their POS system, including upgrades, rental, maintenance and other fees/expenses. The average annual spend is $189.
Smaller businesses – those with 5 employees or less – are most likely to be spending the least, two-thirds (65%) spend less than $100 per year.
Businesses with more employees and higher revenues tend to spend more – over $220 on average.
ON AVERAGE, HOW MUCH MONEY DO YOU SPEND ON YOUR POS SYSTEMS ANNUALLY INCLUDING UPGRADES, RENTAL FEES, MAINTENANCE, ETC.?
Q. 8
Under $50, 22%
$50 but less than
$100, 22%
$100 but less than
$200, 26%
$200 but less than
$500, 15%
$500 or more, 14%
11
CARD PAYMENT TRANSACTIONS
Mean: $189

Small businesses surveyed are generally receptive to a new payment solution that would significantly reduce card fraud
15%
6%
27%
11%
42%
0% 20% 40% 60% 80% 100%
It depends on how difficult it would be to upgrade my
equipment
No, I don't have the time to research a new payment
solution
No, my business is too small to justify the expense of installing
new equipment
Yes, if it helped me get paid faster
Yes, I would update my POS system if it's within my budget
Over half (53%) of small business would accept a new payment solution that would significantly reduce the probability of credit/debit card fraud.
Ensuring the POS update is within budget is the main concern (42%) among those who would change systems and expense (27%) is the biggest barrier for those who would not consider the solution.
Smaller companies are significantly less likely to consider the update, mostly due to budget (46% of companies with 1-5 employees said they wouldn’t change).
IF THERE WAS A NEW PAYMENT SOLUTION THAT WOULD SIGNIFICANTLY REDUCE THE PROBABILITY OF CREDIT/DEBIT CARD FRAUD, BUT YOU HAD TO CHANGE YOUR POS SYSTEM, WOULD YOU ACCEPT THE NEW PAYMENT SOLUTION?
Q. 9
No: 33%
Yes: 53%
12
CARD PAYMENT TRANSACTIONS
The amount a business is willing to invest in a new POS solution to reduce fraud is dependent on company size
3%
7%
16%
24%
51%
0% 20% 40% 60% 80% 100%
$2,000 or more
$1,500 but less than $2,000
$1,000 but less than $1,500
$500 but less than $1,000
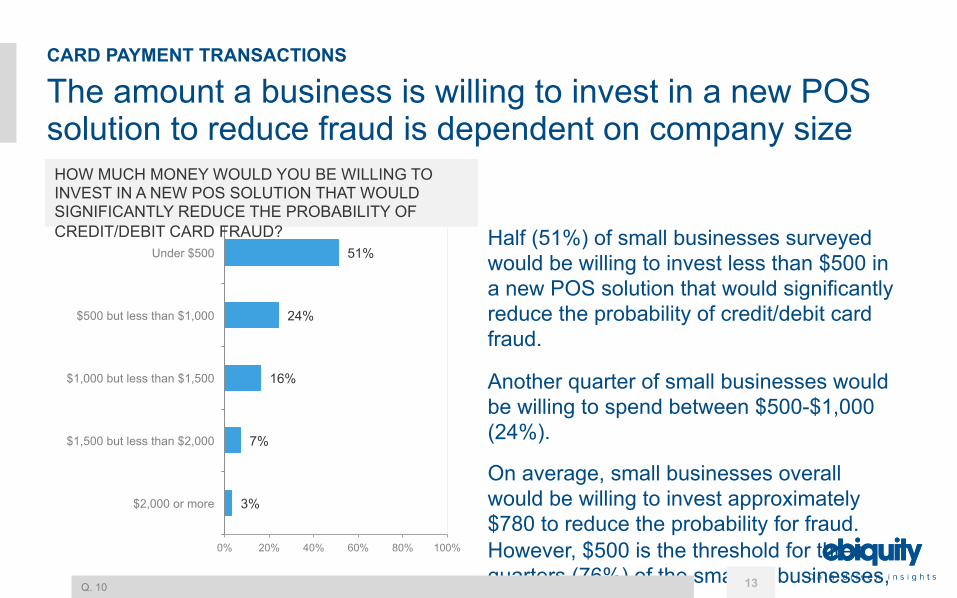
Under $500 Half (51%) of small businesses surveyed would be willing to invest less than $500 in a new POS solution that would significantly reduce the probability of credit/debit card fraud.
Another quarter of small businesses would be willing to spend between $500-$1,000 (24%).
On average, small businesses overall would be willing to invest approximately $780 to reduce the probability for fraud. However, $500 is the threshold for three quarters (76%) of the smallest businesses, 1-5 employees.
HOW MUCH MONEY WOULD YOU BE WILLING TO INVEST IN A NEW POS SOLUTION THAT WOULD SIGNIFICANTLY REDUCE THE PROBABILITY OF CREDIT/DEBIT CARD FRAUD?
Q. 10 13
CARD PAYMENT TRANSACTIONS

EMV technology addresses areas of highest importance to small businesses in accepting credit or debit cards
49%
51%
62%
67%
31%
37%
32%
24%
19%
12%
6%
9%
0% 10% 20% 30% 40% 50% 60% 70% 80% 90% 100%
Facilitate or increase online or mobile sales
Increasing the rate of payment
Ability to accept a wide range of credit or debit cards
Reducing card fraud
Very Important Somewhat Important Not too/at all Important
IN ACCEPTING CREDIT OR DEBIT CARDS FOR PRODUCTS / SERVICES, HOW IMPORTANT ARE EACH OF THE FOLLOWING FOR YOUR BUSINESS?
Q.4 14
CARD PAYMENT TRANSACTIONS
According to small business owners surveyed, the area of greatest importance as it relates to accepting credit or debit cards in their business is reducing card fraud (67%, very important) – EMV’s primary goal.
EMV’s universal standards will also address the ability to accept a wide range of cards, another important area for small businesses (62%, very important).
Finally, increasing the rate of payment (51%) and online sales (49%) are very important to half of small businesses surveyed – two areas that will be addressed by EMV.

EMV AWARENESS & INTENT TO UPGRADE AMONG SMALL BUSINESSES

Most small businesses have some awareness of EMV cards
37%
20%
44%
0% 20% 40% 60% 80% 100%
I have not heard of EMV cards
I am very knowledgeable about EMV cards
I've heard of EMV cards, but don't know much about them
Nearly two-thirds (64%) of small business owners surveyed have heard of EMV cards, however only one-in-five (20%) consider themselves to be very knowledgeable.
Just over one-third (37%) of small business owners have not heard of EMV cards. This increases significantly among companies with 1-5 employees – over half (54%) have no awareness of EMV.
Seven-in-ten (70%) companies with revenues over $250K are aware of EMV.
HOW KNOWLEDGEABLE WOULD YOU SAY YOU ARE ABOUT EMV CARDS?
Q. 11
Aware of EMV 64%
16
EMV AWARENESS & INTENT TO UPGRADE

Fewer small business owners are aware of the requirement to migrate to EMV solutions
Just over half (52%) of small business owners surveyed are aware of the requirement to migrate to EMV solutions in order to avoid financial and legal liabilities.
Six-in-ten (59%) of the smallest companies, 1-5 employees, are not aware of the requirement. Awareness is also low among companies with less than $250K in revenue and those in the North Central region (55% are not aware, respectively).
ARE YOU AWARE OF THE REQUIREMENT TO MIGRATE TO EMV (OR CHIP-ENABLED) SOLUTIONS IN ORDER TO AVOID FINANCIAL AND LEGAL LIABILITIES?
Q. 12
Yes, 52%
No, 48%
17
EMV AWARENESS & INTENT TO UPGRADE
Awareness of the October 2015 deadline for EMV adoption is low
42%
39%
19%
0% 20% 40% 60% 80% 100%
I have not heard of a deadline for adoption
I've heard there is a deadline, but I don't know when it is
I am aware of the deadline and know when it is
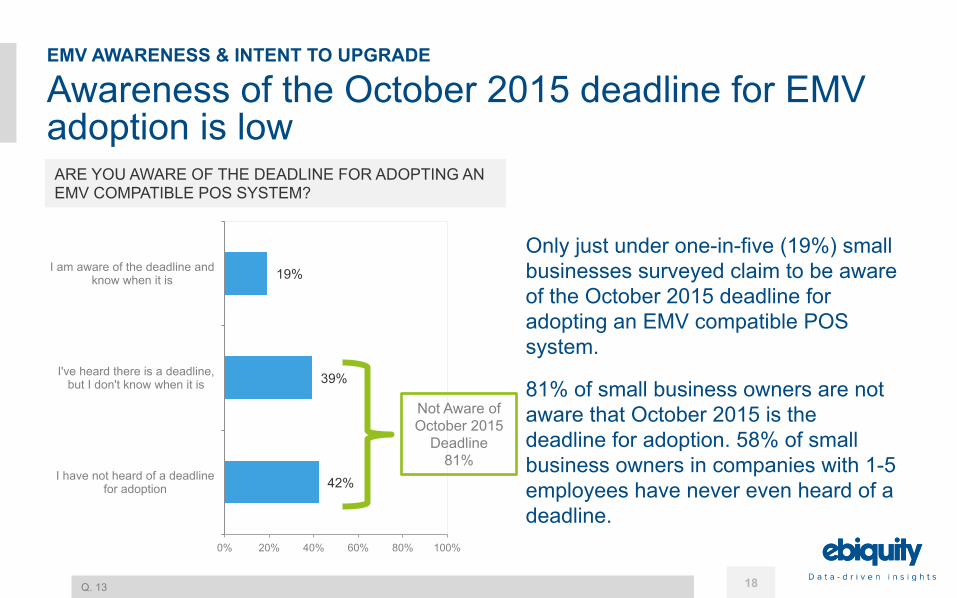
Only just under one-in-five (19%) small businesses surveyed claim to be aware of the October 2015 deadline for adopting an EMV compatible POS system.
81% of small business owners are not aware that October 2015 is the deadline for adoption. 58% of small business owners in companies with 1-5 employees have never even heard of a deadline.
ARE YOU AWARE OF THE DEADLINE FOR ADOPTING AN EMV COMPATIBLE POS SYSTEM?
Q. 13
Not Aware of October 2015
Deadline 81%
18
EMV AWARENESS & INTENT TO UPGRADE

Majority of small business owners surveyed have not committed to migrating to EMV-compatible systems
Just over two-in-five (42%) small business owners surveyed have committed to migrating to EMV-compatible systems. These are typically larger companies in terms of employee size and revenue.
One-in-ten (10%) overall do not intend to migrate.
That leaves nearly half (48%) of small businesses surveyed who remain undecided about whether they will make the switch by the October 2015 liability shift. This number rises to 62% among companies with 1-5 employees.
DO YOU PLAN TO MIGRATE TO EMV-COMPATIBLE SYSTEMS BY THE OCTOBER 2015 LIABILITY SHIFT?
Q. 14
Yes, I already have them, 14%
Yes, I am in the
process of
obtaining them, 28%
No, 10%
Not sure /
haven't decided
yet, 48%
19
EMV AWARENESS & INTENT TO UPGRADE

The biggest barriers to upgrading to become EMV-compliant include the cost of the new terminal and education
7%
2%
4%
15%
20%
27%
30%
32%
57%
0% 10% 20% 30% 40% 50% 60%
Some other reason
Do not have enough credit/debit card transactions to justify
Lack of awareness of the need for upgrade
The need to upgrade terminals in multiple locations
The need to train employees on new terminals
The need to educate customers who are unfamiliar with the procedure
The need for software upgrades
The lack of time/resources to research the terminals
The cost of the new terminal
Nearly six-in-ten (57%) small business owners surveyed who indicated they will not/have not decided to migrate to EMV cited the cost of the new terminal as the main reason not to comply.
The second most important reason that businesses cite for not choosing to upgrade is the lack of time and/or resources required to research the terminals (32%). Educating employees (20%) and consumers (27%) are also concerns.
Three-in-ten (30%) small business owners cite the need for software upgrades as a main reason not to upgrade.
WHICH OF THE FOLLOWING ARE THE MAIN REASONS YOU HAVE CHOSEN NOT TO/MIGHT CHOOSE NOT TO UPGRADE TO BECOME EMV COMPLIANT?
Q. 15 Base: Total Small Business Owners/Managers Who Will Not/Have Decided to Migrate to EMV (N=294) 20
EMV AWARENESS & INTENT TO UPGRADE

Businesses who have not made the commitment to migrate to EMV are largely unaware of the implications
85% of small business owners who will not migrate to an EMV compatible system or have not yet decided to do so are unaware of the financial and legal liabilities they will be responsible for.
ARE YOU AWARE OF THE FINANCIAL AND LEGAL LIABILITIES YOU’LL BE RESPONSIBLE FOR IF YOU DON’T MIGRATE TO AN EMV COMPATIBLE SYSTEM BY OCTOBER, 2015?
Q. 16 Base: Total Small Business Owners/Managers Who Will Not/Have Not Decided to Migrate to EMV (N=294)
Yes, 15%
No, 85%
21
EMV AWARENESS & INTENT TO UPGRADE

Most small businesses cannot handle the consequences that may result from not migrating to an EMV compatible system
Among small businesses who will not migrate to an EMV compatible system or are still undecided, the vast majority (86%) admit that they may not be able to handle the financial and legal liabilities of fraudulent card transactions.
IF YOU DON’T MIGRATE TO AN EMV COMPATIBLE SYSTEM YOU WILL BE HELD LIABLE FOR FRAUD CHARGES: IS YOUR BUSINESS ABLE TO HANDLE THE FINANCIAL AND LEGAL LIABILITIES OF FRAUDULENT CARD TRANSACTIONS?
Q. 17 Base: Total Small Business Owners/Managers Who Will Not/Have Not Decided to Migrate to EMV (N=294)
Yes, 14%
No, 50%
I'm not
sure, 36%
22
EMV AWARENESS & INTENT TO UPGRADE

Affordable options and easy set-up would most likely influence small businesses to migrate to EMV compatible systems
16%
26%
38%
38%
45%
54%
0% 10% 20% 30% 40% 50% 60%
Need to update POS terminal as part of general equipment refresh
Greater protection of customer data
More information on EMV compatible systems and its process
Consequences of financial and legal liabilities as a result of not migrating
Easy set-up and usage of EMV compatible systems
Affordable cost of EMV compatible systems
Over half of small business owners who will not migrate to an EMV compatible system or are still undecided say that making the cost affordable (54%) would influence their decision. Another key factor cited by nearly half is the easy set-up and usage of an EMV compatible system (45%).
Just under four-in-ten say that the consequences of financial and legal liabilities or getting more education on the system and its processes (each, 38%) might influence them to migrate.
WHAT WOULD INFLUENCE YOUR DECISION TO MIGRATE TO EMV COMPATIBLE SYSTEMS?
Q. 18 Base: Total Small Business Owners/Managers Who Will Not/Have Not Decided to Migrate to EMV (N=294) 23
EMV AWARENESS & INTENT TO UPGRADE

Small business owners are looking for information to help them better understand the migration of EMV cards
2%
33%
36%
41%
46%
52%
55%
0% 10% 20% 30% 40% 50% 60%
Some other information
Email newsletters
News articles
Video tutorials
Information from credit card issuers
Information from banks
Information from credit card processors
Small business owners are looking to card processors (55%), issuers (46%) and banks (52%) to give them more information to help them better understand EMV migration.
In particular, they would appreciate video tutorials (41%) to educate themselves on EMV.
WHAT KIND OF INFORMATION WOULD HELP YOU BETTER UNDERSTAND THE MIGRATION OF EMV CARDS?
Q. 21 24
EMV AWARENESS & INTENT TO UPGRADE
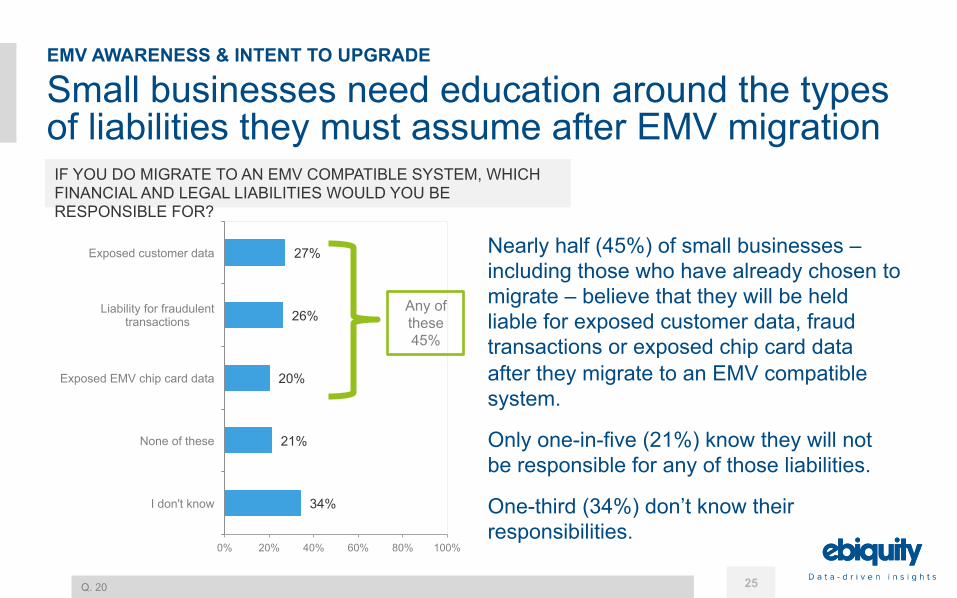
Small businesses need education around the types of liabilities they must assume after EMV migration
34%
21%
20%
26%
27%
0% 20% 40% 60% 80% 100%
I don't know
None of these
Exposed EMV chip card data
Liability for fraudulent transactions
Exposed customer data Nearly half (45%) of small businesses – including those who have already chosen to migrate – believe that they will be held liable for exposed customer data, fraud transactions or exposed chip card data after they migrate to an EMV compatible system.
Only one-in-five (21%) know they will not be responsible for any of those liabilities.
One-third (34%) don’t know their responsibilities.
IF YOU DO MIGRATE TO AN EMV COMPATIBLE SYSTEM, WHICH FINANCIAL AND LEGAL LIABILITIES WOULD YOU BE RESPONSIBLE FOR?
Q. 20
Any of these 45%
25
EMV AWARENESS & INTENT TO UPGRADE

Education is also needed on the potential for fraud to move to CNP channels after EMV migration
16%
43%
17%
23%
0%
5%
10%
15%
20%
25%
30%
35%
40%
45%
50%
I would expect MORE card
fraud
I would expect LESS card
fraud
I would expect the SAME
amount of card fraud
I don't know
Greater than two-in-five (43%) small business owners expect LESS card fraud in card-not-present (CNP) channels such as online, phone, mail or fax, after migration to an EMV compatible system.
23% report that they do not know the impact EMV migration may have on fraudulent CNP transactions.
Among those who already intend to upgrade, 26% know to expect MORE card fraud in CNP channels, however 49% expect LESS.
IF YOU MIGRATE TO AN EMV COMPATIBLE SYSTEM, HOW DO YOU THINK THAT WILL IMPACT THE NUMBER OF FRAUDULENT TRANSACTIONS ONLINE, VIA PHONE, MAIL OR FAX FOR YOUR BUSINESS?
Q. 19 Base: Small Business Owners Who Accept Cards by Phone, Fax, Mail or Online (n=436) 26
EMV AWARENESS & INTENT TO UPGRADE

APPENDIX: RESPONDENT PROFILES
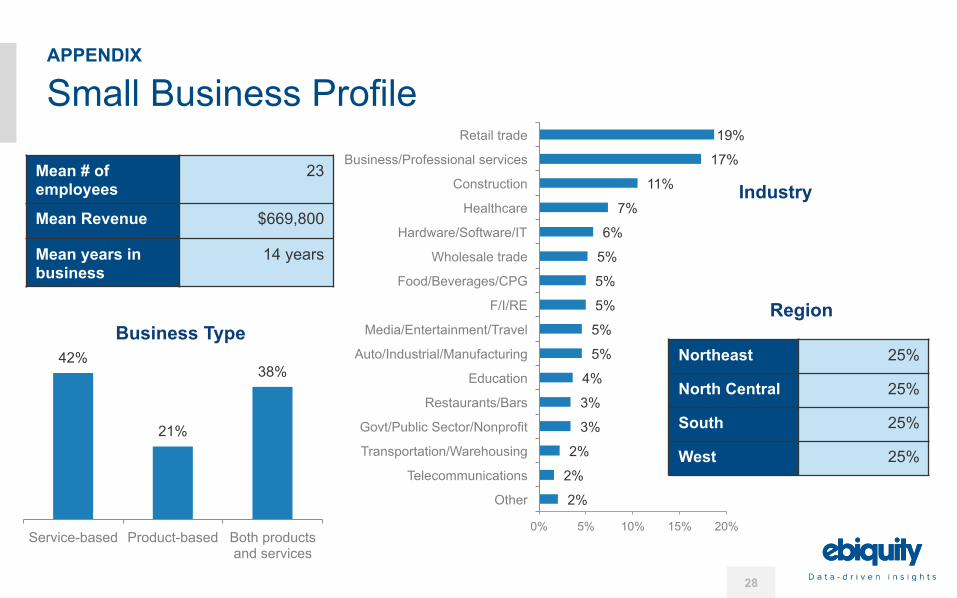
Small Business Profile
Mean # of employees
23
Mean Revenue $669,800
Mean years in business
14 years
42%
21%
38%
Service-based Product-based Both products and services
Business Type
2%
2%
2%
3%
3%
4%
5%
5%
5%
5%
5%
6%
7%
11%
17%
19%
0% 5% 10% 15% 20%
Other
Telecommunications
Transportation/Warehousing
Govt/Public Sector/Nonprofit
Restaurants/Bars
Education
Auto/Industrial/Manufacturing
Media/Entertainment/Travel
F/I/RE
Food/Beverages/CPG
Wholesale trade
Hardware/Software/IT
Healthcare
Construction
Business/Professional services
Retail trade
Industry
Northeast 25%
North Central 25%
South 25%
West 25%
28
APPENDIX
Region

Small Business Payments Profile
1%
6%
35%
76%
88%
79%
94%
0% 20% 40% 60% 80% 100%
Online payment processor/PayPal
Emerging payments (e.g., Bitcoin)
Mobile payments (e.g., Apple Pay, Google Pay, Samsung
Pay)
Check
Cash
Debit cards
Credit cards
Payments Accepted
In-person 94%
Mobile 43%
Online 65%
Phone 54%
Fax or mail
22%
29
APPENDIX
7%
8%
23%
35%
27%
32%
16%
21%
23%
0% 5% 10% 15% 20% 25% 30% 35% 40%
Over 80%
61%-80%
31%-60%
1%-30%
0%
In-person
Online
Debit/Credit Card Channels Percent of
Annual Sales Conducted
On average, 8% of annual online
sales are fraudulent.

Respondent Profile
Male, 57%
Female, 43%
9%
31% 24%
36%
0%
10%
20%
30%
40%
50%
60%
70%
80%
90%
100%
Under 30 30 - 40 41 - 50 Over 50
Age
Gender
Owner, 65%
Role
30
APPENDIX
Manager, 35%

JENNIFER CLARK T: +1 646 998 7248 F: +1 646 998 7277 E: [email protected] EBIQUITY US Office 156 Fifth Avenue, Suite 604 New York, NY 10010