small-angle scattering by cellulose · 2019-10-17 · small-angle scattering by cellulose...
TRANSCRIPT

Delft University of Technology
Small-Angle Scattering by CelluloseStructural changes in cellulosic materials under chemical and mechanical treatmentsVelichko, Evgenii
DOI10.4233/uuid:5383f365-fd5d-47ff-8826-e4d557c6e082Publication date2019Document VersionFinal published version
Citation (APA)Velichko, E. (2019). Small-Angle Scattering by Cellulose: Structural changes in cellulosic materials underchemical and mechanical treatments. Ipskamp Drukkers. https://doi.org/10.4233/uuid:5383f365-fd5d-47ff-8826-e4d557c6e082
Important noteTo cite this publication, please use the final published version (if applicable).Please check the document version above.
CopyrightOther than for strictly personal use, it is not permitted to download, forward or distribute the text or part of it, without the consentof the author(s) and/or copyright holder(s), unless the work is under an open content license such as Creative Commons.
Takedown policyPlease contact us and provide details if you believe this document breaches copyrights.We will remove access to the work immediately and investigate your claim.
This work is downloaded from Delft University of Technology.For technical reasons the number of authors shown on this cover page is limited to a maximum of 10.

SMALL-ANGLE SCATTERING BY CELLULOSE
STRUCTURAL CHANGES IN CELLULOSIC MATERIALS UNDERCHEMICAL AND MECHANICAL TREATMENTS


SMALL-ANGLE SCATTERING BY CELLULOSE
STRUCTURAL CHANGES IN CELLULOSIC MATERIALS UNDERCHEMICAL AND MECHANICAL TREATMENTS
Proefschrift
ter verkrijging van de graad van doctoraan de Technische Universiteit Delft,
op gezag van de Rector Magnificus prof. dr. ir. T. H. J. J. van der Hagen,voorzitter van het College voor Promoties,
in het openbaar te verdedigen op woensdag 16 oktober 2019 om 12:30 uur
door
Evgenii VELICHKO
Master of Science in Chemistry,Ural Federal University, Yekaterinburg, Russia,
geboren te Nizhny Tagil, Sovjet-Unie.

Dit proefschrift is goedgekeurd door de promotoren.
Samenstelling promotiecommissie:
Rector Magnificus, voorzitterProf. dr. C. Pappas, Technische Universiteit Delft, promotorDr. W. G. Bouwman, Technische Universiteit Delft, copromotor
Onafhankelijke leden:Prof. dr. S. J. Picken Technische Universiteit DelftProf. dr. J. van Duynhoven
Wageningen University and ResearchProf. dr. E. van der Linden
Wageningen University and ResearchDr. M. Schooneveld-Bergmans
DSM Biotechnology CenterDr. A. Petoukhov Universiteit UtrechtProf. dr. E. H. Brück Technische Universiteit Delft, reservelid
This work is part of the research program Open Technology with project number 13386which is financed by the Netherlands Organization for Scientific Research (NWO).
Keywords: Cellulose, mesostructure, SAXS, SANS
Printed by: Ipskamp Printing
Front & Back: . . .
Copyright © 2019 by E. Velichko
ISBN/EAN 978-94-028-1720-1
An electronic version of this dissertation is available athttp://repository.tudelft.nl/.

Give me six hours to chop down a tree andI will spend the first four sharpening the axe
Abraham Lincoln
The world will not be destroyed by those who do evil,but by those who watch them without doing anything.
Albert Einstein


CONTENTS
Propositions ix
Stellingen xi
Foreword xiii
1 Introduction 11.1 Cellulose as a renewable polymer material . . . . . . . . . . . . . . . . . 2
1.1.1 Lignocellulosic biomass . . . . . . . . . . . . . . . . . . . . . . . 21.1.2 Microfibrillated cellulose . . . . . . . . . . . . . . . . . . . . . . 4
References . . . . . . . . . . . . . . . . . . . . . . . . . . . . . . . . . . . . 6
2 Effects of dilute acid pretreatment on the structure of poplar biomass 132.1 Introduction . . . . . . . . . . . . . . . . . . . . . . . . . . . . . . . . 142.2 Materials and methods . . . . . . . . . . . . . . . . . . . . . . . . . . . 15
2.2.1 Materials and pretreatment . . . . . . . . . . . . . . . . . . . . . 152.2.2 Feedstock composition . . . . . . . . . . . . . . . . . . . . . . . 152.2.3 Microscopy . . . . . . . . . . . . . . . . . . . . . . . . . . . . . 152.2.4 X-ray diffraction analysis. . . . . . . . . . . . . . . . . . . . . . . 152.2.5 Small Angle X-ray Scattering (SAXS) . . . . . . . . . . . . . . . . . 162.2.6 SAXS data analysis . . . . . . . . . . . . . . . . . . . . . . . . . . 162.2.7 Surface area . . . . . . . . . . . . . . . . . . . . . . . . . . . . . 172.2.8 Glucose release . . . . . . . . . . . . . . . . . . . . . . . . . . . 17
2.3 Results . . . . . . . . . . . . . . . . . . . . . . . . . . . . . . . . . . . 182.3.1 Feedstock composition . . . . . . . . . . . . . . . . . . . . . . . 182.3.2 Microscopy . . . . . . . . . . . . . . . . . . . . . . . . . . . . . 182.3.3 X-ray diffraction analysis. . . . . . . . . . . . . . . . . . . . . . . 192.3.4 Small Angle X-ray Scattering (SAXS) . . . . . . . . . . . . . . . . . 222.3.5 Specific surface area . . . . . . . . . . . . . . . . . . . . . . . . . 222.3.6 Glucose release . . . . . . . . . . . . . . . . . . . . . . . . . . . 22
2.4 Discussion . . . . . . . . . . . . . . . . . . . . . . . . . . . . . . . . . 242.5 Conclusions. . . . . . . . . . . . . . . . . . . . . . . . . . . . . . . . . 26References . . . . . . . . . . . . . . . . . . . . . . . . . . . . . . . . . . . . 26
3 A versatile shear cell for investigation of structure of food materials undershear 333.1 Introduction . . . . . . . . . . . . . . . . . . . . . . . . . . . . . . . . 34
3.1.1 Fit for neutrons and X-rays. . . . . . . . . . . . . . . . . . . . . . 373.1.2 Shear-SAS cell geometries . . . . . . . . . . . . . . . . . . . . . . 373.1.3 Temperature control . . . . . . . . . . . . . . . . . . . . . . . . . 40
vii

viii CONTENTS
3.2 Experimental results and discussion . . . . . . . . . . . . . . . . . . . . 403.2.1 X-rays: microfibrillated cellulose dispersions . . . . . . . . . . . . 403.2.2 X-rays: in situ view on fat crystal network formation . . . . . . . . . 413.2.3 Neutrons: protein dispersions . . . . . . . . . . . . . . . . . . . . 43
3.3 Conclusions. . . . . . . . . . . . . . . . . . . . . . . . . . . . . . . . . 43References . . . . . . . . . . . . . . . . . . . . . . . . . . . . . . . . . . . . 433.4 Supplementary information . . . . . . . . . . . . . . . . . . . . . . . . 49
4 Structure and stability of microfibrillated citrus fiber under shear 534.1 Introduction . . . . . . . . . . . . . . . . . . . . . . . . . . . . . . . . 544.2 Materials and methods . . . . . . . . . . . . . . . . . . . . . . . . . . . 55
4.2.1 Materials . . . . . . . . . . . . . . . . . . . . . . . . . . . . . . . 554.2.2 SAXS . . . . . . . . . . . . . . . . . . . . . . . . . . . . . . . . . 554.2.3 Rheology . . . . . . . . . . . . . . . . . . . . . . . . . . . . . . . 564.2.4 Rheo-MRI . . . . . . . . . . . . . . . . . . . . . . . . . . . . . . 564.2.5 Shear-SAXS . . . . . . . . . . . . . . . . . . . . . . . . . . . . . 56
4.3 Results and discussion . . . . . . . . . . . . . . . . . . . . . . . . . . . 574.3.1 Structural changes in citrus fiber suspensions due to high pressure
homogenization . . . . . . . . . . . . . . . . . . . . . . . . . . . 574.3.2 Impact of low shear on stability of microfibrillated citrus fiber . . . . 58
4.4 Conclusions. . . . . . . . . . . . . . . . . . . . . . . . . . . . . . . . . 69References . . . . . . . . . . . . . . . . . . . . . . . . . . . . . . . . . . . . 69
5 Mesostructure of bacterial cellulose from nata de coco and from the lab withand without deuteration studied by SANS 735.1 Introduction . . . . . . . . . . . . . . . . . . . . . . . . . . . . . . . . 745.2 Materials and methods . . . . . . . . . . . . . . . . . . . . . . . . . . . 75
5.2.1 Materials . . . . . . . . . . . . . . . . . . . . . . . . . . . . . . . 755.2.2 SANS. . . . . . . . . . . . . . . . . . . . . . . . . . . . . . . . . 75
5.3 Results and discussion . . . . . . . . . . . . . . . . . . . . . . . . . . . 765.3.1 Comparison of mesostructure of bacterial cellulose from nata de
coco and the lab . . . . . . . . . . . . . . . . . . . . . . . . . . . 765.3.2 Deuterated cellulose . . . . . . . . . . . . . . . . . . . . . . . . . 78
5.4 Conclusions. . . . . . . . . . . . . . . . . . . . . . . . . . . . . . . . . 78References . . . . . . . . . . . . . . . . . . . . . . . . . . . . . . . . . . . . 78
Summary 83
Samenvatting 85
Краткое изложение 87
Acknowledgements 89
Curriculum Vitæ 91
List of Publications 93

PROPOSTIONS
1. In order to understand the multi-level hierarchical structure of cellulose one hasto apply a broad range of research techniques.
2. Even measured in a limited range of momentum transfers, small-angle scatteringof X-rays can provide a good indication for the specific surface area of the materialunder investigation.
3. A possibility to use the same sample environment for both neutron and X-ray ex-periments can substantially improve the reproducibility of the experiments.
4. In contrast to microcrystalline cellulose, a microfibrillated one does not align un-der shear rates below 300 s−1.
5. The internal structure of microfibrillated citrus fiber flocs under shear rates below300 s−1 at 20C and atmospheric pressure can be considered constant.
6. Stable suspensions with a constant structure in a broad range of experimental con-ditions might be good for the final application, but incredibly boring to investigate.
7. The life of a PhD candidate is guided by the Pareto principle and steered by Mur-phy’s law.
8. Obtaining a PhD degree is a lot like a marathon: you have to spread your resourcesfor the whole distance; there is a finish line, but you don’t see it most of the time;the last 20% of the distance is as hard as the first 80; and it is a very lonely journey.
9. Success in teaching new tricks to old cats does not justify the necessary investmentof time and energy.
10. The most important relationship in one’s life is the relationship with oneself.
ix


STELLINGEN
1. Om de hiërarchische structuur op meerdere niveaus van cellulose te begrijpen,moet men een breed scala aan onderzoekstechnieken toepassen.
2. Zelfs als de metingen een klein bereik van het mogelijke momentumoverdrachtbeslaan, kan kleine hoek Röntgenverstrooiing een goede indicatie geven voor hetspecifieke oppervlak van het onderzochte materiaal.
3. Een mogelijkheid om dezelfde monsteromgeving te gebruiken voor zowel neutronen-als Röntgenexperimenten kan de reproduceerbaarheid van de experimenten aan-zienlijk verbeteren.
4. In tegenstelling tot microkristallijne cellulose, lijnt een microgefibrilleerde cellu-lose niet uit onder afschuifsnelheden van minder dan 300 s−1.
5. De interne structuur van microgefibrilleerde citrusvezelvlokken onder afschuif-snelheden van minder dan 300 s−1 bij 20 C en atmosferische druk kan als con-stant worden beschouwd.
6. Stabiele suspensies met een constante structuur in een breed gebied van experi-mentele omstandigheden kunnen goed zijn voor de uiteindelijke toepassing, maarzijn ongelooflijk saai om te onderzoeken.
7. Het leven van een promovendus wordt geleid door het Pareto-principe en gestuurddoor de wet van Murphy.
8. Het behalen van een doctoraat is vergelijkbaar met een marathon: je moet je mid-delen over de hele afstand spreiden; er is een finishlijn, maar die zie je meestalniet; de laatste 20% van de afstand is even moeilijk als de eerste 80; en het is eenzeer eenzame reis.
9. Het succes in het aanleren van nieuwe trucen aan oude katten is geen rechtvaar-diging voor de noodzakelijke investering van tijd en energie.
10. De belangrijkste relatie in je leven is de relatie met jezelf.
xi


FOREWORD
We live in a strange world, where children must sacrifice their own educationin order to protest against the destruction of their future
Greta Thunberg
History repeats itself. Any innovation goes through stages of pre-contemplation,contemplation, preparation, action, maintenance, relapse and back to pre-contemplation.In favorable circumstances, the innovation leads to improvement and the spiral pro-gresses upward. Most of the time is spent in the pre-contemplation stage when every-thing seems fine and no problems hinder the horizon. The time necessary for the restof the stages depends on the severity of the problem and desire to solve it. The fastestturns of the spiral were made in the most dramatic times of crisis, such as war. In suchcircumstances, nations seem to be able to mobilize most of their resources to solve theproblem.
It is well scientifically established and proven that climate changes adversely and thechange accelerated dramatically in the last century. The source of the change is also wellestablished and agreed upon. However, little progress has been made in resolving theproblem. Moreover, some of the contributors to greenhouse gas emissions are simplydenying the facts, pretending the problem does not exist, and even aggravating the issue.
Mankind is capable of great accomplishments. However, it is important to keep inmind that mankind consist of individuals, and most of the accomplishments are due tothe compound effect. It is, therefore, up to everyone to take an individual bit of respon-sibility and to contribute one’s mite to the solution of climate change. Some examplesof such individual contributions could be reductions in meat consumption, disposablecutlery, and plastic bags, and use of bicycle instead of cars for personal transportationup to 10 km.
The manuscript you read is another example of such a contribution. In the course offour years, the author had studied various kinds of cellulose and had become convincedthat cellulose can and should be one of the major components of modern energy andmaterials mixes. The main intent of this book is to inspire the reader to step on the routetowards a sustainable future and make a feasible contribution into achieving this goal.Although, with low probability, a butterfly can extinguish the fire.
Evgenii VelichkoDelft, October 2019
xiii


1INTRODUCTION
T HE ever–increasing world population demands an even faster increase in materialsand energy production [1]. This demand not only rapidly diminishes the natural
resources of our planet, but also leads to some adversary changes in our environment,such as global warming. Fossilized organic materials, used for production of lubricants,plastics, robbers, and fuels, can be exhausted in just over a century from now [2]. How-ever, the scarcity of resources is not quite as dangerous as potential environmental dam-age of their accelerated consumption.
A comprehensive study of Arctic climate [3] clearly shows worldwide implications ofthe Arctic warming: glacial melt leads to rising sea level and slowing ocean circulation;increasing sea levels lead to increased exposure of coastal communities to storms andfloods; a shift in vegetation zones caused by global warming is likely to cause increase infrequency, severity, and duration of forest fires.
Global problems require global solutions. Therefore, in 2016 in Paris 195 memberstates of the United Nations signed an agreement aimed at keeping the global averagetemperature increase below 2C above pre-industrial levels. Under the agreement, eachcountry must define and reach individual goal contributing towards the common aim ofconfinement of climate change.
Although every agreement participant can define their own route and means to con-quer it, some basic requirements are common for everyone. It is clear, that the amountof greenhouse gases released into the atmosphere should be substantially decreased.Such decrease requires a fundamentally new approach to energy generation, recycling,and management of resources. Renewable sources of energy and chemicals will play animportant role in such a new approach [4–8].
Biomass is one of the most obvious and abundant renewable resources [6]. Everyyear we can see fresh leaves and grass growing in the spring and dying out in the fall toform a nourishing substrate for the next generation. One of the main components ofbiomass is cellulose – a biopolymer responsible for mechanical properties and protec-tion of plants from the environment. Let us consider this remarkable material in moredetail in the following sections.
1

1
2 1. INTRODUCTION
1.1. CELLULOSE AS A RENEWABLE POLYMER MATERIALCellulose is the most abundant biopolymer on our planet. About 1010 to 1011t of cel-lulose is produced globally every year[9]. Less than a tenth part of it is used by paper,textile, material and chemical industries [10]. Since its discovery in 1838 by Payen, phys-ical and chemical characteristics of cellulose were thoroughly investigated [11].
On the molecular level, cellulose is a linear homopolysaccharide ofβ-1.4-linked anhydro-D-glucose units[12, 13] with a degree of polymerization varying between approximately10000 and 15000 [9]. Due to the presence of hydroxyl groups in each monomer, cellulosechains tend to agglomerate already during the synthesis process and form elementaryfibrils with alternating crystalline and amorphous regions along the cellulose chain [12].
The crystalline parts of cellulose exist in four different polymorph forms: cellulose I,II, III and IV. In nature native cellulose if found in form I with two allomorphs, Iα and Iβ.After re-crystallization or mercerization of the cellulose I with aqueous sodium hydrox-ide, one obtains cellulose II, also known as regenerated cellulose. It is the most stablecrystalline form of cellulose [13]. By ammonia treatment of cellulose I or II, one arrivesto cellulose IIII or IIII I , respectively. With the glycerol treatment of cellulose III one canproduce cellulose IV.
The elementary fibrils of cellulose consist of about 36 individual cellulose macro-molecules [12] and are about 5 nm in diameter. Agglomeration of the elementary fibrilsduring biosynthesis of cellulose leads to the formation of larger units called microfibril-lated cellulose, which have diameters in the range of 20 to 50 nm. The micrifibrillatedcellulose, in turn, agglomerates further to form cellulose fibers with the diameters in themicrometer domain.
Cellulose can be produced by plants [14], algae [15] and bacteria [16]. In plants andalgae, cellulose is present in the walls of individual cells and is responsible for the plant’sgrowth and form. In the case of bacteria, cellulose does not form a part of the organ-ism but is extracted as a waste product. As a result of this difference in function, plantand algal cellulose is usually present in a highly agglomerated form mixed with severalother biopolymers. Bacterial cellulose, on the other hand, usually present in much lessaggregated state and pure of the other biopolymers.
Depending on the desired application, different forms of cellulose are required. Inour quest towards more sustainable sources of energy and materials, we will take a closerlook at two forms of cellulose, namely lignocellulosic biomass and microfibrillated cel-lulose.
1.1.1. LIGNOCELLULOSIC BIOMASSEnergy demand has more than doubled in the last decades and it is predicted to doubleonce more in the coming decades. Most of the energy consumed worldwide comes fromfossil fuels. Many alternatives to fossil fuels exist, including hydro, wind and solar energy.However, all of these alternatives generate energy only at the right environmental condi-tions and require batteries to store energy for the rest of the time. Biofuels, derived frombiomass, can easily be stored in ready to use form. Moreover, most of the existing infras-tructure and internal-combustion engines could be used with little to no modificationsfor biofuels.
First generation biofuels were known already in the 1880s when Henry Ford designed

1.1. CELLULOSE AS A RENEWABLE POLYMER MATERIAL
1
3
early model Ts that ran on "farm ethanol". The biofuels are based on crops such as sugarcane and corn. However, the appearance of petroleum-derived fuels (fossil fuels) inthe early twentieth century, has quickly changed the trend and fossil fuels dominatedthe market. It took the "oil crisis" of the 1970s for global leaders to realize the impor-tance of alternative energy sources. Thanks to the National Alcohol Program, whichstarted shortly after the crisis, Brazil has become the world leader in the developmentof bioethanol.
Ethanol has some advantages in comparison to gasoline, such as a higher octanenumber, leading to a superior net performance of the combustion engine running onethanol [17], and increased power outputs due to the high vapor pressure and heat ofvaporization. On the other hand, due to oxygen content, has about 33% less energythan gasoline [18]. Nevertheless, the vital advantage of ethanol is its small impact onthe environment[19] in comparison to the hazardous effects of fossil fuels [20].
However, the first generation biofuels are not sustainable in the long-run, as they re-quire fertile land and compete with traditional agriculture [21]. This competition alsodrives up the cost of raw materials, which can reach 40% of the bioethanol cost [22].Therefore, recent developments in biofuels have focused on the second generation ofbiofuels, which are nonfood materials available from plants, also known as lignocellu-losic biomass.
Lignocellulosic biomass is a cheap and abundant natural material, which can befound in the agricultural waste(wheat straw, corn stalks, soybean residues, sugar canebagasse), industrial waste (pulp and paper industry), forestry residues, municipal solidwaste, etc. [23]. According to Claassen et al. [24], lignocellulose accounts for about 50%of the annual production of biomass in the world (1−5 ·1011t), which could potentiallycover yearly global energy demand. However, the efficiency of lignocellulose conversioninto ethanol is still very low.
In order to turn bioethanol production into a sustainable process, one has to pay at-tention to various steps therein. The steps include synthesis of biomaterials, separationof valuable high-value chemicals from biomass feedstock, and generation of biofuelsfrom the feedstock [6]. The challenge in biomass production is the development of cropswith a suite of desirable physical and chemical traits while increasing biomass yields bya factor of 2 or more. One of the possible solutions would be to increase the initial cap-ture of light energy above the current level of 2%. It was achieved, for example by over-expressing of the cyanobacterial versions of rate-limiting enzymes in the chrloroplast’scarbon-fixing "dark reaction" in tobacco [25]. The experiment resulted in an elevatedphotosynthesis rate and increased plant dry weight. Another approach is to manipulatethe plant’s genes involved in nitrogen metabolism. Such an approach has led to a 41%increase in height of transgenetic poplar [26]. Genetic modification can also increase theplant’s resistance to adverse environmental conditions and pathogens [27].
Once the biomass is collected it has to be converted into valuable biofuels and bio-materials. This conversion consists of several steps, including separation, refining, andtransformation into chemicals and fuels. Firstly, high-value chemicals present in biomassshould be extracted, such as fragrances, flavoring agents, food-related products, andhigh-value nutraceuticals, providing health and medical benefits [28]. Next, the remain-ing biomass has to go through further separation and depolymerization to convert plant

1
4 1. INTRODUCTION
saccharides into feedstock for bio-derived materials and fuels. A range of solvents andconditions can be used for this purpose. Among them, supercritical CO2, near-criticalwater and gas-expanded liquids [29, 30].
Once the biomass is reduced to biopolymers and lignin, the biofuel production starts.The key challenge in the process is recalcitrance of lignocellulose, present on multiplelevels. Pretreatment of lignocellulosics is an important tool in facilitating the biomassconversion [31, 32]. A broad range of pretreatment techniques has been proposed forovercoming the recalcitrance and increasing the efficiency of biomass conversion [33].The methods include mechanical[34], thermal[35–37], and thermo-chemical[38–45]. Themethods have different working mechanisms and effect on various parameters of biomass[46, 47].
A deep understanding of the complex multi-level structure of biomass is necessaryto establish a connection between pretreatment parameters and the biomass conversionefficiency. In solving the puzzle, one has to take into account as many structural char-acteristics of biomass as possible. In doing so, it is important to observe the changes ina broad range of length-scales. It is why in this work we applied a broad range of exper-imental techniques to cover 7 orders of magnitude in length-scales, from Å up to mmscale.
1.1.2. MICROFIBRILLATED CELLULOSE
Another form of cellulosic materials studied in this work is microfibrillated cellulose(MFC). It can be obtained by high-pressure disintegration of cellulosic fibers into fib-rils [48, 49]. Quickly after its first description in 1983, it gained the attention of scientificcommunity due to some very peculiar properties, such as high theoretical strength andmodulus [50, 51], high surface area and water absorption [52], gelation at very low con-centrations [53, 54].
A broad range of potential applications is proposed for MFC, ranging from protec-tive coatings [55], and packaging [52] to food and cosmetics [56]. Most of the MFC-containing materials require shear conditions during preparation or application. Let usconsider an application of MFC in low-caloric foods, as was suggested by Turbak in hispioneering work [48]. In the food production process MFC has to be mixed with otheringredients, and in the consecutive consumption process the food being sheared in themouth and in the bowels of a consumer. In order to ascertain consistent and pleasantcustomer experience, the food producer has to ascertain the consistency of propertiesand performance of the product. This goal requires a deep understanding of the rheo-logical behavior of MFC.
Already at very low solid content, microfibrillated cellulose forms network structures.Nechyporchuc et al. [57] have applied oscillatory shear to investigate the viscoelasticproperties of TEMPO-oxidized MFC. They found that MFC suspensions remain stable atstrain values up to 1%, after which the elastic network is destroyed, which was observedin nonlinear behavior of the storage and loss moduli. Strength of the elastic networkwas found to be dependent on the production conditions of MFC [58, 59]. The strongernetwork was linked to the higher specific surface area and a higher degree of entangle-ments of cellulose microfibrils. Saarinen et al. [60] have shown that storage modulus ofmechanically disintegrated cellulose suspensions is inversely proportional to the degree

1.1. CELLULOSE AS A RENEWABLE POLYMER MATERIAL
1
5
of cellulose fibrillation. Moreover, Naderi and Linstrom [58] have shown that the net-work strength of the enzymatically pretreated suspensions increases with the severityof fibrillation conditions when a preshear protocol is applied followed by rest. Withoutpreshear the trend was reversed.
Independently of the way of production, all types of microfibrillated cellulose sus-pensions show shear-thinning behavior. Furthermore, the suspensions are thixotropic[61]. Due to these properties, the suspension properties are strongly time-dependentand the measurements should be performed at steady-state flow. Flow measurementswere applied to indicate the degree of fibrillation of MFC. Herrick et al. [49] have shownthe gradual increase of viscosity of mechanically fibrillated MFC with the increase inthe number of passes in a homogenizer. Similar results were obtained by other groups[55, 62].
Reduction in the pH from 10 to 2 has been shown to increase the viscosity of enzy-matically pretreated and disintegrated in a microfluidizer MFC suspensions [63]. Theeffect was explained by neutralization of the surface negative charge by protons and en-hancement of interfibrillar interactions. Increase in temperature leads to decrease inviscosity of MFC [49, 64]. Yet another parameter, i.e. concentration, was found to in-crease the viscosity [64–69]. In a number of studies, a hysteresis loop was observed uponincreasing-decreasing (or vice versa) of the shear rate [58, 64, 70]. This phenomenonwas associated with the formation and breakdown of shear-induced structures in MFCsuspensions.
In order to investigate those structures, Saarikoski et al.[71] and Karppinen et al. [72]have designed and applied a visualization setup based on a transparent Couette geome-try. They have shown the presence of flocs of cellulose fibrils in the MFC suspensions andtheir evolution into rolls elongated along the Couette height under low apparent shearrates. A flow of detached flocs with flow sizes proportional to the shear rate was conse-quently observed under high shear rates. Martoia et al. [73] also applied a visualizationapproach to investigate the flow behavior of MFC suspensions, produced employing ei-ther enzymatic pretreatment or TEMPO-mediated oxidation. These materials showedbehavior similar to described above: suspensions were in the form of floc chains (100-300µm), which split into individual flocs (< 100µm) with an increase of the shear rate.
Local flow properties of MFC suspensions were studied by combinations of flowmeasurements with an optical coherence tomography [74, 75], ultrasonic speckle ve-locimetry [73], and magnetic resonance imaging [76]. All of the measurements haveshown appearance of the flocculated flow of MFC with decreasing in the floc sizes asa result of increasing shear rate.
Although many peculiar properties of MFC were already discovered and explained,the system still holds several mysteries. Many of these mysteries appear in the nm - µmlength-scale domain. It is unknown how does the high-pressure homogenization affectthe structure and sizes of elementary fibrils of cellulose, or how crowded the neighbor-hood of a typical cellulose fibril is. Flocculation of microfibrillated cellulose under shearis fascinating by itself, but even more interesting is the internal arrangement of the flocksand its evolution with the shear. In order to tackle these questions, we have employedsmall-angle X-ray scattering technique to the investigation of the microfibrillated cellu-lose based on citrus fiber.
1
6 REFERENCES
SCOPE AND OUTLINE OF THE THESISBy applying small angle scattering of X-rays, the mesostructure of cellulose-based mate-rials has been investigated. The knowledge of structural changes happening in the ma-terial’s structure during different chemical and mechanical treatments promotes its sus-tainable applications. This thesis is focused on two types of cellulosic materials, namely,lignocellulosic biomass (poplar) and MFC based on citrus fiber.
Firstly, the complex hierarchical structure and recalcitrance of lignocellulose are dis-cussed in Chapter 2. A broad range of experimental techniques was applied to investi-gate changes happening to poplar biomass under acid pretreatment. The combinationof techniques covers 7 orders of magnitude in length-scales, ranging from Å up to mmscale, which allowed to indicate the key structural parameters responsible for the effi-ciency of biomass conversion.
The next two chapters discuss the connection between the mesostructure of mi-crofibrillated cellulose (MFC) and its rheological properties. In order to asses the mesostruc-ture of MFC under shear, a special flexible geometry shear-SAS cell was created. The celldesign and several applications are described in Chapter 3.
Chapter 4 describes an investigation of microfibrillated cellulose suspensions basedon citrus fiber by means of rheology, rheo-MRI, SAXS, and shear-SAXS. All of the ex-perimental results suggest that the materials are stable and consistent. Although floccu-lated flow is formed in the suspensions under shear, the process is completely reversible.Moreover, the flocs consist of randomly oriented intertwined microfibrils.
Chapter 5 describes an investigation of mesostructure of bacterial cellulose studiedby small-angle neutron scattering. It was found that mesostructure of hydrogenatedbacterial cellulose from different sources is very similar. However, deuteration of thecellulose leads to substantial changes in its mesostructure and rheological properties.
REFERENCES[1] V. Smil, Energy Transitions: Global and National Perspectives. (2017).
[2] BP, Statistical Review of World Energy, Tech. Rep. 65 (2016).
[3] ACIA, Impacts of a Warming Arctic - Arctic Climate Impact Assessment, edited byC. Symon (Cambridge University Press, Cambridge, UK, 2004) p. 144.
[4] R. J. P. Schmitt, N. Kittner, G. M. Kondolf, and D. M. Kammen, Deploy diverse re-newables to save tropical rivers, Nature 569, 330 (2019).
[5] M. A. J. Huijbregts, S. Hellweg, R. Frischknecht, K. Hungerbühler, and A. J. Hendriks,Ecological footprint accounting in the life cycle assessment of products, EcologicalEconomics 64, 798 (2008).
[6] A. J. Ragauskas, The Path Forward for Biofuels and Biomaterials, Science 311, 484(2006).
[7] D. J. C. Mackay, Sustainable Energy — without the hot air, Vol. 78 (2009) p. 383.

REFERENCES
1
7
[8] S. Chu and A. Majumdar, Opportunities and challenges for a sustainable energy fu-ture, Nature 488, 294 (2012).
[9] M. A. S. Azizi Samir, F. Alloin, and A. Dufresne, Review of Recent Research into Cel-lulosic Whiskers, Their Properties and Their Application in Nanocomposite Field,Biomacromolecules 6, 612 (2005).
[10] J. Simon, H. Müller, R. Koch, and V. Müller, Thermoplastic and biodegradable poly-mers of cellulose, Polymer Degradation and Stability 59, 107 (1998).
[11] M. Poletto, V. Pistor, and A. J., Structural Characteristics and Thermal Properties ofNative Cellulose, in Cellulose - Fundamental Aspects (InTech, 2013) pp. 45–68.
[12] Y. Habibi, L. A. Lucia, and O. J. Rojas, Cellulose nanocrystals: chemistry, self-assembly, and applications. Chemical reviews 110, 3479 (2010).
[13] G. Siqueira, J. Bras, and A. Dufresne, Cellulosic Bionanocomposites: A Review ofPreparation, Properties and Applications, Polymers 2, 728 (2010).
[14] M. Brown, I. Saxena, and K. Kudlicka, Cellulose biosynthesis in higher plants, Trendsin Plant Science 1, 149 (1996).
[15] I. Tsekos, The sites of cellulose synthesis in algae:diversity and evolution of cellulose-synthesizing enzyme complexes, Journal of Phycology 35, 635 (1999).
[16] R. M. Brown, J. H. Willison, and C. L. Richardson, Cellulose biosynthesis in Aceto-bacter xylinum: visualization of the site of synthesis and direct measurement of thein vivo process. Proceedings of the National Academy of Sciences 73, 4565 (1976).
[17] C. E. Wyman, Ethanol Production from Lignocellulosic Biomass: Overview, in Hand-book on Bioethanol: Production and Utilization, edited by C. Wyman (Taylor &Francis, Washington, DC, 1996) Chap. 1, pp. 1–18.
[18] N. Kosaric, Ethanol– Potential Source of Energy and Chemical Products, in Biotech-nology, edited by H. Rehm and G. Reed (Wiley-VCH Verlag GmbH, Weinheim, Ger-many, 2008) Chap. 4, pp. 121–203.
[19] M. A. Brown, M. D. Levine, J. P. Romm, A. H. Rosenfeld, and J. G. Koomey,Engineering-economic studies of energy technologies to reduce greenhouse gas emis-sions: Opportunities and Challenges, Annual Review of Energy and the Environ-ment 23, 287 (1998).
[20] OFD, Review of the Research Strategy for Biomass-Derived Transportation Fuels (Na-tional Academies Press, Washington, D.C., 1999).
[21] S. Naik, V. V. Goud, P. K. Rout, and A. K. Dalai, Production of first and second gener-ation biofuels: A comprehensive review, Renewable and Sustainable Energy Reviews14, 578 (2010).

1
8 REFERENCES
[22] M. von Sivers, G. Zacchi, L. Olsson, and B. Hahn-Haegerdal, Cost Analysis ofEthanol Production from Willow Using Recombinant Escherichia coli, Biotechnol-ogy Progress 10, 555 (1994).
[23] A. Wiselogel, S. Tyson, and D. Johnson, Biomass feedstock resources and composi-tion, in Handbook on bioethanol: production and utilization, edited by C. Wyman(Taylor and Francis, Washington, DC, 1996) Chap. 6, pp. 105–118.
[24] P. A. M. Claassen, J. B. van Lier, A. M. Lopez Contreras, E. W. J. van Niel, L. Sijtsma,A. J. M. Stams, S. S. de Vries, and R. A. Weusthuis, Utilisation of biomass for thesupply of energy carriers, Applied Microbiology and Biotechnology 52, 741 (1999).
[25] W. Van Camp, Yield enhancement genes: seeds for growth, Current Opinion inBiotechnology 16, 147 (2005).
[26] Z. P. Jing, F. Gallardo, M. B. Pascual, R. Sampalo, J. Romero, A. T. De Navarra, andF. M. Cánovas, Improved growth in a field trial of transgenic hybrid poplar overex-pressing glutamine synthetase, New Phytologist 164, 137 (2004).
[27] B. Vinocur and A. Altman, Recent advances in engineering plant tolerance to abi-otic stress: achievements and limitations, Current Opinion in Biotechnology 16, 123(2005).
[28] P. Morandini, F. Salamini, and P. Gantet, Engineering of Plant Metabolism forDrug and Food, Current Medicinal Chemistry-Immunology, Endocrine & MetabolicAgents 5, 103 (2005).
[29] S. a. Nolen, C. L. Liotta, C. a. Eckert, and R. Gläser, The catalytic opportunities ofnear-critical water: a benign medium for conventionally acid and base catalyzedcondensations for organic synthesis, Green Chem. 5, 663 (2003).
[30] C. A. Eckert, C. L. Liotta, D. Bush, J. S. Brown, and J. P. Hallett, Sustainable Reactionsin Tunable Solvents, The Journal of Physical Chemistry B 108, 18108 (2004).
[31] N. MOSIER, Features of promising technologies for pretreatment of lignocellulosicbiomass, Bioresource Technology 96, 673 (2005).
[32] M. Foston and A. J. Ragauskas, Biomass Characterization: Recent Progress in Under-standing Biomass Recalcitrance, Industrial Biotechnology 8, 191 (2012).
[33] A. T. W. M. Hendriks and G. Zeeman, Pretreatments to enhance the digestibility oflignocellulosic biomass, Bioresource Technology 100, 10 (2009), arXiv:1579-4377 .
[34] Z. Lin, H. Huang, H. Zhang, L. Zhang, L. Yan, and J. Chen, Ball Milling Pretreat-ment of Corn Stover for Enhancing the Efficiency of Enzymatic Hydrolysis, AppliedBiochemistry and Biotechnology 162, 1872 (2010).
[35] O. Bobleter, Hydrothermal degradation of polymers derived from plants, Progress inPolymer Science 19, 797 (1994).

REFERENCES
1
9
[36] G. Garrote, H. Domínguez, and J. C. Parajó, Hydrothermal processing of lignocellu-losic materials, Holz als Roh- und Werkstoff 57, 191 (1999).
[37] C. Liu and C. E. Wyman, The Effect of Flow Rate of Compressed Hot Water on Xylan,Lignin, and Total Mass Removal from Corn Stover, Industrial & Engineering Chem-istry Research 42, 5409 (2003).
[38] M. a. Kabel, G. Bos, J. Zeevalking, A. G. J. Voragen, and H. a. Schols, Effect of pre-treatment severity on xylan solubility and enzymatic breakdown of the remainingcellulose from wheat straw. Bioresource technology 98, 2034 (2007).
[39] M. Foston and A. J. Ragauskas, Changes in lignocellulosic supramolecular and ultra-structure during dilute acid pretreatment of Populus and switchgrass, Biomass andBioenergy 34, 1885 (2010).
[40] Q. Sun, M. Foston, X. Meng, D. Sawada, S. V. Pingali, H. M. O’Neill, H. Li, C. E.Wyman, P. Langan, A. J. Ragauskas, and R. Kumar, Effect of lignin content onchanges occurring in poplar cellulose ultrastructure during dilute acid pretreatment,Biotechnology for Biofuels 7, 150 (2014).
[41] G. Brodeur, E. Yau, K. Badal, J. Collier, K. B. Ramachandran, and S. Ramakrishnan,Chemical and Physicochemical Pretreatment of Lignocellulosic Biomass: A Review,Enzyme Research 2011, e787532 (2011), arXiv:787532 .
[42] J. S. Kim, Y. Lee, and T. H. Kim, A review on alkaline pretreatment technology forbioconversion of lignocellulosic biomass, Bioresource Technology 199, 42 (2016).
[43] P.-L. Tang, P. M. Abdul, N. S. Engliman, and O. Hassan, Effects of pretreatment andenzyme cocktail composition on the sugars production from oil palm empty fruitbunch fiber (OPEFBF), Cellulose (2018), 10.1007/s10570-018-1894-0.
[44] G. Bali, X. Meng, J. I. Deneff, Q. Sun, and A. J. Ragauskas, The effect of alkalinepretreatment methods on cellulose structure and accessibility, ChemSusChem 8, 275(2015).
[45] S. V. Pingali, V. S. Urban, W. T. Heller, J. McGaughey, H. O’Neill, M. B. Foston, H. Li,C. E. Wyman, D. A. Myles, P. Langan, A. Ragauskas, B. Davison, and B. R. Evans,Understanding Multiscale Structural Changes During Dilute Acid Pretreatment ofSwitchgrass and Poplar, ACS Sustainable Chemistry & Engineering 5, 426 (2017).
[46] P. Harmsen, W. Huigen, L. Bermudez, and R. Bakker, Literature Review of Physicaland Chemical Pretreatment Processes for Lignocellulosic Biomass, September (2010)pp. 1–54.
[47] L. J. Jönsson and C. Martín, Pretreatment of lignocellulose: Formation of inhibitoryby-products and strategies for minimizing their effects, Bioresource Technology 199,103 (2016).
[48] A. F. Turbak, F. W. Snyder, and K. R. Sandberg, Microfibrillated cellulose, a new cel-lulose product: properties, uses, and commercial potential, (United States, 1983).

1
10 REFERENCES
[49] F. W. Herrick, R. L. Casebier, J. K. Hamilton, and K. R. Sandberg, Microfibrillatedcellulose: morphology and accessibility, (United States, 1983).
[50] D. G. Hepworth and D. M. Bruce, Method of calculating the mechanical propertiesof nanoscopic plant cell wall components from tissue properties, Journal of MaterialsScience 35, 5861 (2000).
[51] Y.-C. Hsieh, H. Yano, M. Nogi, and S. J. Eichhorn, An estimation of the Young’s mod-ulus of bacterial cellulose filaments, Cellulose 15, 507 (2008).
[52] K. L. Spence, R. A. Venditti, O. J. Rojas, Y. Habibi, and J. J. Pawlak, The effect of chemi-cal composition on microfibrillar cellulose films from wood pulps: water interactionsand physical properties for packaging applications, Cellulose 17, 835 (2010).
[53] A. Naderi, T. Lindström, and T. Pettersson, The state of carboxymethylated nanofib-rils after homogenization-aided dilution from concentrated suspensions: a rheolog-ical perspective, Cellulose 21, 2357 (2014).
[54] S. J. Veen, A. Kuijk, P. Versluis, H. Husken, and K. P. Velikov, Phase Transitions in Cel-lulose Microfibril Dispersions by High-Energy Mechanical Deagglomeration, Lang-muir 30, 13362 (2014).
[55] F. Grüneberger, T. Künniger, T. Zimmermann, and M. Arnold, Rheology of nanofib-rillated cellulose/acrylate systems for coating applications, Cellulose 21, 1313 (2014).
[56] D. Klemm, E. D. Cranston, D. Fischer, M. Gama, S. A. Kedzior, D. Kralisch, F. Kramer,T. Kondo, T. Lindström, S. Nietzsche, K. Petzold-Welcke, and F. Rauchfuß, Nanocel-lulose as a natural source for groundbreaking applications in materials science: To-day’s state, Materials Today 21, 720 (2018).
[57] O. Nechyporchuk, M. N. Belgacem, and F. Pignon, Concentration effect of TEMPO-oxidized nanofibrillated cellulose aqueous suspensions on the flow instabilities andsmall-angle X-ray scattering structural characterization, Cellulose 22, 2197 (2015).
[58] A. Naderi and T. Lindstrom, Rheological Measurements on Nanofibrillated Cellu-lose Systems: A Science in Progress, in Cellulose and Cellulose Derivatives: Synthesis,Modification and Applications, edited by I. H. Mondal (Nova Science Publishers,Inc., New York, 2015) Chap. 10, pp. 187–204.
[59] O. Nechyporchuk, M. N. Belgacem, and F. Pignon, Rheological properties of micro-/nanofibrillated cellulose suspensions: Wall-slip and shear banding phenomena,Carbohydrate Polymers 112, 432 (2014).
[60] T. Saarinen, M. Lille, and J. Seppälä, Technical Aspects on Rheological Characteriza-tion of Microfibrillar Cellulose Water Suspensions, Annual Transaction of the NordicRheology Society 17, 121 (2009).
[61] J. Mewis and N. J. Wagner, Thixotropy, Advances in Colloid and Interface Science147-148, 214 (2009).

REFERENCES
1
11
[62] H. Taheri and P. Samyn, Effect of homogenization (microfluidization) process pa-rameters in mechanical production of micro- and nanofibrillated cellulose on itsrheological and morphological properties, Cellulose 23, 1221 (2016).
[63] M. Pääkkö, M. Ankerfors, H. Kosonen, A. Nykänen, S. Ahola, M. Österberg, J. Ruoko-lainen, J. Laine, P. T. Larsson, O. Ikkala, and T. Lindström, Enzymatic Hydrol-ysis Combined with Mechanical Shearing and High-Pressure Homogenization forNanoscale Cellulose Fibrils and Strong Gels, Biomacromolecules 8, 1934 (2007).
[64] M. Iotti, Ø. W. Gregersen, S. Moe, and M. Lenes, Rheological Studies of Microfibril-lar Cellulose Water Dispersions, Journal of Polymers and the Environment 19, 137(2011).
[65] E. Lasseuguette, D. Roux, and Y. Nishiyama, Rheological properties of microfibrillarsuspension of TEMPO-oxidized pulp, Cellulose 15, 425 (2008).
[66] G. Agoda-Tandjawa, S. Durand, S. Berot, C. Blassel, C. Gaillard, C. Garnier, and J.-L.Doublier, Rheological characterization of microfibrillated cellulose suspensions afterfreezing, Carbohydrate Polymers 80, 677 (2010).
[67] I. Besbes, M. R. Vilar, and S. Boufi, Nanofibrillated cellulose from Alfa, Eucalyptusand Pine fibres: Preparation, characteristics and reinforcing potential, CarbohydratePolymers 86, 1198 (2011).
[68] E. Dinand, H. Chanzy, and M. R. Vignon, Parenchymal cell cellulose from sugar beetpulp: preparation and properties, Cellulose 3, 183 (1996).
[69] M. Mohtaschemi, K. Dimic-Misic, A. Puisto, M. Korhonen, T. Maloney, J. Paltakari,and M. J. Alava, Rheological characterization of fibrillated cellulose suspensions viabucket vane viscometer, Cellulose 21, 1305 (2014).
[70] F. Bettaieb, O. Nechyporchuk, R. Khiari, M. F. Mhenni, A. Dufresne, and M. N. Bel-gacem, Effect of the oxidation treatment on the production of cellulose nanofiber sus-pensions from Posidonia oceanica : The rheological aspect, Carbohydrate Polymers134, 664 (2015).
[71] E. Saarikoski, T. Saarinen, J. Salmela, and J. Seppälä, Flocculated flow of microfib-rillated cellulose water suspensions: An imaging approach for characterisation ofrheological behaviour, Cellulose 19, 647 (2012).
[72] A. Karppinen, T. Saarinen, J. Salmela, A. Laukkanen, M. Nuopponen, and J. Seppälä,Flocculation of microfibrillated cellulose in shear flow, Cellulose 19, 1807 (2012).
[73] F. Martoïa, C. Perge, P. J. J. Dumont, L. Orgéas, M. A. Fardin, S. Manneville, and M. N.Belgacem, Heterogeneous flow kinematics of cellulose nanofibril suspensions undershear, Soft Matter 11, 4742 (2015).
[74] T. Saarinen, S. Haavisto, A. Sorvari, J. Salmela, and J. Seppälä, The effect of walldepletion on the rheology of microfibrillated cellulose water suspensions by opticalcoherence tomography, Cellulose 21, 1261 (2014).

1
12 REFERENCES
[75] S. Haavisto, A. I. Koponen, and J. Salmela, New insight into rheology and flow prop-erties of complex fluids with Doppler optical coherence tomography, Frontiers inChemistry 2, 1 (2014).
[76] D. de Kort, S. Veen, H. Van As, D. Bonn, K. Velikov, and J. van Duynhoven, Yieldingand flow of cellulose microfibril dispersions in the presence of a charged polymer,Soft Matter (2016), 10.1039/c1sm05495c.
2EFFECTS OF DILUTE ACID
PRETREATMENT ON THE
STRUCTURE OF POPLAR BIOMASS
Effects of dilute acid pretreatment on the structure of poplar biomass have been inves-tigated by a variety of techniques: microscopy, small angle scattering and diffraction ofX-rays. The pretreatment consists of exposure to 0.2% H2SO4 for 12 minutes (a mild pre-treatment), or to 0.5% H2SO4 for 8 minutes (a severe pretreatment). The effectiveness ofthe pretreatment is measured as the glucose yield after 72 hours of enzymatic hydrolysisof the feedstock before and after pretreatment. The pretreatment results in the increase ofthe yield from 1% for initial poplar material to 50% after mild pretreatment and up to70% after severe pretreatment. XRD has shown decrease of cellulose crystallinity in poplarfrom 50% in the initial material to 26% and 24% after the mild and severe pretreatments,respectively. SAXS analysis has allowed us to estimate the specific surface area of the ma-terials in wet state. It has shown more than sevenfold increase of specific surface area afterthe mild pretreatment and almost ninefold increase after the severe pretreatment. Ourfindings suggest that the crystallinity index of cellulose and the specific surface area of thematerial are the main structural features responsible for optimum cellulose conversion;increase of pretreatment severity does not affect crystallinity index, but facilitates the con-version via increase in specific surface area of feedstock.
This chapter, by Evgenii Velichko, Margot Schooneveld-Bergmans, and Wim G. Bouwman, has been submittedto the scientifi journal: Cellulose
13

2
14 2. EFFECTS OF DILUTE ACID PRETREATMENT ON THE STRUCTURE OF POPLAR BIOMASS
2.1. INTRODUCTIONRenewable sources of energy have attracted considerable attention from governmentsworldwide. It is widely recognized that the human civilization overuses fossil fuel re-sources and has almost exhausted them [1]. Moreover, this overuse has led to an enor-mous greenhouse gas release into the atmosphere and is one of the main causes of theglobal warming [2]. Biofuel is a viable alternative to fossil fuels [3]. It can be producedfrom starch or sugar sources; however, exploiting food sources requires expansion of fer-tile lands, which is not feasible. As an alternative, biofuel can be derived from lignocellu-losic biomass, which includes agricultural and forestry residues, herbaceous and woodycrops [4]. The main advantages of this source are abundance, carbon-neutrality and re-newability. Therefore, lignocellulosic biomass is considered one of the most promisingrenewable energy sources. Cellulose, which is the main component of the lignocellu-losic biomass, has a complex hierarchical structure [5–13]. On the molecular level, it is along chain of glucose molecules. These macromolecules are bound together by hydro-gen bonds and form alternating crystalline and amorphous regions of cellulose. To pro-duce biofuel, cellulose has to be converted into glucose by enzymes, so-called enzymatichydrolysis [14]. However, this process is hindered by various structural and composi-tional factors [15–17]. Several pretreatments have been proposed to make biomass moresusceptible to hydrolysis, including mechanical [18–21], chemical [22–27] and thermo-chemical methods [25, 27–29]. Acidic pretreatment is one of the most promising andwidely used among these. Researchers have reported a decrease in crystallinity and im-proved enzymatic digestibility of cellulose as a result of this pretreatment [30–35]. There-fore, recalcitrance of cellulose is attributed to its crystal structure. However, it is hard toimagine that changes of the most basic units of cellulose are happening without changeson the larger length scale. For alteration of crystallinity to take place, changes on thenanometer length scale should take place, so that crystallites become more accessibleto acid for interaction. However, very little is known about the effect of pretreatment onnanometer and micrometer scales of cellulose.
Small angle scattering of X-rays and neutrons gives access to intermediate lengthscale, the mesostructure. It is commonly accepted that cellulose has several levels oforganization in the nano- and micrometer length scale: elementary fibrils with diame-ters of several nm, microfibrils with diameters in the order of tens of nm and bundlesof microfibrils with diameters in micrometer range [36, 37]. In recent years small an-gle scattering techniques were applied to a multitude of cellulosic materials, rangingfrom bacterial cellulose, to switchgrass and poplar [5, 7, 35, 38–41]. A core-shell cylindermodel with absolute power law for fitting of the SAS data, proposed by a group of Gilbert[5] was recently successfully applied to bacterial cellulose and cotton materials [38, 42].In combination with the XRD data, this model gives valuable insights into the hierarchi-cal structure fo cellulosic materials. A recent small-angle neutron scattering research ofswitchgrass and poplar by Pingali et al. gave valuable insights into structural changes incellulosic materials and concluded that "cellulose accessibility is the decisive factor inincreasing glucose yields, while cellulose crystallinity and lignin aggregation play lesserroles." However, the researchers were using a multilevel unified fit, which is considerablyambiguous.
In this study we have applied a multi-technique approach based on microscopy,
2.2. MATERIALS AND METHODS
2
15
small-angle scattering and X-ray diffraction to study structural changes in poplar biomass.This combination allowed us to assess structural changes in cellulose over a wide rangeof length scales (from Ångström scale up to millimeter scale). Moreover, the link betweenthe changes in mesostructure and enzymatic digestibility of the cellulose material wasestablished with the help of high performance liquid chromatography. By comparingthe structural parameters with the cellulose digestibility, we outlined the key structuralfeatures responsible for optimum cellulose digestion. This approach can be used to eval-uate the effects of pretreatment on the mesostructure of biomass, thus facilitating thedevelopment of a sustainable process for the production of the biofuel.
2.2. MATERIALS AND METHODS
2.2.1. MATERIALS AND PRETREATMENTThe initial poplar material was pretreated with two different concentrations of sulfuricacid: 0.2% (mildly treated poplar, MP) and 0.5% (severely treated poplar, SP). Firstly,chipped poplar feedstock was mixed with diluted sulfuric acid to reach 40% feedstockdry matter and required concentration of sulfuric acid. After soaking for 16 hours themixtures were transferred to a bench scale reactor and heated with steam to 180C for12 minutes (MP), or to 190C for 8 minutes (SP). At the end of the reaction time, thetemperature and pressure were instantly dropped by opening a valve of the reactor, andthe pretreated feedstock and liquid were collected. After acid treatment feedstock wasseparated from liquid, washed with demineralized water and used for further analysis.The dry matter content was approximately 30%. 2 ml of each sample were kept in thewet state for SAXS experiments and were stored in a fridge at 4C. The rest of the sampleswere dried at 50 C till constant weight and were stored at room temperature in closedbeakers.
2.2.2. FEEDSTOCK COMPOSITIONTotal sugar composition was determined based on NMR analysis of acid hydrolyzedfeedstock according to the method of Carvalho de Souza et al. [43].
2.2.3. MICROSCOPYBright field and fluorescence microscopy were performed using the Keyence BZ8000 Flu-orescence microscope (Biozero). The exposure time settings of the microscope for opti-mal fluorescent signal were determined automatically by the software of the microscope.The image size of an image is 680 x 512 pixels. Samples under investigation were placedin silicone isolators from Grace Biolabs (Press-to-seal Silicone isolator) with a depth of0.5 mm and a diameter of 20 mm (Sigma GBL666505).
2.2.4. X-RAY DIFFRACTION ANALYSISThe X-ray diffraction (XRD) measurements were carried out at the Reactor Institute Delftusing a PANalytical X’Pert pro X-ray diffractometer with Cu-Kα radiation (5 ≤ 2θ ≤ 80with a step size of 0.008 (2θ); total measuring time was 1 h per sample). All the sam-ples were dried prior to XRD measurements. All measurements were performed at roomtemperature and atmospheric pressure.

2
16 2. EFFECTS OF DILUTE ACID PRETREATMENT ON THE STRUCTURE OF POPLAR BIOMASS
The crystallinity indexes (XC ) were determined by the method proposed by Teeäär,Serlmaa and Paakkari [44], and successfully applied by several groups [38, 45–47]:
XC (%) = ΣACr y st al
ATot al×100, (2.1)
where ATot al is the sum of the areas under all the diffraction peaks and ΣACr y st al is thesum of the areas corresponding to the three crystalline peaks.
The apparent crystallite sizes (τ(hkl )) were calculated using the Scherrer’s equation[48]:
τ(hkl ) =K ×λ
β(hkl ) ×cos(θ(hkl )), (2.2)
where K is a constant of value 0.9, λ is the X-ray wavelength (0.1542 nm), β is the half-height width of the diffraction band in radians, and 2θ is the Bragg angle correspondingto the (hkl ) plane.
2.2.5. SMALL ANGLE X-RAY SCATTERING (SAXS)Small angle X-ray scattering experiments were performed at the high-brilliance ID02beamline of the European Synchrotron Radiation Facility (ESRF) in Grenoble, France.Details of the experimental setup are given elsewhere [49]. Data were collected in therange 3×10⁻⁴Å≤ q ≤ 0.7Å, where q = 4π
λ sin(2θ) is the momentum transfer, where θ is ascattering angle and λ the wavelength of the used X-rays (in our experiments λ=0.0996nm). Measurements were performed in transmission mode. All samples were in theform of a suspension in water with a dry material content of about 30 %. Each samplewas placed in a 30 position temperature stage with aluminum sample holders betweenmica windows, and the temperature of the sample cell kept constant at 20C. A scat-tering pattern of 2 mm of water between two mica windows was used for backgroundsubtraction for all the measurements. The scattering intensities were scaled to absoluteunits [cm−1] using a water reference (IH2O,20C = 1.641 ·10−2cm−1).
2.2.6. SAXS DATA ANALYSISTwo-step analysis was performed to describe SAXS data. Firstly, from Porod law [50] andscattering invariant we determined the fraction of water absorbed by the particles, theireffective scattering length density contrast, effective density and volume fraction, as wellas specific surface areas.The scattering invariant is defined as
Q∗ =∫ ∞
−∞q2∆I (q)d q, (2.3)
and can be calculated for a 2 phase system as
Q∗ = 2π2ϕ(1−ϕ)(∆ρ)2, (2.4)
whereϕ is the volume fraction of the scattering particles and∆ρ is their scattering lengthdensity contrast with the solvent.

2.2. MATERIALS AND METHODS
2
17
The specific surface area can be determined from the invariant as
S I =2πϕ(1−ϕ)Kp
Q∗D, (2.5)
where Kp is the Porod scale factor, and D is the mass density of the particle. Some moredetails on the evaluation of specific surface area are provided in section 2.3.4.
In case if the particles can soak in the solvent, we can modify the Eq. 2.4 as
Q∗ = 2π2(ϕ+ c)(1− (ϕ+ c))
(∆ρ ·ϕϕ+ c
)2
= 2π2 ·ϕe f · (1−ϕe f ) ·∆ρ2e f , (2.6)
where c is the fraction of the solvent absorbed by the particles, and ϕe f = ϕ+ c and
∆ρe f = ∆ρ·ϕϕ+c are effective volume fraction and scattering length density contrast. As the
second step in the analysis of SAXS data, all of the scattering curves were fitted usingSASView [51] software and applying the core-shell model described in [7, 52]. The modelconsists of a power-law and a core-shell cylinder form-factor:
I (q) = s f
V· ∑
Rcor e
n(Rcor e ,σcor e ) ·P (q,Rcor e ,Rshel l ,L, (2.7)
ρcor e ,ρshel l ,ρsol v )+ A ·q−m +bckg ,
where the first term corresponds to the form factor of a core-shell cylinder with polydis-perse core radii, multiplied by the number density of particles (s f /V ), where V is thetotal volume of the particle, the second term accounts for the power-law scattering oflarge clusters, and the third term corresponds to the incoherent background remainingafter solvent background subtraction. A detailed description of the form factor functionand the parameters defining the model can be found elsewhere [7].
2.2.7. SURFACE AREAThe specific surface area for all the samples was measured by nitrogen adsorption ac-cording to Brunauer-Emmett-Teller (BET) theory [53] using Micromeritics Tristar 3000analyzer at Ural Federal University in Yekaterinburg, Russia.
2.2.8. GLUCOSE RELEASEAll of the powder samples were suspended in an acetate buffer at pH of 4.5 and 2% weightconcentration of dry material. Resulting slurries were stirred for 16 hours in order toassure sufficient wetting of the material. After stirring, two aliquots of 950 µL of eachslurry were transported into 2 mL Eppendorf tubes. One tube of each material, indicatedas t=0, was filled with water to make 1000 µL of 1.9% material and stored in a freezer at -20C for further analysis. The remaining tubes were preheated to 60C in a thermomixer.Following preheating, an overdose of cellulase cocktail was added to each tube, makingconcentrations of 1.9% in each tube. All of the tubes were left in Thermomixer at 60Cand shaking at 1000 rpm and were taken away and set on ice 72 hours after addition ofenzymes. The pH of all samples was checked after hydrolysis and was 4.45. The sampleswere centrifuged and filtered to remove all solids.

2
18 2. EFFECTS OF DILUTE ACID PRETREATMENT ON THE STRUCTURE OF POPLAR BIOMASS
The monosugars profile of the samples after enzymatic hydrolysis was analyzed us-ing high-performance anion exchange chromatography (HPLC) with pulsed ampero-metric detection (Dionex ICS-500 with AS-AP autosampler). The samples were separatedon a CarboPac PA-20 column preceded by a CarboPac PA-20 guard-column, by elutionfor 19 minutes in 5 mM NaOH at a flow rate of 0.5 ml/min. The column was washed bysolutions of NaOH with gradually increasing concentration up to 380 mM, and 6 min-utes with 380 mM NaOH solution. Subsequently, the column was equilibrated to 5 mMNaOH. Quantification of glucose was done using the response factor of the glucose stan-dard.The glucose yield is calculated in the following way:
Y i eld(%) = Cmeas
Cmax·100% = Cmeas
Ccel l ·CDM ·Csl ur r y·100%, (2.8)
where Cmeas is the measured concentration of glucose, Cmax is the potential maximalconcentration of glucose in the sample, Ccel l is the concentration of cellulose in the drymaterial, CDM is the concentration of dry matter in the material, and Csl ur r y is the con-centration of material in the slurry with the enzyme cocktail.
2.3. RESULTS
2.3.1. FEEDSTOCK COMPOSITIONAccording to NMR analysis of the of acid hydrolyzed feedstock, the initial poplar materialcontains 45.9% wt. of glucan (cellulose), 10.8% wt. of xylan, 3.8% wt. water, and the re-maining 39.5% wt. are attributed primarily lignin and some other hemicellulose sugars.The values obtained are in a good agreement with the typical composition of poplar [54].
Table 2.1: Densities and X-ray SLDs for the components of poplar biomass, based on [7, 55]
Component Density (g/cm3) X-ray SLD (1010 cm−2)
Cellulose (crystalline) 1.60 14.46Cellulose (amorphous) 1.48 13.38Xylan 1.40 12.71Lignin 1.40 12.59H2O 1.00 9.47
2.3.2. MICROSCOPYBright field and fluorescent light microscopy images of all the investigated samples areshown in Fig. 2.1. As can be seen from Fig. 2.1(a), initial poplar material is composedof rather big particles with typical dimensions above 1.1 mm (horizontal dimension ofthe field of view of the images). Evidently, pretreatment resulted in smaller particle sizes.On Fig. 2.1(c) one can see two kinds of particles: one with sizes of some 100 µm and theother with sizes of some 10 µm. The sizes of poplar particle after severe pretreatment
2.3. RESULTS
2
19
are more homogeneously distributed in the 10 µm size domain. Fig. 2.1(b,d,f) show ahomogeneous distribution of lignin on the surface of the particles.
2.3.3. X-RAY DIFFRACTION ANALYSIS
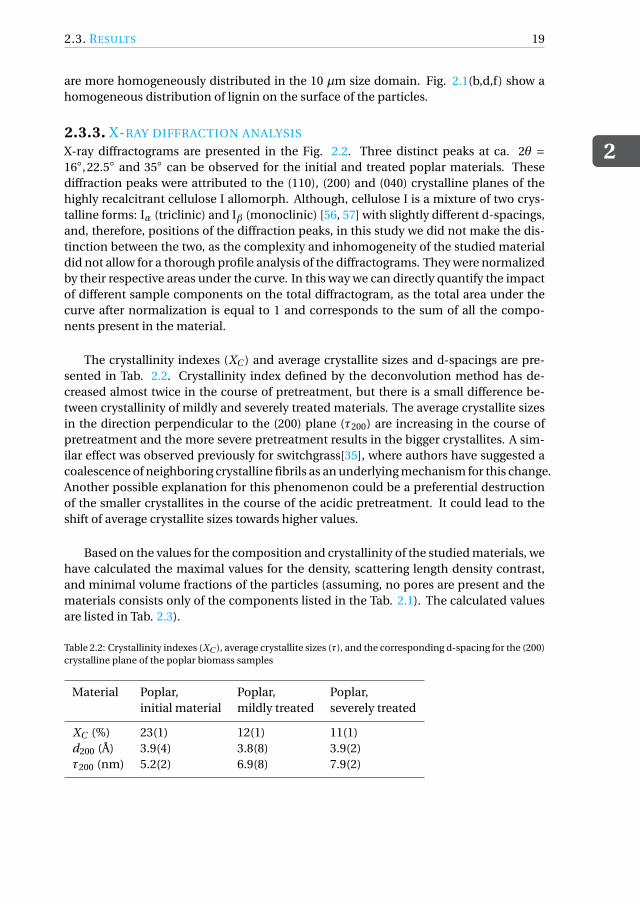
X-ray diffractograms are presented in the Fig. 2.2. Three distinct peaks at ca. 2θ =16,22.5 and 35 can be observed for the initial and treated poplar materials. Thesediffraction peaks were attributed to the (110), (200) and (040) crystalline planes of thehighly recalcitrant cellulose I allomorph. Although, cellulose I is a mixture of two crys-talline forms: Iα (triclinic) and Iβ (monoclinic) [56, 57] with slightly different d-spacings,and, therefore, positions of the diffraction peaks, in this study we did not make the dis-tinction between the two, as the complexity and inhomogeneity of the studied materialdid not allow for a thorough profile analysis of the diffractograms. They were normalizedby their respective areas under the curve. In this way we can directly quantify the impactof different sample components on the total diffractogram, as the total area under thecurve after normalization is equal to 1 and corresponds to the sum of all the compo-nents present in the material.
The crystallinity indexes (XC ) and average crystallite sizes and d-spacings are pre-sented in Tab. 2.2. Crystallinity index defined by the deconvolution method has de-creased almost twice in the course of pretreatment, but there is a small difference be-tween crystallinity of mildly and severely treated materials. The average crystallite sizesin the direction perpendicular to the (200) plane (τ200) are increasing in the course ofpretreatment and the more severe pretreatment results in the bigger crystallites. A sim-ilar effect was observed previously for switchgrass[35], where authors have suggested acoalescence of neighboring crystalline fibrils as an underlying mechanism for this change.Another possible explanation for this phenomenon could be a preferential destructionof the smaller crystallites in the course of the acidic pretreatment. It could lead to theshift of average crystallite sizes towards higher values.
Based on the values for the composition and crystallinity of the studied materials, wehave calculated the maximal values for the density, scattering length density contrast,and minimal volume fractions of the particles (assuming, no pores are present and thematerials consists only of the components listed in the Tab. 2.1). The calculated valuesare listed in Tab. 2.3).
Table 2.2: Crystallinity indexes (XC ), average crystallite sizes (τ), and the corresponding d-spacing for the (200)crystalline plane of the poplar biomass samples
Material Poplar, Poplar, Poplar,initial material mildly treated severely treated
XC (%) 23(1) 12(1) 11(1)d200 (Å) 3.9(4) 3.8(8) 3.9(2)τ200 (nm) 5.2(2) 6.9(8) 7.9(2)

2
20 2. EFFECTS OF DILUTE ACID PRETREATMENT ON THE STRUCTURE OF POPLAR BIOMASS
Figure 2.1: Bright field (a, c, e) and fluorescent (b, d, f) light microscopy of the samples before and after pretreat-ment: (a) typical image of the initial poplar material with (b) respective luminescent image, (c) poplar materialafter a mild treatment with (d) respective luminescent image,(e) poplar material after the severe treatmentwith (f) respective luminescent image

2.3. RESULTS
2
21
Figure 2.2: XRD patterns of poplar materials before and after acidic pretreatment

2
22 2. EFFECTS OF DILUTE ACID PRETREATMENT ON THE STRUCTURE OF POPLAR BIOMASS
2.3.4. SMALL ANGLE X-RAY SCATTERING (SAXS)All of the data related to the analysis of the scattering invariant are collected in Tab. 2.3.Firstly, we have determined the background level from the Porod plots for all of the scat-tering curves. Once we knew the exact value of background, we could calculate the in-variants for each of the curves. It should be noted, that no extrapolations were made inlow- or high q regions, only the measured q region was used for the invariant calcula-tions. The measured and calculated values for the invariant, maximal ∆ρ and minimalϕ were filled in Eq. 2.6 and the equation was solved for the fraction of absorbed water c.Based on the c values we could calculate values for De f ,∆ρe f , and ϕe f values. It shouldbe noted that for the dry sample of the initial poplar material the volume fraction couldnot be well estimated from the sample thickness and density as the particle of the mate-rial are not uniform and the beam size was about 8000µm2. However, we could calculatethe volume fraction from the scattering invariant.
Table 2.3: Data relevant for the SAXS analysis
Material Poplar dry, Poplar wet, Poplar, Poplar,initial material initial material mildly treated severely treated
Background (cm−1) 0.008 0.037 0.014 0.0147Scattering invariant 0.00376 0.00118 0.00109 0.00117Q∗ (cm−1Å−3)Maximal density D (g/cm3) 1.4491 1.4491 1.4359 1.4347Maximal ρ (1010 cm−2) 13.089 13.089 12.970 12.959Maximal ∆ρ (1010 cm−2) 13.089 3.619 3.500 3.489Minimal ϕ n.a. 0.228(1) 0.229(1) 0.229(1)Fraction of absorbed water c n.a. 0.305(1) 0.310(1) 0.290(1)Effective density De f (g/cm3) n.a 1.312(1) 1.301(1) 1.309(1)Effective ρe f (1010 cm−2) n.a. 11.019(1) 10.960(1) 11.013(1)Effective ∆ρe f (1010 cm−2) n.a. 1.549(1) 1.490(1) 1.543(1)Effective ϕe f 0.989(1) 0.533(1) 0.539(1) 0.519(1)
Small-angle X-ray scattering curves with the fitting results are presented in Fig. 2.3.Tab. 2.4 shows all of the fitting parameters of the model.
2.3.5. SPECIFIC SURFACE AREA
Results of specific surface area measurements are presented in Tab. 2.5. It is clear thattreatment of poplar biomass has resulted in substantial increase of the specific surfacearea and higher severity of pretreatment resulted in higher increase.
2.3.6. GLUCOSE RELEASE
The glucose yield after enzymatic hydrolysis is presented in Tab. 2.6. Acidic pretreatmentleads to much higher levels of glucose conversion and the more severe pretreatment re-sults in the higher glucose yield.

2.3. RESULTS
2
23
Figure 2.3: Small-angle X-ray scattering curves for all of the samples and the corresponding fits
2
24 2. EFFECTS OF DILUTE ACID PRETREATMENT ON THE STRUCTURE OF POPLAR BIOMASS
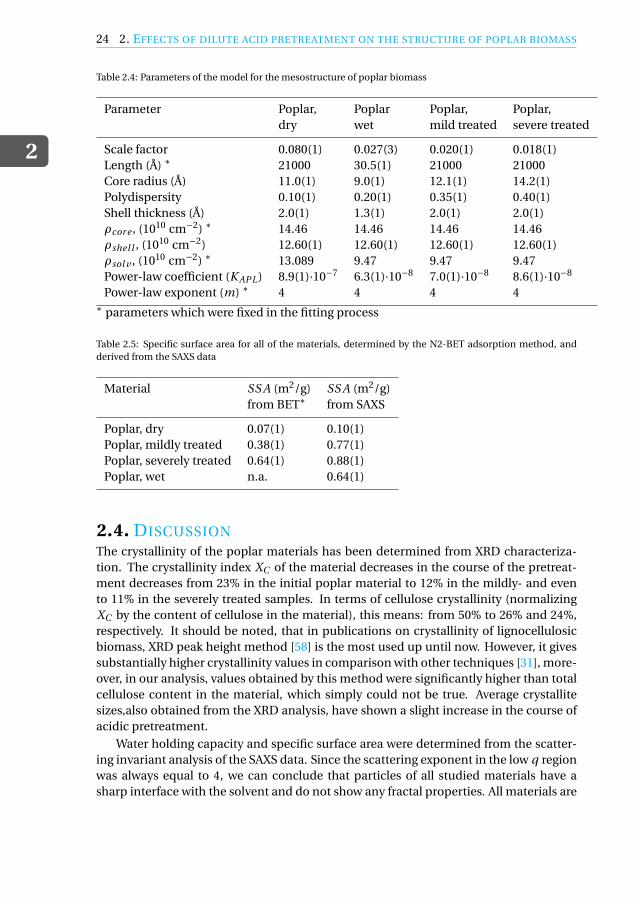
Table 2.4: Parameters of the model for the mesostructure of poplar biomass
Parameter Poplar, Poplar Poplar, Poplar,dry wet mild treated severe treated
Scale factor 0.080(1) 0.027(3) 0.020(1) 0.018(1)Length (Å) ∗ 21000 30.5(1) 21000 21000Core radius (Å) 11.0(1) 9.0(1) 12.1(1) 14.2(1)Polydispersity 0.10(1) 0.20(1) 0.35(1) 0.40(1)Shell thickness (Å) 2.0(1) 1.3(1) 2.0(1) 2.0(1)ρcor e , (1010 cm−2) ∗ 14.46 14.46 14.46 14.46ρshel l , (1010 cm−2) 12.60(1) 12.60(1) 12.60(1) 12.60(1)ρsol v , (1010 cm−2) ∗ 13.089 9.47 9.47 9.47Power-law coefficient (K APL) 8.9(1)·10−7 6.3(1)·10−8 7.0(1)·10−8 8.6(1)·10−8
Power-law exponent (m) ∗ 4 4 4 4∗ parameters which were fixed in the fitting process
Table 2.5: Specific surface area for all of the materials, determined by the N2-BET adsorption method, andderived from the SAXS data
Material SS A (m2/g) SS A (m2/g)from BET∗ from SAXS
Poplar, dry 0.07(1) 0.10(1)Poplar, mildly treated 0.38(1) 0.77(1)Poplar, severely treated 0.64(1) 0.88(1)Poplar, wet n.a. 0.64(1)
2.4. DISCUSSIONThe crystallinity of the poplar materials has been determined from XRD characteriza-tion. The crystallinity index XC of the material decreases in the course of the pretreat-ment decreases from 23% in the initial poplar material to 12% in the mildly- and evento 11% in the severely treated samples. In terms of cellulose crystallinity (normalizingXC by the content of cellulose in the material), this means: from 50% to 26% and 24%,respectively. It should be noted, that in publications on crystallinity of lignocellulosicbiomass, XRD peak height method [58] is the most used up until now. However, it givessubstantially higher crystallinity values in comparison with other techniques [31], more-over, in our analysis, values obtained by this method were significantly higher than totalcellulose content in the material, which simply could not be true. Average crystallitesizes,also obtained from the XRD analysis, have shown a slight increase in the course ofacidic pretreatment.
Water holding capacity and specific surface area were determined from the scatter-ing invariant analysis of the SAXS data. Since the scattering exponent in the low q regionwas always equal to 4, we can conclude that particles of all studied materials have asharp interface with the solvent and do not show any fractal properties. All materials are

2.4. DISCUSSION
2
25
Table 2.6: Glucose yields for all of the studied materials after 72 hours of enzymatic hydrolysis
Material Glucose yield after 72 hours ofenzymatic hydrolysis (%)
Poplar, initial material 1.0(5)Poplar, mildly treated 50(4)Poplar, severely treated 70(4)
able to hold 1.5 volume of water per volume of the dry material. Specific surface areaof the materials has increased as the result of the pretreatment, with the higher increasecorresponding to the higher severity of the pretreatment. Since no change in the topo-logical dimension of the particle surface (scattering exponent) was observed as a resultof the pretreatment, the only possible explanation for the increase of the specific surfacearea of the materials is the decrease in average particle sizes. This decrease is outlinedin the results of light microscopy. The specific surface area values obtained from SAXSanalysis were compared to ones from BET analysis. The values for the dry initial mate-rial, obtained by both methods are in good agreement, however, for the materials whichwere in wet state during SAXS analysis, the values obtained by BET method are consid-erably lower than ones obtained from SAXS analysis. We assume that as a result of thenecessary drying step before BET analysis, the particle surface shrinks and open porescollapse. Since, in the industrial applications enzymatic hydrolysis of biomass happensin the wet state, it is very useful to be able to determine specific surface area for the ma-terials in this state, and the SAXS method seems to be the right tool for doing it.
Fitting SAXS data with the core-shell cylinder and absolute power law model givesseveral insights into affect of acidic pretreatment on the mesostructure of lignocellulosicbiomass. Firstly, the core radii of the fibers are increasing in the course of pretreatment,however their volume fractions (scale factor) are decreasing. It appears that small fibersare disrupted much easier than bigger ones during the pretreatment. On the other hand,the coefficient of the power law K APL is steadily increasing as a result of pretreatment.Therefore, we can conclude that disrupted fibrils do not dissolve completely, but becomeamorphous and stay around the preserved ones, forming part of the big agglomerates oflignocellulose. The increase in sizes of crystalline cores in the course of pretreatmentcorrelates with the XRD results and agree with the previous findings published in [35].Moreover, the average crystallite sizes obtained from XRD are approximately 3 timeslarger than diameters of crystalline cores for all of the studied materials. One of the pos-sible explanations for this effect is the coalescence of the neighboring elementary fibrilsin the drying process preceding the XRD measurements. On the other hand, the almostconstant ratio between crystallite sizes and diameters of elementary fibrils can indicatethat SAXS and XRD are sensitive to different levels of cellulose organization. Crystallitesizes determined from XRD could be attributed to cross-sections of microfibrils, formedby hexagonal organization of elementary fibrils as was previously shown for the maizecell wall [11]. Then, assuming that the smaller fibers are preferentially destructed, wecould simultaneously explain the average core radius and the average crystallite size in-crease. It should be also noted that obtained value for the fiber length of the initial poplar

2
26 REFERENCES
material in wet state considerably deviates from the other materials.For the initial poplar material we could not match the SAXS curve with the fixed fiber
length; we had to fit it as free parameter. The only possible explanation is that the mate-rial contains closed elongated pores. Since the pores would have scattering contrast withthe average scattering length density of the material (∆ρpor e ≈ 11×1010cm−2), a volumefraction as low as 0.005 would be sufficient to cause this effect.
2.5. CONCLUSIONSWe have successfully applied small-angle scattering and X-ray diffraction, combinedwith nitrogen absorption and light microscopy, to investigate changes in the structureof poplar biomass due to pretreatment by sulfuric acid of two different concentrations("mild" and "severe" pretreatment). During the pretreatment we observe a decrease inparticle size, crystalline core radius of elementary fibrils, and about twofold decreasein cellulose crystallinity index. Simultaneously, from nitrogen absorption measured ac-cording to the Brunauer-Emmett-Teller method, we see an increase of the specific sur-face area; it agrees with our findings from light microscopy and small-angle X-ray scat-tering. The glucose yield after enzymatic hydrolysis following the pretreatment, im-proves from 1% to 50% after mild pretreatment and up to 70% after the severe pretreat-ment.
Our results suggest that the main structural features responsible for optimum cellu-lose digestion are the crystallinity index of cellulose and the specific surface area of thematerial. An acidic pretreatment gives a decrease in crystallinity by a factor of about 2;the severity of the pretreatment hardly affects it. However, the severity of the pretreat-ment does affect the specific surface area: we have seen that the more severe treatmentgives a higher specific surface area of the cellulose feedstock, attributed to a lower overallparticle size. It agrees with our findings from light microscopy. The reduction in parti-cle size makes it better accessible to enzymes, giving a higher glucose yield. We believethat the method of estimating specific surface area from the SAXS data on the materi-als in their native wet state could facilitate the sustainable applications of lignocellulosicbiomass.
REFERENCES[1] J. Hill, E. Nelson, D. Tilman, S. Polasky, and D. Tiffany, Environmental, economic,
and energetic costs and benefits of biodiesel and ethanol biofuels, Proceedings of theNational Academy of Sciences 103, 11206 (2006).
[2] M. Hoel and S. Kverndokk, Depletion of fossil fuels and the impacts of global warm-ing, Resource and Energy Economics 18, 115 (1996).
[3] A. J. Ragauskas, The Path Forward for Biofuels and Biomaterials, Science 311, 484(2006).
[4] C. Wyman, S. Decker, M. Himmel, J. Brady, C. Skopec, and L. Viikari, Hydrolysis ofCellulose and Hemicellulose, in Polysaccharides, Chapter 43 (CRC Press, 2004) pp.994–1033.

REFERENCES
2
27
[5] M. Martínez-Sanz, P. Lopez-Sanchez, M. J. Gidley, and E. P. Gilbert, Evidencefor differential interaction mechanism of plant cell wall matrix polysaccharides inhierarchically-structured bacterial cellulose, Cellulose 22, 1541 (2015).
[6] T. Cui, J. Li, Z. Yan, M. Yu, and S. Li, The correlation between the enzymatic sac-charification and the multidimensional structure of cellulose changed by differentpretreatments, Biotechnology for Biofuels 7, 134 (2014).
[7] M. Martínez-Sanz, M. J. Gidley, and E. P. Gilbert, Hierarchical architecture of bac-terial cellulose and composite plant cell wall polysaccharide hydrogels using smallangle neutron scattering, Soft Matter 12, 1534 (2016).
[8] D. Klemm, B. Heublein, H.-P. Fink, and A. Bohn, Cellulose: Fascinating Biopolymerand Sustainable Raw Material, Angewandte Chemie International Edition 44, 3358(2005), arXiv:0402594v3 [arXiv:cond-mat] .
[9] A. Mittal, R. Katahira, M. E. Himmel, and D. K. Johnson, Effects of alkaline or liquid-ammonia treatment on crystalline cellulose: changes in crystalline structure and ef-fects on enzymatic digestibility, Biotechnology for Biofuels 4, 41 (2011).
[10] R. E. Quiroz-Castañeda and J. L. Folch-Mallol, Hydrolysis of biomass mediated bycellulases for the production of sugars, Sustainable Degradation of LignocellulosicBiomass - Techniques, Applications and Commercialization , 119 (2013).
[11] S.-Y. Ding and M. E. Himmel, The maize primary cell wall microfibril: a new modelderived from direct visualization. J Agric Food Chem 54, 597 (2006).
[12] S.-Y. Ding, Y.-S. Liu, Y. Zeng, M. E. Himmel, J. O. Baker, and E. A. Bayer, How DoesPlant Cell Wall Nanoscale Architecture Correlate with Enzymatic Digestibility? Sci-ence 338, 1055 (2012).
[13] M. Foston and A. J. Ragauskas, Biomass Characterization: Recent Progress in Under-standing Biomass Recalcitrance, Industrial Biotechnology 8, 191 (2012).
[14] L. Hu, L. Lin, Z. Wu, S. Zhou, and S. Liu, Chemocatalytic hydrolysis of cellulose intoglucose over solid acid catalysts, Applied Catalysis B: Environmental 174-175, 225(2015).
[15] P. Gilna, L. R. Lynd, D. Mohnen, M. F. Davis, and B. H. Davison, Progress in under-standing and overcoming biomass recalcitrance: a BioEnergy Science Center (BESC)perspective, Biotechnology for Biofuels 10, 285 (2017).
[16] Q. Sun, M. Foston, X. Meng, D. Sawada, S. V. Pingali, H. M. O’Neill, H. Li, C. E.Wyman, P. Langan, A. J. Ragauskas, and R. Kumar, Effect of lignin content onchanges occurring in poplar cellulose ultrastructure during dilute acid pretreatment,Biotechnology for Biofuels 7, 150 (2014).
[17] M. E. Himmel, S.-Y. Ding, D. K. Johnson, W. S. Adney, M. R. Nimlos, J. W. Brady,and T. D. Foust, Biomass Recalcitrance: Engineering Plants and Enzymes for BiofuelsProduction, Science 315, 804 (2007).

2
28 REFERENCES
[18] C. C. Kwan, M. Ghadiri, D. G. D. Papadopoulos, A. C. Bentham, B. Chih, C. C. Kwan,M. Ghadiri, D. G. D. Papadopoulos, and A. C. Bentham, The Effects of OperatingConditions on the Milling of Microcrystalline Cellulose, Chemical Engineering &Technology 26, 185 (2003).
[19] R. Sun, L. Mott, and J. Bolton, Isolation and Fractional Characterization of Ball-Milled and Enzyme Lignins from Oil Palm Trunk, J. Agric. Food Chem. 46, 718(1998).
[20] X.-F. Sun, Sun, P. Fowler, and M. S. Baird, Extraction and Characterization of Origi-nal Lignin and Hemicelluloses from Wheat Straw, Journal of Agricultural and FoodChemistry 53, 860 (2005).
[21] H. Zhao, J. H. Kwak, Y. Wang, J. A. Franz, J. M. White, and J. E. Holladay, Effects ofCrystallinity on Dilute Acid Hydrolysis of Cellulose by Cellulose Ball-Milling Study,Energy & Fuels 20, 807 (2006).
[22] M. a. Kabel, H. van den Borne, J.-P. Vincken, A. G. J. Voragen, and H. a. Schols,Structural differences of xylans affect their interaction with cellulose, CarbohydratePolymers 69, 94 (2007).
[23] P. Kumar, D. M. Barrett, M. J. Delwiche, and P. Stroeve, Methods for Pretreatment ofLignocellulosic Biomass for Efficient Hydrolysis and Biofuel Production, Industrial &Engineering Chemistry Research 48, 3713 (2009), arXiv:787532 .
[24] G. Bali, X. Meng, J. I. Deneff, Q. Sun, and A. J. Ragauskas, The effect of alkalinepretreatment methods on cellulose structure and accessibility, ChemSusChem 8, 275(2015).
[25] Y. Pu, F. Hu, F. Huang, B. H. Davison, and A. J. Ragauskas, Assessing the molecularstructure basis for biomass recalcitrance during dilute acid and hydrothermal pre-treatments. Biotechnology for biofuels 6, 15 (2013).
[26] M. Pedersen and A. S. Meyer, Lignocellulose pretreatment severity - relating pH tobiomatrix opening, New Biotechnology 27, 739 (2010).
[27] A. T. W. M. Hendriks and G. Zeeman, Pretreatments to enhance the digestibility oflignocellulosic biomass, Bioresource Technology 100, 10 (2009), arXiv:1579-4377 .
[28] B. S. Donohoe, S. R. Decker, M. P. Tucker, M. E. Himmel, and T. B. Vinzant, Visual-izing lignin coalescence and migration through maize cell walls following thermo-chemical pretreatment, Biotechnology and Bioengineering 101, 913 (2008).
[29] P.-L. Tang, P. M. Abdul, N. S. Engliman, and O. Hassan, Effects of pretreatment andenzyme cocktail composition on the sugars production from oil palm empty fruitbunch fiber (OPEFBF), Cellulose (2018), 10.1007/s10570-018-1894-0.
[30] P. Bansal, M. Hall, M. J. Realff, J. H. Lee, and A. S. Bommarius, Multivariate sta-tistical analysis of X-ray data from cellulose: A new method to determine degree ofcrystallinity and predict hydrolysis rates, Bioresource Technology 101, 4461 (2010).

REFERENCES
2
29
[31] S. Park, J. O. Baker, M. E. Himmel, P. A. Parilla, and D. K. Johnson, Cellulose crys-tallinity index: measurement techniques and their impact on interpreting cellulaseperformance. Biotechnology for biofuels 3, 10 (2010).
[32] C. Cateto, G. Hu, and A. Ragauskas, Enzymatic hydrolysis of organosolv Kanlowswitchgrass and its impact on cellulose crystallinity and degree of polymerization,Energy & Environmental Science 4, 1516 (2011).
[33] Y. Sun, L. Lin, H. Deng, J. Li, B. He, R. Sun, and P. Ouyang, Structural Changes ofBamboo CelluloseE in Formic Acid, BioResources 3, 297 (2008).
[34] D. N. Thompson, H. C. Chen, and H. E. Grethlein, Comparison of pretreatmentmethods on the basis of available surface area, Bioresource Technology 39, 155(1992).
[35] S. V. Pingali, V. S. Urban, W. T. Heller, J. McGaughey, H. O’Neill, M. B. Foston, H. Li,C. E. Wyman, D. A. Myles, P. Langan, A. Ragauskas, B. Davison, and B. R. Evans,Understanding Multiscale Structural Changes During Dilute Acid Pretreatment ofSwitchgrass and Poplar, ACS Sustainable Chemistry & Engineering 5, 426 (2017).
[36] Y. Habibi, L. A. Lucia, and O. J. Rojas, Cellulose nanocrystals: chemistry, self-assembly, and applications. Chemical reviews 110, 3479 (2010).
[37] N. Lavoine, I. Desloges, A. Dufresne, and J. Bras, Microfibrillated cellulose – Its bar-rier properties and applications in cellulosic materials: A review, Carbohydrate Poly-mers 90, 735 (2012).
[38] M. Martínez-Sanz, F. Pettolino, B. Flanagan, M. J. Gidley, and E. P. Gilbert, Struc-ture of cellulose microfibrils in mature cotton fibres, Carbohydrate Polymers 175,450 (2017).
[39] K. Leppänen, S. Andersson, M. Torkkeli, M. Knaapila, N. Kotelnikova, and R. Seri-maa, Structure of cellulose and microcrystalline cellulose from various wood species,cotton and flax studied by X-ray scattering, Cellulose 16, 999 (2009).
[40] F. Xu, Y.-C. Shi, and D. Wang, X-ray scattering studies of lignocellulosic biomass: Areview, Carbohydrate Polymers 94, 904 (2013).
[41] P. A. Penttilä, T. Imai, M. Capron, M. Mizuno, Y. Amano, R. Schweins, andJ. Sugiyama, Multimethod approach to understand the assembly of cellulose fibrilsin the biosynthesis of bacterial cellulose, Cellulose 25, 2771 (2018).
[42] M. Martínez-Sanz, D. Mikkelsen, B. M. Flanagan, C. Rehm, L. de Campo, M. J. Gi-dley, and E. P. Gilbert, Investigation of the micro- and nano-scale architecture ofcellulose hydrogels with plant cell wall polysaccharides: A combined USANS/SANSstudy, Polymer 105, 449 (2016).
[43] A. C. de Souza, T. Rietkerk, C. G. Selin, and P. P. Lankhorst, A robust and universalNMR method for the compositional analysis of polysaccharides, Carbohydrate Poly-mers 95, 657 (2013).

2
30 REFERENCES
[44] R. Teeeer, R. Serimaa, and T. Paakkarl, Crystallinity of cellulose, as determined byCP/MAS NMR and XRD methods, Polymer Bulletin 17, 231 (1987), arXiv:bk-31 .
[45] N. Wang, E. Ding, and R. Cheng, Thermal degradation behaviors of spherical cellu-lose nanocrystals with sulfate groups, Polymer 48, 3486 (2007).
[46] M. Poletto, A. J. Zattera, M. M. C. Forte, and R. M. C. Santana, Thermal decompo-sition of wood: Influence of wood components and cellulose crystallite size, Biore-source Technology 109, 148 (2012).
[47] M.-C. Popescu, C.-M. Popescu, G. Lisa, and Y. Sakata, Evaluation of morphologicaland chemical aspects of different wood species by spectroscopy and thermal methods,Journal of Molecular Structure 988, 65 (2011).
[48] A. L. Patterson, The Scherrer Formula for X-Ray Particle Size Determination, PhysicalReview 56, 978 (1939), arXiv:arXiv:1011.1669v3 .
[49] T. Narayanan, O. Diat, and P. Bösecke, SAXS and USAXS on the high brilliance beam-line at the ESRF, Nuclear Instruments and Methods in Physics Research Section A:Accelerators, Spectrometers, Detectors and Associated Equipment 467-468, 1005(2001).
[50] G. Porod, Die Röntgenkleinwinkelstreuung von dichtgepackten kolloiden Systemen,Colloid & Polymer Science 2 (1951).
[51] M. Doucet, J. H. Cho, G. Alina, J. Bakker, W. Bouwman, P. Butler, K. Campbell,M. Gonzales, R. Heenan, A. Jackson, P. Juhas, S. King, P. Kienzle, J. Krzywon, A. Mark-vardsen, T. Nielsen, L. O’Driscoll, W. Potrzebowski, R. Ferraz Leal, T. Richter, P. Rozy-cko, T. Snow, and A. Washington, Sasview version 4.2, (2018).
[52] M. Martínez-Sanz, M. J. Gidley, and E. P. Gilbert, Application of X-ray and neu-tron small angle scattering techniques to study the hierarchical structure of plantcell walls: A review, Carbohydrate Polymers 125, 120 (2015).
[53] S. Brunauer, P. H. Emmett, and E. Teller, Adsorption of Gases in Multi-molecular Layers, Journal of the American Chemical Society 60, 309 (1938),arXiv:arXiv:1011.1669v3 .
[54] P. Sannigrahi, A. J. Ragauskas, and G. A. Tuskan, Poplar as a feedstock for biofuels:A review of compositional characteristics, Biofuels, Bioproducts and Biorefining 4,209 (2010), arXiv:bk-16a .
[55] U. Vainio, N. Maximova, B. Hortling, J. Laine, P. Stenius, L. K. Simola, J. Gravitis, andR. Serimaa, Morphology of Dry Lignins and Size and Shape of Dissolved Kraft LigninParticles by X-ray Scattering, Langmuir 20, 9736 (2004).
[56] R. H. Atalla and D. L. Vanderhart, Native Cellulose: A Composite of Two Distinct Crys-talline Forms, Science 223, 283 (1984).

REFERENCES
2
31
[57] M. Wada, T. Okano, and J. Sugiyama, Allomorphs of native crystalline cellulose Ievaluated by two equatoriald-spacings, Journal of Wood Science 47, 124 (2001).
[58] L. Segal, J. Creely, A. Martin, and C. Conrad, An Empirical Method for Estimatingthe Degree of Crystallinity of Native Cellulose Using the X-Ray Diffractometer, TextileResearch Journal 29, 786 (1959).


3A VERSATILE SHEAR CELL FOR
INVESTIGATION OF STRUCTURE OF
FOOD MATERIALS UNDER SHEAR
A versatile cell for X-ray and neutron scattering experiments on samples under shear hasbeen designed. To our knowledge, it is the first shear cell which can be used for both SAXSand SANS in respectively synchrotron or reactor beamlines. The cell is mainly intendedfor scattering experiments in so-called "1-2 plane geometry", but can also be modifiedinto cone-plate and plate-plate rheological geometries, giving access to the 1-3 scatteringplane. The latter two geometries, however, can only be used with neutron scattering. Thefinal cell design is compact, which allows it to be used even with lab-based X-ray sources.A special thermostatic shell allows for the temperature control of the samples under inves-tigation in the range from 5 up to 100C. Several X-ray and neutron scattering experimentsperformed with the cell have helped in better understanding of the structuring under shearof food materials, such as: cellulose suspensions, fat crystal networks and milk proteins.
This chapter has been published in Colloids and Surfaces A 566, 21-28 (2019) [1].
33

3
343. A VERSATILE SHEAR CELL FOR INVESTIGATION OF STRUCTURE OF FOOD MATERIALS
UNDER SHEAR
3.1. INTRODUCTIONA major challenge for food science is to reconcile the societal drive towards sustain-able food production with the consumers demand for natural, stable and superior tast-ing foods [2]. Conventional routes for food manufacturing have been optimized overdecades and have reached their limits. The required radical redesign of food formula-tion and processing routes requires deepened insights in relationships between productstructure and functionality [3]. When processing raw materials to final consumer foodproducts, their structures undergo changes at multiple length scales [4, 5]. A prerequisitefor rational redesign of food processing routes is to have insights in how these hierarchi-cal multiscale structures evolve under dynamic condition [4].
Small-angle scattering (SAS) of X-rays (SAXS) and neutrons (SANS) is widely utilizedto study structures of food colloids ([6–11]). A number of works has also been doneon application of these techniques on materials under shear or flow conditions [12,13]. Both methods, SAXS and SANS [14] are capable of investigations on nano- andmesoscale size range, moreover, by utilizing a spin-echo principle for SANS encoding(SESANS [15]), the range can be extended up to 20 µm. However, these methods havecertain advantages and disadvantages related to the employed type of radiation. X-raysinteract with electron clouds of atoms, which leads to linear dependency of scatteringpower on the atomic number of the element. Neutrons interact with atom nuclei, whichcauses different scattering power for different isotopes of the same chemical element.This effect is widely employed in experiments with contrast variation. Moreover, due tothe weak interaction of neutrons with matter, rather bulky samples can be studied withneutron scattering. Since X-rays are easy to generate, a multitude of laboratory-scaleplug-and-play SAXS instruments came to the market in recent years. Compact neutronsources are still under development and SANS experiments still require large-facilitieslike nuclear reactors, or spallation sources. Synchrotrons, large-facilities generating X-ray are also open for SAXS experiments. One of the great advantages of synchrotrons istheir high flux of X-rays, which is 6-7 orders of magnitude higher than average flux ofneutrons at neutron large-facilities. Such a high flux allows for a very high time resolu-tion, as well as high spatial resolution of the experiment, as X-ray beam at synchrotroncan easily be focused to 100 µm, or, with special optics, even to a few nm. However,such high flux might be a considerable disadvantage in studies of soft matter, as samplescan easily get radiation damage or even destroyed within a fraction of a second. Takinginto account compatibility of X-rays and neutrons, we decided to make our shear-cellsuitable for both kind of radiation, so that we could perform (SE)SANS and SAXS exper-iments on complex fluids under the same conditions. In the following the cells, suitablefor either SANS or SAXS on the samples under shear, will be called shear-SAS cells.
Table 3.1 gives an overview of the shear-SAS cells described in the literature. As canbe seen, the most popular cell geometry is Taylor-Couette, which allows for radial andtangential passage of the beam along the cell (for more details of various cell geome-tries as well as scattering planes see the review [13]). Depending on the direction ofthe beam relative to the shear cell, three different scattering geometries are possible.Figure 3.1 shows three possible scattering geometries based on the Taylor-Couette cell.AntonPaar was the first company able to combine a rheometer with a suitable Taylor-Couette cell with small-angle scattering of X-rays [16], a few years later simultaneous

3.1. INTRODUCTION
3
35
Figure 3.1: The common Taylor-Couette flow cell geometries with accessible scattering planes. (a) Rectilinearcoordinate frame where the 1-, 2-, and 3-directions are defined as the velocity (V ), velocity gradient (∆V ),and vorticity (ω) directions, respectively. (b), (c), and (d) are the radial, tangential, and 1–2 plane flow cellgeometries that allow for scattering along the 1–3, 2–3, and 1–2 planes, respectively. In the latter, an incidentbeam cross-section smaller than the fluid gap allows for spatial resolution along the gap. The Figure is adoptedfrom [13]
SANS and torque measurements were performed with a rheometer of Rheowis-Fluid(Labplus, Jona, Switzerland) [17]. Another way of evolution of shear-SAS cells was a de-velopment of so-called "1-2 plane shear cell"[18, 19]. As such a cell allows spatial reso-lution along the shear-gradient direction across the gap, it is very attractive for investi-gation of materials showing shear-banding [18, 20–23]. However, this geometry does notallow for a simultaneous torque measurement, as the cell is placed horizontally, while allof the existing rheometers are vertical. For our design we decided to omit possibility fora simultaneous torque measurement and chose for horizontal cell geometry.
In this article we present detailed design of the versatile shear-cell suitable for SAXS,SANS and SESANS measurements. Three examples of shear-SAS cell application forstudies of food colloids are presented in the experimental section. Although in our re-search we focused mostly on application of the shear-SAS cell for investigation of foodcolloidal dispersions, the applications can be extended to the much broader field of softmatter.
Figure 3.2 shows a schematic drawing of the developed shear-SAS cell and Figure 3.9shows an image of the cell mounted at the SAXS DUBBLE (BM-26) beamline at ESRF [37,38]. As can be seen from Figure 3.9, the cell with its drive and motor is rather compact(it can fit in a box of 25×25×25 cm3), which makes it easy in transportation, it even hasbeen transported as hand luggage on an airplane. The compactness made it possibleto mount it on various beamlines and even laboratory X-ray sources (see section 3.2.1).The cell consists of an inner rotating disk (rotor) and an outer stable container (stator),leaving a gap which is filled up with the material under investigation. Rotor and statorare both made of aluminum.

3
363. A VERSATILE SHEAR CELL FOR INVESTIGATION OF STRUCTURE OF FOOD MATERIALS
UNDER SHEAR
Figure 3.2: A schematic 3D drawing of the developed shear-cell (a) and a vertical cross section of it along therotation axis of the cell.

3.1. INTRODUCTION
3
37
Table 3.1: Shear-SAS cells described in the literature.
Source Simultaneous Type of Cell Scatteringtorque radiation geometry plane(s)meausurement
[24] - neutrons Taylor-Couette 1-3[25] - neutrons Taylor-Couette 1-3[26] - neutrons Taylor-Couette 1-3[27] - neutrons Taylor-Couette 1-3[28] - X-rays plate-plate 1-2[29] - neutrons plate-plate 1-2[30] - neutrons plate-plate 1-3[31] - X-rays Taylor-Couette 1-3, 2-3[32] - neutrons Taylor-Couette 1-2[16] + X-rays Taylor-Couette 1-3, 2-3[18, 19] - neutrons Taylor-Couette 1-2[17] + neutrons Taylor-Couette 1-3, 2-3[33] + X-rays plate-plate 1-3[34] + neutrons Taylor-Couette 1-3, 2-3[35] + X-rays Sliding plate 1-2[36] + neutrons Taylor-Couette 1-3, 2-3
3.1.1. FIT FOR NEUTRONS AND X-RAYSIn order to make the cell suitable for X-rays and neutrons, special types of windows werenecessary for each type of radiation. In case of neutrons 0.4 mm thick aluminum win-dows with accessible area 10×17 mm2 are integrated in the cell design. Figure 3.3 showsa 2D (a) and 1D (b) SANS patterns from the empty shear cell. For X-rays two circu-lar diamond windows with 0.2 mm thickness and 6 mm diameter were created, whichgive hardly any background scattering (see Figure 3.3(c,d)). For visual inspection of thesample and potential light scattering applications, 1 mm thick quartz windows with ac-cessible area 8×15 mm2 were added to the cell design. Figure 3.10 shows the windowspositions on the cell. It should be noted, that in order to obtain the most homogeneoussample flow at the measurement position, the cell should be positioned in such a waythat required window appears on the side of the cell (on the Figure 3.10(a) Quartz andDiamond windows are in the right position).As the cell is also intended to be used for SESANS measurement, we had to minimizemagnetic fields appearing due to motor driving the cell. At the current distance betweenthe aluminum window of the cell and the motor (20 cm) we did not observe any effectsof the motor magnetic field on the neutron beam polarization.
3.1.2. SHEAR-SAS CELL GEOMETRIESThe cell is mainly intended to probe the so-called 1-2 scattering plane of the complexfluids. The Taylor-Couette cell geometry for this application is similar to one describedin [19] with the additional possibility for the SAXS experiments. This geometry in com-
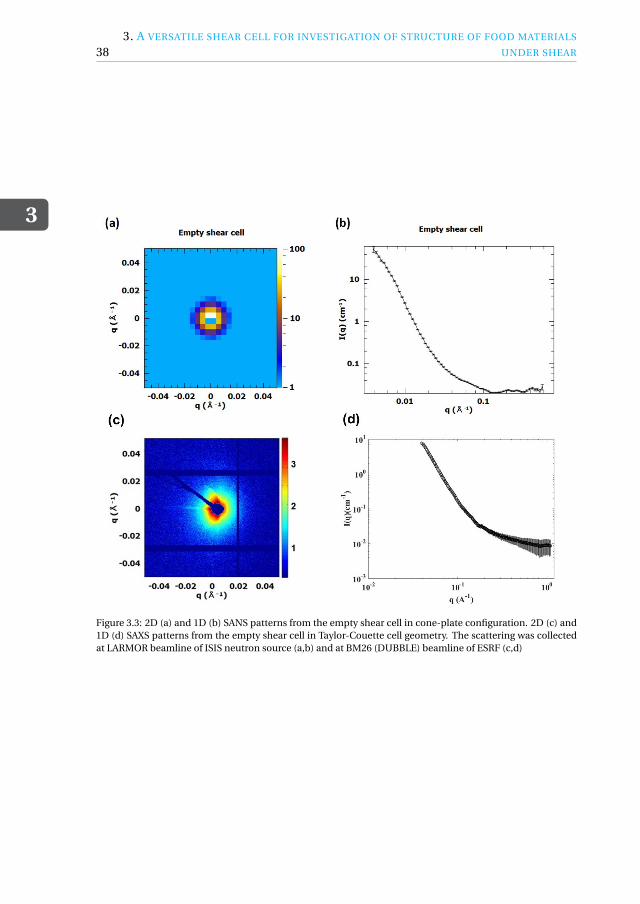
3
383. A VERSATILE SHEAR CELL FOR INVESTIGATION OF STRUCTURE OF FOOD MATERIALS
UNDER SHEAR
Figure 3.3: 2D (a) and 1D (b) SANS patterns from the empty shear cell in cone-plate configuration. 2D (c) and1D (d) SAXS patterns from the empty shear cell in Taylor-Couette cell geometry. The scattering was collectedat LARMOR beamline of ISIS neutron source (a,b) and at BM26 (DUBBLE) beamline of ESRF (c,d)

3.1. INTRODUCTION
3
39
Figure 3.4: Geometries of the cell: (a) Taylor-Couette geometry, (b) cone-plate geometry, and (c) plate-plategeometry. The top row shows a cross section of the entire cell, the stators and rotors for respective geometriesare shown in the middle row with their respective cross sections in the bottom row. Blue arrows show wherethe stators and rotors appear on the drawings of the cross sections. L is a sample thickness on the beam, d is adiameter of the rotor, D is an inner diameter of the housing ring, and α is the cone angle
bination with intensive neutron or X-ray beam allows for spatially-resolved SAXS/SANSmeasurements across the gap. Moreover, since the cell is made of aluminum, which isrelatively transparent for neutrons, we decided to use this advantage and extend the celldesign to two more geometries, namely cone-plate and plate-plate. All three geometriesare shown in Figure 3.4.
In the Taylor-Couette geometry, the shear-SAS cell allows access to so-called 1-2 scat-tering plane, which in combination with intensive beams allows for spatially-resolvedSAXS/SANS measurements across the gap. Therefore, it is possible to locally probe struc-ture of the material under investigation. By varying thicknesses of the rotor and outerring, it is possible to achieve different sample thicknesses along the beam L. However,the minimal value of L is 4 mm due to mechanical limitations. The gap size between therotor and the ring also can be varied by varying the rotor diameter d . In our experimentswe were using a gap size of 1 mm. It can be increased up to 6 mm for x-ray experimentsand up to 15 mm for experiments with neutrons.

3
403. A VERSATILE SHEAR CELL FOR INVESTIGATION OF STRUCTURE OF FOOD MATERIALS
UNDER SHEAR
In plate-plate or cone-plate geometry the scattering pattern appears in 1-3 scatter-ing plane. In this case the beam is going through the sample along the shear-gradientdirection and the scattering pattern is integrated over all shear rates present in the sys-tem. In this case the sample thickness along the beam can be varied either by changingthe thickness of the rotor or by changing the cone angle α. The cone angle can be variedbetween 1 and 10. In our experiments we were using α= 3.
In all three geometries, the surfaces of the rotor and the stator can be made smooth,sand-blasted, or serrated, depending on roughness desired for the planned experiment.
3.1.3. TEMPERATURE CONTROL
Since rheology and structure of food is highly dependent on temperature and tempera-ture history of the material, we included a special housing for temperature control of thecell in our design. A thermostatic shell was designed for this purpose. The shell is madeof 1 mm thick nylon 12 with copper insertions for better temperature exchange. Thenylon parts of the cell were 3D-printed and the copper insertions were glued to themwith a temperature-resistant glue. The internal surface of the shell follows the shape ofthe shear cell and has maximal available contact surface area with the cell. The shell ishollow, which allows for the flow of a cooling or heating liquid with desired temperaturethrough it. For temperature measurements a K-type thermocouple is used. Figure 3.11shows a cross section of the cell in the thermostatic shell as well as the internal surfaceof the shell with copper insertions.
3.2. EXPERIMENTAL RESULTS AND DISCUSSION
A couple of in-situ experiments were conducted so far: one at the DUBBLE beamlineat ESRF [37, 38] and one at the LARMOR instrument at ISIS. In the first case the Taylor-Cuette geometry was used in combination with X-ray scattering for investigation of cel-lulose dispersions and fat crystal dispersions. In the second experiment protein disper-sions were studied in plate-plate and cone-plate geometry with aid of neutron scattering.
3.2.1. X-RAYS: MICROFIBRILLATED CELLULOSE DISPERSIONS
So-called non-local flow behaviour of microfibrillated cellulose was observed by Rheo-MRI [39]: the viscosity of the sample was dependent on the position across the cellgap. This can be explained by a formation of flocks of microfibrills, or a formation ofan aligned liquid crystal phase.
In order to check these two models, we have performed a shear-SAXS experiment atthe BM-26 (DUBBLE) beamline at ESRF [1]. Figure 3.5 shows typical scattering patternsfor a sample of microfibrillated bacterial cellulose stabilized by carboxymethylcellulose(BC-CMC) at high and low shear rates. The scattering patterns appear to be isotropicat both shear rates. This result indicates absence of aligned liquid crystal phase, andsustaines the flocculation model as the explanation for the position dependent viscosity.

3.2. EXPERIMENTAL RESULTS AND DISCUSSION
3
41
Figure 3.5: 2D SAXS patterns for a sample of microfibrillated bacterial cellulose (BC) with carboxymethylcel-lulose (CMC) with a concentration of BC 0.2 % wt. and ratio BC:CMC = 4:1 at 1 (left) and 100 (right) s−1. Thepatterns are shown for a point in the middle of the cell gap
3.2.2. X-RAYS: in situ VIEW ON FAT CRYSTAL NETWORK FORMATION
Stability and sensorial quality of fat-based products, such as butter and margarine, aredefined by the underlying multiscale structure of fat crystal networks [8]. A novel routeto design the fat crystal structure is based on dispersing micronized fat crystal (MFC)nanoplatelets in oil [11, 40]. In this way, the crystallisation of the fat crystal nanoplateletscan be decoupled from the aggregation of fat crystals into larger structures, which couldradically simplify manufacturing of food manufacturing routes. However, rational de-sign of these routes is challenging, since kinetics of multiscale network formation isstrongly determined by temperature and shear [41]. The developed shear cell was em-ployed to assess kinetics of fat crystal mesoscale networks in well-controlled shear stressfields at different temperatures [11, 42].
Figure 3.6(a) shows the 2D SAXS pattern and an radial integration of the first orderdiffraction peak obtained under imposed shear 0.1 s−1 at the BM-26 (DUBBLE) beam-line at ESRF. The rheo-SAXS experiment revealed the alignment of the dispersed MFCnanoplatelets under shear. As most of the information about individual MFC nanoplateletslies in the first diffraction peak at scattering vectors q=1.6 nm−1, it was also possibleto perform experiments at a lab-scale X-ray diffractometer Bruker D8-Discover (3.12) .Even though the obtained 2D pattern (3.6(b)) had a different signal to noise ratio, theeffect of shear on the alignment of MFC nanoplatelets could clearly be observed.
The presence of a well resolved first order diffraction peak allowed real-time assess-ment of the increase in average crystal thickness (ACT) of the dispersed MFC nanoplateletsunder shear. The ACT was estimated based on the Scherrer line shape analysis [11, 43].Figure 3.7(a) shows the ACT as a function of time under imposed constant shear of 0.1 s−1

3
423. A VERSATILE SHEAR CELL FOR INVESTIGATION OF STRUCTURE OF FOOD MATERIALS
UNDER SHEAR
Figure 3.6: 2D SAXS patterns and their radial averages presented in the Intensity vs Azimuth angle plots forMFC nanoplatelets dispersed in sunflower oil obtained at the BM-26 (DUBBLE) beamline at ESRF (a) and atthe lab-scale Bruker D8-Discover X-ray diffractometer (b). Both experiments were performed in the developedCouette geometry with serrated walls at an imposed shear rate of 0.1 s−1 and ambient temperatures

3.3. CONCLUSIONS
3
43
at ambient temperature. The scattering patterns were obtained at the BM-26 (DUBBLE)beamline at ESRF. The increase in ACT during 8-13 hours of shear points toward shearinduced recrystallisation of the MFC nanoplatelets. This recrystallisation effect was alsoobserved in a shear-SAXS experiment at D8-Discover diffractometer, albeit with lowersignal to noise ratio (see Figure 3.7(a)).
The performance of the variable temperature capability of the shear cell is illustratedby Figure 3.7(b). MFC dispersions were measured at 20 and 26C with the shear cellmounted in a lab scale Discover D8 diffractometer for 13 hours under constant shear of1 s−1. Even with this lab scale instrument kinetic curves could be obtained that allowobservation of two recrystallisation stages of which one is clearly temperature depen-dent (see Figure 3.7(b)) [11, 42]. The availability of the rheo-SAXS cell with variable tem-perature capability which can versatile be mounted in both synchrotron beamlines andlabscale instruments has been an important enabler of studies investigated fat crystalnetwork formation [11, 42]. In future work we expect that the cell will also be deployedin combination with Ultra Small Angle X-rays Scattering (USAXS) to provide unprece-dented views on network formation in the micronscale domain.
3.2.3. NEUTRONS: PROTEIN DISPERSIONSManski.et al [44] found a way to produce fibrous structure from calcium caseinate dis-persion by applying simple shear, heat and enzyme transglutaminase. In order to inves-tigate the structuring of calcium caseinate dispersions under shear, we have designedand performed a small-angle neutron scattering experiment [45]. The experiment wasconducted at the LARMOR instrument at ISIS.
Figure 3.8a shows the typical scattering patterns of the sample. All data were reducedwith their corresponding background, for the shear-cell, the background is the cell filledwith H2O. A nearly perfect overlap between the sample measured ex-situ and at 0 s−1
inside the shear-cell confirmed the shear-cell did not interfere with the sample. Surpris-ingly, the scattering pattern obtained at a shear rate as high as 100 s−1 also overlappedperfectly with the others, indicating shear had no influence on the sample structure atthe length scale studied. Moreover, the scattering is isotropic at all shear rates, as theradially averaged scattering intensity in Figure 3.8b shows.
3.3. CONCLUSIONSWe have designed and built a versatile compact shear cell to perform SAXS, SANS andSESANS measurements with temperature control. The experimental section of the arti-cle has shown applications of the designed shear cell in studies of food materials. Each ofthe obtained results provides a valuable insight into structuring of the soft matter undershear, relevant to both fundamental and applied sciences.
REFERENCES[1] E. Velichko, B. Tian, T. Nikolaeva, J. Koning, J. van Duynhoven, and W. G. Bouwman,
A versatile shear cell for investigation of structure of food materials under shear, Col-loids and Surfaces A: Physicochemical and Engineering Aspects 566, 21 (2019).

3
44 REFERENCES
Figure 3.7: (a) A comparison of the ACT data as a function of time obtained at the BM-26 (DUBBLE) beamlineat ESRF (solid symbols) and at the lab-scale X-ray diffractometer Bruker D8-Discover (empty symbols). Bothexperiments were done for MFC nanoplatelets dispersed in sunflower oil in the developed Couette geometrywith serrated walls at an imposed shear rate of 0.1 s−1 and ambient temperatures. (b) ACT as a function oftime for MFC nanoplatelets dispersed in bean oil at an imposed shear rate of 1 s−1 and temperatures of 20C(solid symbols) and 26C (empty symbols). The measurements were performed in a rheo-SAXS Couette cellgeometry (1 mm gap) at the D8-Discover

REFERENCES
3
45
Figure 3.8: Scattering patterns of 15%w/w calcium caseinate dissolved in H2O (SH). (a): 1D scattering patternsof the sample sheared at 0, 100 −1 and ex-situ; (b) Intensities of sector-cut from the 2D patterns of the samplesheared at 100 −1 (inset).
[2] A. J. van der Goot, P. J. Pelgrom, J. A. Berghout, M. E. Geerts, L. Jankowiak, N. A.Hardt, J. Keijer, M. A. Schutyser, C. V. Nikiforidis, and R. M. Boom, Concepts forfurther sustainable production of foods, Journal of Food Engineering 168, 42 (2016).
[3] M. A. Augustin, M. Riley, R. Stockmann, L. Bennett, A. Kahl, T. Lockett, M. Osmond,P. Sanguansri, W. Stonehouse, I. Zajac, and L. Cobiac, Role of food processing in foodand nutrition security, Trends in Food Science & Technology 56, 115 (2016).
[4] J. Ubbink, Soft matter approaches to structured foods: from “cook-and-look” to ra-tional food design? Faraday Discussions 158, 9 (2012).
[5] R. Mezzenga, P. Schurtenberger, A. Burbidge, and M. Michel, Understanding foodsas soft materials, Nature Materials 4, 729 (2005).
[6] J. Doutch and E. P. Gilbert, Characterisation of large scale structures in starch gran-ules via small-angle neutron and X-ray scattering, Carbohydrate Polymers 91, 444(2013).
[7] A. Lopez-Rubio, B. M. Flanagan, A. K. Shrestha, M. J. Gidley, and E. P. Gilbert, Molec-ular Rearrangement Of Starch During In Vitro Digestion: Toward A Better Under-standing Of Enzyme Resistant Starch Formation In Processed Starches, Biomacro-molecules 9, 1951 (2008).
[8] P. R. R. Ramel, F. Peyronel, and A. G. Marangoni, Characterization of the nanoscalestructure of milk fat, Food Chemistry 203, 224 (2016).
[9] F. Peyronel, B. Quinn, A. G. Marangoni, and D. a. Pink, Ultra small angle x-ray scat-tering in complex mixtures of triacylglycerols, Journal of Physics: Condensed Matter26, 464110 (2014).

3
46 REFERENCES
[10] M. Nieuwland, W. G. Bouwman, M. L. Bennink, E. Silletti, and H. H. J. de Jongh,Characterizing Length Scales that Determine the Mechanical Behavior of gels fromCrosslinked Casein Micelles, Food Biophysics (2015), 10.1007/s11483-015-9399-y.
[11] T. Nikolaeva, R. den Adel, E. Velichko, W. G. Bouwman, D. Hermida-Merino, H. VanAs, A. Voda, and J. van Duynhoven, Networks of micronized fat crystals grown understatic conditions, Food & Function 9, 2102 (2018).
[12] J. Vermant and M. J. Solomon, Flow-induced structure in colloidal suspensions, Jour-nal of Physics: Condensed Matter 17, R187 (2005).
[13] A. P. R. Eberle and L. Porcar, Flow-SANS and Rheo-SANS applied to soft matter, Cur-rent Opinion in Colloid & Interface Science 17, 33 (2012).
[14] A. Lopez-Rubio and E. P. Gilbert, Neutron scattering: a natural tool for food scienceand technology research, Trends in Food Science & Technology 20, 576 (2009).
[15] M. T. Rekveldt, J. Plomp, W. G. Bouwman, W. H. Kraan, S. Grigoriev, and M. Blaauw,Spin-echo small angle neutron scattering in Delft, Review of Scientific Instruments76, 033901 (2005).
[16] P. Panine, M. Gradzielski, and T. Narayanan, Combined rheometry and small-anglex-ray scattering, Review of Scientific Instruments 74, 2451 (2003).
[17] J. Stellbrink, B. Lonetti, G. Rother, L. Willner, and D. Richter, Shear induced struc-tures of soft colloids: Rheo-SANS experiments on kinetically frozen PEP–PEO diblockcopolymer micelles, Journal of Physics: Condensed Matter 20, 404206 (2008).
[18] M. W. Liberatore, F. Nettesheim, N. J. Wagner, and L. Porcar, Spatially resolvedsmall-angle neutron scattering in the 1-2 plane: A study of shear-induced phase-separating wormlike micelles, Physical Review E 73, 020504 (2006).
[19] A. K. Gurnon, P. D. Godfrin, N. J. Wagner, A. P. R. Eberle, P. Butler, and L. Porcar, Mea-suring material microstructure under flow using 1-2 plane flow-small angle neutronscattering, Journal of Visualized Experiments 84, e51068 (2014).
[20] M. W. Liberatore, F. Nettesheim, P. A. Vasquez, M. E. Helgeson, N. J. Wagner, E. W.Kaler, L. P. Cook, L. Porcar, and Y. T. Hu, Microstructure and shear rheology of entan-gled wormlike micelles in solution, Journal of Rheology 53, 441 (2009).
[21] M. E. Helgeson, M. D. Reichert, Y. T. Hu, and N. J. Wagner, Relating shear banding,structure, and phase behavior in wormlike micellar solutions, Soft Matter 5, 3858(2009).
[22] M. E. Helgeson, L. Porcar, C. Lopez-Barron, and N. J. Wagner, Direct Observationof Flow-Concentration Coupling in a Shear-Banding Fluid, Physical Review Letters105, 084501 (2010).
[23] K. M. Weigandt, L. Porcar, and D. C. Pozzo, In situ neutron scattering study of struc-tural transitions in fibrin networks under shear deformation, Soft Matter 7, 9992(2011).

REFERENCES
3
47
[24] P. Lindner and R. Oberthür, Apparatus for the investigation of liquid systems in ashear gradient by small angle neutron scattering (SANS), Revue de Physique Ap-pliquée 19, 759 (1984).
[25] G. C. Straty, Apparatus for Neutron Scattering Measurements, Journal of Research ofthe National Institute of Standards and Technology Apparatus 94, 259 (1989).
[26] B. Cummins, P G, Staple, E, Millen and P. J, A Couette shear flow cell for small-angleneutron scattering studies, Measurement Science and Technology 1, 179 (1990).
[27] G. C. Straty, H. J. M. Hanley, and C. J. Glinka, Shearing apparatus for neutron scat-tering studies on fluids: Preliminary results for colloidal suspensions, Journal of Sta-tistical Physics 62, 1015 (1991).
[28] S. Okamoto, K. Saijo, and T. Hashimoto, Dynamic SAXS Studies of Sphere-FormingBlock Copolymers under Large Oscillatory Shear Deformation, Macromolecules 27,3753 (1994).
[29] L. Noirez and A. Lapp, Shear Flow Induced Transition from Liquid-Crystalline toPolymer Behavior in Side-Chain Liquid Crystal Polymers, Physical Review Letters78, 70 (1997).
[30] C. Dux, S. Musa, V. Reus, H. Versmold, D. Schwahn, and P. Lindner, Small angleneutron scattering experiments from colloidal dispersions at rest and under shearedconditions, The Journal of Chemical Physics 109, 2556 (1998).
[31] F. Molino, J.-F. Berret, G. Porte, O. Diat, and P. Lindner, Identification of flow mech-anisms for a soft crystal, The European Physical Journal B 3, 59 (1998).
[32] L. Porcar, W. A. Hamilton, P. D. Butler, and G. G. Warr, A vapor barrier Couette shearcell for small angle neutron scattering measurements, Review of Scientific Instru-ments 73, 2345 (2002).
[33] B. Struth, K. Hyun, E. Kats, T. Meins, M. Walther, M. Wilhelm, and G. Grübel, Ob-servation of new states of liquid crystal 8CB under nonlinear shear conditions as ob-served via a novel and unique rheology/small-angle X-ray scattering combination,Langmuir 27, 2880 (2011).
[34] L. Porcar, D. Pozzo, G. Langenbucher, J. Moyer, and P. D. Butler, Rheo–small-angleneutron scattering at the National Institute of Standards and Technology Center forNeutron Research, Review of Scientific Instruments 82, 083902 (2011).
[35] P. Pfleiderer, S. J. Baik, Z. Zhang, G. Vleminckx, M. P. Lettinga, E. Grelet, J. Vermant,and C. Clasen, X-ray scattering in the vorticity direction and rheometry from con-fined fluids, Review of Scientific Instruments 85, 065108 (2014).
[36] J. J. Richards, N. J. Wagner, and P. D. Butler, A strain-controlled RheoSANS instru-ment for the measurement of the microstructural, electrical, and mechanical prop-erties of soft materials, Review of Scientific Instruments 88, 105115 (2017).

3
48 REFERENCES
[37] M. Borsboom, W. Bras, I. Cerjak, D. Detollenaere, D. Glastra van Loon, P. Goedtkindt,M. Konijnenburg, P. Lassing, Y. K. Levine, B. Munneke, M. Oversluizen, R. van Tol,and E. Vlieg, The Dutch–Belgian beamline at the ESRF, Journal of Synchrotron Ra-diation 5, 518 (1998).
[38] W. Bras, I. Dolbnya, D. Detollenaere, R. van Tol, M. Malfois, G. Greaves, A. Ryan, andE. Heeley, Recent experiments on a small-angle/wide-angle X-ray scattering beamline at the ESRF, Journal of Applied Crystallography 36, 791 (2003).
[39] D. de Kort, S. Veen, H. Van As, D. Bonn, K. Velikov, and J. van Duynhoven, Yieldingand flow of cellulose microfibril dispersions in the presence of a charged polymer,Soft Matter (2016), 10.1039/c1sm05495c.
[40] P. Münüklü and P. Jansens, Particle formation of an edible fat (rapeseed 70) using thesupercritical melt micronization (ScMM) process, The Journal of Supercritical Fluids40, 433 (2007).
[41] F. Maleky and G. Mazzanti, Lipid Crystal Networks Structured under Shear Flow, inCrystallization of Lipids (John Wiley & Sons, Ltd, Chichester, UK, 2018) pp. 211–239.
[42] T. Nikolaeva, Manipulation of recrystallisation and network formation of oil- dis-persed micronized fat crystals, Submitted for publication (2019).
[43] R. den Adel, K. van Malssen, J. van Duynhoven, O. O. Mykhaylyk, and A. Voda, FatCrystallite Thickness Distribution Based on SAXD Peak Shape Analysis, EuropeanJournal of Lipid Science and Technology 120, 1800222 (2018).
[44] J. M. Manski, A. J. van der Goot, and R. M. Boom, Advances in structure formationof anisotropic protein-rich foods through novel processing concepts, Trends in FoodScience & Technology 18, 546 (2007).
[45] B. Tian, Z. Wang, L. de Campo, E. P. Gilbert, R. M. Dalgleish, E. Velichko, A. J. van derGoot, and W. G. Bouwman, Small angle neutron scattering quantifies the hierarchi-cal fibrous structure in calcium caseinate, Macromolecules (2019).

3.4. SUPPLEMENTARY INFORMATION
3
49
3.4. SUPPLEMENTARY INFORMATION
Figure 3.9: An image of the developed shear cell mounted at the SAXS DUBBLE (BM-26) beamline at ESRF.

3
50 REFERENCES
Figure 3.10: A foto (a) and a schematic drawing (b) of the shear-cell, outlining windows and some other con-struction elements of the cell

3.4. SUPPLEMENTARY INFORMATION
3
51
Figure 3.11: A cross section of the cell in thermostatic shell (a) and an internal surface of the shell with copperinsertions in it (b)
Figure 3.12: An image of the developed Couette shear cell mounted at the lab-scale X-ray diffractometer BrukerD8-Discover


4STRUCTURE AND STABILITY OF
MICROFIBRILLATED CITRUS FIBER
UNDER SHEAR
Suspensions of microfibrillated citrus fiber were studied by means of SAXS, rheology, rheo-MRI, and shear-SAXS. The effect of high pressure on the structure of the suspensions wasassessed by means of SAXS on the suspensions which were processed several times (from0 to 4) by a high-pressure homogenizer. Rheo-MRI of the suspensions under mild shear-rates indicated the presence of flocs with sizes about 100 µm. Investigation of the internalstructure of the flocs by means of shear-SAXS has shown that they consist of randomlyoriented fibers, and homogeneous and stable on the length scales below 300 nm.
This chapter, by Evgenii Velichko, Ruud den Adel, Tatiana Nikolaeva, Raquel Serial, John van Duynhoven, andWim G. Bouwman, has been prepared for publication in a scientific journal
53

4
54 4. STRUCTURE AND STABILITY OF MICROFIBRILLATED CITRUS FIBER UNDER SHEAR
4.1. INTRODUCTIONGlobal challenges, such as the growing world population, plastic pollution, climate change,and diminishing fossil resources, forcing humanity to look for renewable materials forproduction of a variety of daily products. One of the obvious sources of such materials iscellulose, the most abundant biopolymer on the planet. Present in all plants, cellulose isresponsible for their mechanical strength and protection from aggressive environments.A series of mechanical and chemical treatments have to be performed in order to extractcellulose from plant cells. After a very high pressure treatment, cellulose pulp can beturned into microfibrillated cellulose (MFC) – a promissing material with a variety of ap-plications, ranging from protective coatings [1], and packaging [2] to food and cosmetics[3].
First obtained in 1983 by Turbak and Herrick [4, 5], MFC has attracted considerableattention of the researchers worldwide. Some of the most remarkable properties of MFCare high theoretical strength and modulus [6, 7], high surface area and water absorption[2], and gel formation at very low concentrations of fibers [8, 9].
One of the most interesting characteristics of microfibrillated cellulose (MFC) sus-pensions is their peculiar rheological behavior. Due to a very high aspect ratio of cel-lulose microfibrils, as high as 75, they can form a gel already at concentrations as lowas 0.04 wt % [8]. Application of shear disrupts the MFC gel network and starts the flowof flocs of fibrils [10]. A macroscopic mechanism of MFC flocculation under shear wasproposed and tested with the aid of imaging [11, 12], ultrasonic speckle velocimetry [13],and MRI [14]. All of the researchers have agreed on the floc formation under shear withaverage floc sizes in the order of 100 µm with the smaller flocs forming at higher shearrates. However, the internal structure of the flocs is still unknown.
Small-angle scattering of X-rays (SAXS) and Neutrons (SANS) is a powerful tool forstudying materials under shear [15, 16]. Main advantages of X-rays and neutrons are therange of studied length-scales, non-destructiveness, ability to penetrate bulky materi-als, and a possibility to adjust probed sample volume by altering the beam size. Broadresearch has been published concerning the structure of cellulosic materials from differ-ent origins at static conditions [17]. Moreover, fibrin networks, which are similar to MFC,were successfully studied by means of shear-SANS [18]. However, due to specifics of neu-tron interactions with the matter, it is suggested to use deuterated solvent and/or mate-rials for SANS experiments. It has been shown that replacing hydrogen with deuteriumcan substantially change interactions in the system and, therefore, affect its structureand rheology. As we wanted to avoid any experimental artifacts, we chose to performshear-SAXS experiments.
In this work, we have first investigated the effect of the number of passes througha high-pressure homogenizer on the structure of MFC based on citrus fiber, as well asthe effect of concentration of the fiber on the structure. Then, we have focused on theflocculation of the MFC and the internal structure of the flocs under shear. Rheo-MRImeasurements were performed to probe local flows of citrus fiber MFC and estimateaveraged sizes of flocs at different shear rates. Furthermore, a special shear-SAXS cellwas designed to probe the internal structure of the flocs at different positions alongthe shear-gradient direction [16]. We believe, our results to be of interest to both, theprogress of fundamental knowledge in the field of non-local rheology, as well as to in-

4.2. MATERIALS AND METHODS
4
55
dustrial use of MFC suspensions.
4.2. MATERIALS AND METHODS
4.2.1. MATERIALSTwo sets of microfibrillated citrus fiber materials were investigated in this study: seriesof various concentrations obtained from 2% suspension and series of the various num-ber of defibrillation passes. Initial suspension of citrus fiber was prepared from citrusfiber powder by suspending it in demineralized water at concentration 2 or 1% wt. Asample of the initial 1% suspension was saved for later investigation. The suspensionswere stirred by a Silverson mixer for 10 minutes and, consequently, pushed through adiamond coated Z-chamber (G10Z) of a high-pressure homogenizer (M-110S microflu-idizer). The 2% suspension was pushed through the homogenizer once, while for the 1%suspension a part was saved for later investigation and the rest of material underwent 2,3, and 4 homogenizing steps, respectively. Thereafter, a 0.08 w% of nipacide was addedto the microfibrillated citrus fiber suspensions to prevent the material from deteriora-tion by microorganisms. Ten samples of microfibrillated citrus fiber were prepared bydilution of the 2% suspension to various concentrations (0.05, 0.1, 0.2, 0.3, 0.4, 0.5, 0.8,1, 1.5, 2%) with demineralized water.
4.2.2. SAXSThe high-brilliance ID02 beamline[19] of the European Synchrotron Radiation Facility(ESRF) was employed for small-angle X-ray scattering measurements. The measure-ments were performed in a broad range of momentum transfers: 3× 10⁻⁴ ≤ Q/Å≤ 0.7,where Q = 4πλ · sin(2θ) is the momentum transfer, where θ is a scattering angle and λ
the wavelength of the used X-rays (in our experiments λ=0.0996 nm). The samples wereplaced in a 30 position temperature stage with aluminum sample holders between X-raymica windows, at a constant temperature of the stage 20C. Scattering of 2 mm of waterbetween two mica windows was used for a background subtraction for all the measure-ments. Water reference (IH2O,20C = 1.641 · 10−2cm−1) was also used for scaling of thescattering intensities to absolute units [cm−1].
The SAXS data were fitted using SASview package [20] software and applying a two-level scattering model. The model consists of a cylinder form-factor of the cellulose fib-rils with polydisperse radii, and a power-law function describing the agglomerates of thefibrils:
I (Q) = s f
V· ∑
Rc yl
n(Rc yl ,σRc yl ) ·P (q,Rc yl ,L,ρc yl ,ρsol v )+ A ·q−m , (4.1)
where the first term corresponds to the form factor of a cylinder with polydisperse radii,multiplied by the number density of particles (s f /V ), where V is the total volume ofthe particle, and the second term accounts for the power-law behavior of the network.The model is inspired by the one proposed and successfully applied by Martinez-Sanz etal. [21, 22]. However, for our data treatment, we simplified the model by removing theshell component. We will explain this modification in Sec. 4.3.1. Although most of theworks employing the core-shell cylinder model were focused on the characterization of

4
56 4. STRUCTURE AND STABILITY OF MICROFIBRILLATED CITRUS FIBER UNDER SHEAR
the individual fibrils [22–25], the power-law term of the model plays an important role inthe description of the fibrillar networks. For example, the low-Q power-law dependencyof scattering was used to extract a fractal dimension of the fibrin network [26].
4.2.3. RHEOLOGY
Flow curves of the microfibrillated cellulose suspensions were measured on a stress-controlled rheometer (AR 2000, TA Instruments), using a plate-plate geometry (plate di-ameter 4 cm, gap 1 mm). During the measurements, the shear rate was firstly increasedfrom 0.1 to 500 s−1 in 2 min and then decreased back to 0.1s−1 in 2 min. Sand-blastedmetal plates were used to prevent wall slip. The system was temperature controlled witha Peltier system at a temperature of 20 ± 0.1C.
4.2.4. RHEO-MRI
TTime-averaged velocity profiles were measured according to procedures by Callaghanet al. [27, 28] on a Bruker Avance II spectrometer at 7.0 T magnetic field strength (res-onance frequency 300 MHz for 1H). The magnet was equipped with a Bruker rheo-MRIaccessory in combination with a cone-plate (CP) geometry made of PEEK (cone angle7.0and cone diameter 1 cm). For all imaging experiments, the field of view was set to25 mm and profiles of 1024 points were collected, resulting in a spatial resolution of 24µm. For each shear rate, 64 signal acquisitions were collected and averaged. All velocityprofiles were corrected for slippage employing the same approach proposed by de Kortet.al [14].
4.2.5. SHEAR-SAXS
The shear-SAXS measurements were carried out at the BM26 beamline of the EuropeanSynchrotron Radiation Source, Grenoble, France [29, 30]. A home-built horizontal Cou-ette shear-cell [16] allowed the X-ray beam to be directed along the vorticity direction ofthe flow at different positions across the gap between the inner and outer cylinders. Agap of 1 mm with a 38 mm outer radius was used. Rotation speed was applied to the in-ner cylinder of the shear-SAXS cell. Measurements were performed under constant shearfor 10 minutes, after which another shear rate was imposed on the same sample. Shearrates applied on the same sample were 0, 1, 3, 5, 10, 15,20, 30, 40, 50, 100, 300, 100, 50, 40,30, 20, 15, 10, 5, 3, 1, and 0 s−1. The beam cross-section at the sample position was about120 µm, which allowed us to measure five different positions across the gap withoutoverlap. We used the Pilatus detector with a resolution of 981×1043 pixels and a pixel sizeof 172×172 µm2 positioned at a distance of 6672 mm away from the sample for the SAXSmeasurements with a wavelength λ = 1.033 Å. The experimental setup gave access tothe momentum transfer range of 3.7×10⁻³ ≤Q/Å≤ 0.1. Standard corrections for sampleabsorption and background subtraction were applied. The scattering intensities werescaled to absolute units [cm−1] using a water reference (IH2O,20C = 1.641 ·10−2cm−1).

4.3. RESULTS AND DISCUSSION
4
57
4.3. RESULTS AND DISCUSSION
4.3.1. STRUCTURAL CHANGES IN CITRUS FIBER SUSPENSIONS DUE TO HIGH
PRESSURE HOMOGENIZATIONMultiple studies have shown the effect of high-pressure homogenization on the rheo-logical properties of the MFC [1, 10–12, 31–34]. However, none of these studies couldtell how deep the homogenization propagates into MFC structure. In order to bridgethis gap, we have performed SAXS measurements on MFC suspensions before and afterhigh-pressure homogenization for up to 4 passes through the homogenizer.
SAXSFigure 4.1 shows the SAXS scattering curves for the 1% citrus fiber suspension before andafter microfibrillation with their respective fitting curves. The curves can be visually sep-arated into two parts: high-Q range (above ≈ 1·10−2Å−1) corresponds to the form-factorof individual fibrils in MFC, while the low-Q region (below ≈ 1·10−2Å−1)is related to thefibrillar network. We started our fitting procedures with the core-shell cylinder modeldescribed in [21, 22]; however, the fitting algorithm was decreasing the value of shellthickness (t = Rshel l −Rcor e ) to the values close to 0 ( 1×10⁻⁵Å). Fixing this parameter to0 improved the overall quality of fits and substantially decreased computation time. Thiseffect could be explained by the differences in the scattering of neutrons and X-rays. Themodel is more advantageous for neutron scattering, where scattering contrast betweendifferent parts of material could be substantially increased by application of contrastvariation technique (based on the difference in the scattering of H and D atoms). In thecase of X-ray scattering, there is much less contrast between crystalline, paracrystallineand amorphous cellulose (14.46, 13.65, and 13.38 ×1010 cm2, respectively), and it cannotbe easily altered. Therefore, in the later analysis, we have reduced our model to the sumof polydisperse cylinders form factor and absolute power law, presented by Eq. 4.1.
Table 4.1: Fitting results for the 1% citrus fiber before and after microfibrillation
N ρc yl∗ ρsol v
∗ s f /V R+c yl , Å L∗, Å A m
passes (1010 cm−2) (1010 cm−2)
0 13.83 9.47 0.0032(5) 14.8(9) 9999 5.1(4) ·10−6 2.70(5)1 13.83 9.47 0.0029(5) 15.3(9) 9999 3.2(4) ·10−5 2.60(5)2 13.83 9.47 0.0033(5) 14.5(9) 9999 4.0(4) ·10−5 2.55(5)3 13.83 9.47 0.0029(5) 15.3(9) 9999 6.1(4) ·10−5 2.50(5)4 13.83 9.47 0.0027(5) 15.5(9) 9999 5.0(4) ·10−5 2.50(5)
∗ parameters which were fixed in the fitting process+ polydispersity of radii was fitted with log-normal distribution with a standarddeviation of 0.3 fixed for all of the fitting results
As can be seen from the table 4.1, the main changes of the structure due to defibril-lation of citrus fiber are on the level of the fibrillar network, scattering of which is de-scribed by absolute power law term of the scattering model. As can be seen from figure4.2, the m parameter decreases with the defibrillation and levels off at a value of 2.5 after

4
58 4. STRUCTURE AND STABILITY OF MICROFIBRILLATED CITRUS FIBER UNDER SHEAR
3 passes. In scattering theory [35] values m < 3 are attributed to mass-fractal with fractaldimension D f ≡ m and higher values of m correspond to the higher density of fractalbuilding blocks [36]. Therefore, we can conclude that defibrillation leads to loosening ofthe fibrillar network.
As can be seen from figure 4.3(a), although radii of the elementary fibrils stay thesame at all concentrations of fiber, their volume fraction linearly increases with con-centration. From figure 4.3(b) we can see that m parameter of the absolute power lawincrease with the concentration of fibers. This increase of the fractal dimension can bestructurally explained by the increase in the density of fibers and a decrease in the dis-tance between the network nodes with increasing concentration of fibrils. A similar ef-fect was previously reported for the fibrin networks [26].
4.3.2. IMPACT OF LOW SHEAR ON STABILITY OF MICROFIBRILLATED CITRUS
FIBER
RHEOLOGY
Figure 4.4 shows flow curves for various concentrations of microfibrillated citrus fibersuspensions. A peculiar property of the curves is some hysteresis in the low shear-ratesregion. The initial viscosity of the materials is higher than the one after relatively highshear rates. A similar effect was observed previously in MFC [1, 13, 31]. It was suggestedthat the shear slowly breaks down the no-shear gel structure and the shear thinning ef-fect was attributed to the orientation of the fibrils along the flow direction[31]. The dif-ference between the increasing and decreasing shear-rate curves was explained by theenergy transferred to the system at high shear-rates, which allowed for higher mobilityof the fibrils. In contrast to the orientation hypothesis by of Iotti et al., other groupshave observed flocculation of MFC and attributed the peculiar rheology of MFC to theflocculated flow with decreasing floc sizes with increasing shear-rates [11–14].
RHEO-MRIIn order to address the flocculation of microfibrillated citrus fiber suspensions, we haveperformed rheo-MRI measurements at various shear-rates. Results of rheo-MRI mea-surements are presented in figure 4.5. The results are in good agreement with similarexperiments performed for bacterial cellulose suspensions by de Kort et al. [14]. Theexperimental results were fitted with a model proposed by Goyon et al. [37], accountingfor nonlocal effects. As a fitting result, length scale parameter ξ was defined at severalshear rates. As can be seen from figure 4.5, the non-local model provides a correlationlength of app. 100 µm, this is in line with the estimated size of the microfibrillated cel-lulose flocs. Unfortunately, rheo-MRI could not resolve the internal structure of theseinhomogeneities and answer whether the flocs are formed by aligned of randomly ori-ented fibrils. Therefore, we have designed and performed a shear-SAXS experiment toinvestigate the structure of MFC under shear.
SHEAR-SAXSWe have had two major hypotheses for the internal organization of MFC flocs in mind: a)isotropic aggregation of randomly oriented microfibrils, and b) local alignment of fibrilsinside the flocs. As small angle scattering is very sensitive to the orientation of fibrous

4.3. RESULTS AND DISCUSSION
4
59
Figure 4.1: (a) Small-angle X-ray scattering curve of 1% suspension of Citrus Fiber before homogenizationwith individual parts of the scattering model and a division of the measured q range into high- and low-qparts, where either contribution of the model dominate the scattering; (b) measured SAXS curves (symbols)with respective fitting results (solid lines) for 1% suspension of Citrus Fiber before and after going throughhigh-pressure homogenizer several times

4
60 4. STRUCTURE AND STABILITY OF MICROFIBRILLATED CITRUS FIBER UNDER SHEAR
Figure 4.2: Effect of the number of passes through a high-pressure homogenizer on the network structure of1% suspension of Citrus Fiber. Parameter m corresponds to the fractal dimension of the network (D f ≡ m)

4.3. RESULTS AND DISCUSSION
4
61
Figure 4.3: Effect of concentration on the structure of microfibrillated Citrus Fiber: (a) radii and volume frac-tions of elementary fibrils; (b) fractal dimension of the fibular network (D f ≡ m)

4
62 4. STRUCTURE AND STABILITY OF MICROFIBRILLATED CITRUS FIBER UNDER SHEAR
Figure 4.4: Flow curves for various concentrations of microfibrillated citrus fiber suspensions. All of the curvesdemonstrate shear-thinning behavior of the suspensions with some peculiar hysteresis at shear-rates below10s−1: the initial increasing shear-rate curve is above the consecutive decreasing one for all of the samples

4.3. RESULTS AND DISCUSSION
4
63
Figure 4.5: Velocity profiles normalized to the cone velocity of the 0.3% microfibrillated citrus fiber suspensionin CP geometry. Solid lines are fits to the nonlocal model proposed in [37]. The imaged gap is 0.65 mm wideat the position where the profile was measured. For all profiles, slippage at the plate was corrected employingthe approach used by de Kort, et. al [14]

4
64 4. STRUCTURE AND STABILITY OF MICROFIBRILLATED CITRUS FIBER UNDER SHEAR
gels [18], we expected to see isotropic scattering patterns as support for the first hypoth-esis and strongly anisotropic ones in support of the second one.
The first step in the analysis of shear-SAXS results was a visual inspection of the 2Dscattering patterns. As can be seen from figure 4.6, no anisotropy of scattering was ob-served at the experimental conditions. In order to quantify this conclusion, we haveperformed an anisotropy analysis of the 2D patterns. We have applied a Legendre seriesexpansion to fit our azimuthally averaged scattering curves, as was performed before byWeigandt et al. [18]:
F (ϕ) =Σ∞n=0anP2n(cos(ϕ− (
ϕ0 +π/2))), (4.2)
where ϕ and ϕ0 are an azimuth angle and its shift, the values an are fitting coefficients,and the functions P2n are even Legendre polynomials. We used the first eight terms ofthe series for the fitting. The orientation parameter P2 was determined from the F (q,ϕ)dependencies as
P2 = a1
5. (4.3)
The orientation parameter P2 defines the level of fiber alignment, it varies between zerofor randomly oriented fibers and unit for the perfectly aligned ones.
Figure 4.7 shows the steps of the analysis. Firstly, the most appropriate q-range waschosen by scanning radial direction of one of the 2D scattering patterns from beam-stopoutwards and calculating orientation parameter P2 for each detector pixel size step. Wefound that above q = 0.014Å (45 pixel from the beam center) P2 drops below 0.01 andbelow q = 0.01Å (32 pixel from the beam center) the azimuthally averaged scatteringcurves contained many artifacts due to shadow effect from the beam-stop. Therefore,we have limited our q-range for anisotropy analysis to 0.01Å−1 ≤ q ≤ 0.014 Å−1 (annularring in figure 4.7(a)). It should be noted that q ≥ 0.02 Å−1 is the region of momentumtransfers where scattering from individual fibrils dominates the pattern. Therefore, wecan conclude the absence of global alignment of fibrils in the system under applied con-ditions. Figure 4.7(b) shows an example of azimuthally averaged scattering curves andtheir respective fits for a suspension of microfibrillated citrus fiber. Figure 4.7(c) showsthe orientation parameter as a function of shear rate for a 0.2% citrus fiber suspension.As can be seen, there is very little orientation (P2 <0.06), which indicates the absence ofthe global alignment of fibrils and supports isotropic floc hypothesis. Since no extra in-formation could be extracted from the 2D scattering patterns, the patterns were reducedto 1D I vs. q dependencies, which were used in further analysis.
Figure 4.8 shows typical 1D SAXS dependencies and their fitting curves for 0.2% MFCsuspension at 0 and 300 s−1 shear-rate. For the fitting of shear-SAXS data, we found outthat the parameters of the cylinder form-factor part of the scattering model 4.1 did notvary much in the fitting process. It can be easily explained by the limits of the inves-tigated q range in shear-SAXS experiments: most of the form-factor features fall aboveq = 0.1Åand could not be observed. Therefore, in the analysis, we have fixed these pa-rameters to the values found in section 2.3.4. In this way, we could obtain information

4.3. RESULTS AND DISCUSSION
4
65
Figure 4.6: Graphical representation of the shear-SAXS measurement protocol and 2D scattering patterns ofthe 0.2% microfibrillated citrus fiber suspension. Black lines on the 2D patterns appear due to space betweendifferent modules of Pilatus detector, and the dark spot in the center is due to beam stop

4
66 4. STRUCTURE AND STABILITY OF MICROFIBRILLATED CITRUS FIBER UNDER SHEAR
Figure 4.7: Analysis of scattering anisotropy: (a) a typical 2D scattering pattern with an indictaion of the an-nular ring (0.01Å≤ q ≤ 0.014Å) over which I(ϕ) is calculated, (b) annular intensity averages of 2D scatteringprofiles for a suspension of microfibrillated citrus fiber at concentration of 0.2% wt. at 0 and 300 s−1 shearrates. Lines correspond to the Legendre expansion fits, (c) anisotropy parameter as a function of shear rate forcitrus fiber MFC suspension at concentration of 0.2% wt.

4.3. RESULTS AND DISCUSSION
4
67
Figure 4.8: Small-angle X-ray scattering curves, measured at 0 and 300 s−1 shear-rate for citrus fiber MFCsuspension at 0.2% wt. concentration
on the organization of a network of cellulose fibrils under shear expressed in the fractaldimension of the network D f .
Figure 4.9 demonstrates a typical dependency of D f on the applied shear-rate fora 0.2% CF suspension. As can be seen, there is no clear dependence of the fractal di-mension on the position along the shear-gradient direction of the shear-cell, or on theapplied shear rate. Therefore, we conclude that although the overall floc sizes are chang-ing under applied shear, their internal structure remains almost intact in the course ofshearing. It could explain hight stability and homogeneity of the studied MFC suspen-sions.
The dependencies of fitting parameters on the shear-rate and the positions acrossthe gap for the suspensions of microfibrillated citrus fiber do not show any trend. Itindicates that the suspensions are homogeneous on the length-scales below 300 nm andthat the internal structure of flocs is preserved throughout the entire measured range ofshear rates.
DISCUSSION
Our findings indicate the formation of flocs of microfibrillatd cellulose with the typi-cal sizes in the order of 100 µm. No fibril alignment within the flocs was observed atshear-rates up to 300s−1. A slight anisotropy of 2D scattering patterns (P2 <0.06) at

4
68 4. STRUCTURE AND STABILITY OF MICROFIBRILLATED CITRUS FIBER UNDER SHEAR
Figure 4.9: Fitting results of the fractal dimension of the MFC network for a 0.2% CF suspension. Line numberscorrespond to the beam position within the gap of the shear-cell, 1 bein the closest to rotor, and 5 is closest tostator

4.4. CONCLUSIONS
4
69
q < 0.014Åwas attributed to elongation of the flocs. There was no change of radii ofmicrofibrils at different positions across the gap of the shear-cell at all applied shear-rates. This finding indicates that suspensions are quite stable and homogeneous underthe applied experimental conditions.
4.4. CONCLUSIONSResults of this work suggest that even large shear applied on citrus fiber suspensions byhigh-pressure homogenization does not affect cross-sectional sizes of the elementaryfibrils in the system. On a larger scale, on the other hand, it disrupts the microfibrillarnetwork, which is reflected in a decrease in its mass-fractal dimension. Rheo-MRI mea-surements confirm the appearance of the flocculated flow of MFC already under rela-tively small shear rates (about 10 s−1). The sizes of flocs are estimated to be about 100µm. The internal structure of the flocs consists of randomly oriented intertwined fibers.Consistency of the structural parameters of the suspensions at different positions acrossthe gap of shear-cell and at the various shear rates (varied between 1 and 300s−1) suggestthat the citrus fiber MFC system is stable and homogeneous under these conditions.
REFERENCES[1] F. Grüneberger, T. Künniger, T. Zimmermann, and M. Arnold, Rheology of nanofib-
rillated cellulose/acrylate systems for coating applications, Cellulose 21, 1313 (2014).
[2] K. L. Spence, R. A. Venditti, O. J. Rojas, Y. Habibi, and J. J. Pawlak, The effect of chemi-cal composition on microfibrillar cellulose films from wood pulps: water interactionsand physical properties for packaging applications, Cellulose 17, 835 (2010).
[3] D. Klemm, E. D. Cranston, D. Fischer, M. Gama, S. A. Kedzior, D. Kralisch, F. Kramer,T. Kondo, T. Lindström, S. Nietzsche, K. Petzold-Welcke, and F. Rauchfuß, Nanocel-lulose as a natural source for groundbreaking applications in materials science: To-day’s state, Materials Today 21, 720 (2018).
[4] A. F. Turbak, F. W. Snyder, and K. R. Sandberg, Microfibrillated cellulose, a new cel-lulose product: properties, uses, and commercial potential, (United States, 1983).
[5] F. W. Herrick, R. L. Casebier, J. K. Hamilton, and K. R. Sandberg, Microfibrillatedcellulose: morphology and accessibility, (United States, 1983).
[6] D. G. Hepworth and D. M. Bruce, Method of calculating the mechanical propertiesof nanoscopic plant cell wall components from tissue properties, Journal of MaterialsScience 35, 5861 (2000).
[7] Y.-C. Hsieh, H. Yano, M. Nogi, and S. J. Eichhorn, An estimation of the Young’s mod-ulus of bacterial cellulose filaments, Cellulose 15, 507 (2008).
[8] A. Naderi, T. Lindström, and T. Pettersson, The state of carboxymethylated nanofib-rils after homogenization-aided dilution from concentrated suspensions: a rheolog-ical perspective, Cellulose 21, 2357 (2014).

4
70 REFERENCES
[9] S. J. Veen, A. Kuijk, P. Versluis, H. Husken, and K. P. Velikov, Phase Transitions in Cel-lulose Microfibril Dispersions by High-Energy Mechanical Deagglomeration, Lang-muir 30, 13362 (2014).
[10] U. Björkman, The metarheology of crowded fibre suspensions, Annual Transactionsof the Nordic Rheology Society 14, 69 (2006).
[11] E. Saarikoski, T. Saarinen, J. Salmela, and J. Seppälä, Flocculated flow of microfib-rillated cellulose water suspensions: An imaging approach for characterisation ofrheological behaviour, Cellulose 19, 647 (2012).
[12] A. Karppinen, T. Saarinen, J. Salmela, A. Laukkanen, M. Nuopponen, and J. Seppälä,Flocculation of microfibrillated cellulose in shear flow, Cellulose 19, 1807 (2012).
[13] F. Martoïa, C. Perge, P. J. J. Dumont, L. Orgéas, M. A. Fardin, S. Manneville, and M. N.Belgacem, Heterogeneous flow kinematics of cellulose nanofibril suspensions undershear, Soft Matter 11, 4742 (2015).
[14] D. de Kort, S. Veen, H. Van As, D. Bonn, K. Velikov, and J. van Duynhoven, Yieldingand flow of cellulose microfibril dispersions in the presence of a charged polymer,Soft Matter (2016), 10.1039/c1sm05495c.
[15] A. P. R. Eberle and L. Porcar, Flow-SANS and Rheo-SANS applied to soft matter, Cur-rent Opinion in Colloid & Interface Science 17, 33 (2012).
[16] E. Velichko, B. Tian, T. Nikolaeva, J. Koning, J. van Duynhoven, and W. G. Bouwman,A versatile shear cell for investigation of structure of food materials under shear, Col-loids and Surfaces A: Physicochemical and Engineering Aspects 566, 21 (2019).
[17] M. Martínez-Sanz, M. J. Gidley, and E. P. Gilbert, Application of X-ray and neu-tron small angle scattering techniques to study the hierarchical structure of plantcell walls: A review, Carbohydrate Polymers 125, 120 (2015).
[18] K. M. Weigandt, L. Porcar, and D. C. Pozzo, In situ neutron scattering study of struc-tural transitions in fibrin networks under shear deformation, Soft Matter 7, 9992(2011).
[19] T. Narayanan, O. Diat, and P. Bösecke, SAXS and USAXS on the high brilliance beam-line at the ESRF, Nuclear Instruments and Methods in Physics Research Section A:Accelerators, Spectrometers, Detectors and Associated Equipment 467-468, 1005(2001).
[20] M. Doucet, J. H. Cho, G. Alina, J. Bakker, W. Bouwman, P. Butler, K. Campbell,M. Gonzales, R. Heenan, A. Jackson, P. Juhas, S. King, P. Kienzle, J. Krzywon, A. Mark-vardsen, T. Nielsen, L. O’Driscoll, W. Potrzebowski, R. Ferraz Leal, T. Richter, P. Rozy-cko, T. Snow, and A. Washington, Sasview version 4.2, (2018).
[21] M. Martínez-Sanz, D. Mikkelsen, B. Flanagan, M. J. Gidley, and E. P. Gilbert, Multi-scale model for the hierarchical architecture of native cellulose hydrogels, Carbohy-drate Polymers 147, 542 (2016).

REFERENCES
4
71
[22] M. Martínez-Sanz, D. Mikkelsen, B. M. Flanagan, C. Rehm, L. de Campo, M. J. Gi-dley, and E. P. Gilbert, Investigation of the micro- and nano-scale architecture ofcellulose hydrogels with plant cell wall polysaccharides: A combined USANS/SANSstudy, Polymer 105, 449 (2016).
[23] M. Martínez-Sanz, P. Lopez-Sanchez, M. J. Gidley, and E. P. Gilbert, Evidencefor differential interaction mechanism of plant cell wall matrix polysaccharides inhierarchically-structured bacterial cellulose, Cellulose 22, 1541 (2015).
[24] M. Martínez-Sanz, M. J. Gidley, and E. P. Gilbert, Hierarchical architecture of bac-terial cellulose and composite plant cell wall polysaccharide hydrogels using smallangle neutron scattering, Soft Matter 12, 1534 (2016).
[25] M. Martínez-Sanz, F. Pettolino, B. Flanagan, M. J. Gidley, and E. P. Gilbert, Struc-ture of cellulose microfibrils in mature cotton fibres, Carbohydrate Polymers 175,450 (2017).
[26] K. M. Weigandt, D. C. Pozzo, and L. Porcar, Structure of high density fibrin networksprobed with neutron scattering and rheology, Soft Matter 5, 4321 (2009).
[27] P. T. Callaghan, Principles of nuclear magnetic resonance microscopy (Oxford Uni-versity Press on Demand, 1993).
[28] P. T. Callaghan, Rheo-NMR: nuclear magnetic resonance and the rheology of complexfluids, Reports on Progress in Physics 62, 599 (1999).
[29] M. Borsboom, W. Bras, I. Cerjak, D. Detollenaere, D. Glastra van Loon, P. Goedtkindt,M. Konijnenburg, P. Lassing, Y. K. Levine, B. Munneke, M. Oversluizen, R. van Tol,and E. Vlieg, The Dutch–Belgian beamline at the ESRF, Journal of Synchrotron Ra-diation 5, 518 (1998).
[30] W. Bras, I. Dolbnya, D. Detollenaere, R. van Tol, M. Malfois, G. Greaves, A. Ryan, andE. Heeley, Recent experiments on a small-angle/wide-angle X-ray scattering beamline at the ESRF, Journal of Applied Crystallography 36, 791 (2003).
[31] M. Iotti, Ø. W. Gregersen, S. Moe, and M. Lenes, Rheological Studies of Microfibril-lar Cellulose Water Dispersions, Journal of Polymers and the Environment 19, 137(2011).
[32] K. Benhamou, A. Dufresne, A. Magnin, G. Mortha, and H. Kaddami, Control of sizeand viscoelastic properties of nanofibrillated cellulose from palm tree by varying theTEMPO-mediated oxidation time, Carbohydrate Polymers 99, 74 (2014).
[33] T. Saarinen, M. Lille, and J. Seppälä, Technical Aspects on Rheological Characteriza-tion of Microfibrillar Cellulose Water Suspensions, Annual Transaction of the NordicRheology Society 17, 121 (2009).
[34] H. Taheri and P. Samyn, Effect of homogenization (microfluidization) process pa-rameters in mechanical production of micro- and nanofibrillated cellulose on itsrheological and morphological properties, Cellulose 23, 1221 (2016).

4
72 REFERENCES
[35] J. Teixeira, Small-angle scattering by fractal systems, Journal of Applied Crystallog-raphy 21, 781 (1988).
[36] G. Beaucage, Small-Angle Scattering from Polymeric Mass Fractals of ArbitraryMass-Fractal Dimension, Journal of Applied Crystallography 29, 134 (1996).
[37] J. Goyon, A. Colin, G. Ovarlez, A. Ajdari, and L. Bocquet, Spatial cooperativity in softglassy flows. Nature 454, 84 (2008), arXiv:0803.1352 .

5MESOSTRUCTURE OF BACTERIAL
CELLULOSE FROM NATA DE COCO
AND FROM THE LAB WITH AND
WITHOUT DEUTERATION STUDIED
BY SANS
Bacterial cellulose suspensions from two different sources were studied with SANS. One setof materials was prepared from crushed cubes of the commercially available dessert natade coco, and the second was obtained via microbial synthesis in-house at the NeutronDeuteration Facility at ANSTO. The in-house synthesized cellulose was either completelyhydrogenated, or completely deuterated. It was found that mesostructure of hydrogenatedbacterial cellulose from two different sources was very similar. However, the mesostruc-ture of the deuterated material was found to be substantially different, which resultedin strong agglomeration and completely altered rheological properties. This shows thatcontrast variation in SANS is not always possible to determine arrangements of differentcomponents.
This chapter, by Evgenii Velichko, Robert Russell, Anna Sokolova, John van Duynhoven, and Wim G. Bouwman,is being prepared for publication in a scientific journal
73

5
745. MESOSTRUCTURE OF BACTERIAL CELLULOSE FROM NATA DE COCO AND FROM THE LAB
WITH AND WITHOUT DEUTERATION STUDIED BY SANS
5.1. INTRODUCTION
Microfibrillated cellulose (MFC) is a promising renewable material which can be usedin a variety of applications, ranging from protective coatings [1], and packaging [2] tofood and cosmetics [3]. It is obtained from cellulose fibres by high-pressure homoge-nization [4, 5]. Aqueous dispersions of MFC have to be protected from agglomeration bystabilizers, typically charged soluble polymers [6–8], such as carboxy methyl cellulose.However, the underlying mechanism of this stabilization is still unknown. It has beensuggested, that the charged polymer absorbs on the surface of the cellulose microfib-rils, increasing the ζ potential of the microfibrils, forming a repulsive shell around them,preventing agglomeration[6]. However, no experimental evidence for such behaviour isavailable in literature. In the industrial processing MFC undergoes a series of process-ing steps, most of which apply shear-stress. Under certain shear-rates the MFC starts toagglomerate, despite the presence of stabilizers [9]. Rheo-MRI investigation has shownshear-banding behaviour in such systems [8].
In order to understand the stabilization mechanism of the MFC by charged poly-mers and the peculiar flow of the MFC suspensions we constructed a special samplecell, which allows for scattering experiments on the materials under shear with spatialresolution across the velocity gradient direction of the cell. The cell design is describedin detail in Chapter 3.
Flow-SAXS experiments were performed at DUBBLE beamline at ESRF. No alignmentof microfibrills was observed at shear rates from 1 to 300 s−1. The scattering invari-ant calculation indicated a homogeneous density distribution of cellulose microfibrilsacross the gap at all applied shear-rates. This implies that no shear induced aggregationand migration of cellulose over the gap occurs. However, due to similar electron den-sities of cellulose and CMC, SAXS could not give an answer about the role of chargedpolymers in stabilization and flow of MFC suspensions.
In order to find whether the charged polymer forms a shell around cellulose mi-crofibrils, we have designed a small-angle neutron scattering experiment with differentcontrasts between cellulose microfibrils and the charged polymer. Contrast variation isa powerful technique for material investigation: It allows to increase the visibility of indi-vidual elements in a multi-component system. It can be achieved either by deuterationof the solvent [10] or the cellulose [11, 12]. In our experiment, we have tried both ap-proaches: we have samples of bacterial cellulose prepared from nata de coco dessert inlight or heavy water and samples of bacterial cellulose grown in a laboratory at NationalDeuteration Facility at ANSTO either hydrogenated in light water, or deuterated in heavywater.
Our measurements show, however, that deuteration has a too strong influence on thesystem. Deuterated bacterial cellulose was too much agglomerated and could not be ho-mogenized. Our SANS measurements suggest that the sizes of microfibrils of deuteratedcellulose are considerably larger than maximal sizes accessible in our SANS measure-ments (250 nm).

5.2. MATERIALS AND METHODS
5
75
5.2. MATERIALS AND METHODS
5.2.1. MATERIALS
In this work we investigated bacterial cellulose suspensions from two different sources.The first set of bacterial cellulose suspensions were obtained from mango flavoured natade coco dessert (Kara Santan Pertama, Bogor 16964, Indonesia). We have chosen thismethod since it is a relatively easy method to obtain the bacterial cellulose and our grouphas performed most earlier experiments on bacterial cellulose using this method. Thedrawback is that it cannot be used to obtain deuterated bacterial cellulose. Cubes ofbacterial cellulose from four cups of the dessert were immersed in 750 ml of nanopurewater (Barnstead Nanopure Diamond, resistance of 18 MΩ cm). The cubes were sub-sequently cut in a blender (Philips avance HR2096/01) and washed. At every washingstep the cellulose suspension was filtrated over a vacuum filter (Whatman Schleicherand Schuell 113, wet-strengthened circles, 185 mm in diameter) and re-dispersed in 750ml of nanopure water in the blender. After 8 washing steps, the filtered water was com-pletely transparent and the cellulose residue had lost all artificial colours, from whichwe concluded that all of the added chemicals were removed from it. Consequently, theresidue was re-dispersed in 200 mL of nanopure water. The weight percentage (wt %)of bacterial cellulose in the resulting suspension was determined by drying a part of itunder vacuum over night and was adjusted to 0.4 wt % by adding extra nanopure water.Half of the final suspension was kept for further investigation (we denote it from nowon as HBCnat a in H2O), while the solvent in the other half was replaced with D2O bycentrifugation and removal of supernatant and replacement of it with D2O (HBCnat a inD2O).
The second set of bacterial cellulose suspensions was produced at Neutron Deutera-tion Facility at ANSTO, Australia, via microbial synthesis as described in [13]. One of thematerials was completely hydrogenated in light water (from now on denoted as HBCl ab
in H2O) to be compared with the material extracted from the nata de coco to see if wehad obtained the same material. The other sample was produced completely deuterated(DBCl ab in D2O) by bio-synthesis in a deuterated medium to at least 95% deuteration, asdetermined from FT-IR and NMR measurements. Deuterated glucose-d12 and glycerol-d8 for this bio-synthesis were sourced from Sigma-Aldrich (cat. # 616338 and 447498,respectively).
It is important to note that the deuterated material was very agglomerated. Even afterseveral dispersion steps in a blender the agglomerates were present in the form of blobsof cellulose, which were blocking any nozzle with a diameter below 2 mm. Fig. 5.1 showsthe photo of the deuterated bacterial cellulose suspension filled in the experimental cellfor SANS measurements. Due to this strong agglomeration of the material, it was notpossible to perform high-pressure homogenization on it.
5.2.2. SANSSmall-angle neutron scattering measurements were performed at BILBY, [14] the SANSinstrument at the high-flux reactor Opal in Lucas Heights, Australia. The scattering wasmeasured in a q-range of 0.0025 to 1 Å−1, where the magnitude of the scattering vector isdefined as q = (4π/λsin(θ), where λ is the wavelength of the neutron and 2θ its scatter-

5
765. MESOSTRUCTURE OF BACTERIAL CELLULOSE FROM NATA DE COCO AND FROM THE LAB
WITH AND WITHOUT DEUTERATION STUDIED BY SANS
Figure 5.1: Photo of the deuterated bacterial cellulose suspension filled in the experimental cell for SANS mea-surements.
ing angle. The instrument was operated in the time-of-flight mode with λ in the rangefrom 2 to 16 Åand two sets of detectors at 15 and 18 m distance from the sample, respec-tively. All data are corrected for sample cell background, transmission, normalised toan absolute scale and radially averaged. The incoherent background scattering from thesolvent has been subtracted.
5.3. RESULTS AND DISCUSSION
5.3.1. COMPARISON OF MESOSTRUCTURE OF BACTERIAL CELLULOSE FROM
NATA DE COCO AND THE LAB
The measurements of the bacterial cellulose prepared from nata de coco and from ANSTOare compared in Fig. 5.2. The shape of the measurements are very similar. There seemsto be a Guinier regime at low q , followed by a power law decay and a background. Thedifferences in intensity are proportional to the differences in scattering length densitycontrast and differences in concentration. To obtain a quantitative description of themeasurements, the data are fitted with the generalised Guinier-Porod model [15]. For themathematical details and symbols we refer to the original article [15]. The parameters

5.3. RESULTS AND DISCUSSION
5
77
Figure 5.2: Normalised SANS measurements of the bacterial cellulose from nata de coco and as prepared inthe lab in H2O or D2O. The data are fitted with the Guinier-Porod model and a background.
describing this model are the radius of gyration, Rg and the dimensionality s describingthe dimension of these objects, the Porod power d and the scale G . The dimension ofG depends on the value of d . The results are presented in Tab. 5.1. The value for theradius of gyration Rg had in all cases a value of some 60 Å, which corresponds to thesize expected for the radius of the bundles of micro-fibrils in bacterial cellulose [16]. Thecorresponding dimension s has a value of 1.7, which is in between 1 for needles and 2 forplatelets. This is a value we can expect, since it is known of bacterial cellulose that themicro-fibrils are produced by the bacteria in the shape of ribbons [16–18]. The value ofthe Porod exponent is 2.7, which is in line with previously observed values for pure bac-terial cellulose and complexes of bacterial cellulose with other cell-wall polysacharides[19–21]. The bundles are composed of the micro-fibres yielding a roughness of the inter-face of the ribbons which indeed should be described with a Porod exponent lower than4. The left over background will be due to imperfections in the subtraction of the solventbackground and the incoherent scattering of the hydrogen in the cellulose itself.

5
78 REFERENCES
Table 5.1: Fitting results for the studied suspensions of bacterial cellulose
Sample scale background [cm−1 Rg [Å] s d
HBCnat a in D2O 0.026(3) 0.030(1) 56(3) 1.6(1) 2.7(1)HBCnat a in H2O 0.008(1) 0.010(1) 50(3) 1.8(1) 2.7(1)HBCl ab in H2O 0.003(1) 0.010(1) 61(3) 1.8(1) 2.7(1)DBCl ab in D2O 0.000024(3) 0.010(1) – – 2.8(1)
5.3.2. DEUTERATED CELLULOSEThe scattering data from the biodeuterated bacterial cellulose look rather different. Theycan be described by a single power law with an exponent with a value of 2.8 as shown inFig. 5.3. This value for the Porod regime is similar as to the non-deuterated cellulosesamples, which indicates that the interface properties are similar. Apparently, the aggre-gates of the micro-fibrils are larger than can be resolved with SANS. This explains whythe samples are so much more viscous compared to the non-deuterated cellulose sam-ples.
5.4. CONCLUSIONSFrom the scattering data it is clear that the mesostructure of bacterial cellulose extractedfrom commercial nata de coco is the same as bacterial cellulose grown directly in thelab. The mesostructure is also independent on using H2O or D2O as a solvent. However,biodeuteration of bacterial cellulose has a dramatic effect on the mesostructure of bac-terial cellulose. The biodeuteration results in much larger aggregates of the micro-fibrilsof cellulose. This is likely also the cause for a much more viscous dispersion of this cellu-lose in water. So biodeuteration is not a viable method to resolve how a charged polymerinfluences the rheology of bacterial cellulose. As has been found before, deuteration isnot always such an innocent method to create contrast in SANS [22]. The difference inzero-point vibrational energy of hydrogen and deuterium bonds [23] could be the causefor the significant effect deuteration has on the rheological properties of polysaccharides[24].
REFERENCES[1] F. Grüneberger, T. Künniger, T. Zimmermann, and M. Arnold, Rheology of nanofib-
rillated cellulose/acrylate systems for coating applications, Cellulose 21, 1313 (2014).
[2] K. L. Spence, R. A. Venditti, O. J. Rojas, Y. Habibi, and J. J. Pawlak, The effect of chemi-cal composition on microfibrillar cellulose films from wood pulps: water interactionsand physical properties for packaging applications, Cellulose 17, 835 (2010).
[3] D. Klemm, E. D. Cranston, D. Fischer, M. Gama, S. A. Kedzior, D. Kralisch, F. Kramer,T. Kondo, T. Lindström, S. Nietzsche, K. Petzold-Welcke, and F. Rauchfuß, Nanocel-lulose as a natural source for groundbreaking applications in materials science: To-day’s state, Materials Today 21, 720 (2018).

REFERENCES
5
79
Figure 5.3: Normalised SANS measurements of the bacterial cellulose from nata de coco and as prepared inthe lab in H2O or D2O. The data are fitted with the Guinier-Porod model and a background.
[4] A. F. Turbak, F. W. Snyder, and K. R. Sandberg, Microfibrillated cellulose, a new cel-lulose product: properties, uses, and commercial potential, (United States, 1983).
[5] F. W. Herrick, R. L. Casebier, J. K. Hamilton, and K. R. Sandberg, Microfibrillatedcellulose: morphology and accessibility, (United States, 1983).
[6] S. J. Veen, A. Kuijk, P. Versluis, H. Husken, and K. P. Velikov, Phase Transitions in Cel-lulose Microfibril Dispersions by High-Energy Mechanical Deagglomeration, Lang-muir 30, 13362 (2014).
[7] S. J. Veen, P. Versluis, A. Kuijk, and K. P. Velikov, Microstructure and rheology of mi-crofibril–polymer networks, Soft Matter 11, 8907 (2015).
[8] D. de Kort, S. Veen, H. Van As, D. Bonn, K. Velikov, and J. van Duynhoven, Yieldingand flow of cellulose microfibril dispersions in the presence of a charged polymer,Soft Matter (2016), 10.1039/c1sm05495c.

5
80 REFERENCES
[9] E. Saarikoski, T. Saarinen, J. Salmela, and J. Seppälä, Flocculated flow of microfib-rillated cellulose water suspensions: An imaging approach for characterisation ofrheological behaviour, Cellulose 19, 647 (2012).
[10] M. Martínez-Sanz, F. Pettolino, B. Flanagan, M. J. Gidley, and E. P. Gilbert, Struc-ture of cellulose microfibrils in mature cotton fibres, Carbohydrate Polymers 175,450 (2017).
[11] J. Su, V. S. Raghuwanshi, W. Raverty, C. J. Garvey, P. J. Holden, M. Gillon, S. A. Holt,R. Tabor, W. Batchelor, and G. Garnier, Smooth deuterated cellulose films for thevisualisation of adsorbed bio-macromolecules, Scientific Reports 6, 36119 (2016).
[12] S. Bhagia, Y. Pu, B. R. Evans, B. H. Davison, and A. J. Ragauskas, Hemicellulose char-acterization of deuterated switchgrass, Bioresource Technology 269, 567 (2018).
[13] R. A. Russell, C. J. Garvey, T. A. Darwish, L. J. R. Foster, and P. J. Holden, Biopoly-mer Deuteration for Neutron Scattering and Other Isotope-Sensitive Techniques, inMethods in Enzymology, Vol. 565 (Elsevier Inc., 2015) 1st ed., pp. 97–121.
[14] A. Sokolova, A. E. Whitten, L. de Campo, J. Christoforidis, A. Eltobaji, J. Barnes,F. Darmann, and A. Berry, Performance and characteristics of the BILBY time-of-flight small-angle neutron scattering instrument, Journal of Applied Crystallography52, 1 (2019).
[15] B. Hammouda, A new Guinier-Porod model, Journal of Applied Crystallography 43,716 (2010).
[16] O. M. Astley, E. Chanliaud, a. M. Donald, and M. J. Gidley, Structure of Acetobactercellulose composites in the hydrated state. International journal of biological macro-molecules 29, 193 (2001).
[17] M. Iguchi, S. Yamanaka, and A. Budhiono, Bacterial cellulose - a masterpiece of na-ture’s arts, Journal of Materials Science 35, 261 (2000), arXiv:bk-12 .
[18] K. Zhang, Illustration of the development of bacterial cellulose bundles/ribbons byGluconacetobacter xylinus via atomic force microscopy, Applied Microbiology andBiotechnology 97, 4353 (2013).
[19] M. Martínez-Sanz, M. J. Gidley, and E. P. Gilbert, Hierarchical architecture of bac-terial cellulose and composite plant cell wall polysaccharide hydrogels using smallangle neutron scattering, Soft Matter 12, 1534 (2016).
[20] M. Martínez-Sanz, D. Mikkelsen, B. Flanagan, M. J. Gidley, and E. P. Gilbert, Multi-scale model for the hierarchical architecture of native cellulose hydrogels, Carbohy-drate Polymers 147, 542 (2016).
[21] M. Martínez-Sanz, D. Mikkelsen, B. M. Flanagan, C. Rehm, L. de Campo, M. J. Gi-dley, and E. P. Gilbert, Investigation of the micro- and nano-scale architecture ofcellulose hydrogels with plant cell wall polysaccharides: A combined USANS/SANSstudy, Polymer 105, 449 (2016).

REFERENCES
5
81
[22] B. Tian, V. Garcia Sakai, C. Pappas, A. J. van der Goot, and W. G. Bouwman, Fibre for-mation in calcium caseinate influenced by solvent isotope effect and drying method– A neutron spectroscopy study, Chemical Engineering Science 207, 1270 (2019).
[23] S. Scheiner and M. Cuma, Relative Stability of Hydrogen and Deuterium Bonds,Journal of the American Chemical Society 118, 1511 (1996).
[24] L. Yu, G. E. Yakubov, M. Martínez-Sanz, E. P. Gilbert, and J. R. Stokes, Rheologicaland structural properties of complex arabinoxylans from Plantago ovata seed mu-cilage under non-gelled conditions, Carbohydrate Polymers 193, 179 (2018).


SUMMARY
Humanity needs to increase use of renewable sources of materials and energy. As furtherdiscussed in Chapter 1, biomass can be used for both of these needs. Cellulose is themain component of biomass. Understanding the multi-level hierarchical structure ofcellulose holds the key to multiple applications of this material.
One of the promising applications of lignocellulsic biomass is the production of bio-ethanol as a replacement for fossil fuels. Yearly production of biomass could potentiallysupply enough bio-ethanol to completely replace gasoline. However, it would requiredramatic increase in the efficiency of the bioethanol production. The main obstacle tothe development of bioethanol production into a sustainable process is the recalcin-trance of cellulose which was developed throughout entire plant evolution. In order toovercome this obstacle an important step was incorporated into the process, i.e. pre-treatment of biomass. A multitude of pretreatments have been developed and applied todisrupt the structure of lignocellulosic biomass. However it is still not clear, which struc-tural parameters are responsible for the success of a certain pretreatment technique.
Chapter 2 demonstrates a structural study of poplar biomass before and after acidpretreatment. In order to comprehend all levels of organizations within the material,we have applied a range of techniques, including microscopy, small-angle scatteringand diffraction of X-rays. The structural studies were supported by the investigationof the performance of the biomass in the conversion of cellulose into glucose. Themain parameters responsible for the efficiency of biomass conversion are specific sur-face area, which is mostly defined by the microscopic particle sizes of the materials, andthe biomass crystallinity. Our findings suggest that an increase in specific surface areamakes the material better accessible for enzymes, while decrease in crystallinity makesit easier to digest by enzymes.
Microfibrillated cellulose, obtained by disruption of cellulose fibers, can be appliedfor production of low-caloric food. Since food materials undergo multiple mixing andshearing steps during production and consumption, it is important to ascertain stabilityof the MFC material under such conditions. In order to investigate the structure of MFCunder shear, we have designed a shear-SAXS experiment.
In Chapter 3 we discuss current developments in the sample environment for small-angle scattering X-ray and neutron experiments on the materials under shear. In oursearch for a sample environment which would satisfy our experimental needs we havediscovered that not a single piece of equipment designed before could be used for bothX-ray and neutron experiment. Moreover, most of the shear-cell could not be used forexperiment with spatial resolution along the shear gradient direction of the cell. In or-der to avoid creating multiple devices for each specific experiment, we have designedour Shear-SAS cell in such a way that it can be used for both, X-ray and neutron scatter-ing experiments, and be easily modified to accommodate several different rheologicalgeometries.
83

5
84 SUMMARY
An application of the shear-cell for investigation of microfibrillated citrus fiber is de-scribed in Chapter 4. The first question which was answered in this study was whetherMFC would align in the shear field. The performed experiment has clearly shown ran-dom orientation of the microfibrils under shear rates up to 300 s−1. The second questionwas concerning compaction of the cellulose fibrils in the flocs formed under shear andthe possibility of agglomeration of the fibrils. The flocs did not substantially change theirfractal dimension at all the applied shear-rates and at all the positions across the gap. Itsuggests that the material is very stable and can be readily used under the applied exper-imental conditions.
A possibility for application of contrast variation in combination with small-angleneutron scattering was considered in Chapter 5. It was found that mesostructure ofhydrogenated bacterial cellulose from different sources is very similar. However, themesostructure of the deuterated material is found to be substantially different, which re-sults in strong agglomeration and completely altered rheological properties. This showsthat contrast variation in SANS is not always possible to determine arrangements of dif-ferent components.

SAMENVATTING
De mensheid moet meer gebruik maken van hernieuwbare bronnen van materialen enenergie. Zoals nader besproken in hoofdstuk 1, kan biomassa voor beide doeleindenworden gebruikt. Cellulose is het hoofdbestanddeel van biomassa. Inzicht in de hiërar-chische structuur van cellulose op meer niveaus is de sleutel tot meerdere toepassingenvan dit materiaal.
Een van de veelbelovende toepassingen van lignocellulosebiomassa is de productievan bio-ethanol als vervanging voor fossiele brandstoffen. De jaarlijkse productie vanbiomassa kan mogelijk voldoende bio-ethanol opleveren om benzine volledig te ver-vangen. Het zou echter een dramatische toename van de efficiëntie van de productievan bio-ethanol vergen. Het belangrijkste obstakel voor de ontwikkeling van de pro-ductie van bio-ethanol tot een duurzaam proces is de recalcitrantie van cellulose diegedurende de hele evolutie van de plant is ontwikkeld. Om dit obstakel te overwinnenwerd een belangrijke stap in het proces opgenomen: voorbehandeling van de biomassa.Er is een groot aantal voorbehandelingen ontwikkeld en toegepast om de structuur vanlignocellulosebiomassa te verbreken. Het is echter nog steeds niet duidelijk welke struc-tuurparameters verantwoordelijk zijn voor het succes van een bepaalde voorbehande-lingstechniek.
Hoofdstuk 2 demonstreert een onderzoek naar de structuur van populierbiomassavoor en na voorbehandeling met zuur. Om alle niveaus van organisatie binnen het mate-riaal te begrijpen, hebben we een aantal technieken toegepast, waaronder microscopie,kleine hoekverstrooiing en diffractie van röntgenstralen. De studies naar de structuurwerden ondersteund door het onderzoek naar de prestaties van de biomassa bij de om-zetting van cellulose in glucose. De belangrijkste parameters die verantwoordelijk zijnvoor de efficiëntie van biomassaconversie zijn soortelijk oppervlak, dat meestal wordtbepaald door de microscopische deeltjesgroottes van de materialen, en de kristalliniteitvan de biomassa. Onze bevindingen suggereren dat een toename in soortelijk oppervlakhet materiaal beter toegankelijk maakt voor enzymen, terwijl afname in kristalliniteit hetgemakkelijker te verteren maakt door enzymen.
Microfibrillaire cellulose, verkregen door het opbreken van cellulosevezels, kan wor-den toegepast voor de productie van caloriearm voedsel. Omdat voedingsmaterialentijdens het productieproces en tijdens consumptie meerdere meng- en vervormingstap-pen ondergaan, is het belangrijk om de stabiliteit van het MFC-materiaal onder derge-lijke omstandigheden te bepalen. Om de structuur van MFC onder afschuiving te on-derzoeken, hebben we een shear-SAXS-experiment ontworpen.
In hoofdstuk 3 bespreken we de huidige ontwikkelingen in de monsteromgeving voorröntgen- en neutronenexperimenten met kleine hoekverstrooiing aan materialen onderafschuiving. Bij onze zoektocht naar een omgeving die aan onze experimentele behoef-ten zou voldoen, hebben we ontdekt dat geen enkel eerder-ontworpen apparaat konworden gebruikt voor zowel röntgen- als neutronenexperimenten. Bovendien kon het
85

5
86 SAMENVATTING
grootste deel van de afschuifcel niet worden gebruikt voor experimenten met ruimte-lijke resolutie in de richting van het afschuifgradiënt in de cel. Om te voorkomen dater voor elk specifiek experiment meerdere apparaten worden gemaakt, hebben we onzeShear-SAS-cel zo ontworpen dat deze kan worden gebruikt voor zowel röntgen- als neu-tronenverstrooiingsexperimenten en eenvoudig kan worden aangepast om tegemoet tekomen aan verschillende reologische geometrieën.
Een toepassing van de afschuifcel voor onderzoek naar microfibrillaire citrusvezelswordt beschreven in hoofdstuk 4. De eerste vraag die in deze studie werd beantwoord,was of MFC zou uitlijnen in het afschuifveld. Het uitgevoerde experiment heeft duide-lijk een willekeurige oriëntatie van de microfibrillen getoond bij afschuifsnelheden tot300 s−1. De tweede vraag had betrekking op de verdichting van de cellulosefibrillen inde onder afschuiving gevormde vlokken en de mogelijkheid van agglomeratie van defibrillen. De vlokken veranderden hun fractale dimensie niet wezenlijk bij alle toege-paste afschuifsnelheden en bij alle posities over de opening heen. Het suggereert dathet materiaal zeer stabiel is en gemakkelijk kan worden gebruikt onder de toegepasteexperimentele omstandigheden.
De mogelijkheid contrastvariatie toe te passen in combinatie met kleine-hoekneu-tronenverstrooiing werd overwogen in hoofdstuk 5. Het bleek dat de mesostructuurvan gehydrogeneerde bacteriële cellulose uit verschillende bronnen erg op elkaar lijkt.De mesostructuur van het gedeutereerde materiaal blijkt echter aanzienlijk te verschil-len, hetgeen resulteert in sterke agglomeratie en volledig veranderde reologische eigen-schappen. Dit laat zien dat contrastvariatie in SANS niet altijd mogelijk is teneinde derangschikking van de verschillende componenten te bepalen.

Краткое изложение
Человечество должно расширить использование возобновляемых источниковматериалов и энергии. Как более подробно обсуждается в главе 1, биомас-са может использоваться для обеих этих потребностей. Целлюлоза являетсяосновным компонентом биомассы. Понимание многоуровневой иерархическойструктуры целлюлозы является ключом к разнообразным применениям этогоматериала.
Одним из перспективных применений лигноцеллюлозной биомассы являет-ся производство биоэтанола в качестве замены ископаемого топлива. Ежегод-ное производство биомассы может потенциально обеспечить достаточное коли-чество биоэтанола для полной замены бензина. Тем не менее, это потребуетрезкого повышения эффективности производства биоэтанола. Основным пре-пятствием для превращения производства биоэтанола в энергетически эффек-тивный процесс является устойчивость целлюлозы к воздействиям внешнейсреды, которая развивалась на протяжении всей эволюции растений. Чтобыпреодолеть это препятствие, в процесс был включен важный шаг – предвари-тельная обработка биомассы. Множество способов предварительной обработкибыло разработано и применено для разрушения структуры лигноцеллюлознойбиомассы. Однако до сих пор не ясно, какие структурные параметры ответ-ственны за успех определенной методики предварительной обработки.
Глава 2 демонстрирует структурное исследование биомассы тополя до ипосле предварительной обработки кислотой. Чтобы понять все уровни орга-низации в материале, мы применили целый ряд методов, включая микроско-пию, малоугловое рассеяние и дифракцию рентгеновских лучей. Структурныеисследования были подтверждены исследованием продуктивности биомассы вреакции конверсии целлюлозы в глюкозу. Основными параметрами, определяю-щими эффективность преобразования биомассы, являются удельная площадьповерхности, которая в основном определяется размерами микроскопическихчастиц материалов и кристалличностью биомассы. Наши результаты показы-вают, что увеличение удельной поверхности делает материал более доступнымдля ферментов, а снижение кристалличности облегчает его усвоение фермен-тами.
Микрофибриллированная целлюлоза, полученная путем разрушения цел-люлозных волокон, может применяться для производства низкокалорийной пи-щи. Поскольку пищевые материалы подвергаются многочисленным стадиямсмешивания и резки во время производства и потребления, важно установитьстабильность материала МФЦ в таких условиях. Чтобы исследовать структуруМФЦ при сдвиговой деформации, мы разработали эксперимент по малоугло-вому рассеянию рентгеновских лучей на материалах находящихся под воздей-ствием сдвиговой деформации.
87

5
88 Краткое изложение
В главе 3 мы обсуждаем текущие разработки в области экспериментальныхячеек для малоуглового рассеяния рентгеновских и нейтронных экспериментовна материалах при сдвиге. В нашем поиске ячейки, которая бы удовлетворяланашим экспериментальным потребностям, мы обнаружили, что ни одна описан-ная ячейка из разработанный ранее, не может быть использована как для рент-геновского, так и для нейтронного эксперимента. Кроме того, большая частьописанных ячеек не может использоваться для эксперимента с пространствен-ным разрешением вдоль направления градиента сдвига ячейки. Чтобы избе-жать создания нескольких устройств для каждого конкретного эксперимента,мы спроектировали нашу ячейку для малокглового рассеяния на материалахнаходящихся под действием сдвиговой деформации таким образом, чтобы ееможно было использовать как для экспериментов по рентгеновскому и ней-тронному рассеянию, так и для ее легкой модификации с учетом несколькихразличных реологических геометрий.
Применение сдвиговой ячейки для исследования микрофибриллированногоцитрусового волокна описано в главе 4. Первый вопрос, на который был данответ в этом исследовании, заключался в том, будут ли волокна МФЦ выстра-иваться вдоль направлению сдвига. Проведенный эксперимент четко показалслучайную ориентацию микрофибрилл при скоростях сдвига до 300 с−1. Вто-рой вопрос касался уплотнения целлюлозных фибрилл в хлопьях, образован-ных при сдвиге, и возможности агломерации фибрилл. Хлопья существенно неизменили свой фрактальный размер при всех приложенных скоростях сдвига иво всех точках вдоль градиента сдвига. Это говорит о том, что материал оченьстабилен и может быть легко использован в условиях эксперимента.
Возможность применения вариации контраста в сочетании с малоугловымрассеянием нейтронов рассматривалась в главе 5. Было обнаружено, что ме-зоструктура гидрогенизированной бактериальной целлюлозы из разных источ-ников очень похожа. Однако обнаружено, что мезоструктура дейтерированногоматериала существенно отличается, что приводит к сильной агломерации и пол-ностью измененным реологическим свойствам. Это показывает, что изменениеконтраста в SANS не всегда позволяет определить расположение различныхкомпонентов.

ACKNOWLEDGEMENTS
I would like ot thank a number of people for their contributions to this thesis.First of all, I would like to thank my supervisor and a good friend of mine, Wim Bouw-
man, without whom this thesis would not have been possible. Wim, thank you for theopportunity to work on this project and for your trust in my ability to finish it. It was anhonor to be guided into science by you. I admire your ability to keep a healthy work-lifebalance, your unlimited patience and your passion for teaching.
Secondly, I would like to thank Bei Tian, who has been in the same boat with me forthe last four years. It was always interesting to talk with you, since we could disagree evenon the matters which I have never considered questionable. I have learned so much fromour discussions that I have enough material for a thesis on cultural differences, should Iever consider starting such a venture again.
Thirdly, I am greatful to our industrial partners from DSM, Unilever, TNO, and NIZO:Margot Schooneveld-Bergmans, John van Duynhoven, Ruud den Adel, Mazhar Nazim,Kees Van Malssen, Adrian Voda, Arjen Bot, Adriana Carvalho de Souza, Loes Bevers, Joostvan ’t Hoff, Joyce Heuvink, Maaike Nieuwland, Hans Tromp. Margot and John activelyparticipated in planning, design and discussions of the results of my experiments, Ruudhad helped me to get started with SAXS experiments and data treatment and sharedmany interesting thoughts about work and life in general. Adrian, Arjen, Maaike andHans were very attentive and full of ideas during our projcet meetings.
We had a very fruitful collaboration with people from Wageningen University andResearch: Tatiana Nikolaeva, Erik van der Linden, Paul Venema, Atze Jan Van Der Goot,Daan de Kort, Jinfeng Peng, and Harry Baptist. Thank you Tatiana for keeping optimisticatmosphere during sleepless nights at ESRF, endless drive through some side roads in themiddle of England, and even after finding out about measurements with closed shutter.
Also, I would like to thank all the colleagues from RID: Ad van Well, Adrie Laan, AldoHennik, Alexandros Vasileiadis, Andrei Kuzmin, Anton Lefering, Ashutosh Pati, BeienWang, Ben Harrison, Bert Zwart, Bowei Huang, Catherine Pappas, Chris Duif, DenisBykov, Dimitrios Bessas, Ekkes Brück, Ernst van der Wal, Fahad Al-Sayyari, Fulvio Bertoc-chi, Giacomo Borghi, Henk Schut, Henk van Doorn, Ignatz de Schepper, Ilse van derKraaij, Jaen Ocadiz Flores, Jeroen Koning, Jeroen Plomp, Jouke Heringa, Jurrian Bakker,Kees Goubitz, Koos van Kammen, Lambert van Eijck, Lars Bannenberg, Maarten Plokker,Maik Butterling, Marco Tiberga, Marnix Wagemaker Martijn de Boer, Matteo Gamarino,Michael Maschek, Michel Steenvoorden, Michel Thijs, Minh Phuong Nguyen, NicoleBanga, Niek de Klerk, Niels van Dijk, Paul Gubbens, Peter-Paul Harks, Robin de Krui-jff, Sara Mastromarino, Stephan Eijt, Steven Parnell, Swapna Ganapathy, Theo Rekveldt,Tomas Verhallen Trudy Beentjes, Valentina Valori, Violetta Arszelewska, Viviam MarquesPereira, Walter Legerstee, Weronika Wolszczak, Wicher Kraan, Xinmin You, Xue-Fei Miao,Yifan Fu, Zhaolong Li, Zhou Zhou, and Zoltan Perko. Thank you, Katia, your trust in myabilities and for providing me with every opportunity to stay out of my comfort zone.
89

5
90 Краткое изложение
Thank you, Chris, for your hospitality and enthusiasm which you shed on me ever sinceI first came to Delft for my first SESANS experiments. Thank you, Denis, for pulling meover the first threshold on the way to Delftian society and lifestyle. Thank you, Henkand Koos, for always keeping a bottle of Paulaner for me in ’t Koepeltje and for introduc-ing me to the rich Dutch beer culture. Thank you, Ignatz, for your help with calculationof scattering models, your experience in such calculations is really impressive. Ilse andNicole, thank you for taking care of paperwork related to my project, stay and trips, andfor your patience and persistence in improving my Dutch. Thank you, Jeroen for yourhelp in acquiring and maintaining my race bike. Jouke, thank you for your help withall of my computer-related issues and with translations. Lambert and Lars, thank youfor being a great company in the office, in the bar and in various swimming reservoirs.Thank you, Wicher, for your eager interest in my work and life and for keeping me up-dated on development of my previous project.
While working on this thesis I have got to supervise some amazing bachelor students:Fieneke van der Voort, Sebastian Wendt, Lisa de Kluijver. It was a deep pleasure to workwith you. I am happy to have been able to contribute to your education and am gratefulfor the help and support I have got back from you.
Most of the experiments described in this thesis were performed at various inter-national facilities. Success of these experiments was largely determined by support fromlocal scientists at the facilities. I am grateful to Adam Washington, Najet Mahmoudi, RobDalgleish, Sarah Rogers, and Stephen King from ISIS Neutron and Muon Source, AnnaSokolova, Elliot Paul Gilbert, Jamie Schulz, Jitendra Mata, and Norman Booth from Aus-tralian Nuclear Science and Technology Organisation, Daniel Hermida Merino MichaelSztucki, Theyencheri Narayanan, Vadim Dyadkin, and Wim Bras from European Syn-chrotron Radiation Facility.
Large part of my expertise in scattering of neutrons and X-ray is based on the knowl-edge and experience I had gained during my time Petersburg Nuclear Physics Institute.I am grateful to people who introduced me to these techniques: Leonid Axelrod, SergeyGrigoriev, Vladimir Zabenkin, and Yurii Chetverikov. Thank you, Sergey, for noticing mypotential and giving me the opportunity to enter this field.
Last, but not least I would like to thank the people who were around me outsideworking hours and who did their best to keep me sane especially during the toughesttimes in the last four years: Aldo Hennik, Caroline Ryzhkouskaya, Denis Rusakovich,Fahad Al-Sayyari, Jan Chau, John Eriksson, Koos van Kammen, Maaike Jantine van Veld-huizen, Maikel Lourenssen, Michael Rein, Milen Stefanov, Mikhail Alekhin, Mikhail Ship-ilin, Natalia Velichko, Nikos Poulopoulos, Olga Foin, Pavlo Bazilinskyy, Rody Saito-Snijder,Sara Mastromarino, Sharida Wekker, Tatiana Velichko, and Viktoria Kim. It is alwaysgreat to meet and do some sports, or share a drink/food/trip with you. Thanks to allof you, I have always had some nice distractions from work, which resulted in increaseof my long-term productivity.
I am a very lucky person to have met such a large number of incredibly good people.Without any doubt, not all of these who deserve to be acknowledged have been, and Isincerely apologize for it. Should you have been unjustly not mention – come and claima compensation in beer- or coffee equivalent.

CURRICULUM VITÆ
Evgenii VELICHKO
17-10-1988 Born in Nizhny Tagil, USSR.
EDUCATION AND EMPLOYMENT1995–2005 Ordinary school #64 in Nizhny Tagil
2005–2009 Bachelor of Science in ChemistryURAL STATE UNIVERSITY
2005–2006 Sales promoterCOMMERCIAL NETWORK KUPETS
2006–2007 Passenger car attendantRUSSIAN RAILWAYS
2008–2011 Laboratory assistantURAL STATE UNIVERSITY
2009–2011 Master of Science in ChemistryURAL FEDERAL UNIVERSITY
2011–2014 Senior laboratory assistantPETERSBURG NUCLEAR PHYSICS INSTITUTE
2014–2015 Junior researcherPETERSBURG NUCLEAR PHYSICS INSTITUTE
2015-2019 PhD candidateDELFT UNIVERSITY OF TECHNOLOGY
Thesis: Small-angle scattering by cellulose. Structuralchanges in cellulosic materials under chemical andmechanical treatments
Promotor: Dr. W. G. Bouwman
91


LIST OF PUBLICATIONS
11. Evgenii Velichko, Bei Tian, Tatiana Nikolaeva, Jeroen Koning, John van Duynhoven, andWim G. Bouwman A versatile shear cell for investigation of structure of food materials undershear, Colloids and Surfaces A: Physicochemical and Engineering Aspects 566, 21-28 (2019).
10. Tatiana Nikolaeva, Ruud den Adel, Evgenii Velichko, Wim G. Bouwman, Daniel Hermida-Merino, Henk van As, Adrian Voda, and John van Duynhoven Networks of micronized fatcrystals grown under static conditions, Food & Function 9, 2102-2111 (2018).
9. Evgenii Velichko, Aleksandr Buyanov, Natalia Saprykina, Yurii Chetverikov, Chris Duif, WimG. Bouwman, and Ruslan Smyslov High-strength bacterial cellulose–polyacrylamide hydro-gels: Mesostructure anisotropy as studied by spin-echo small-angle neutron scattering andcryo-SEM, European Polymer Journal 88, 269-279 (2017).
8. Ekaterina Iashina, Evgenii Velichko, Mikhail Filatov, Wim G. Bouwman, Chris Duif, AnnieBrulet, and Sergei Grigoriev Additive scaling law for structural organization of chromatin inchicken erythrocyte nuclei, Physical Review E 96, 012411 (2017).
7. Konstantin Pavlov, Evgenii Velichko, Vladimir Zabenkin, Wicher Kraan, Chris Duif, Wim G.Bouwman, Zoia Michailovskaya, Elena Buyanova, and Sergei Grigoriev Investigation of theClosed Porosity of Functional Ceramic Materials by Spin-Echo Small-Angle Neutron Scatter-ing, Journal of Surface Investigation: X-ray, Synchrotron and Neutron Techniques 11, 92-98(2017).
6. Alexandr Ostroushko, Lidiya Adamova, Ekaterina Eremina, Kirill Grzhegorzhevskii, EvgeniiVelichko, Savva Bogdanov, and Aleksei Pirogov Thermodynamics of acetone sorption fromvapor phase by Keplerate and toroid polyoxomolybdate nanoclusters, Russian Journal of Phys-ical Chemistry A 91, 1313-1318 (2017).
5. Viktor Ukleev, Reda Moubah, Dmitrii Baranov, Sergei Gastev, Boris Krichevtsov, EvgeniiVelichko, Nikita Kulesh, Yurii Chetverikov, and Sergei Grigoriev Imprinted Magnetic Anisotropyand Zigzag Domain Structure of Amorphous TbCo Films, Journal of Superconductivity andNovel Magnetism 28, 3571-3577 (2015).
4. Wicher Kraan, Leonid Akselrod, Yurii Chetverikov, Sergei Grigoriev, Evgenii Moskwin, VasilyPiyadov, Kyaw Thu Set, Arsen Sumbatyan, Evgenii Velichko, and Vladimir Zabenkin Presentstatus and prospects for Spin-Echo Small-Angle Neutron Scattering (SESANS) at PIK neu-tron source, Journal of Surface Investigation. X-ray, Synchrotron and Neutron Techniques8, 1035-1043 (2014).
3. Evgenii Velichko, Yurii Chetverikov, Leonid Akselrod, Vladimir Zabenkin, Vasily Piyadov,Arsen Sumbatyan, Wicher Kraan, and Sergei Grigoriev Spin-echo small-angle neutron scat-tering device: Test experiment using SiO2 colloidal particles, Journal of Surface Investigation.X-ray, Synchrotron and Neutron Techniques 7, 401-406 (2013).
93

94 LIST OF PUBLICATIONS
2. Evgenii Velichko, Zoia Mikhailovskaya, Maria Morozova, Elena Buyanova, Yulia Emel’yanova,Sofia Petrova, and Vladimir Zhukovskii Synthesis, region of existence, structural characteris-tics, and conductivity of BI(CR, FE)VOX solid solutions, Russian Journal of Electrochemistry47, 563-568 (2011).
1. Yulia Emel’yanova, Maria Morozova, Zoia Mikhailovskaya, Evgenii Velichko,Elena Buyanova,
and Vladimir Zhukovskii Synthesis processes and transport properties of solid solutions in the
Bi2O3-GeO2-V2O5 system, Russian Journal of Electrochemistry 45, 382-387 (2009).