small and medium enterprises landscape in egypt: new …sme.ebi.gov.eg/documents/a paper on smes...
TRANSCRIPT

Small and Medium Enterprises Landscape in Egypt:
New Facts from a New Dataset
Hala El-Said* Mahmoud Al-Said
† Chahir Zaki
‡
Abstract
Small and medium sized enterprises (SMEs) have usually been perceived as a dynamic
force for sustained economic growth and job creation in developing countries. In Egypt,
despite banking reforms that have been launched in 2004, the ability of SMEs to more
easily access suitable and sufficient means of finance has always been considered a major
obstacle facing many SMEs. For this reason, and in order to be able to extend the
financial services provided to this segment and increase the benefits of the banking
reform, the Central Bank of Egypt launched in December 2008 an initiative, as an
integral part of the Second Phase of the Banking Sector Reform Program (2008-2011), to
enhance SMEs access to finance and banking services. In this paper, we present a
descriptive analysis of the SMEs landscape in Egypt relying on this extensive census. The
main findings of the census show that there is a high concentration of SMEs at different
levels. First, the geographical distribution of SMEs is significantly skewed since almost
half of them are concentrated in three governorates Sharkeya, Cairo and Gharbeya.
Second, they are chiefly operating in two economic activities, namely manufacturing and
trade. Third, a very few firms are exporting. Finally, financial services seem to be under-
utilized by SMEs as only 50 percent are dealing with banks and benefiting from an
improved access to finance.
Keywords: MSEs, Access to Finance, Egypt.
JEL Classifications: D2, G21, P42.
* Professor of Economics, Dean of the Faculty of Economics and Political Science, Cairo University.
Email: [email protected]
† Assistant Professor of Economics, Faculty of Economics and Political Science, Cairo University.
Email: [email protected]
‡ Assistant Professor of Economics, Faculty of Economics and Political Science, Cairo University.
Email: [email protected]

1. Introduction
Micro, small and medium sized enterprises (SMEs) have usually been perceived
as a dynamic force for sustained economic growth and job creation in developing
countries. From a social viewpoint, SMEs secure livelihood for a large and ever
expanding segment of the population. In Egypt, there are around 2.5 Million SMEs
representing 75% of the total employed workforce and 99% of non-agricultural private
sector establishments. Despite their importance, they are still facing several problems, in
particular access to finance which a typical challenge in developing countries. In fact,
70% of non-OECD countries report SME financing gap compared to 30% in OECD ones.
Therefore, reducing this SMEs financing gap in low-income countries should increase the
incentive of SMEs creation and consequently improve economic growth and increase job
creation. In addition, improving the access to finance of SMEs is significantly important
in promoting entrepreneurship and innovation.
In Egypt, despite banking reforms that have been launched in 2004, the ability of
SMEs to more easily access suitable and sufficient means of finance has always been
considered a major obstacle facing many SMEs (Egyptian Banking Institute, 2009). It is
worthy to mention that, from a supply point of view, the majority of banks are becoming
more risk averse towards SMEs, especially due to a wide spread notion that financing
SMEs is risky and that serving them requires high transaction costs which makes them
less profitable than larger companies.
For this reason, and in order to be able to extend the financial services provided to
this segment and increase the benefits of the banking reform, establishing a database for
SMEs to serve bankers as well as policy makers seems to be an important priority.
Hence, the Central Bank of Egypt launched in December 2008 an initiative, as an integral
part of the Second Phase of the Banking Sector Reform Program (2008-2011), to enhance
SMEs access to finance and banking services. In this respect, and due to the importance
of the availability of timely and accurate information, the Central Bank of Egypt (CBE)
and the Egyptian Banking Institute (EBI) commissioned the Central Agency for Public
Mobilization and Statistics (CAPMAS) to conduct an SME nation-wide census, fully
focusing on value added formal economic activities on a full census basis. The Center of
Surveys and Statistical Applications (CSSA) at the Faculty of Economics and Political
Science, Cairo University undertook the project on- site quality control. This survey
includes quantitative and qualitative characteristics of each company or unit. This
includes identifying the number of employees, legal status, economic activity, level of
exports, sales turnover, invested capital and the problems facing each company in dealing
with banks, etc.

In this paper, we present a descriptive analysis of the SMEs landscape in Egypt
relying on this extensive census. The main findings of the census show that there is a
high concentration of SMEs at different levels. First, the geographical distribution of
SMEs is significantly skewed since almost half of them are concentrated in three
governorates (Sharkeya, Cairo and Gharbeya). Second, they are chiefly operating in two
economic activities, namely manufacturing and trade. Third, a very few firms are
exporting. Finally, financial services seem to be under-utilized by those firms as only 50
percent are dealing with banks and benefiting from an improved access to finance. It is
worthy to mention that those financial services are also concentrated in the same
governorates and the same economic activities that have been mentioned above.
The paper is organized as follows: Section 2 presents some stylized facts
regarding the banking sector reform in Egypt. Section 3 shows the questionnaire design.
Section 4 presents a landscape of SMEs characteristics using the firm-level data that have
been collected. Section 5 focuses on SMEs and their access to finance. Finally, section 6
concludes and presents some policy implications.
2. Banking Reform in Egypt
The Central Bank of Egypt in 2004 adopted a reform program that aims at
building solid infrastructure and more efficient and sound banking sector. Although the
global financial crisis led to many negative repercussions on several world economies,
the Egyptian banking sector weathered the negative repercussions due to the successful
reform program that have launched in 2004. Indeed, as it was mentioned by the World
Bank (2009) “the Egyptian financial sector is the most far reaching, substantive and
comprehensive drive toward financial sector strengthening so far in Egypt - and indeed
in any other country of the Middle East and North Africa region”.
This reform has been implemented in two phases. The first phase had three main
pillars: first, strengthening the legal, regulatory and supervisory framework; second,
consolidating the banking sector and increasing private participation within banking
assets and finally the financial, operational and institutional restructuring of public-sector
banks. Those reforms led to a robust, solid and well capitalized banks (see Table 1), as
banks decreased from 57 to 39; assets increased by 88% to reach EGP 1.1 billion in 2008
up from EGP 0.57 billion in 2003; total deposits increased by 85% over the same period;
capital adequacy ratio increased from 12.2% to reach 15.1% and total net worth increased
by more than 100% from EGP 32 billion to EGP 75 billion.

Table 1: Banking Aggregates before and after 2004 Reform
LE million (as at June)
2003 2008 % change
Total Assets 577,938 1,083,311 + 87.7%
Total Deposits 403,144 747,199 + 85,3%
Loans & Discounts 284,722 401,425 + 41.2%
Capital & Reserves 29,960 53,436 +82.7%
Source: Central Bank of Egypt.
The second phase of the banking sector reform program that started in 2009 aims
at deepening the Egyptian banking sector and enhancing its efficiency and
competitiveness through enhancing Access to Financial Services, continuing the
strengthening of the regulatory and supervisory framework through the implementation
of Basel II/III and enhancing the implementation of Corporate Governance rules and
regulations. Those reforms increased the loans-deposits ratio reaching 54%, average
loans-GDP ratio reaching 49.4% and average deposits-GDP ratio reaching 90%. Those
figures are much higher than the world average in 2008.
Yet, despite this significant improvement at the macroeconomic level, there is still
a challenge related to the access to finance, especially for SMEs. Figure 1 shows that, in
non-OECD countries, bank’s primary target is large enterprises that represent only 1
percent of total firms. By contrast, micro-firms, though representing around 70 percent of
total firms, get merely credit or financial services from banks.
Figure 1: Business Landscape in Non-OECD Countries
Source: OECD, 2011.
For this reason, and in order to be able to extend the financial services provided to
this segment and increase the benefits of the banking reform, establishing a database for

SMEs to serve bankers as well as policy makers seems to be an important priority.
Hence, as it was mentioned before, the Central Bank of Egypt launched in December
2008 an initiative, as an integral part of the Second Phase of the Banking Sector Reform
Program (2008-2011), to enhance SMEs access to finance and banking services. The next
section provides more details about this census.
3. Questionnaire Design
3.1. Structure
The questionnaire includes four main categories of questions.
First, it contains some general information regarding the legal status of the firm
(whether it is a partnership, a limited liability firm, branch of a foreign firm, sole
proprietorship, etc.). In addition, since only formal firms are taken into account, the
interviewee should mention the number and the date of his industrial and commercial
registration.
Second, it includes some information related to the firm endowments, such as the
number of workers (less than 20; from 20 to 34; from 35 to 50 and more than 51) and the
value of the capital.
Third, the questionnaire is categorizing firms according to the sales turnover
which is the variable banks consider the most while giving loans. In addition, this section
includes some questions showing whether the firm exports or not, the destination of
exports (Arab countries, African countries, other) and the share of exports to total sales
(less than 25%, from 25 to 50% and more than 50%).
Fourth, the questionnaire contains a final module on access to finance by asking
the interviewee:
- whether she/he deals with banks or not,
- whether she/he benefits from some banking facilities or not,
- whether she/he faces problems with banks or not and if yes, she has to determine
the type of the problems (high interests, commissions and administrative
expenses; banks ask for a lot of collaterals; procedures are lengthy and
complicated; banks ask for a lot of documents; others)

3.2. Scope:
The census covers all SMEs in Egypt, identified here as every company or
economic activity:
- That is formally registered: therefore we exclude informal firms which represent
almost 20 percent in Egypt
- That employs five employees or more.
- That has a significant economic value added: thus activities of limited economic
value added have been excluded, namely Barber shops, beauty salons and kiosks
were excluded from the survey.
In other words, three filters have been taken into account in order to include only
registered firms with more than 5 employees and having a significant value-added. Based
on these criteria, the census ended-up by including around 36, 492 firms.
3.3. Methodology:
First, it is worth to mention that the framework used is that developed by the Central
Agency for Public Mobilization and Statistics (CAPMAS) in 2006 adding new establishments
and excluding activities of limited economic value added. Second, the primary data was obtained
through conducting face to face interviews with SMEs, using a well-structured questionnaire
designed jointly by Central Bank of Egypt (CBE) / Egyptian Banking Institute (EBI) committee
in consultation with an experienced statistician to measure both quantitative and qualitative
factors. The census was done through seven phases to guarantee the quality of the
collected data
Pre-Testing the questionnaire: A pretest of the questionnaire was conducted to a sample
of SMEs in “El Qualiobia” governorate whereby some modifications and repositioning of
sequence of questions was made according to the pretest results.
Training of CAPMAS researchers: Extensive training sessions were conducted to all
CAPMAS field researchers to ensure their understanding of the questionnaire and the
approach in conducting the interviews. The training was conducted jointly by CAPMAS
and the Center of Surveys and Statistical Applications (CSSA) at the Faculty of
Economics and Political Science under the supervision of CBE and EBI.
Pilot: After collecting the data of the pilot (that was conducted in “El-Sharkia”
governorate in April 2010) the data collected was analyzed, verified and validated,
accordingly, some activities of limited economic value added were excluded throughout
the survey.

Collecting the data: Data was collected through face-to-face interviews conducted by
CAPMAS researches using the developed questionnaire.
Quality Control: Two different quality control teams were assigned to ensure the validity
and accuracy of the data collection process
On-site QC: Undertaken by the (CSSA) that was responsible for monitoring and
controlling the process of data collection in the field on a daily basis.
Off-site QC: Undertaken by a joint team from CBE and EBI responsible for verification
and quality controlling the data entry process with random checks.
4. Landscape of SMEs in Egypt
4.1. Legal Form
Figure 2 shows the distribution of SMEs according to the legal form. SMEs adopt
chiefly a sole-proprietorship (that represents almost 60 percent of total firms) given the
fact that it is the easiest to be created. Those firms are owned and run by one individual
and in which there is no legal distinction between the owner and the business. The owner
receives all profits (subject to taxation specific to the business) and has unlimited
responsibility for all losses and debts. Its advantages are related to the fact that
entrepreneurs have the ability to limit risk to investors. Sole proprietorships also have the
least government rules and regulations affecting it which fosters their creation by
entrepreneurs. The remaining 40 percent are distributed among joint liability, partnership
in commendams, joint stock, de facto, limited liability, limited partnership in shares and
subsidiaries.

Figure 2: Distribution of SMEs by Legal Form
Source: Constructed by the authors using SMEs dataset
4.2. Geographical Location
It is worthy to note that SMEs are highly skewed at the geographical level since
almost half of them is concentrated in the three governorates of Sharkeya, Cairo and
Gharbeya (see Figure 3). This may be explained by higher externalities coming from
other firms which are located in large governorates that are located in urban regions.
Similarly, access to road and to transportation of goods positively and significantly
affects firms’ productivity as they allow firms to better produce and market their products
or services to a wider scope of clients. Finally, since other governorates have not a
significant share of SMEs, more attention should be attribute to them in order to improve
their infrastructure and therefore to allow firms to be established there.
0.0%
10.0%
20.0%
30.0%
40.0%
50.0%
60.0%
58.2%
19.2% 10.7% 7.3%
2.8% 1.3% 0.3% 0.1%

Figure 3: Distribution of SMEs by Governorates
Source: Constructed by the authors using SMEs dataset
4.3. Factors of Production
Moving to factors of production, it is worthy to mention that differences in
endowments between SMEs are notably important. First, as it is shown in Figure 4, 83
percent of SMEs are endowed with a capital less than EGP 250, 000. By contrast, those
having more than EGP 15 million do not exceed 2 percent of total SMEs in Egypt
pointing out to what extent SMEs should have a higher access to financial services and
facilities from banks to expand their activities and increase their capital.
Figure 4: Distribution of SMEs by Capital Value
Source: Constructed by the authors using SMEs dataset
0.0%
2.0%
4.0%
6.0%
8.0%
10.0%
12.0%
14.0%
16.0%16.0%
15.0%
9.2%
6.1% 6.1% 6.0% 5.0% 4.7% 4.5%
3.5% 3.3% 2.5% 2.4% 2.1% 1.9% 1.8% 1.8% 1.7% 1.4% 1.3%
3.7%
82.6%
7.6% 5.3%
2.4% 1.0%
1.0%
Less than 250,000 LE
250,000 LE - Less than million
Million - Less than 5 millions
5 Millions - Less than 15Millions
15 Millions - Less than 30Millions
30 Millions or More

The same pattern observed for capital holds for labor (see Figure 5) since SMEs
with the capacity of 5-19 workers represent the highest percentage (85.4 percent). By
contrast, on the other side of the distribution, only 6.3 percent of SMEs have a capacity of
more than 50 workers. Therefore, most of the firms are either micro or small pointing out
the phenomenon of the “missing middle”, in which many small firms and a few large
firms produce the bulk of value added which is ubiquitous in developing countries.
Figure 5: Distribution of SMEs by Number of Employees
Source: Constructed by the authors using SMEs dataset
Figure 6: Distribution of SMEs According to the
Number of Employees and the Capital
Source: Constructed by the authors using SMEs dataset
Figure 6 confirms those findings by plotting the distribution of SMEs according to
labor and capital. One can conclude that the lower the number of employees, the less
capital it owns and the lower the output. That is why the coefficient of association
between capital and labor for SMEs in Egypt is notably high in most of the activities,
especially manufacturing, trade, food and beverage and agriculture (see Table 2).
0.0%
20.0%
40.0%
60.0%
80.0%
100.0%
<20 >50 20-34 35-50
85.4%
6.3% 5.8% 2.4%
0.00%10.00%20.00%30.00%40.00%50.00%60.00%70.00%80.00%90.00%
100.00%
Less than250,000 LE
250,000 LE -Less than
Million
Million -Less than 5
Millions
5 Millions -Less than
15 Millions
15 Millions -Less than
30 Millions
30 Millionsand More
93.60%
64.10%
43.30% 49.40%
62.10% 71.30%
<20
20-34
35-50
>50

Therefore, it can be claimed there are some complementarities between labor and capital
in Egyptian SMEs.
Table 2: Relationship Between Capital and Number of Employees, by
activity (measured in terms of the appropriate association coefficient)
Activities
Agriculture 0.756
Manufacturing 0.823
Trade 0.867
Food & Beverages 0.819
Health 0.689
Construction & Building 0.475
Other 0.66 Source: Constructed by the authors using SMEs dataset
4.4. Economic Activity
As it was mentioned before, SMEs in Egypt are highly skewed at the geographical
level. Such skewness is observed at the sectoral level (see Figure 7) as well since almost
90 percent of them are concentrated in just two sectors namely the manufacturing sector
(51.1 percent), followed by the whole sale trade (40.5 percent). This is due to the fact that
the entry barriers in terms of capital, skill and technology characteristics are low,
especially in the trade sector.
Figure 7: Distribution of SMEs by Economic Activities
Source: Constructed by the authors using SMEs dataset
0.0%
10.0%
20.0%
30.0%
40.0%
50.0%
60.0% 51.1%
40.5%
1.7% 1.6% 1.3% 1.1% 2.6%

4.5. SMEs Performance at the Domestic level
SMEs performance at both the domestic and international levels is highly
dependent on their factor endowments. Clearly, larger firms with more capital and more
labor are more likely to be productive and therefore have higher sales turnover. Figure 8
points out the distribution of SMEs according to sales turnover and shows that almost
half of the SMEs’ sales are less than EGP 500, 000. By contrast, those who are producing
between EGP 20 million and EGP 50 million does not exceed 2 percent of total SMEs.
Figure 8: Distribution of SMEs According to the Sales Turnover
Source: Constructed by the authors using SMEs dataset
Figure 9 adds another finding related to the link between the number of
employees and the sales turnover, i.e. their productivity. One can claim that the higher the
number of employees, the higher the sales turnover. This finding can be verified for the
lowest and highest categories of the sales turnover. In fact, 97 percent of the SMEs
producing less than EGP 500, 000 are endowed with less than 20 employees and 60
percent of the SMEs producing between EGP 20 and 50 million have more than 50
employees. Yet, it becomes more problematic for firms that are endowed with 20-34 and
35-50 employees since their shares in the middle categories of the sales turnover (half a
million to less than a million and million to less than 20 million) are significantly low.
Surprisingly, 90 (54) percent of the firms producing between EGP 500,000 and EGP
1,000,000 (million - 20 million) have also less than 20 employees showing that those
small firms are more productive than their medium counterparts. This confirms the
missing middle story since most companies are small and between large and small firms,
SMEs are very scarce, perform poorly and consequently constitute a “missing middle”.
One of the suggestions that may increase their productivity is to target clusters
establishment. Cluster locations are good candidates to host and disseminate new
technologies, training and marketing techniques; moreover new policies have a greater
50.4%
27.4%
20.2%
2.0% Less than Half a Million
Half a Million - Less than Million
Million - Less than 20 Millions
20 Millions - Less than 50Millions
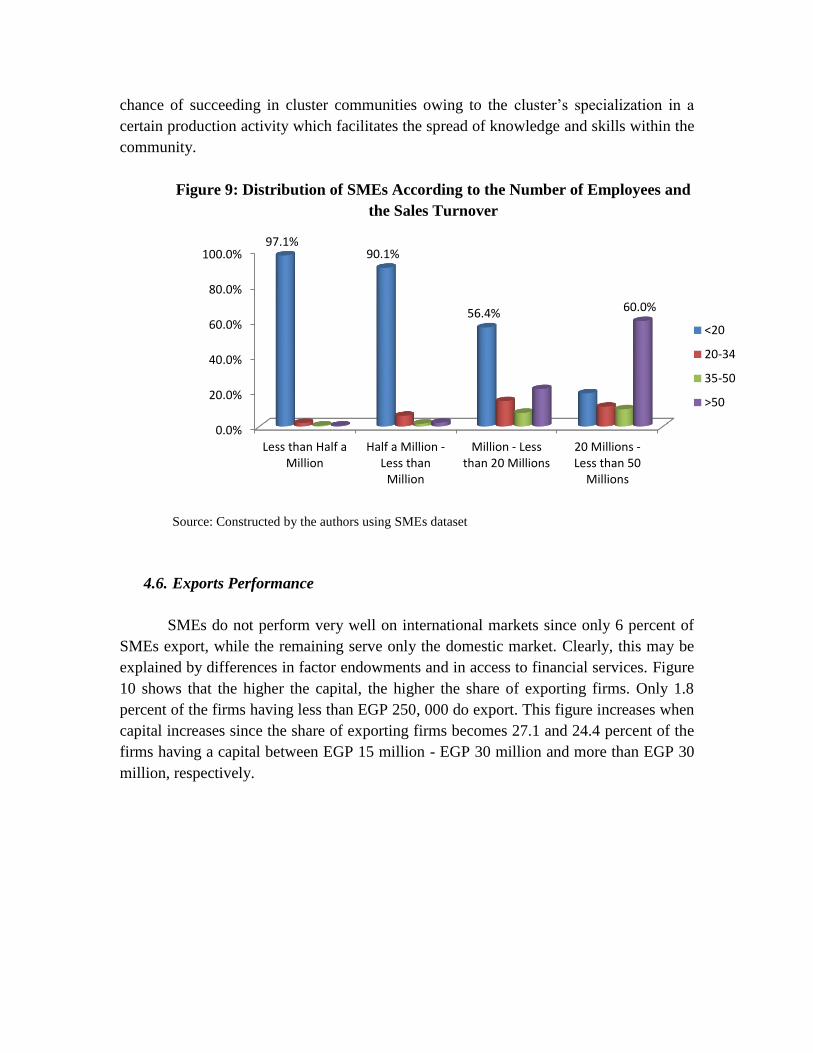
chance of succeeding in cluster communities owing to the cluster’s specialization in a
certain production activity which facilitates the spread of knowledge and skills within the
community.
Figure 9: Distribution of SMEs According to the Number of Employees and
the Sales Turnover
Source: Constructed by the authors using SMEs dataset
4.6. Exports Performance
SMEs do not perform very well on international markets since only 6 percent of
SMEs export, while the remaining serve only the domestic market. Clearly, this may be
explained by differences in factor endowments and in access to financial services. Figure
10 shows that the higher the capital, the higher the share of exporting firms. Only 1.8
percent of the firms having less than EGP 250, 000 do export. This figure increases when
capital increases since the share of exporting firms becomes 27.1 and 24.4 percent of the
firms having a capital between EGP 15 million - EGP 30 million and more than EGP 30
million, respectively.
0.0%
20.0%
40.0%
60.0%
80.0%
100.0%
Less than Half aMillion
Half a Million -Less than
Million
Million - Lessthan 20 Millions
20 Millions -Less than 50
Millions
97.1% 90.1%
56.4% 60.0%
<20
20-34
35-50
>50

Figure 10: Distribution of SMEs by Exporting Status and Capital
Source: Constructed by the authors using SMEs dataset
This remark holds for both labor (Figure 11) and sales turnover (Figure 12) since
the higher the number of employees and/or the higher the sales turnover, the more a firm
is likely to export. Figure 11 shows that 28.4 percent of the firms endowed with more
than 50 employees do export. This figure is remarkably low for small firms since
exporting firms represent only 1.8 percent of those having less than 20 employees.
Figure 11: Distribution of SMEs by Exporting Status and Number of Employees
Source: Constructed by the authors using SMEs dataset
0%
20%
40%
60%
80%
100%
Less than250,000 LE
250,000 LE -Less than
Million
Million - Lessthan 5
Millions
5 Millions -Less than 15
Millions
15 Millions -Less than 30
Millions
30 Millionsand More
1.8% 11.6%
20.8% 27.0% 27.1% 24.4%
98.2% 88.4%
79.2% 73.0% 72.9% 75.6%
Exporting Not Exporting
0%
20%
40%
60%
80%
100%
<20 20-34 35-50 >50
1.8% 13.3% 19.8%
28.4%
98.2% 86.7% 80.2%
71.6%
Exporting Not Exporting
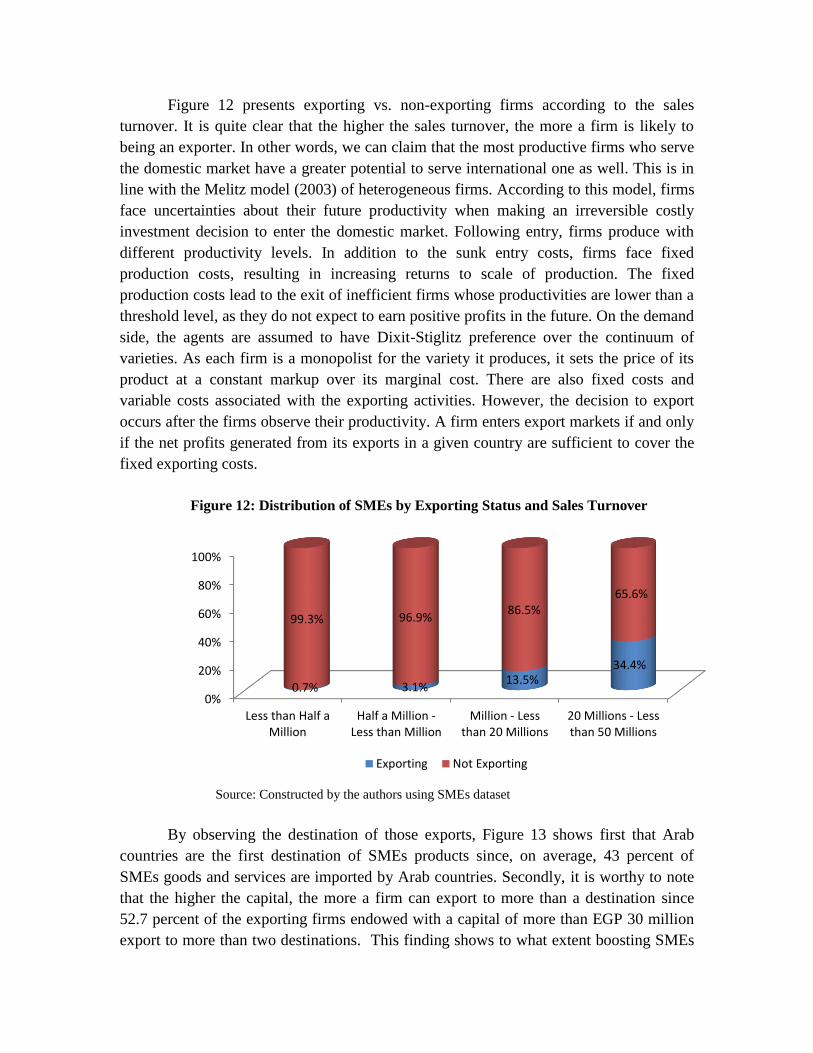
Figure 12 presents exporting vs. non-exporting firms according to the sales
turnover. It is quite clear that the higher the sales turnover, the more a firm is likely to
being an exporter. In other words, we can claim that the most productive firms who serve
the domestic market have a greater potential to serve international one as well. This is in
line with the Melitz model (2003) of heterogeneous firms. According to this model, firms
face uncertainties about their future productivity when making an irreversible costly
investment decision to enter the domestic market. Following entry, firms produce with
different productivity levels. In addition to the sunk entry costs, firms face fixed
production costs, resulting in increasing returns to scale of production. The fixed
production costs lead to the exit of inefficient firms whose productivities are lower than a
threshold level, as they do not expect to earn positive profits in the future. On the demand
side, the agents are assumed to have Dixit-Stiglitz preference over the continuum of
varieties. As each firm is a monopolist for the variety it produces, it sets the price of its
product at a constant markup over its marginal cost. There are also fixed costs and
variable costs associated with the exporting activities. However, the decision to export
occurs after the firms observe their productivity. A firm enters export markets if and only
if the net profits generated from its exports in a given country are sufficient to cover the
fixed exporting costs.
Figure 12: Distribution of SMEs by Exporting Status and Sales Turnover
Source: Constructed by the authors using SMEs dataset
By observing the destination of those exports, Figure 13 shows first that Arab
countries are the first destination of SMEs products since, on average, 43 percent of
SMEs goods and services are imported by Arab countries. Secondly, it is worthy to note
that the higher the capital, the more a firm can export to more than a destination since
52.7 percent of the exporting firms endowed with a capital of more than EGP 30 million
export to more than two destinations. This finding shows to what extent boosting SMEs
0%
20%
40%
60%
80%
100%
Less than Half aMillion
Half a Million -Less than Million
Million - Lessthan 20 Millions
20 Millions - Lessthan 50 Millions
0.7% 3.1% 13.5%
34.4%
99.3% 96.9% 86.5%
65.6%
Exporting Not Exporting

capital endowments can increase their productivity, change their non-exporting status or
even help them to serve several foreign markets.
Figure 13: Distribution of SMEs by Capital and Importing Country
Source: Constructed by the authors using SMEs dataset
Finally, another factor affecting firms exporting status is related to having access
to financial services. Figure 14 shows that 91.5 percent of exporting firms deal with
banks. Consequently, all those factors affect SMEs productivity and that is why only
larger firms having more employees, with a larger capital and having access to banking
facilities are the most productive and therefore are the most likely to export.
Figure 14: Distribution of SMEs by Exporting Status and Dealing with Banks
Source: Constructed by the authors using SMEs dataset
0%
20%
40%
60%
80%
100%
Less than250,000 LE
250,000 LE -Less than
Million
Million - Lessthan 5
Millions
5 Millions -Less than 15
Millions
15 Millions -Less than 30
Millions
30 Millionsand More
55.6% 51.1% 46.0% 35.3% 38.9% 31.9%
1.3% 1.5%
3.0%
2.9% 1.1% 2.2%
18.5% 15.2% 18.3%
19.7% 12.6% 13.2%
24.5% 32.2% 32.7% 42.0% 47.4% 52.7%
Arab Countries Only African Non-Arab Countries Only
Other Countries Only Two or more Destinations
0%
20%
40%
60%
80%
100%
Exporting Not Exporting
91.5%
44.9%
8.5%
55.1%
Dealing with Banks Not Dealing with Banks

5. Access to Finance
From the SMEs’ point of view, it is more difficult for SMEs to obtain financing
from banks, as: the government and international development communities are focusing
more on micro businesses; banks often prefer to extend credit to large corporate clients
and connected individuals that are considered less risky; and finally, banks are much
more trust worthy than obtaining it from other sources.
Yet, from the banks point of view, it is less risky to provide loans for larger
businesses since they are more stable, less prone to risk, have available records, have
structured information, are easier to access, are more profitable. By contrast, small
businesses are less stable, are more prone to risk, don’t have available records, have
unclear information, are difficult to access and are less profitable. They suffer from some
other problems such as: lack of business documents (such as registration, license, and tax
cards) and the reliability of financial statements, as well as the ‘financial performance’
represent 70 percent; weakness of management and lack of business plans. Bearing these
characteristics in minds, we found that 47 percent of SMEs in Egypt do not deal with
banks and 22.4 percent have access banking facilities as shown in Figures 15 and 16.
Figure 15: Distribution of SMEs According to Dealing with Banks
Source: Constructed by the authors using SMEs dataset
Figure 16: Distribution of SMEs According to Having Facilities from Banks
Source: Constructed by the authors using SMEs dataset
47.0%
53.0%
Yes
No
22.4%
77.6%
Yes
No

It is worthy to examine the factors that determine access to finance. First, as it was
mentioned above, there is a strong correlation between number of employees, capital and
sales turnover. This is reflected on the access to finance since that the higher the capital
(Figure 17), the larger the firm (Figure 18) and the more it sells (Figures 19 and 20), the
more a firm is likely to deal with banks and benefit from financial services. This is why
18.6 percent and 41.2 of small firms with a capital less than EGP 250,000 and/or less
than 20 employees respectively deal with banks and have access to banking facilities.
Those figures are substantially higher for larger firms since 59 and 84 percent of SMEs
with a capital more than EGP 30 million and/ or more than 50 employees respectively
deal with bank.
Figure 17: Distribution of SMEs by Banking Facilities and Capital
Source: Constructed by the authors using SMEs dataset
Figure 18: Distribution of SMEs by Dealing with Banks and Number of Employees
Source: Constructed by the authors using SMEs dataset
0%
20%
40%
60%
80%
100%
Less than250,000 LE
250,000 LE- Less than
Million
Million -Less than 5
Millions
5 Millions -Less than
15 Millions
15 Millions- Less than30 Millions
30 Millionsand More
18.6% 33.3% 41.7%
50.9% 49.3% 58.7%
81.4% 66.7% 58.3% 49.1% 50.7% 41.3%
Have Banking Facilities Do not Have Banking Facilities
0%
20%
40%
60%
80%
100%
<20 20-34 35-50 >50
41.2%
76.4% 84.4% 84.1%
58.8%
23.6% 15.6% 15.9%
Dealing with Banks Not Dealing with Banks

Figure 19: Distribution of SMEs by Banking Facilities and Sales Turnover
Source: Constructed by the authors using SMEs dataset
Figure 20: Distribution of SMEs by Dealing with Banks and Sales Turnover
Source: Constructed by the authors using SMEs dataset
Numerous studies have discussed that SMEs are financially more constrained than
large firms and are less likely to have access to formal finance. Banks are not adequately
providing SMEs with capital in developing countries as there is large financing gap for
SMEs in developing countries. For instance, the top five banks serving SMEs in non-
OECD countries reach only 20% of formal micro enterprises and SMEs. In addition, in
Sub-Saharan Africa, this number is even lower, at 5%. Nearly 25% of SMEs in emerging
markets have a loan but are financially constrained, and almost 60% do not have a loan
0%
20%
40%
60%
80%
100%
Less than Half aMillion
Half a Million -Less than Million
Million - Lessthan 20 Millions
20 Millions - Lessthan 50 Millions
12.6% 26.5%
37.9% 56.5%
87.4% 73.5%
62.1% 43.5%
Have Banking Facilities Do not Have Banking Facilities
0%
20%
40%
60%
80%
100%
Less than Half aMillion
Half a Million -Less than Million
Million - Lessthan 20 Millions
20 Millions - Lessthan 50 Millions
31.0% 52.2%
75.3% 95.5%
69.0% 47.8%
24.7% 4.5%
Dealing with Banks Not Dealing with Banks

overdraft, but need one (Dalberg, 2011). From the bank standpoint, the higher costs, lack
of skills and higher (perceived) risks of investment in SMEs translate into high interest
rates and collateral requirements. Furthermore, posting collateral is complicated by the
fact that most SMEs operate in environments with weak property rights and poor contract
enforcement in which borrowers do not have legal titles to house or land, and therefore
cannot use these as collateral. For this reason, some SMEs face some problems with
banks. As it is shown in Figure 21, 16.1 percent of SMEs have problems with banks and
this share increases with smaller firms (Figure 22). Indeed, 16.4 percent of SMEs having
a capital less than EGP 250, 000 do have problems with banks. By contrast, this figure is
slightly lower for larger firms since 9.9 percent of SMEs with a capital more than EGP 30
million have banking problems.
Figure 21: Distribution of SMEs According to Having Problems with Banks
Source: Constructed by the authors using SMEs dataset
Figure 22: Distribution of SMEs by Problems with Banks and Capital
Source: Constructed by the authors using SMEs dataset
16.1%
83.9%
Yes
No
0%
20%
40%
60%
80%
100%
Less than250,000 LE
250,000 LE- Less than
Million
Million -Less than 5
Millions
5 Millions -Less than
15 Millions
15 Millions- Less than30 Millions
30 Millionsand More
16.4% 16.2% 14.4% 14.7% 9.4% 9.9%
83.6% 83.8% 85.6% 85.3% 90.6% 90.1%
Have Problems with Banks Do not Have Problems with Banks

At the governorate level, as it was mentioned before, most of the Egyptian SMEs
are concentrated in three main governorates (Cairo, Sharkeya and Gharbeya). The same
pattern can be observed for SMEs that deal with banks (see Figure 23) since 16.9 percent
of SMEs dealing with banks are located in Cairo, 11.5 percent in Sharkeya and 9.5 in
Gharbeya. Similarly, SMEs having banking facilities (see Figure 24) are chiefly
concentrated in the same governorates (22.6 percent in Cairo, 13.9 percent in Sharkeya
and 8 percent in Gharbeya). Clearly, there is a great potential of developing new SMEs in
other governorates through an easier and more equitable access to finance.
Figure 23: Distribution of SMEs Dealing with Banks by Governorates
Source: Constructed by the authors using SMEs dataset
Figure 24: Distribution of SMEs Having Banking Facilities by Governorates
Source: Constructed by the authors using SMEs dataset

Concerning economic activities, most of the firms that benefit from dealing with
banks (see Figure 25) are mostly concentrated in manufacturing (44.3 percent) and trade
(43.8 percent). Yet, having a more detailed look on each sector separately (Figure 26)
shows that 86.8 percent of construction firms and 72 percent of food and beverage ones
deal with banks. This figure is lower for SMEs working in the manufacturing and trade
sectors since SMEs who deal with banks represent 40.7 and 50.9 percent respectively of
firms operating in these two sectors. Those findings are not contradictory since there is a
frequency effect as almost 90 percent of SMEs are concentrated in just the manufacturing
sector (51.1 percent), followed by the wholesale trade (40.5 percent).
Figure 25: Percent Distribution of SMEs Dealing with Banks by Economic Activity
Source: Constructed by the authors using SMEs dataset
Figure 26: Percent Distribution of SMEs by Dealing with Banks and Economic Activity
Source: Constructed by the authors using SMEs dataset
1.1%
44.3% 43.8%
2.7% 1.9% 2.9% 3.4%
46.3% 40.7% 50.9% 72.0% 65.5%
86.8% 61.0%
53.7% 59.3% 49.1% 28.0% 34.5%
13.2% 39.0%
Dealing with Banks Not Dealing with Banks
To put in a nutshell, small firms face serious impediments in what concerns
access to finance given that larger firms with a greater capital, more employees and
higher sales turnover are more likely to benefit from banking facilities. Therefore, in
order to resolve problems related to access to finance, encourage competition among
banks to provide full fledge of diversified products with lowest charges due to the
economies of scale effect; CBE’s relaxation of the 10% banks’ reserve requirements on
SMEs lending; facilitation of technical assistance to banks and improving the
communication between the two sides of the SMEs’ lending market through discussing
bottleneck issues and bridging the gap; overcoming the asymmetric information between
borrowers and lenders, which is particularly acute in the “informationally opaque” market
for small business credit through:
(a.) Fostering access to finance for SMEs through NILEX (see Box 1).
(b.) The establishments of the I-score (see Box 2) and
(c.) National Census; qualifying the Entrepreneurs; designing and launching a financial
education and inclusion campaign.
Box 1: NILEX
NILEX is the Egyptian Exchange' market for growing medium and small companies, which
offers an appropriate, secure, yet flexible regulatory framework, for both companies and
investors, together with a streamlined admission process.
It supports the capital raising activities of small and mid cap developing companies. Its
advantage is not only limited to providing finance, but companies can access to long term
capital for the expansion of their businesses.
It supports promising sectors in the economy which suffers from finance obstacles; and it
also provides opportunity for investors to diversify their portfolios by investing in high
growth companies.
NILEX Benefits can be summarized in the following:
Unlimited Long-term Finance
Cheap Financing cost
Relaxed Rules & Regulation
Dedicated Funds to ensure liquidity
Full Government Support
Lower Listing Fees (0.5 per thousand of the capital)
Local & Foreign investors’ Interest
For more information, please check: www.nilex.egyptse.com/ar/

Box 2: Egyptian Credit Bureau “I-Score”
The Egyptian Credit Bureau "I-Score" maintains a database of credit information for SMEs and
consumers. The first credit bureau in Egypt, which demonstrates how a private credit bureau can be
set up in a relatively short time when all stakeholder interests are aligned and the project has
backing of the authorities. The Credit Bureau has been established under the name of the Egyptian
Credit Bureau "Estealam". The first general assembly meeting was held on September 5th,
2005. 25 banks in addition to the Social Fund for Development contributed in the company, with
an issued capital of 30 million Egyptian pounds distributed to seven million and five hundred
thousand shares, the value of each share of four pounds (all the shares in cash). The founders and
subscribers have paid the 25% of the nominal value of the shares upon subscription and completed
the paid up capital in February 2007. The purpose of the company is to provide information
services and credit classification.
It includes work in the following areas: Gathering all information about customers, whether associated with credit companies and
financial institutions, retailers and credit provided by banks or other views from all
available sources of information.
Creating certified official records of that information with the company, analyzing the data
and classifying it.
Creating indicators of credit quality for debtors whether individuals or institutions, making
it possible for them to form a sound credit history.
Providing financial advice and practical solutions, all of the specialized counseling to
individuals or institutions who want to improve the level of credit ratings, or those who
want to improve the financial instrument or who want to build a credit history on a sound
basis to start by a specific institution (with the exception of legal advice).
The sale of information services and products associated service and other new services to
all beneficiaries in Egypt and in a manner that does not conflict with the provisions of
secret bank accounts.
Carrying out the work of the agency in the field of information and credit classification of
enterprises or companies linked to their work with the company subject to the provisions of
laws, regulations and decisions applicable licensing condition for the exercise of such
activities.
Impact of I-Score:
I-Score led the process of the creation of the borrower data bank with Unique ID ( GT 5.7
Million).
Significant increase in number of credit facilities/loans data base size ( GT 14.3 Million).
Catalyst for banks/lenders to improve their data quality, revision of internal lending
policies/procedures leading to new avenues to grow credit / improved profitability and
advanced skill sets.
Contribution to increased awareness among lenders on data quality in acquisition and
management.
Catalyst for active credit growth with prudence and confidence by providing a unified and
robust borrower database across the lending community
For more information, please check www.i-score.com.eg

6. Conclusion and Policy Implications
Small and medium sized enterprises (SMEs) have usually been perceived as a
dynamic force for sustained economic growth and job creation in developing countries.
In Egypt, despite banking reforms that have been launched in 2004, the ability of SMEs
to more easily access suitable and sufficient means of finance has always been considered
a major obstacle facing many SMEs. For this reason, and in order to be able to extend the
financial services provided to this segment and increase the benefits of the banking
reform, the Central Bank of Egypt launched in December 2008 an initiative, as an
integral part of the Second Phase of the Banking Sector Reform Program (2008-2011), to
enhance SMEs access to finance and banking services. In this paper, we present a
descriptive analysis of the SMEs landscape in Egypt relying on this extensive census. The
main findings of the census show that there is a high concentration of SMEs at different
levels. First, the geographical distribution of SMEs is significantly skewed since almost
half of them are concentrated in three governorates (Cairo, Sharqiya and Gharbeya).
Second, they are chiefly operating in two economic activities, namely manufacturing and
trade. Third, a very few firms are exporting. Finally, financial services seem to be under-
utilized by SMEs as only 50 percent are dealing with banks and benefiting from an
improved access to finance.
From a policy implication standpoint, post 25th
of January revolution, there is a
need for strategic economic reforms to bring Egypt’s economic condition into vitality and
promote investment, especially for SMEs through:
- Improvements in the legislative infrastructure, several rules and regulations
associated with bankruptcy, creditor capacity to take fast possession of collateral
in case of default. In addition, there is an urgent need to speed up the process of
establishing collateral registries which should aim at building electronic registers
and streamlining registration process.
- Encouraging banks to build on their expertise in matchmaking their clients in
different stages of value chain (linkages)
- A need for updating financial method for financial reporting (e.g., standardized
template)
- Changing the Mindset Enhancing
- Entrepreneurship Education
It is worth to mention that this last point is crucial to improve SME performance
in Egypt. Indeed, the role of entrepreneurship has become increasingly apparent in
economic and social development. Economically, entrepreneurship stimulates markets.
The formation of new business leads to job creation and has a multiplying effect on the
economy. Socially, entrepreneurship empowers citizens, generates innovation and

changes mindsets. These changes have the potential to integrate developing countries into
the global economy. Thus, entrepreneurship is described as a potential driver to support
the economic growth, since it is important for productivity, innovation and employment.
Accordingly, it has been a policy goal of many developed countries to develop a culture
of entrepreneurial thinking. This can be done through providing appropriate enabling
environment via integrating entrepreneurship into education systems, learning process,
technical assistance, legislation and integration among all stakeholders.
Access to finance of small and medium enterprises is extremely important in
promoting entrepreneurship and innovation as well improving the state of the national
economy in Egypt. Accordingly helping those who decide to start their small enterprise in
acquiring necessary entrepreneurial and managerial competencies is essential in order to
ensure their success. Being aware of the importance of entrepreneurship development,
EBI SME unit is providing several training packages for Small and medium business
owners who need to enhance their understanding of dealing with and satisfying the
requirements of banks.
To bridge the gap between both sides, the SME unit conducts ‘awareness-raising’
events, through which entrepreneurs are acquainted with banks requirements as well as
offering a training program titled “SME Guide for Dealing with Banks”. The Egyptian
Banking Institute launched an initiative in the field of financial education,
entrepreneurship and small and medium enterprises as it plays an important role in the
economic development, facilitate access to finance for small and medium enterprises and
generating the spirit of entrepreneurship and innovation is an important aspect to
encourage young graduates to participate in entrepreneurship to enhance the sustainable
development of the national economy in Egypt.
The first wave of this initiative was at the University of Al-Ahram Canadian a
panel discussion had been held with university students to deepen the concept of financial
literacy, entrepreneurship and the important role of small and medium enterprises in the
coming era, through the opportunities and obstacles face these enterprises, and the
possibility of bridging the gap between theoretical study and the labor market
requirements, this was followed by the workshop about the most important steps that
must be followed for the application of strategic planning and building business plans for
small and medium enterprises taking into consideration the importance of creativity and
innovation to suit the nature of the Egyptian environment, in addition to displaying a
model of the successful experiences of a leading Egyptian businessmen in addition to
providing a business plan competition for the audience of students.
References
[1] Central Bank of Egypt, (2010) “Banking Reform in Egypt”, mimeo.
[2] Cinar, E. M., Evcimen, G. and Kaytaz, M. (1987) “A Case Study on the Growth
Potential of Small Scale Manufacturing Enterprises in Bursa, Turkey”, METU
Studies in Development, Vol.24, No.2, pp.123-146.
[3] Cinar, E. M., Evcimen, G. and Kaytaz, M. (1988) “The Present Day Status of
Small Scale Industries (Sanatkar) in Bursa, Turkey”, International Journal of
Middle Eastern Studies, Vol.20, pp.287- 301.
[4] Doing Business, (2011) “Making a Difference for Entrepreneurs”, IFC and the
World Bank, Washington D.C.
[5] Egyptian Banking Institute (2010) “A Facilitating Access to finance for SMEs”,
mimeo, February
[6] El-Hamidi, F., and C. Baslevent., (2010) “The gendered aspects of MSEs in
MENA: Evidence from Egypt and Turkey”. Economic Research Forum (ERF)
Working Paper No. 535.
[7] El-Gamal, M. A., El-Megharbel, N. and Inanoglu, H., (2001) “Beyond credit: A
taxonomy of SMEs and financing methods for Arab countries.” ECES Working Paper
Series no. 57. Egypt. The Egyptian Center for Economic Studies (ECES). May
[8] El-Hamidi, F., (2011) “How Do Women Entrepreneurs Perform? Empirical
Evidence from Egypt”. Economic Research Forum (ERF) Working Paper No.
621.
[9] El-Kabbani, R. N. and Kalhoefer, C. (2011), “Financing Resources for Egyptian
Small and Medium Enterprises”, Working Papers 28, The German University in
Cairo, Faculty of Management Technology.
[10] El-Mahdi, A. (2006) “The changing economic environment and the development
of the micro and small enterprises in Egypt 2006”. Economic Research Forum
(ERF) Working Paper No. 0706.
[11] El-Said, H., (2006) “Access to Finance: Forms of Financing for SMEs in Egypt”
Centranl Bank of Egypt and the Egyptian Banking Institute, mimeo.

[12] Erzan, R. and Filiztekin, A. (2005), “Does Size Matter in Growth, Productivity,
Employment, and Vulnerability/Flexibility in Turkish Manufacturing?” Turkish
Studies, Vol.6, No.1, pp.113-126.
[13] Evcimen, G., Kaytaz, M. and Cinar, E. M. (1991), “Subcontracting, Growth and
Capital Accumulation in Small-Scale Firms in the Textile Industry in Turkey”,
The Journal of Development Studies, Vol.28, No.1, pp.130-149.
[14] Hamdouch, B. et al. (2004) “Dynamisme de la Micro et Petite Entreprise au
Maroc,” ERF Research Report Series No.: 0419.
[15] OECD, (2011) “Entrepreneurship at a Glance 2011”, OECD Publishing.
http://dx.doi.org/10.1787/9789264097711-en.
[16] Semsa Ozar. (2004) “Micro and Small Enterprises in Turkey: Uneasy
Development,” Research Report Series No.: 0420.
[17] The World Bank, (2010) “Access to Finance and Economic Growth in Egypt”, led
by Sahar Nasr, Washington D.C.