sma solar technology ag analyst / investor presentation ... · attributable to the consolidation of...
TRANSCRIPT

SMA SOLAR TECHNOLOGY AGAnalyst / Investor PresentationQuarterly Financial Results: January to September 2016Pierre-Pascal Urbon, CEONovember 10, 2016

Disclaimer
IMPORTANT LEGAL NOTICEThis presentation does not constitute or form part of, and should not be construed as, an offer or invitation to subscribe for, underwrite or otherwise acquire, any securities of SMA Solar Technology AG (the "Company") or any present or future subsidiary of the Company (together with the Company, the "SMA Group") nor should it or any part of it form the basis of, or be relied upon in connection with, any contract to purchase or subscribe for any securities in the Company or any member of the SMA Group or commitment whatsoever.All information contained herein has been carefully prepared. Nevertheless, we do not guarantee its accuracy or completeness and nothing herein shall be construed to be a representation of such guarantee. The information contained in this presentation is subject to amendment, revision and updating. Certain statements contained in thispresentation may be statements of future expectations and other forward-looking statements that are based on the management's current views and assumptions and involve known and unknown risks and uncertainties. Actual results, performance or events may differ materially from those in such statements as a result of, among others, factors, changing business or other market conditions and the prospects for growth anticipated by the management of the Company. These and other factors could adversely affect the outcome and financial effects of the plans and events described herein. The Company does not undertake any obligation to update or revise any forward-looking statements, whether as a result of new information, future events or otherwise. You should not place undue reliance on forward-looking statements which speak only as of the date of this presentation.This presentation is for information purposes only and may not be further distributed or passed on to any party which is not the addressee of this presentation. No part of this presentation must be copied, reproduced or cited by the addressees hereof other than for the purposefor which it has been provided to the addressee.This document is not an offer of securities for sale in the United States of America. Securities may not be offered or sold in the United States of America absent registration or an exemption from registration under the U.S. Securities Act of 1933 as amended.
2

HIGH CASH FLOW GENERATION ANDSUCCESSFUL PRODUCT INTRODUCTIONS.
MARKET VOLATILITY INCREASED IN RECENTMONTHS.

SMA expects sales of up to €241m and earnings of up to €11m in Q4/2016
Attractive Cash Flow Profile, New Products and ImplementedMeasures to Improve the Cost Structure are Key Highlights
4
Top-Line
Outlook
Profitability/ Bankability
> SMA had €709m sales (Q1-Q3/15: 687m) despite increased price pressure> Strong Commercial (+36% Y/Y) and Service (+10% Y/Y) business; Utility (+1%) was impacted
by numerous delays in major projects in EMEA and Americas; Residential declined (-24% Y/Y) due to weaker than expected demand in the US and Japan
> Export business increased to 90% of sales (Americas: +14%; EMEA: -12%; APAC: +10% Y/Y)> SMA increased Gross Margin to 27% in Q3/16 compared to Q2/16 (24%) despite one-offs
attributable to the consolidation of production sites and product mix changes> SMA increased EBIT significantly to €59m (Q1-Q3/15: €10m) due to new products and
reduced fixed costs> SMA generated high operating cash flows of €124m (Q1-Q2/15: €70m)> Rock solid balance sheet structure with 50% equity ratio, > €350m net cash and €100m long-
term credit facility> Management increased market forecast for 2016 by >10% to 73 GW (+25% Y/Y) because of
Chinese installs (€4.9bn). SMA slightly increased market outlook for 2017 to 67 GW (€4.9bn)> The new US president is expected to impose a 45% import tariff on Chinese solar inverters
because of unfair trade practice. SMA does not expect D. Trump to contest the ITC.1> SMA introduced cost-improved products and will reduce its fixed costs by up to 15% (€-40m) to
improve its competitiveness by H1/17> Management adjusted guidance to sales of €900m and €950m (previously €950m to
€1,050m) and EBIT between €60m and €70m (previously €80m to €120m).
1.The Investment Tax Credit (ITC) was passed with broad congressional support in 2015

Q1-Q3/ 2015
Q1-Q3/ 2016
MW sold 5,031 5,655 +12%Sales 687 709 +3%Residential 186 142 -24%Commercial 143 195 +36%Utility 287 289 +1%Service2 36 39 +10%Other Business 35 44 +27%
Gross margin 20% 25%EBITDA 65 108 +67%EBIT 10 59 n.m.
Thereof One-Offs -14 -11 n.m.Free cash flow (adj.) 31 106 n.m.Depreciation 56 49 -11%Capex (incl. R&D) 39 19 -52%
2015/12/31 2016/06/30
Net cash 286 353 +24%Total assets 1,160 1,206 +4%NWC ratio3 22% 21%
2015 2016Q4 Q1 Q2 Q3
Sales 295 248 234 227Residential 66 46 53 43Commercial 64 60 64 71Utility 130 115 90 84Service2 14 13 12 14Other Business 21 14 15 15
Gross margin 27% 25% 24% 27%EBIT 33 25 13 21One-Offs -10 0 -2 -9
SMA Increased Sales and Earnings Duringthe First Nine Months 2016
51.SMA Railway is now classified as discontinued operation; see appendix for further details2.External Sales3.NWC= inventory+trade receivables-trade payables (no advanced payments included); as of last twelve month‘s sales
Key Financials(in € million, w/o SMA Railway)1
Key Financials(in € million, w/o SMA Railway)1
THE MARKET ENVIRONMENT CHANGED MID-2016 AFTER FIT CUTS IN CHINA.
THE ELECTION IN THE USA WILL IMPACT THE COMPETITIVE ENVIRONMENT.

The Chinese Solar Market is Expected to Half in 2017-International Markets are Expected to Grow by >10 %
7
> SMA increased global market outlook for 2016 by >10% to 73 GW due to high level of new installations in China in the first nine months. However, Chinese demand will collapse due to revised national solar target and FIT cuts.1
> Americas, China and India are driving forces for new installations in coming years (>60% of global demand). Middle East, South East Asia and South America are expected to gain importance (>10% of global demand).
> SMA does not expect a negative impact in the US, since the ITC was passed with great support from Republicans and Democrats.
> Utility remains the most important segment (>60% of global demand). Positive trend for commercial projects due to high rate of self-consumption.
Global New PV Installation by Segment/Region (in GWdc)2,3
66
9(14%)
15(23%)
42(64%)
65
8(12%)
+8% p.a.
ResidentialCommercial
Utility14
(21%)13
(17%)
53(73%)
52
6(12%)
12(23%)
34(65%)
41
5(13%)
12(29%)
24(57%)
73
7(9%)
43(67%)
EMEA
Americas
APAC4
China
2018
66
14(21%)
17(26%)
22(33%)
13(19%)
2017
65
9(18%)
17(32%)
15(29%)
2014
41
9(22%)
8(19%)
13(33%)
11(26%)
11(16%)
16(24%)
21(33%)
17(27%)
2016
73
10(14%)
14(20%)
19(26%)
30(41%)
2015
52
10(20%)
1.China reduced the Feed-in-Tariff (FIT) by the end of June 2016 and announced further FIT reduction for 2017; New National Solar target set in 13th Five-Year-Plan for Power released on Nov. 7th 2016 by NEA
2.SMA MI Market Model Q4 20163. Incl. ∼1 GW off-grid installations p.a.: residential, remote and micro-grid applications4.w/o China
PV becomes more and more popular in new markets – SMA’s management remains its positive mid-term view for established markets

Price Pressure for Solar Inverters and Services Accelerated Since Mid-2016 in all Segments and Regions
8
SMA expects an accelerated industry consolidation
> Mid of this year especially Chinese players reduced their average selling prices to get faster access to established markets. The price strategy shall compensate the slowdown in their home market.
> However, compliance with regulations, cyber-security, product quality, service and product features remain key decision criteria for solar inverter technology in many regions and segments.
> SMA expects a rather flattish market develop-ment until 2018 (ca. €5bn).
> In €-terms Americas, Europe and Japan remain the most important markets (c. 65% of revenues).
> Sales growth is driven by storage applications and highly efficient residential plants.1
1.5(29%)
1.0(19%)
1.4(27%)
4.6-5.0
Storage
4.5-4.9
1.0(20%)
1.3(26%)
0.7-1.3(25%)
4.9
1.2(25%)
1.1(23%)
2.1(43%)
0.5(9%)
4.6
1.2(26%)
1.2(27%)
1.8(40%)
0.3(7%)
4.3
1.6(32%)
0.6-1.1(22%)
1.1(26%)
1.4(33%)
1.6(36%)
0.2(5%)
-3% - +3% p.a.
Residential
Utility
Commercial
APAC4
1.6(31%)
China
2018
0.4(7%)
Americas1.5
(30%)
1.6(32%)
EMEA
5.00.5
(9%)
1.4(28%)
4.9
1.7(35%)
2016 2017
1.3(28%)
1.4(29%)
4.9
1.7(34%)
1.0(21%)
0.8(16%)
4.64.3
1.1(24%)
1.9(41%)
0.6(12%)
1.1(23%)
2014 2015
1.8(42%)
1.1(24%)
1.0(22%)
0.5(11%)
Global Inverter Revenues by Segment/Region (in €bn)2,3
1. Including Module Level Power Electronics and storage2.Prices for revenue calculation according to IHS (EUR/Wac) and
SMA MI Market Model Q4 2016
3. Incl. system technology for storage applications (e.g. hybrid, behind the meter, in the grid, co-located, etc.) and demand for replacement inverters
4.w/o China

Negative Sentiments towards Chinese Solar Inverter Manufacturers due to Compliance Risks
9
1. http://www.reuters.com/article/us-aixtron-m-a-fujian-germany-idUSKCN12O13G; (Access 2016/11/07)2. https://www.washingtonpost.com/world/asia_pacific/australia-formally-bans-chinese-from-leasing-power-grid/2016/08/19/13d0397c-65f0-11e6-b4d8-33e931b5a26d_story.html (Access 2016/11/07)3. http://fortune.com/2016/06/27/china-moves-toward-adopting-cybersecurity-law/; (Access 2016/11/07)4. http://www.wsj.com/articles/u-s-seeks-huawei-records-on-dealings-with-sanctioned-nations-1464882905; (Access 2016/11/07)5. http://www.wsj.com/articles/donald-trump-win-to-upend-trade-policy-1478692802; (Access 2016/11/09)
> Some Chinese competitors do not fulfill theregulatory requirements (e.g. EMI), disclosewrong certifications and have undisclosedrelationships to military.
> Since solar inverter technology is regarded asa safety relevant control system, manycustomers expressed serious concerns aboutChinese solar inverters. Furthermore, theyrequest an existing service infrastructure.
> Utility companies in all regions expressed theirinterest to use even larger central inverters forMW-projects in order to reduce the electricalbalance of system costs and to have an easierintegration into existing monitoring systems. Some Chinese competitors only offer string-inverter technology.
Impact PVIncreased concerns about Chinese
!

SMA INTRODUCED NEW PRODUCTS AND SERVICES TO COMPENSATE PRICE PRESSURE.
SMA WILL FURTHER REDUCE ITS FIXED COST STRUCTURE TO IMPROVE ITS COMPETITIVENESS.

Reduction of Customer Cost of Electricity throughIntelligent System Solutions
111.Market Introduction during Intersolar / Solar Power trade show
COMMERCIAL+
RESIDENTIAL SOLUTIONS
PV-Inverter
Module Level Power Electronics
Energy Management
Storage Systems
Cost Improved New Products
Sunny BoyQ2/20161
Lower Cost due to Selective Deployment
Sunny TripowerQ3/20161
Up to 40% Savings of Energy Costs
Independence with Storage
Sunny Boy
Sunny Portal
*Monitoring*Safety*Optimization*Long String
Sunny Boy 1.5 / 2.5
Sunny HomeManager
Mennekes AMTRON® WallboxSMA Energy Meter
Heat Pump
Sunny Boy Smart EnergyInverter with integrated battery
Sunny Boy StorageFlexible solution withhigh voltage battery
Sunny IslandFlexible solution with lowvoltage battery

SMA is the First Inverter Manufacturer with a UL Certified Central Inverter with 1,500 Volt Technology for the US Market
121.GTM Research - Megawatt -Scale PV O&M and Asset Management 2015-2020, Nov.
2015
SMA is already the global #4 of O+M maintenance providers for the PV industry and has 1.4 GW under management1
Sunny Central 5MW; 1,500 Volt
> Preventive maintenance include visual inspection and thermal scans. Expert advice is provided through remote systemmonitoring 24/7
> Proactive maintenance adds 24 hrs emergency response time, spare parts inventory management and warranty management. System performance is improved by testing, real-time monitoringand thermography services
> Higher voltages will reduce the electrical BoS cost by up to 10% and increase power ooutput by 14%
> High strategic importance of alliance with Síemens: alignedtechnical solution from DC to high voltage grid; share of global network and abilities; joint product development
Service: Peace of Mind if SMA is on Your Side

SMA will Reduce the Fixed Costs by up to €40m p.a. Until H1/2017 – restructuring is on track
13
Fixed Cost Structure, w/o Depreciation (in €m) Key Measures
SMA‘s management expects the closing of the Railway Technology transaction in 20174
20 18
5143
Q2/2016
€-10m(-15%)
Personnelcosts2
Non-Personnelcosts
61
Q2/20171
71
Employees (FTE)2 3,277 2,932-345(-10%)
1.Target2. Full-time employees w/o temporary employees
3. Managed by Third Party Providers4.Previously Q4/2016
Operations > Closure of production sites in Denver (USA) and Cape Town (South Africa).
> Set up of local hubs in the USA (East/West Coast) to allow fast delivery times.3
> Increase utilization of production and repair facilities in Kassel (Germany) and Yangzhong(China). No significant investment required.
Sales & Service
> Closure of subsidiaries in markets with unattractive mid-term market outlook (Greece, Portugal).
> Increase sales & service professionals in markets with attractive mid-term outlook (USA, India, Japan).
Others > Divestment of non-core assets (e.g. SMA Railway Technology; 165 FTE).
> Lease of office buildings in Kassel (>10,000 sqm; annual lease c. €1.5m).
> Cost reduction due to consolidation of admin. functions and streamlining of processes.

STRONG FINANCIALS DURING THE FIRST NINE MONTHS.

The Strong Growth in Commercial is Equally Driven by All Regions
15
Residential sales are impacted by slower than expected demand in North America, especially California
Sales by Segment (in € million)Group Sales (in € million, w/o SMA Railway)1
35
87
287
143
186
44
90
289
195
142
OtherBusiness3
Service2
Utility
Commercial
Residential
Q1-Q3/2016Q1-Q3/2015
33%
47%
Q1-Q3/2015
687
18%
39%
43%
2015
1,000
22%
36%
42%+3%
APAC
EMEA
Americas
Q1-Q3/2016
709
20%
Intern. Share
ext. int.
87% 87% 90%
1.SMA Railway is now classified as discontinued operation; see appendix for further details1. In relation to internal and external sales2. Including Zeversolar, w/o SMA Railway

SMA Increased it‘s Profitability with New Products and Significant Fix Cost Reductions
16
EBIT during the first nine months 2016 includes negative one-off items of €11m, mostly for the consolidation of SMA’s infrastructure
EBIT-margin by Segment (in %)EBIT (in € million, w/o SMA Railway)1
59
10
34
Q1-Q3/152015
EBIT
Q1-Q3/16
Depreciation/Amortization -79
20%Utility
6%Service39%
-8%-25%Other
Business4
10%
Commercial8%
-13%
Residential-2%-3%
-56 -49Q1-Q3/2016Q1-Q3/2015
thereof One-Offs -24 -14 -112
1.SMA Railway is now classified as discontinued operation; see appendix for further details2.Q1-Q3 2016: Impairment on working capital (neg.), Consolidation of production sites (neg.), Others
(neg.), Release of employee bonus provision (pos.); thereof in COGS (€-11m)
3. In relation to internal and external sales4. Including Zeversolar, w/o SMA Railway

Non current assetsWorking capital
Total cashOther assets
2015/12/31
Shareholders’ equity
Trade payablesProvisions4
Financial liabilities5
Other liabilities6
Total
2016/09/30-5%
8%8%
3%4%
Δ
61%
With an Equity Ratio of 50% and High Net Cash of >€350m, SMA is Rock Solid
171.SMA Railway is now classified as discontinued operation; see appendix for further details1.NWC= inventory+trade receivables-trade payables (no advanced payments included); As of
last twelve months sales
2.Not interest-bearing3.W/o not-interest-bearing derivatives: €3m (2015: €8m)
Finished goods increased due to closure of Denver and inventory increase in Asia
Group Balance Sheet , reclassified (in € million; 2016 w/o SMA Railway)1
Net Working Capital(in € million; 2016 w/o SMA Railway)1
47132638
325
570170103
27839
1,160 1,206
-103 -111
8976
69
180 137
49
December 31, 2015
223
2122
September 30, 2016
206
Trade payablesFinished goodsUnf. goods
Raw materials and consumablesTrade receivables
22% 21%NWC ratio2
380
599
111
317448
-3% 61
17%
5%183
27286
-31%

Q1-Q3/2015 Q1-Q3/2016Net income -7 36 Gross cash flow 31 105Cash flow from operating activities 70 124
Net capex2 -39 -18Free cash flow (Adj.) 31 106
Acquisition -1 -19Net investments from securities andother financial assets
-2 -47
Free cash flow (IFRS) 28 40
Higher Cash Flow due to Higher Earnings, Improved Net Working Capital and Lower Capital Expenditures
181.SMA Railway is now classified as discontinued operation; see appendix for further details2.Thereof R&D capitalization: €9m (Q1-Q3/15: €24m)
Cash Flow (in € million); w/o Railway1
SMA‘s strong cash flow profile provides flexibility in the highly volatile PV industry

SMA has a Strong Order Backlog for Service Business, Order Backlog for Products Decreased due to Project Delays
191. As of September 30, 20162.Only Utility, Commercial, Residential, Other Business
3.Order backlog in Service will be recognized over a periodof 5 to10 years
The visibility in the solar industry decreased
Order Backlog by Segments (in € m)1 Order Backlog by Region (in %)1,2
69
41
16133%
47%
20%
Americas
APACEMEA
∑ 588 22
391
4116
8731
Other BusinessService3ResidentialCommercialUtility
Railway

thereof Residential 25% >15%thereof Commercial 21% >25%thereof Utility 42% c. 40%International Share 87% c. 90%Depreciation/ Amortization 79 c. 70CapEx (incl. R&D) 51 25-30NWC ratio 22% 20-23%Tax rate 51%2 c. 40%3
SMA does not Expect a Year-end Rallye due to theUncertainty in the Market
20
Guidance 2016 (in € million, incl. SMA Railway)
Sales34 60-70
1.Previously €950-1,050m sales and €80-120m EBIT2.Tax Rate 2015 incl. One-Off from tax audit (2010-2012)
3.Tax Rate 2016 incl. One-Off from tax review for previous years
20162015
900-9501,000EBIT
> SMA‘s Management adjusted the sales and earnings guidance due to price pressure emerging in all market segments worldwide since the middle of 2016 and numerous delays in major solar projects.
> Lower CapEx due to the consolidation ofproduction sites.
> SMA expects sales of up to €241m and earnings of up to €11m in Q4/16.
> Q4 earnings are impacted by additional one-offs.
> Positive one-offs from divestments is not considered in the 2016 guidance anymore
> Improvement in variable and fixed costs will start to kick-in early 2017. Full effect is expected by mid-2017.
> Tigo MLPE technology will impact sales and earnings in Q4 2016 at the earliest.
1

Investment Highlights: Attractive Investment Opportunity
21
Direct exposure to the global solar market
SMA has been the #1 for solar inverters for more than 2 decades
Proven technology and game changing new products
Flexible business model and best-cost sourcing strategy
Powerful sales and service infrastructure
Bankable partner due to high equity ratio, net cash position and credit facility
Stable shareholder structure with Danfoss as strategic anchor investor
Experienced management team

SOCIAL MEDIAwww.SMA.de/Newsroom
SMA Solar Technology AG
BACK UP

24
BACKUPFinancial Calender
Jan 16-27, 2017 Investor Relations – Quiet Period
Jan 27, 2017 Capital Markets Day: Publication of Guidance 2017
Kassel/NiestetalMar 13-30, 2017 Investor Relations – Quiet Period
Mar 30, 2017 Publication of the SMA Group 2016 Annual Report
Analyst Conference Call: 09:00 a.m. (CET)

Note
25
> Pursuant to IFRS 5, the figures for the previous year in the income statement and the statement of cash flows were adjusted retrospectively for the planned sale of the Railway Technology business division. However, there was no adjustment to the previous year’s balance sheet as prescribed by the provisions of IFRS 5. The Railway Technology business division is reported as a discontinued operation.
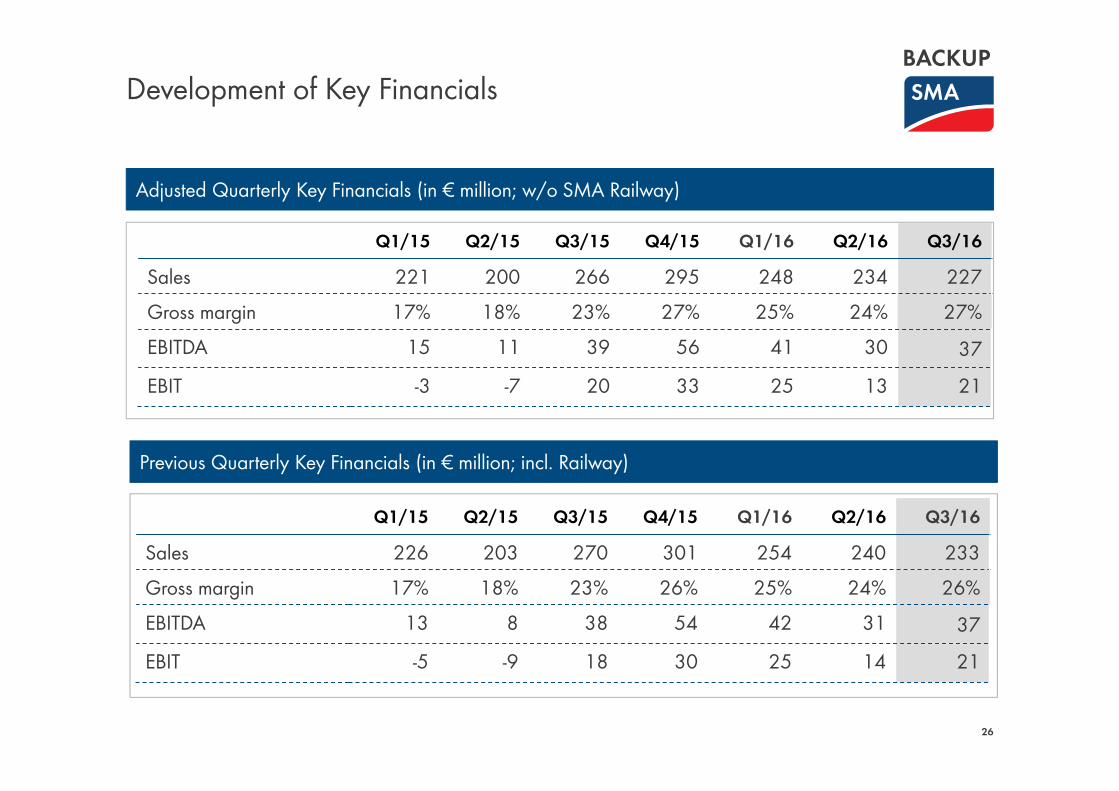
Q1/15 Q2/15 Q3/15 Q4/15 Q1/16 Q2/16 Q3/16Sales 221 200 266 295 248 234 227Gross margin 17% 18% 23% 27% 25% 24% 27%EBITDA 15 11 39 56 41 30 37EBIT -3 -7 20 33 25 13 21
26
Adjusted Quarterly Key Financials (in € million; w/o SMA Railway)
BACKUPDevelopment of Key Financials
Previous Quarterly Key Financials (in € million; incl. Railway)
Q1/15 Q2/15 Q3/15 Q4/15 Q1/16 Q2/16 Q3/16Sales 226 203 270 301 254 240 233Gross margin 17% 18% 23% 26% 25% 24% 26%EBITDA 13 8 38 54 42 31 37EBIT -5 -9 18 30 25 14 21

Development of Key Financials (Cont‘)
27
150 175 200 225 250 275 300
Q2/2016Q1/2016Q4/2015Q3/2015Q2/2015Q1/2015 Q3/2016Sales
in €m
illion
2016
900-950
2015
1,000
Gros
smarg
inEB
ITDA
in €m
illion
BACKUP
14 %16 %18 %20 %22 %24 %26 %28 %
Q2/2016Q1/2016Q4/2015Q3/2015Q2/2015Q1/2015 Q3/2016
-10 0
10 20 30 40 50 60
Q2/2016Q1/2016Q4/2015Q3/2015Q2/2015Q1/2015 Q3/2016
2015
21 %
2016
130-140
2015
113

Development of Key Financials (Cont‘) –Sales Development by Segment (in € million)
28
020406080
100120140
Q2/2016Q1/2016Q4/2015Q3/2015Q2/2015Q1/2015Q4/2014Q3/2014Q2/2014Q1/2014
0 20 40 60 80
100 120 140
Q2/2016Q1/2016Q4/2015Q3/2015Q2/2015Q1/2015Q4/2014Q3/2014Q2/2014Q1/2014
0 20 40 60 80
100 120 140
Q2/2016Q1/2016Q4/2015Q3/2015Q2/2015Q1/2015Q4/2014Q3/2014Q2/2014Q1/2014
207
20162015
416
20162015
Comm
ercial
Utility
Resid
entia
l
BACKUP
253
20162015
>15% ofGroup Sales
>25% ofGroup Sales
c.40% ofGroup Sales

Development of Key Financials (Cont‘) –Sales Development by Segment (in € million)
29
0 5
10 15 20 25 30
Q3/2016Q2/2016Q1/2016Q4/2015Q3/2015Q2/2015Q1/2015Servi
ce (e
xterna
l)
20162015
50
05
1015202530
Q3/2016Q2/2016Q1/2016Q4/2015Q3/2015Q2/2015Q1/2015
74
20162015Othe
r Busi
ness
BACKUP

SOCIAL MEDIAwww.SMA.de/Newsroom