sm 06 soil plasticity
DESCRIPTION
Soil MechanicsBasicsTRANSCRIPT

Soil Mechanics ICE‐222CE 222
Soil Plasticity – Atterberg Limits
1

Classification of fine‐grained soils 2
• The Unified Soil Classification System uses the term “fines” to describe everything that passes through a No. 200 sieve (<0.075 mm).
• No attempt to distinguish between silts and clays in terms of particles sizes since the biggest difference between silt and clay is not their particle sizes, but their physical and chemical structurestheir physical and chemical structures.
• The soil consistency is used as a practical and an inexpensive way to distinguish between silts andinexpensive way to distinguish between silts and clays.
• Plasticity property is important because it describes• Plasticity property is important because it describes the response of a soil to change in moisture content.

Soil Characteristics
Soil Characteristics Soils at equal LL with increasing PI
Soils at equal PI with increasing LL
Dry Strength Increases DecreaseDry StrengthToughness near PLPermeabilityC ibilit
IncreasesIncreases
D
DecreaseDecrease
ICompressibilityRate of volume change
DecreaseAbout the sameDecrease
IncreasesIncreases-

Plasticity 4
• Water Content significantly affects properties of Siltyand Clayey soils (unlike sand and gravel).y y ( g )
– Strength decreases as water content increases
S il ll h i– Soils swell‐up when water content increases
– Fine‐grained soils at very high water content possess ti i il t li idproperties similar to liquids
– As the water content is reduced, the volume of the soil decreases and the soils become plasticdecreases and the soils become plastic
– If the water content is further reduced, the soil becomes semi solid when the volume does not changesemi‐solid when the volume does not change
Attreberg Limits 5
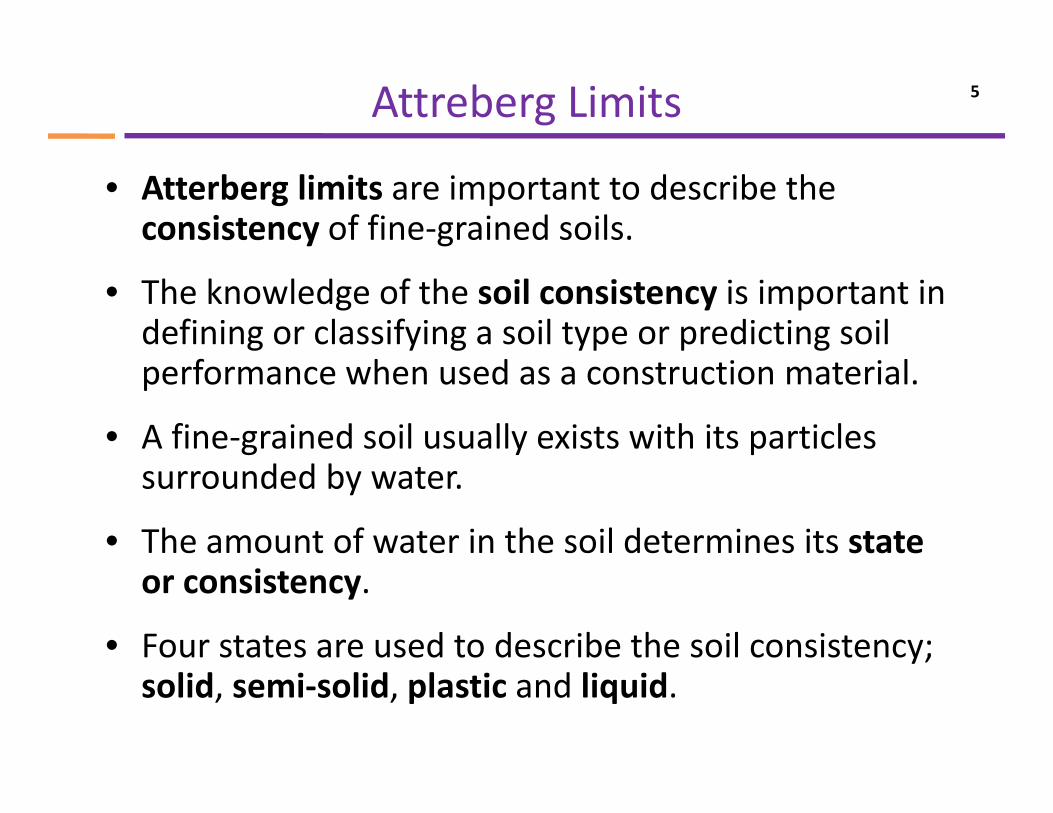
• Atterberg limits are important to describe the consistency of fine‐grained soils.
• The knowledge of the soil consistency is important in defining or classifying a soil type or predicting soil performance when used as a construction material.
• A fine‐grained soil usually exists with its particles surrounded by water.
• The amount of water in the soil determines its state or consistency.
• Four states are used to describe the soil consistency;ysolid, semi‐solid, plastic and liquid.

Attreberg Limits 6
Semi
Wetting
SolidState
e, v
or
e Solid SemiSolid
Plastic Liquid
Volu
me
S = 100 %
SL PL LL
vf
SL PL LL
PI
Water content, w %Drying
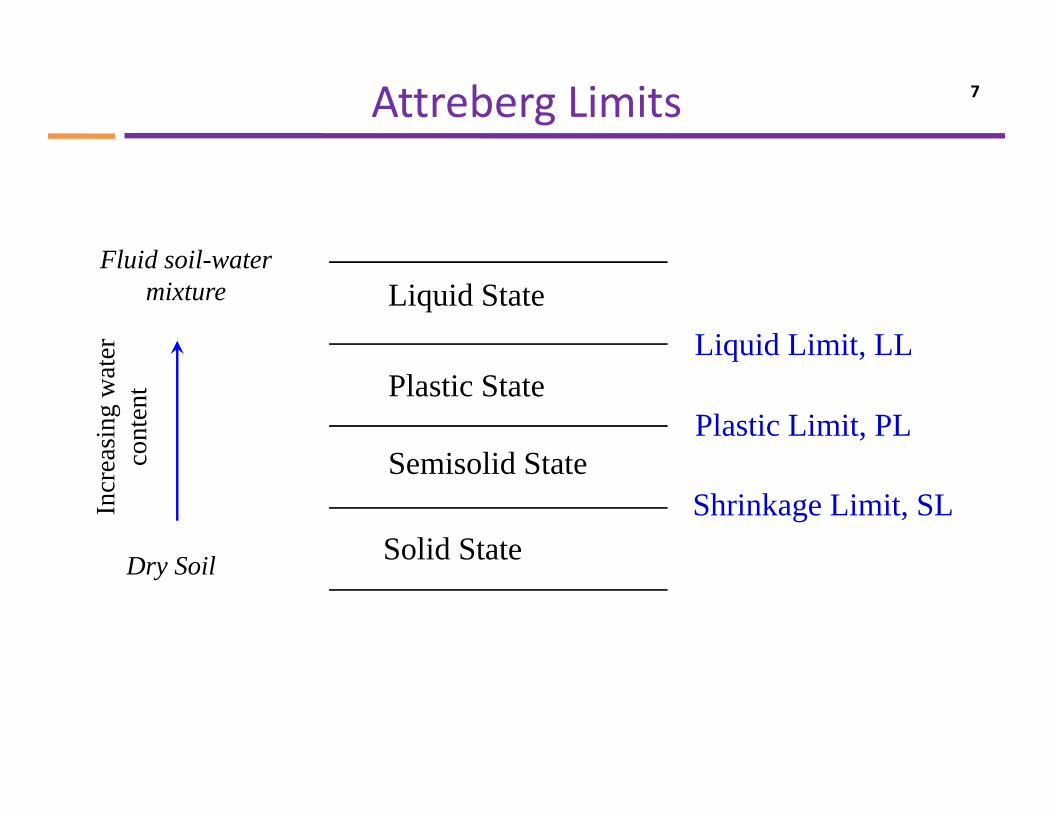
Attreberg Limits 7
Fl id il
Liquid Limit, LLLiquid State
Fluid soil-water mixture
er qu d ,
Plastic Limit, PLPlastic State
S i lid St tasin
g w
ate
cont
ent
Shrinkage Limit, SLSemisolid State
Solid StateD S il
Incr
ea c
Dry Soil

Atterberg Limits 8
• Shrinkage Limit (SL) is defined as the moisture content at which no further volume change occurs with further reduction in moisture content (SL represents the amount of water required to fully saturate the soil, i.e., S = 100%).
• Plastic Limit (PL) is defined as the moisture content at which soil begins to behave as a plastic material.
• Liquid Limit (LL) is defined as the moisture content at which soil begins to behave as a liquid material and g qbegins to flow (LL of a fine‐grained soil gives the moisture content at which the shear strength of the soil i i t l 2 5kN/ 2)is approximately 2.5kN/m2).

Plasticity chart 9
Liquid Limit (LL) 10
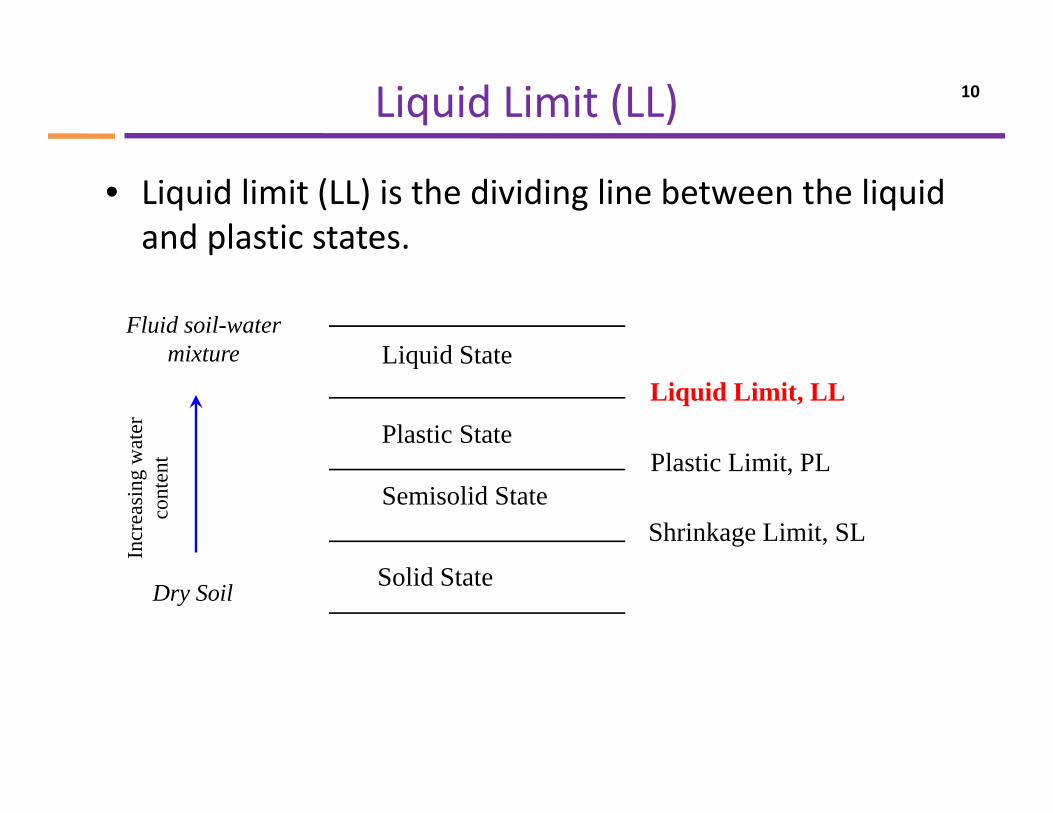
• Liquid limit (LL) is the dividing line between the liquid and plastic states.p
Liquid StateFluid soil-water
mixtureLiquid Limit, LL
Liquid State
Pl ti Li it PLPlastic State
mixture
wat
er
t Plastic Limit, PL
Shrinkage Limit, SLSemisolid State
Incr
easi
ng w
cont
ent
Solid StateDry Soil

Liquid Limit (LL) 11
• In the lab, the LL is defined as the moisture content (%) required to close a 2‐mm wide groove in a soil ( ) q gpat a distance of 0.5 in along the bottom of the groove after 25 blows.
• Standard: ASTM D 4318.
• Soil sample size: 150g passing No. 40 sieve.
• Equipment: Casagrande liquid limit deviceEquipment: Casagrande liquid limit device.

12

Liquid Limit (Procedure) 13
• 150g air dry soil passing No. 40 sieve.
• Add 20% of water ‐mix thoroughly.Add 20% of water mix thoroughly.
• Place a small sample of soil in LL device (deepest part about 8‐10 mm).
• Cut a groove (2mm at the base).
• Run the device, count the number of blows, N., ,
• Stop when the groove in the soil close through a distance of 0.5 inch.
• Take a sample and find the moisture content.
• Run the test three times [N~(10‐20), N~(20‐30) and N~(35‐45)] and Plot number of blows vs moisture content and determine the liquid limit (LL) (moisture content at 25 blows)

Liquid Limit 14
Flow Curve50
48(%)
46.39
y = -7.55Ln(x) + 70.6948
cont
ent
46.3946
Wat
er
2544
1 10 100Number of drops

LL values <16% (not realistic) 15
%PI
,
16 Liquid Limit, %16 q ,

LL values ≥50 (high) 16
PI, %
H
Liquid Limit, % 50

LL values <50% (Low) 17
%PI
, %
L
Liquid Limit, % 50

Plastic Limit 18
• The moisture content (%) at which the soil when rolled into threads of 3.2mm (1/8 in) in diameter, will crumble.
Pl i li i i h l li i f h l i f il I i• Plastic limit is the lower limit of the plastic stage of soil. It is the dividing line between the plastic and semisolid states.
• Plasticity Index (PI) is the difference between the liquid limit• Plasticity Index (PI) is the difference between the liquid limit and plastic limit of a soil.
Liquid Limit, LLLiquid State
Fluid soil-water mixture
er
Plastic Limit, PLPlastic State
Shrinkage Limit SLSemisolid State
reas
ing
wat
eco
nten
t
Shrinkage Limit, SLSolid StateDry Soil
Incr

Plastic Limit 19

Plastic Limit (Procedure) 20
• Take 20g of soil passing No. 40 sieve into a dish.
• Add water and mix thoroughly.Add water and mix thoroughly.
• Prepare several ellipsoidal‐shaped soil masses by quizzing the soil with your handquizzing the soil with your hand.
• Put the soil in rolling device, and roll the soil until the h d h / hthread reaches 1/8 inch.
• Continue rolling until the thread crumbles into several pieces.
• Determine the moisture content of about 6g of theDetermine the moisture content of about 6g of the crumbled soil.
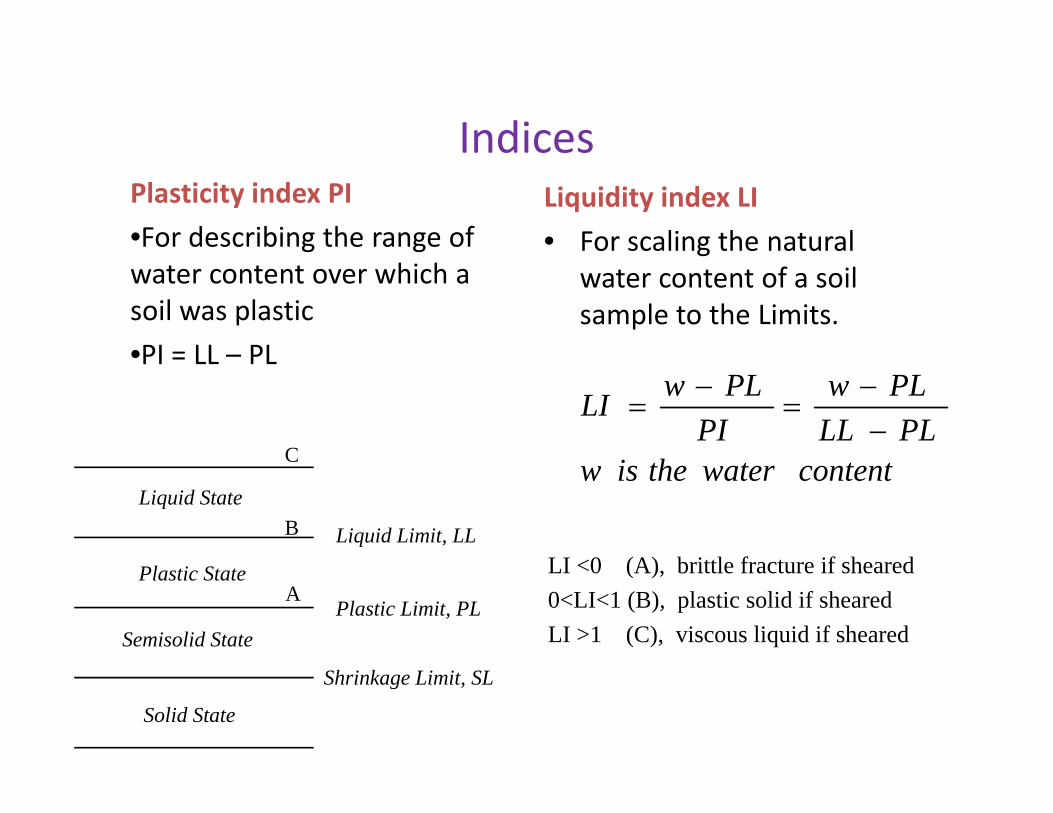
IndicesIndicesPlasticity index PI
•For describing the range of Liquidity index LI
• For scaling the natural water content over which a soil was plastic
•PI = LL – PL
gwater content of a soil sample to the Limits.
•PI = LL – PL
PLLLPLw
PIPLwLI
−−
=−
=C contentwatertheisw
LI <0 (A) b ittl f t if h dLiquid Limit, LL
Liquid StateB
C
LI <0 (A), brittle fracture if sheared0<LI<1 (B), plastic solid if sheared LI >1 (C), viscous liquid if sheared
Plastic Limit, PL
Plastic State
Semisolid State
A
Shrinkage Limit, SL
Solid State

Plastic soils 22
Plastic soils A LinePlastic soils plot above the A-Line on a
A‐Line
Plasticity Chart

Non‐Plastic Soils 23
l i A‐LineNon-plastic or slightly plastic soils plot below
A Line
soils plot below the A-Line on a Plasticity Charty
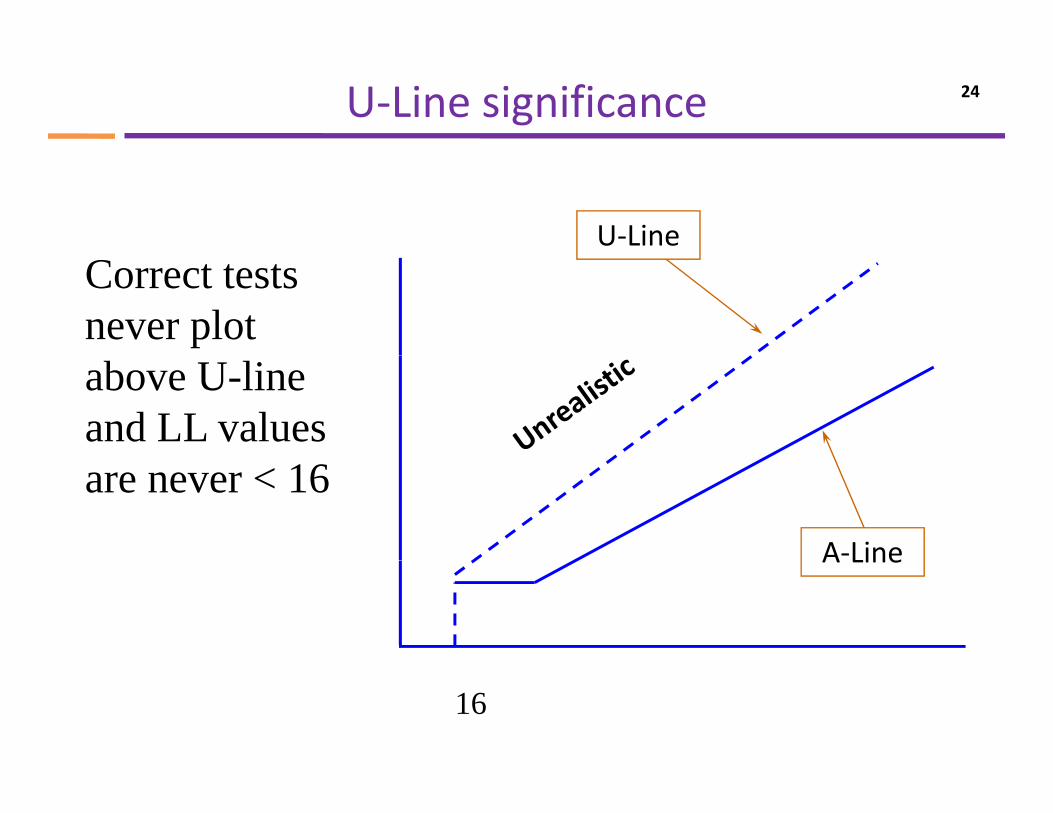
U‐Line significance 24
U‐LineCorrect tests never plot above U-line and LL values are never < 16
A‐LineA Line
16

Plasticity Chart 25

Plasticity Chart 26
Medium plasticity/ibili
High plasticity/compressibility
Low plasticity/compressibility
compressibility

Plasticity Chart 27
Cohesionless soil
Organic clays
Silt

Indices (Cont.)Indices (Cont.)
• Activity A •Normal clays: 0.75<A<1.25
•Inactive clays: A<0.75(Skempton, 1953)
PIA =
y
•Active clays: A> 1.25
mm002.0:fractionclay)weight(fractionclay%
A
<
=
•PurposeBoth the type and amount of clay insoils will affect the Atterberg limits.This index is aimed to separate them.
High activitylarge volume change when wettedlarge volume change when wettedLarge shrinkage when driedVery reactive (chemically)

Activity 29