sliz mspa thesis - arxiv
TRANSCRIPT

AnInvestigationofThree-pointShootingthroughanAnalysisofNBAPlayerTrackingData
By
BradleyA.Sliz
ThesisProject
Submittedinpartialfulfillmentofthe
Requirementsforthedegreeof
MASTEROFSCIENCEINPREDICTIVEANALYTICS
December,2016
Dr.AliannaJeanAnnMaren,FirstReader
ThomasRobinson,SecondReader

2
Abstract
Inmythesis,Iaddressthedifficultchallengeofmeasuringtherelativeinfluenceofcompeting
basketballgamestrategies,andIapplymyanalysistoplaysresultinginthree-pointshots.Iuse
aglutofSportVUplayertrackingdatafromover600NBAgamestoderivecustomposition-based
featuresthatcapturetangiblegamestrategiesfromgame-playdata,suchasteamwork,player
matchups, and on-ball defender distances. Then, I demonstrate statistical methods for
measuringtherelativeimportanceofanygivenbasketballstrategy.Indoingso,Ihighlightthe
highimportanceofteamworkbasedstrategiesinaffectingthree-pointshotsuccess.Bycoupling
SportVUdatawithanadvancedvariableimportancealgorithmIamabletoextractmeaningful
resultsthatwouldhavebeenimpossibletoachieveeven3yearsago.
Further,Idemonstratehowplayer-trackingbasedfeaturescanbeusedtomeasurethethree-
pointshootingpropensityofplayers,andIshowhowthismeasurementcanidentifyeffective
shooters that are either highly-utilized or under-utilized. Altogether, my findings provide a
substantialbodyofworkforinfluencingbasketballstrategy,andformeasuringtheeffectiveness
ofbasketballplayers.

3
Acknowledgements
Firstly,Iwouldliketoexpressmysincereappreciationtomythesiscommittee,Dr.AliannaMaren
andThomasRobinson.Theirpatienceandsupportwasabeaconthathelpedguidemetothe
end.Thankyou!
LastlyIwouldliketoexpressmydeepestgratitudetoDr.RajivShah.Hisadvice,collaboration,
andexcitementprovidedmetheenergyneededtofinishmythesisamidthestressesoffamily
lifeandfull timeemployment. Withouthis friendshipandcooperation,myworkwouldhave
beenonlyashellofwhatitis.Thankyou!

4
TableofContents
Abstract.................................................................................................................................2
Acknowledgements................................................................................................................3
Introduction...........................................................................................................................5
Background............................................................................................................................7
ReviewoftheLiterature.........................................................................................................9
SportVU...........................................................................................................................................9
VariableImportance.......................................................................................................................13
Methods................................................................................................................................16
Make-MissModel..........................................................................................................................16
PlayerModel..................................................................................................................................17
Results..................................................................................................................................23
Make-MissModel..........................................................................................................................23
PlayerModel..................................................................................................................................25
Conclusions...........................................................................................................................32
References............................................................................................................................35

5
Introduction
Basketballisagameofathleticism,skill,positioning,andteamwork.Teamsthatoptimizeeach
ofthesefacetsoftheirgamecangenerallyexpecttobesuccessful. However, it isdifficultto
measurethedegreetowhichagivenstrategycaninfluencebasketballsuccess,becausethere
aremany competing influencers (i.e. did a playermake a shot because they were open, or
becausetheyareagoodshooter?),andbecausethereissomuchnoisemixedinwiththesignal
(i.e.evengreatthree-pointshootersonlymake40%oftheirshots).
Withtheadventofplayertrackingdata,ithasbecomepossibletoexploregamestrategiesina
newlight.Playertrackingdataenablesmeasurementsthatwerenotbeforemeasureablebeyond
subjectivesuppositionsandterseremarks.Infact,acrosssports,playertrackingisrevolutionizing
the sports-analytics movement with copious collections of fine-grained game observations,
enablinganassortmentof(literally)game-changinganalyses.Inbasketballresearch,muchwork
hasbeendonetoleverageplayertrackingdata,butlittleworkhasusedittoanalyzethree-point
shooting.
Inmythesis:
• Ianalyzeplayertrackingdatafromover600gamesfromthefirsthalfofthe2015-2016
NBAseason,tofindplaysresultinginthree-pointshots.
• Iderivecustomposition-basedfeaturesthatcapturetangiblegamestrategiesfromgame-
playdata.

6
• I propose statistical methods for measuring the relative importance of any given
basketballstrategy.
• Idemonstratehowtheseposition-basedfeaturescanbeusedtomeasurethethree-point
shootingpropensityofplayers.
• Finally,Ishowhowthispropensitymetriccanidentifyeffectiveshootersthatareeither
highly-utilizedorunder-utilized.
7
Background
Between 2010 and 2013, the NBA equipped all of its arenas with motion capture cameras.
Throughoutthesubsequentbasketballseasons,positionaldatawerecollectedineveryregular
seasonandpostseasongame.Duringeachgame,thepositionsoftheballandeachplayeron
thecourtwererecordedatarateof25observationspersecond.Thisrichdatasethasenabled
researchers,analysts,andbasketballaficionadosaliketoexplorethegameofbasketballinways
thatwereneverbeforepossible.
YonggangNiu[2014]offersanexcellentdescriptiononthebackgroundofthetechnologythat
enables the collection of this data in their paperApplication of the SportVUMotion Capture
SystemintheTechnicalStatisticsandAnalysisinBasketballGames.Thefollowingparaphrases
thediscussioninthatpaperontheSportVUtechnology:
TheSportVUsystem(Multi-lensTracingSystem)wasinventedin2005,byIsraeliscientist
MickeyTamir,andwasoriginallyintendedformissiletrackinginamilitarysetting.The
technologywasalsoshowntohavefunctionalapplicationsinsports.In2008,thesports
analyticsfirmSTATSacquiredtheSportVUtechnologyandfocuseditontheanalysisof
basketballgames.Today,thissystemhasbeeninstalledineveryNBAteams’homecourt
andhascapturedmotiondataforover1000professionalbasketballgames.
To date, this NBA SportVU data has already occupied an important position in the
academicworld. The annual Sloan Sports Analytics Conference at theMassachusetts

8
InstituteofTechnologyisthetoptechnologyeventinthesportsworld.Amongthepapers
submittedtoSloanaboutbasketballlastyear,halfwerebasedonthedatacapturedfor
theNBAbytheSportVUsystem.
The SportVU system is run by STATS Data Corporation Limited. The ceiling of every
basketballgymnasiumintheNBAisequippedwith6camerasandeveryhalf-courthas3
cameras,allsynchronizedtoeachother.Collectively,thesecamerascaptureplayerand
ballmovements,andextractXYZlocationsrelativetothecourtatarateof25framesper
second.Furthermore,thesepositionaldataarecollectedwithaforeignkeythatcanbe
usedtojoinontoeachgame’sPlay-by-Playrecords.
ThisdecisionbytheNBAtoequipallof itsarenaswithSTATSSportVUsystemswaspivotal in
usheringinanewageofdatadrivenstrategytothegameofprofessionalbasketball.

9
ReviewoftheLiterature
SportVU
In his paper CourtVision: New Visual and Spatial Analytics for the NBA, Goldsberry [2012]
proposedtheuseofspatialanalyticaltechniquestoassessNBAplayer’sshootingabilities.His
workwasoneofanumberofeffortsbeginningtochallengebox-scoreanalyticsasthestatusquo
forbasketballperformanceassessment.Hesuggestedthatspatialanalysiswasvitaltothestudy
ofNBAbasketball,andthissuggestionhasonlybecomemoretrueinthepastfiveyears.Indeed,
hisworkhelpedpavethewayfortheNBAtobuyintocollectingplayertrackingdatawithSTATS
SportVU,whichspawnedaflurryof in-depthNBAspatialanalysesthatcontinuetocontribute
substantiallytothedomainofbasketballanalytics.
WiththeadventofSTATSSportVUtrackingdataintheNBA,basketballresearchershavebeen
abletoexplorein-gameinteractions,strategies,andplayerperformanceininnovativewaysthat
have not before been possible. Specifically, the granularity at which the SportVU data are
collectedenableaprecisionofmeasurementthatbeforewasnotpossibleinanalyzingthegame
ofbasketball.Indeed,inthefouryearssinceGoldsberry'sseminalwork,thefieldofbasketball
analyticshasbeenrevolutionizedbyanalyticswithSportVUtrackingdata.Ithasbeenleveraged
to inform all facets of the game, from teammember selection, to team strategy, to player
development.Thefollowingaresomeexamplesofthisradicalre-envisioning:
• Cervone et al. [2014] demonstrate that player-tracking data can be leveraged to

10
evaluateeverydecisionmadeduringabasketballgame,whetheritbetopass,dribble,
shoot,etc.Furthermore,theyshowthatbyapplyingtheirmodelingframeworktoevery
moment(25framespersecond)ofabasketballgame,amultitudeofnewmetricsand
analysesofbasketballbecomefeasible;theyoffersomeexamplesofthesenewmetrics
foransweringrealbasketballdecisions.
• Inamorerecentpaper,Cervoneetal.[2016]expandontheirpreviousworktoshowhow
newpositional-basedmetricscanbeleveragedtoinfluencebasketballstrategy.They
useSportVUtrackingdatatoassessthevalueofthespatialregionsofthebasketballcourt.
Theyinferthevalueofcourtrealestatebasedonplayerandballmovementalone.Asin
theirpreviouswork,theydevelopnewmetricsforassessingbothoffensesanddefenses
attheplayerandteamlevels.
• Maheswaranetal.[2014]showthatsimplebasketballstatisticssuchasreboundscanbe
observedinmuchmorecomplexwaysthansimplynumbersinabox-score. Theyuse
player trackingdata todeconstruct rebounds into subcomponents thathelp tobetter
explain reboundevents. Theypropose that a rebound canbe considered from three
distinctdimensions:Positioning,HustleandConversion,andthatplayertrackingdatacan
enablereboundeventstobeobservedinthesecontexts.LikeCervone,theydemonstrate
howsportstrackingdatacanenablethecreationofnovelmetricsforevaluatingthegame
ofbasketball.
11
• Luceyetal.[2014]useplayertrackingdatatoexplainhowshootersgetopen.First,they
confirmthenotionthaton-balldefensivepressurereducesshootingpercentages.Given
this,theyinvestigatehowanoffensecangetshootersopen.Theydemonstratethatthe
frequencyof defensive role-swaps is predictive of open shots, anduse this finding to
measureteams’defensiveeffectiveness.Furthermore,theydescribeamethodthatcan
beusedtoquerysimilarhistoricalplaysbyusingtrackingdataasthequeryinput.
Remarkably,thisisonlyasmallsampleoftheworkdonetodatethathasdemonstratedthevalue
ofSportVUdata.Morerecentresearchispushingitslimitsevenfarther,fromautomaticplay
categorization, toapplicationswithneuralnetworks, to thepredictionof injuriesbefore they
happen. Truly, the uses of SportVU data are bountiful. More significantly, SportVU data is
enablingsportsanalysesthatarebothuniqueandmeaningfultothegameofbasketball.Here
areafewexceptionalexamples:
• McIntyreetal.[2016]proposethattheirworkcanbeconsumedasonecomponentofa
coachingassistancetool foranalyzingplays. Theyuseplayertrackingdatatotraina
classifierthatlabelsballscreenplaysaccordingtocommondefensiveresponsestrategies:
Over,Under,Trap,andSwitch.
• WangandZemel [2016]demonstratehow long short termmemory (LSTM) recurrent

12
neuralnetworkscanconsumevoluminousamountsofthefine-grainedSportVUdatato
performanalysesandcomparisonsofbasketballplaysthatwouldnotbepossiblefora
humanobserveralone.Theyfocusontheclassificationofoffensiveplays.Theuseofan
LSTMallowstheirnetworktolearnthecomplexinteractionsbetweenalltheplayerson
thecourtas theyevolveover thecourseofaplay.Furthermore, theyshowhowtheir
modelcanstillperformwellwhentrainedononeseasonandtestedonthenext.
• Talukderetal.[2016]presentamodelthatusesSportVUplayertrackingdatatopredict
the likelihood that any given player will sustain an injury during the course of an
upcominggame.Theycombineplay-by-playgamedata,SportVUdata,playerworkload
andmeasurements,andteamschedulestotraintheirpredictivemodel.Theyarguethat
bycombiningtheirresultswithinformationonteamschedulesandrestdays,teamscan
identifythebesttimetoresttheirstarplayersandreducelong-terminjuryrisk.Thiswork
is significant because it demonstrates how player tracking data can impact the game
beyond justbasketball strategy; it canbeharnessed tomanageplayerhealth,and,by
association,faninterestandrevenue.Furthermore,itcanbeusedbyfantasysportsfans
tomanagetheirowninvestmentrisks.
Insum,thereisasubstantialbodyofworkdevelopedinthelastfewyearsencompassingthe
analysisofbasketballwithNBASportVUtrackingdata.Becausepositioningissocentraltothe
gameof basketball,Goldsberry’s [2012] suggestion is becomingmore andmore true: spatial
13
analysisisvitaltothestudyofthegame.ThefloodofdatacollectedduringgamesviaSportVUis
revolutionizingbasketballanalytics. Thisrevolution ischallengingcoreprinciplesofthegame
includinggamestrategy,performanceassessment,andteamandplayermanagement.Likewise
itasanexcitingtimetobeinvolvedinbasketballresearchbecauseeachnewinnovationopens
doorstomanynewanalysesandposesquestionsabouthowweunderstandthegame.
VariableImportance
Importantvariablemeasurementisakeycomponentofthiswork,soconsidersomebackground
onthistopic.Someofthemostcommonlyusedmachinelearningalgorithmssuchasrandom
forests and gradient boostingmachines providemeasures for predictor variable importance
alongwiththeirresultantmodels.Breiman[2001]discussesvariableimportanceinhisRandom
Forests paper. He describes how out-of-bag predictors are randomly permuted tomeasure
percentincreaseinmisclassificationrateforeachpredictorvariable,togiveastrongestimateof
variableimportanceforthegivenclassificationorregressiontask.Healsodescribeshowrandom
forestsarerobusttocollinearity,andcanimplicitlycapturevariableinteractionsintheirvariable
importancemeasurements.Sincetheirintroduction,randomforestshavebecomeastandard
method for measuring important variables. Given their strengths, random forests may be a
perfectvehicleforassessingbasketballstrategiesinmywork.
However, random forestsdohave some flaws invariable importancemeasurement. In their
paperBiasinrandomforestvariableimportancemeasures:Illustrations,sourcesandasolution,
Strobletal. [2007]discusshowrandomforestsarenot reliable in situationswherepredictor
14
variablesvary in theirscaleofmeasurementor theirnumberofcategories. Specifically, they
demonstrate that when random forest variable importancemeasures are usedwith data of
varying types, the results are misleading because suboptimal predictor variables may be
artificially preferred. They propose conditional inference forests as a strategy to counteract
thesebiases.
One downside to the conditional inference forests proposed by Strobl et al. [2007] is
computational inefficiency, so I consider an alternativemethod formywork. In their paper
Feature Selection with the Boruta Package, Kursa and Rudnicki [2010] describe how their
algorithmBorutacontrolsforthevariable importancebiasesofarandomforest. Specifically,
they standardize importancemeasures to z scores, and intentionally include features in the
modelthatarerandombydesign;theseareknownas‘shadow’features.Ashadowfeature’s
Boruta importance score can be nonzero only due to random fluctuations. Thus the set of
importancescoresofshadowfeaturesisusedasareferencefordecidingwhichactualfeatures
are truly important. Effectively,anythingthatperformsworsethantheseshadowfeatures is
considerednobetterthanrandom. Further,theBorutaalgorithmimplementationisefficient
enoughthatdozensofiterationscanbeperformedonmydatatoassemblefeatureimportance
distributions,ratherthanmerelyscalarmeasurements.
Inmywork, IusetheBorutaalgorithmtomeasurevariable importance,because it isamore
advanced (andmorecurrent)methodwhichcanovercome thedeficienciesof random forest
variableimportancemeasurementformyproblem.Bycouplingthemostrecentinnovationin

15
basketballdata-gathering(SportVU),withanadvancedvariableimportancealgorithm(Boruta),I
amabletoextractmeaningfulresultsthatwouldhavebeenimpossibletoachieveeven3years
ago.

16
Methods
Make-MissModel
Asawhole,thisresearchinvestigatesthree-pointshotstrategiesintheNBA.Toaccomplishthis,
three-pointstrategyisinvestigatedfromtwodifferentframesofreference.First,three-pointers
arestudiedattheplaylevel,wherein-gamestrategiesandactionsarecomparedfortheirpower
atinfluencingthree-pointshotsuccess.Specifically,amodelistrainedtomeasureeachvariable’s
importanceininfluencingamakeormiss.Tovisualizethismake-missmodel,considerhoweach
basketballgameismadeupofmanyplays,andhoweachplay ismadeupoftheactionsof5
playersfromeachteamandtheball,asdepictedinFigure1.
Figure1:Depictionofthemake-missmodelframeofreference

17
AsdepictedinFigure1,eachplayismadeupoftheactionsof5playersfromeachteamandthe
ball.Iusetheseplayerandballactionstoconstructcustomfeaturesthatcapturegamestrategy
such as teamwork, player matchups, and on-ball defender distances. These features are
aggregated intoa singleobservation foreachplay,acrossallgames.Likewise, themake-miss
modelisconstructedonthiscollectionofobservationsofmycustomfeaturesforeachplay.
Thestructureofabasketballgamelendsitselfperfectlytoaclassificationproblem,becauseevery
shottakenhasabinaryoutcome:amake,oramiss.Thisanalysisusestheplay(specificallythree-
pointplays) as its unit ofmeasurement, and seeks toquantify the relative valueof different
offensivestrategiesatthatplaylevel.Likewise,thevariableimportancemeasuresreturnedby
theBorutaalgorithmareperfectvehiclesforquantifyingtherelativevaluesofplaystrategies.By
consideringthemake/missofathree-pointerasaclassificationproblem,Ifitamodeltopredict
theoutcomeofaplay,thencomparetheimportanceofthedependentvariables.
PlayerModel
Tobecompetitiveatmakingthree-pointshotsintheNBA,understandingtherelativestrengthof
variousgamestrategiesandactionsisastrongstart.However,three-pointshootingisaskill,and
onethatvariesgreatlyevenat theprofessional level. Likewise, it ishighlyvaluabletoassess
three-pointshootingacrossplayers.

18
ThesecondframeofreferenceIusetoanalyzethree-pointshootingisattheplayerlevel,where
the same in-game strategies and actionsmeasured in themake-missmodel are collapsed to
comprehensivevaluesforeachplayer.Tovisualizetheplayermodel,considerhowineachgame,
agivenplayermaytakeathree-pointshotonmultipleplays.Foreachplayer,Iaggregateallof
theirthree-pointshootingplaysacrossallgames,asdepictedinFigure2.
Figure2:Depictionoftheplayermodelframeofreference
AsdepictedinFigure2,playerAshotthree-pointersonmultipleplays.Icollectthemake-miss
modelfeaturesforallthree-pointshootingplaysforplayerA,acrossallgames,andaggregate
them to form a single observation for player A. I do this aggregation for all players who
attemptedathree-pointshot.ThiscollectionofplayerobservationsformsthedataonwhichI
buildtheplayermodel.

19
Intheplayermodel,Iaggregatethemetricsderivedinthemake-missmodeltoeachshooterin
mydatasettoidentifytrendsinplayerusage.Byaggregatingthefeaturesdefinedinthemake-
missmodel,Iamabletocapturecomprehensivemeasurementsofthemovementofplayersand
theirteamsontheirthree-pointshootingplays.Specifically,theplayermodelusesagradient
boosting machine regression algorithm to predict three-point attempts. By comparing the
model’spredictionforaplayer’sper-gamethree-pointattemptratetotheiractualthree-point
attemptrate,Icanidentifyplayerswhoarebehavinginunexpectedways.Iquantifyboththe
mosteffectiveshooters,andthemostunder-utilizedshooters.
Next, consider the modeling strategy I deployed for the player model problem. A typical
modelingframeworkmightincludeatraindataset,andatestdataset,suchthatthetrainsetis
usedtotrainthemodel,andthetestsetisusedtoevaluatethemodel’sperformanceonunseen
data. Thisarchitecturewould looksomething likeFigure3,wheretheorangeboxrepresents
trainingdatacontainingobservationsforplayers1throughn,andtheblueboxrepresentstesting
datacontainingobservationsforplayersmthroughz:
20
ModelTraining Holdout
Figure3:Typicalmodelingdataframework
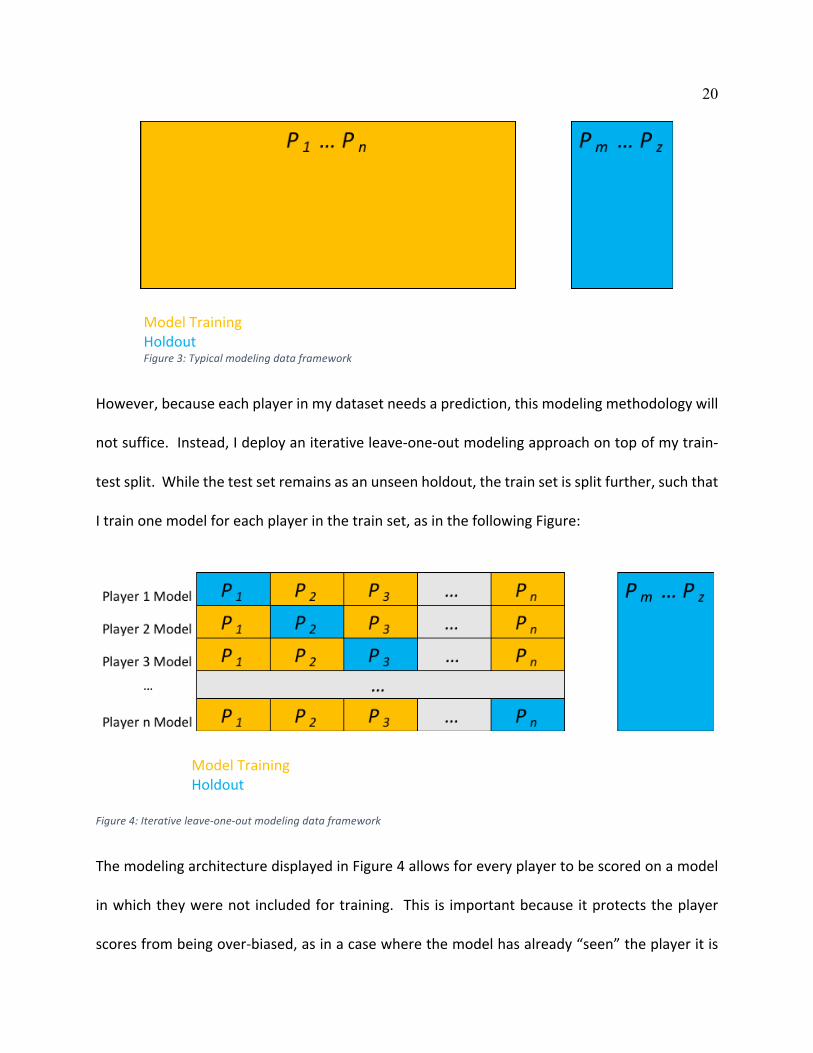
However,becauseeachplayerinmydatasetneedsaprediction,thismodelingmethodologywill
notsuffice.Instead,Ideployaniterativeleave-one-outmodelingapproachontopofmytrain-
testsplit.Whilethetestsetremainsasanunseenholdout,thetrainsetissplitfurther,suchthat
Itrainonemodelforeachplayerinthetrainset,asinthefollowingFigure:
ModelTraining Holdout
Figure4:Iterativeleave-one-outmodelingdataframework
ThemodelingarchitecturedisplayedinFigure4allowsforeveryplayertobescoredonamodel
inwhichtheywerenot includedfortraining. This is importantbecauseitprotectstheplayer
scoresfrombeingover-biased,asinacasewherethemodelhasalready“seen”theplayeritis

21
scoring.Also,bymaintainingaholdouttestset,Icanevaluatetheperformanceofeveryplayer’s
modelandassessmodelconsistencyacrosstheplayers;andbecauseeachplayermodel’straining
setonlydiffersbyoneobservation,wecanexpectconsistentmodelperformance.
Next, consider the means by which players can be assessed based on the outputs of their
respectiveplayermodels.AsIdescribedabove,Ifirstfindthedeviationbetweenthemodel’s
predictionforaplayer’sper-gamethree-pointattemptrateandtheiractualthree-pointattempt
rate.Inasense,Iusetheerrortermoftheregressionmodeltoidentifyplayerswhoarebehaving
inunexpectedways.Specifically,Imeasureplayermodeldeviationlikethis:
𝑑𝑒𝑣𝑖𝑎𝑡𝑖𝑜𝑛 = 𝑎𝑐𝑡𝑢𝑎𝑙3𝑃𝐴 − (𝑝𝑟𝑒𝑑𝑖𝑐𝑡𝑒𝑑3𝑃𝐴)
Intheaboveequation,deviationisdefinedasthedifferencebetweenaplayer’sactualthree-
pointattemptrate,andtheirmodel-predictedthree-pointattemptrate.Thisdeviationalonecan
identifyplayerswhoshootthree-pointersmoreorlessfrequentlythanotherplayerswithlikein-
gameexperiences.However,asmentionedbefore,three-pointsuccessishighlydependenton
player skill. Likewise, I propose a new metric for measuring a given player’s three-point
propensity,byapplyingapenaltyondeviationaccording to theplayer’s three-point shooting
percentage.Specifically,Imeasurepropensitylikethis:
𝑃𝑟𝑜𝑝𝑒𝑛𝑠𝑖𝑡𝑦 = 𝐷𝑒𝑣𝑖𝑎𝑡𝑖𝑜𝑛(3𝑃%):
In the above equation, propensity is defined as a player’s deviation times their three-point
shootingpercentagecubed.Bycubingthree-pointshootingpercentage,Iensurethattheworst

22
shooters receive a large compounded penalty, while the best shooters receive the smallest
penalty.Whenplayersareorderedbytheirpropensity,thosewiththehighestscoresareboth
effectiveandhighlyutilized,whileplayerswiththemostnegativescoresaretheleastutilized,
thoughstillveryeffective.

23
Results
Make-MissModel
First,considertheresultsofthemake-missmodel.Recallthatthemake-missmodelwastrained
to measure the relative importance of each feature in predicting a made shot. Figure 5
summarizes the returned Boruta importance scores for each feature relative to each other.
Figure5:Borutafeatureimportancedistributionsforthemake-missmodel
AsdepictedinFigure5,theboxesfortheshadowvariablesonthefarleft-handsideofthefigure
representtheBorutaimportancescoresforrandomlypermutedvariables.Becauseeachshadow
feature represents the distribution of importance scores for random source feature
permutations,wecaninferthateachofourfeaturesisatleastmorepredictivethanrandom.

24
OtherkeytakeawaysfromFigurefivearethatteamworkmetrics(e.g.,offensiveconvexhulland
ballmovement)aregenerallymorepredictiveofsuccessthanplayermatchups.Unsurprisingly,
someof the strongest predictors capture the distance between the shooter and the nearest
defender.
Therestoftheseresultscanbeeasytoglossover,soIwilldescribesomeofthemorenuanced
findingshere,andprovidecontext.First,ofallthemetricstested,theonethatismostpredictive
ofamakeormissistheaverage(median)distancebetweentheshooterandtheclosestdefender
overthecourseofthatplay.Thisresultisexpected:itiseasierforaplayertoshootwhenthey
areopen,anditismoredifficulttoshootwhentheyarebeingdefendedclosely.Inasense,this
findingprovidesasanitycheckontherestofthefindingsinthisanalysis.
Next,IwanttojumpdownthelistalittletopointoutPLAYER1_ID.Thisfeaturerepresentsthe
identity of the shooter. Consider what that means in this context. The identity of a player
essentially captures the difference in player skill and efficiency in one feature. Its relative
importancetellsushowsignificantitisthatagoodplayerisshootingvs.abadone.Furthermore,
itspositiononthelistofimportantfeaturesisverynoteworthybecausetherearemanyfeatures
aheadofit.Thissuggeststhatmanyfeatures,suchasballmovement,andshottiming,aremore
predictiveofthree-pointsuccessintheNBAthantheshooter’sskill.
Next,considerthevariousfeaturesthatcaptureshooter-defendermatchups. Manyoffensive
gamestrategiesinvolveluringthedefenseintopersonnelmismatches,throughscreensetting,
orothermeans.Forexample,itisgenerallyacceptedthatbigplayerscanover-powersmaller

25
defenders on post-up plays. However, it is not aswell understood howmismatches can be
exploited on three-point shots. According to these results, the difference in height,weight,
experience, andposition between a shooter andhis nearest defender all have relatively low
poweratpredictingthree-pointshotoutcomeswhencomparedtostrategiesthat involveball
movement,courtspacing,shottiming.
PlayerModel
Next,considertheresultsoftheplayermodel.Recalltheleave-one-outmodelingarchitecture
thatwasdeployedforscoringplayersintheplayermodel,andconsiderthedistributionofmodel
performance observed on each of the player models. Below, I plot a histogram of model
performanceintermsofR2andRMSE(rootmeansquarederror)forthetestsetscoredoneach
oftheplayermodels.

26
Figure6:HistogramsofRMSEandRsquaredacrossallplayermodels
In the histograms depicted in Figure 6, we can see that the distribution of player model
performance is approximately normal for both RMSE and R2. The narrow shape of each
distributionsuggestsstablemodelperformanceacrossplayers. Furthermore,wecanobserve
thatthemodelsdisplayareasonablevariance;meanR2isaround0.46,withmaximumaround
0.55, and minimum around 0.39. These results should offer confidence in the stability of
performanceacrossplayermodels.
Next,recallthattheplayermodelaggregatesthefeaturesderivedinthemake-missmodelto
eachplayer in thedataset foracomprehensivemeasurementofplayerand teammovement
duringthree-pointshots.Theplayermodelusestheseaggregatefeaturestoinfereachplayer’s

27
per-gamethree-pointattemptrate.Bycomparingaplayer’smodel-inferredthree-pointattempt
ratetotheiractualthree-pointattemptrate,wecanobserveplayerswhobehaveinuniqueways
intermsoftheirthree-pointshooting.Specifically,thiscomparisonallowsustodeduceifagiven
playershootsmorefrequentlyorlessfrequentlythanwouldbeexpectedofanotherplayerin
theirsituation.Considerfirstplayerswhoshotmorethreespergamethanexpected:
Figure7:Playerswhoshotmorethreesthantheirmodelexpected,coloredbytheirrespectivethree-pointshootingpercentage
InFigure7,thesizeofthebarassociatedwitheachplayercorrespondstothedeviationoftheir
actual three-point attempt rate from their model-expected three-point attempt rate (more

28
three-point attempts thanexpected). The color of eachbaroffers context by conveying the
three-pointshootingpercentageofthecorrespondingplayer.TheplayersshowninFigure7are
the top tenpositivedeviators from theirmodel’s projection.We can see that StephenCurry
averaged5.7more three-point attemptsper game thanexpectedand is also a veryefficient
three-pointshooter.Giventhehighefficiencyofthetwo-timemostvaluableplayer,heshould
beawelcomeoutlier.
Conversely,weseethatKobeBryantaveraged3morethree-pointattemptspergamethanhis
modelexpected,butwasaveryinefficientthree-pointshooter.Knowinghisspecificsituationis
revealing;2015-16wasthefinalseasonofBryant’slongandstoriedcareer.Thoughtheseresults
suggesthewasforcingupmanymorethree-pointersthanotherplayers inhispositionwould
have, his team presumably put up with such inefficient performance in honor of his final
professionalseason,andtogivetheirfansafinalglimpseofhiminaction.Next,considerplayers
whoshotfewerthreespergamethanexpected.
29
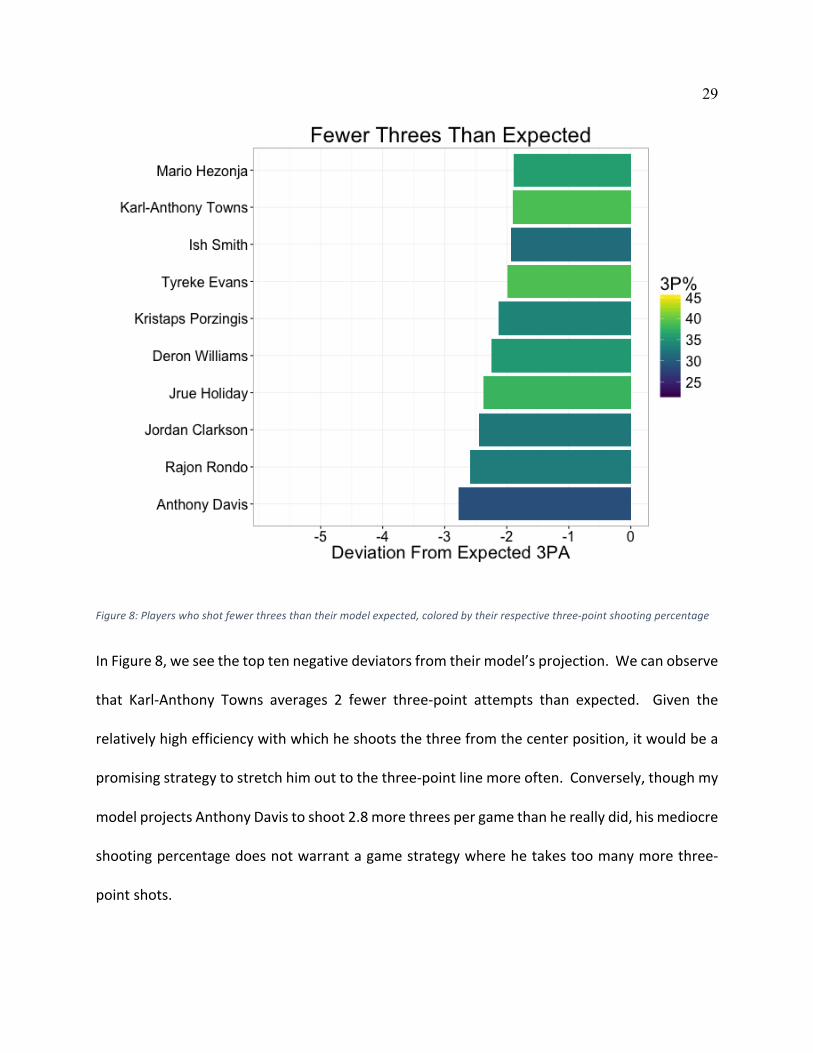
Figure8:Playerswhoshotfewerthreesthantheirmodelexpected,coloredbytheirrespectivethree-pointshootingpercentage
InFigure8,weseethetoptennegativedeviatorsfromtheirmodel’sprojection.Wecanobserve
that Karl-Anthony Towns averages 2 fewer three-point attempts than expected. Given the
relativelyhighefficiencywithwhichheshootsthethreefromthecenterposition,itwouldbea
promisingstrategytostretchhimouttothethree-pointlinemoreoften.Conversely,thoughmy
modelprojectsAnthonyDavistoshoot2.8morethreespergamethanhereallydid,hismediocre
shootingpercentagedoesnotwarrantagamestrategywherehetakestoomanymorethree-
pointshots.

30
Theresults illustrated inFigures7and8anddiscussedaboveareverytelling. Theyhighlight
effectiveand ineffectiveshooters in thecontextofhowotherplayerswouldperform in their
situation.However, theydonotconveythewholestory. Asdemonstrated in thisdiscussion,
thereisameaningfulrelationshipbetweenaplayer’sdeviationfrommodel-expectedthree-point
attemptsandtheirthree-pointshootingpercentage.Likewise,Idefinedthepropensitymetric
formeasuringthisrelationship.Recallthatwhenplayersareorderedbytheirpropensity,those
withthehighestscoresarebotheffectiveandhighlyutilized;theseplayersconsistentlymake
shotsthattheirpeerswouldnot.Conversely,playerswiththemostnegativepropensityscores
areveryeffectiveshooterswhoareunder-utilized;theyrepresentplayerswiththemostmissed
opportunities;despitebeingeffectiveshooters,theyrefrainfromshootingmoreoftenthantheir
peerswouldinsimilarsituations.Considertheplayerswiththestrongestpropensityfromeach
ofthesetwogroups(effectivehigh-utilizationandeffectivelow-utilization),aslistedinFigure9.

31
Effective,High-utilizationPlayer PropensityStephenCurry 0.5250KlayThompson 0.1984DamianLillard 0.1881WesleyMatthews 0.1310JamesHarden 0.1206HollisThompson 0.1156PaulGeorge 0.1119KyleLowry 0.1075J.R.Smith 0.1008IsaiahCanaan 0.0989
…
JeffTeague -0.0939TroyDaniels -0.0974ChrisPaul -0.0977DeronWilliams -0.1005IanClark -0.1005KawhiLeonard -0.1023Karl-AnthonyTowns -0.1117TyrekeEvans -0.1179JrueHoliday -0.1290LuisScola -0.1468
Effective,LowUtilization
Figure9:Three-pointshooters,orderedandcoloredbytheirthree-pointshootingpropensity
Themosteffective,highlyutilizedplayersareobserved in the first tableofFigure9. The list
includesmanyhouseholdnames,suchasthehistoricallygreatshooterandMVPStephenCurry,
histeammateKlayThompsan,aswellasDamianLillard,JamesHarden,andPaulGeorge.These
players’labelasgreatshooterswillbenosurprisetoNBAfans.However,whenassessedbythe
same standards, several other lesser-heralded shooters rankhighly;WesleyMatthews,Hollis
Thompsan,andIsaiahCanaanareallwellregardedshooters,butrarelyhavetheirthree-point

32
shootingprowesscomparedtothesuperstarscitedabove.
Similarly, the second table of Figure 9 lists themost effective and under-utilized three-point
shooters.Again,thislistisofparticularinterestbecauseitcallstolightplayerswhocouldexpect
tobesuccessful if theyshootmore three-pointers. Asbefore,wesee the rookie-of-the-year
centerKarl-AnthonyTownswithastrongrankingbythismetric.Inshort,thisisasignificantlist
becausetheseplayershaveunlockedpotentialintermsofthree-pointshooting.Knowingthis,
teams can adjust game strategy around these players, or target under-the-radar players for
sneakytalentacquisition.
33
Conclusions Inmythesis,Imeasuretherelativeinfluenceofcompetingbasketballgamestrategies,andIapply
myanalysistoplaysresultinginthree-pointshots.IuseSportVUplayertrackingdatafromNBA
games to derive custom position-based features that capture tangible game strategies from
game-playdata.Then,Idemonstratestatisticalmethodsformeasuringtherelativeimportance
ofanygivenbasketballstrategy.Indoingso,Ihighlightthehighimportanceofteamworkbased
strategies in affecting three-point shot success. By coupling the most recent innovation in
basketballdata-gathering(SportVU),withanadvancedvariableimportancealgorithm(Boruta),I
amabletoextractmeaningfulresultsthatwerenotfeasibleeven3yearsago.Furthermore,I
demonstrate how player-tracking based features can be used to measure the three-point
shootingpropensityofplayers,andIshowhowthismeasurementcanidentifyeffectiveshooters
thatareeitherhighly-utilizedorunder-utilized.Altogether,thesefindingsprovideasubstantial
bodyofwork for influencing basketball strategy, and formeasuring thequality of basketball
players.
Thoughthree-pointshootingwasthefocusofmyresearch,thatchoicewasanarbitraryoneto
narrowmyscope. ThemethodsIdemonstrateinmyresearchcanbeappliedtoanumberof
game targets as long as they can be measured (i.e. 2-point shooting, pick-and rolls, team
rebounding,defense,etc.).Similarly,thefeaturesthatIdefineinthemake-missmodelwerealso
onlyarbitraryselectionsbasedonquantifiablegamestrategies;anygamestrategycanbetested
inthisframeworkaslongasitcanbemeasured.

34
Intheplayermodel,Iconstructahighlymeaningfulmodelthatwastrainedonlyonthefeatures
definedforthemake-missmodel.However,thesefeaturesarelimitedintheirabilitytocapture
relevant game-play information, and their explicit definitions are not relevant for the player
model’sutilization.Likewise,amoreencompassingapproachtotrainingaplayermodelwould
bebasedonaneuralnetworkstylearchitecture.Thebenefitofaneuralnetworkinthissituation
isthat itcantaketherawplayertrackingdataas inputs,andautomatically learntherelevant
featuresandinteractionsforagiventarget(i.e.three-pointshooting).Onecouldthusexpecta
neuralnetworkstylemodeltoachieveevenbetterperformancethanthemodelIdemonstrate
inthisresearch.Moreover,asdiscussedintheliteraturereview,neuralnetworkshavealready
beensuccessfullydemonstratedforuse-casesontheNBAplayertrackingdata.
Inclose,myworkpushestheenvelopeforanalyzingbasketballstrategy,andformeasuringthe
qualityofbasketballplayers.Untilrecently,theanalysesdemonstratedinthispaperwerenot
evenfeasible.Theywereonlymadepossiblewiththeavailabilityofplayertrackingdataandwith
thelatestadvancesinstatisticallearning.Muchisstillyettobedonetoadvancebothmywork
andthefieldofbasketballanalyticsasawhole.SportVUdatahasopenedmanynewdoorsfor
basketballanalytics,andeachnewanalysissnowballsmanymorequestionsaboutourperception
ofthegame.

35
References
Breiman,L.(2001).Randomforests.MachLearn,45(1),5-32.
DanCervone,LukeBornn,KirkGoldsberry(2016).NBACourtRealty,MITSloanSportsAnalyticsConference.
DanCervone,AlexanderD’Amour,LukeBornn,KirkGoldsberry(2014).POINTWISE:PredictingPoints and Valuing Decisions in Real TimewithNBAOptical Tracking Data,MIT Sloan SportsAnalyticsConference.
J.H.Friedman(2001).GreedyFunctionApproximation:AGradientBoostingMachine,AnnalsofStatistics29(5):1189-1232.
KirkGoldsberry (2012).CourtVision:NewVisual andSpatialAnalytics for theNBA,MITSloanSportsAnalyticsConference.
MironB.Kursa,WitoldR.Rudnicki(2010).FeatureSelectionwiththeBorutaPackage.JournalofStatisticalSoftware,36(11),p.1-13.URL:http://www.jstatsoft.org/v36/i11/.
PatrickLucey,AlinaBialkowski,PeterCarr,YisongYueandIainMatthews(2014).“HowtoGetanOpen Shot”: Analyzing TeamMovement in Basketball using Tracking Data,MIT Sloan SportsAnalyticsConference.
Rajiv Maheswaran, Yu-Han Chang, Jeff Su, Sheldon Kwok, Tal Levy, Adam Wexler, NoelHollingsworth (2014). The Three Dimensions of Rebounding, MIT Sloan Sports AnalyticsConference.
AveryMcIntyre,JoelBrooks,JohnGuttag,andJennaWiens(2016).RecognizingandAnalyzingBallScreenDefenseintheNBA,MITSloanSportsAnalyticsConference.
RCoreTeam(2015).R:Alanguageandenvironmentforstatisticalcomputing.RFoundationforStatisticalComputing,Vienna,Austria.URLhttps://www.R-project.org/.

36
CarolinStrobl,Anne-LaureBoulesteix,AchimZeileis,TorstenHothorn(2007).Biasinrandomforestvariableimportancemeasures:Illustrations,sourcesandasolution,BMCBioinformatics.HishamTalukder,ThomasVincent,GeoffFoster,CamdenHu,JuanHuerta,AparnaKumar,MarkMalazarte,DiegoSaldana,ShawnSimpson(2016).Preventingin-gameinjuriesforNBAplayers,MITSloanSportsAnalyticsConference.Kuan-ChiehWang,RichardZemel(2016).ClassifyingNBAOffensivePlaysUsingNeuralNetworks,MITSloanSportsAnalyticsConference.YonggangNiu,HaojieHuang,HuanbinZhao(2014).ApplicationoftheSportVUMotionCaptureSystemintheTechnicalStatisticsandAnalysisinBasketballGames,AsianSportsScience.