slit die rheology of hdpe and abs based wood plastic composites€¦ · slit die rheology of hdpe...
TRANSCRIPT

SLIT DIE RHEOLOGY OF HDPE AND ABS BASED
WOOD PLASTIC COMPOSITES
By
Matthew Wayne Chastagner
A thesis submitted in partial fulfillment of the requirements for the degree of
MASTER OF SCIENCE IN MECHANICAL ENGINEERING
WASHINGTON STATE UNIVERSITY School of Mechanical and Materials Engineering
AUGUST 2005

ii
To the Faculty of Washington State University:
The members of the Committee appointed to examine the thesis of
Matthew Wayne Chastagner find it satisfactory and recommend that it be
accepted.
Chair

iii
ACKNOLEDGEMENT
The author would like to thank BASF Corporation for their generous donation of
ABS materials for use in this research.

As the use of wood plastic composite materials has continued to increase, the
research into the rheology of these materials has taken a back seat to the characterization
of the mechanical properties. However, for an accurate determination of the mechanical
properties to occur, an understanding of the rheological behavior of the melt is needed,
since changes in the melt can directly affect the final product properties. A rheological
slit die was used to quantify the shear viscosity, shear stress and extruder motor current
for acrylonitrile-butadiene-styrene (ABS)/ and high-density polyethylene (HDPE)/wood
filled melts. Using a Carreau curve fit, the viscosity results indicate that there is a
significant increase in the melt viscosity as the wood filler amount increased. In HDPE
melts, when the wood filler size and wood species changed, there was little observed
change in the viscosity. With the ABS based melts, when the temperature of the melt
increased, the shear viscosity of the melt decreased. This change in melt temperature was
then used to create master curves by reducing the viscosity and shear rate. Since the
shifting factors used to create the master curves followed an Arrhenius curve fit, the melt
activation energy of the ABS melts was also determined. In both the ABS and HDPE
melts, the melt shear stress increased as the temperature decreased and the wood filler
content increased. Similar trends were observed when the required motor current load
iv
SLIT DIE RHEOLOGY OF HDPE AND ABS BASED
WOOD PLASTIC COMPOSITES
Abstract
by Matthew Wayne Chastagner, M.S.
Washington State University August 2005
Chair: Michael P. Wolcott

v
was analyzed for the HDPE melts, but there was more variation in the data as compared
to the observed shear stress and viscosity results.

vi
TABLE OF CONTENTS
TABLE OF CONTENTS.................................................................................................. VI
LIST OF TABLES..............................................................................................................X
LIST OF FIGURES .......................................................................................................... XI
CHAPTER 1 - INTRODUCTION.....................................................................................13
1.1 Background..............................................................................................................13
1.2 Significance..............................................................................................................14
1.3 Objectives ................................................................................................................15
1.4 References................................................................................................................17
CHAPTER 2 – HDPE/WOOD COMPOSITE RHEOLOGY............................................18
2.1 Abstract ....................................................................................................................18
2.2 Introduction..............................................................................................................19
2.3 Literature Review.....................................................................................................20
2.3.1 Slit Die Rheology................................................................................. 20
2.3.2 Comparison of slit and capillary die rheometry................................... 22
2.3.3 Slit Die Design..................................................................................... 24
2.4 Materials ..................................................................................................................26
2.5 Methodology............................................................................................................26
2.5.1 Slit Die Setup ....................................................................................... 26
2.5.2 Slit Die Measurements......................................................................... 27
2.6 Results......................................................................................................................27
2.6.1 Particle Size Analysis .......................................................................... 27

vii
2.6.2 Comparison of capillary and slit die results......................................... 28
2.6.3 Shear Viscosity .................................................................................... 30
2.6.4 Shear Stress.......................................................................................... 34
2.6.5. Extruder Motor Current ...................................................................... 36
2.7 Conclusion ...............................................................................................................36
2.8 References................................................................................................................39
2.9 Figures......................................................................................................................42
2.10 Tables.....................................................................................................................49
CHAPTER 3 – RHEOLOGY OF ABS/WOOD COMPOSITES......................................50
3.1 Abstract ....................................................................................................................50
3.2 Introduction..............................................................................................................51
3.3. Literature Review....................................................................................................52
3.4 Materials ..................................................................................................................54
3.5 Methods....................................................................................................................55
3.5.1 Slit die measurements .......................................................................... 55
3.5.2 Carreau-Yasuda curve fitting............................................................... 56
3.5.3 Time-Temperature Superposition ........................................................ 57
3.5.4 Experimental Techniques..................................................................... 58
3.6 Results......................................................................................................................59
3.6.1 Shear viscosity results.......................................................................... 59
3.6.2 Viscosity Temperature Dependence .................................................... 60
3.6.3 Shear Stress Analysis........................................................................... 62
3.7 Conclusions..............................................................................................................63

APPENDIX A - DETERMINATION OF WOOD PLASTIC COMPOSITE
DENSITY
viii
3.8 References................................................................................................................66
3.9 Figures......................................................................................................................69
3.10 Tables.....................................................................................................................74
CHAPTER 4 - CONLUSIONS..........................................................................................76
4.1 Conclusions..............................................................................................................76
4.2 Future work..............................................................................................................79
....................................................................................................................80
A.1 Introduction.............................................................................................................80
A.2 Literature.................................................................................................................80
A.3 Measurement...........................................................................................................81
A.4 Results and Discussion............................................................................................82
A.5 Conclusions.............................................................................................................82
A.6 References...............................................................................................................84
A.7 Figures.....................................................................................................................85
A.8 Tables ......................................................................................................................86
APPENDIX B - PARTICLE SIZE ANALYSIS ...............................................................88
B.1 Introduction .............................................................................................................88
B.2 Methods and Materials ............................................................................................88
B.3 Results .....................................................................................................................89
B.4 Conclusions .............................................................................................................90
B.5 References ...............................................................................................................92

ix
B.6 Figures.....................................................................................................................93
B.7 Tables ......................................................................................................................95

x
LIST OF TABLES
Table 2.1. Material formulations ..................................................................................49
Table 2.2. Carreau curve fit values ...............................................................................49
Table 3.1. Material formulations for GP-22 filled with maple wood flour ..................74
Table 3.2. Carreau-Yasuda values for GP-22 filled with maple....................................75
Table 3.3 Carreau-Yasuda values for SAN let down procedure....................................75
Table A.1. Density Randomization................................................................................86
Table A.2. Density of samples.......................................................................................86
Table A.3. t-Test: Two-sample test................................................................................87
Table B.1 Normalized Data Results...............................................................................95
Table B.2 Normalized Data Results...............................................................................96

xi
Figure. 2.4. Shear viscosity results for 30%-70% HDPE/wood composites .................43
LIST OF FIGURES
Figure 2.1. Top and end view of slit die schematic .......................................................42
Figure 2.2. Particle height distribution ..........................................................................42
Figure 2.3. Carreau and power law curve fits for 30% 40-mesh maple and 70% 40-
mesh maple formulations.......................................................................................43
Figure. 2.5. Shear viscosity results for a 40-mesh maple based WPC...........................44
Figure. 2.6. Shear viscosity results for 40, 60, 80 and 100-mesh maple composites ....44
Figure. 2.7. Comparison of capillary die and slit die rheometry results........................45
Figure. 2.8. Comparison of HDPE/wood composite blends viscosity results ...............45
Figure 2.9. Shear stress of HDPE/wood composites .....................................................46
Figure 2.10. Shear stress of HDPE/maple composites with a variation in mesh size....46
Figure 2.11. Shear stress of pine based wood plastic composites .................................47
Figure 2.12. Shear stress of maple based wood plastic composites...............................47
Figure 2.13. Changes in extruder motor current due to melt formulation changes.
Linear regression curve fits shown for trend deciphering .....................................48
Figure 2.14. Effect of maple mesh size on the current draw of the extruder motor ......48
Figure 3.1 Representative Carreau-Yasuda curve fit of experimental data ...................69
Figure 3.2. Shear flow curve of HI-10/SAN filled with 30% maple, with a
comparison to GP-22 and HDPE filled melts ........................................................69
Figure 3.3. Shear flow curve of GP-22 filled with varying amounts of maple at
190°C. ....................................................................................................................70
xii
Figure 3.7. Shear stress of GP-22 filled with maple at 190°C. Linear regression
curve fit also plotted to allow for determination of trends.....................................72
Figure 3.4. Un-shifted results shown with a developed master curve for GP-22
filled with 30% maple. Required shifting factors are also shown. .......................70
Figure 3.5. Master curve for 30, 35 and 40% maple filled composites, with
regression lines indicating Carreau-Yasuda curve fits for actual shifted data.......71
Figure 3.6. Actual shift factors shown with Arrhenius curve fits and required
activation energy....................................................................................................71
Figure 3.8. Shear stress of GP-22 filled with 30% maple at varying temperature.
Linear regression curve fit also shown to facilitate trend determination...............72
Figure 3.9. Shear stress of HI-10/SAN filled with 30% maple. Linear regression
curve fit also plotted to allow for determination of trends.....................................73
Figure A.1. Measurement setup on balance...................................................................85
Figure A.2. Different types of extrudate folding ...........................................................85
Figure B.1. Distribution of particle heights ...................................................................93
Figure B.2. Kolmogorov-Smirnov fit of normal data ....................................................93
Figure B.3. Lognormal distribution of particle heights .................................................94
Figure B.4. Kolmogorov-Smirnov fit of transformed data ............................................94
13
Wood plastic composites (WPC) composed of wood and either a thermoplastic or
thermoset resin have existed since the early 1900’s (Clemons, 2002). However, the
development of these WPC in the United States did not really begin to gain momentum
until several decades ago. During the late 1990’s the production of WPC increased four-
fold and by 2001 the annual production was around 700 million tons (Li, 2004; Clemons,
2002). More recently, WPCs have found an expanding market in the residential building
industry, due to an increased amount of available applications. The most common WPC
formulations are comprised of a thermoplastic matrix filled with. The three most
common thermoplastics used by the WPC industry are polyethylene (PE), polypropylene
(PP) and polyvinylchloride (PVC).
CHAPTER 1 - INTRODUCTION
1.1 Background
In 1999, the three polymer resins of PE, PVC and PP resins accounted for
approximately 70%, 17%, 13%, respectively, of the total WPC production (Patterson,
2001). Each one of these resins has its own advantages and disadvantages when
combined with the wood filler. PE based WPC tend to have higher heat resistance and
are less expensive then comparable PVC formulations, while PVC based WPC offer
increased stain and paint ability (Patterson, 2001). However, one of the biggest
disadvantages of WPC, no matter which resin is used, is that they tend to be heavier than
the traditional timber products they replace.
Therefore, one of the major focuses within the WPC industry is reducing the
weight of the composites through the use of chemical foaming agents (Schut, 2001). As
WPC foaming production increases, manufacturers are expanding on the different types

14
Most WPC products are manufactured by using either a single or twin-screw
extruder. The extruder uses the pressure developed by the rotating screw flights to push
the molten mixture through a die. Once the extrudate exits the die, it is cooled in a water
spray bath and a shaped composite is formed. Most WPC are formulated with about 50
wt% wood flour, but this number can be as low as 10 wt% and as high as 70 wt%
(Kowalska, 2001). To this wood and polymer mixture, the manufacturer will add their
selected fillers, modifiers and additives to produce the desired final formulation.
Therefore, the importance of understanding the interactions of these individual
components within the extrudate melt and their effects on the overall melt behavior, is an
important area of research that needs more investigation (Shah, 2004).
of polymers used in their production. Some of the newest types of polymer resins used in
WPC products are the amorphous resins of polystyrene (PS), acrylonitrile-styrene-
butadiene (ABS), and styrene-acrylonitrile (SAN). These polymers lead to a stiffer
foamed WPC, but it is believed that is mainly due to a reduction in the amount of wood
fiber used in the composite (Schut, 2001).
1.2 Significance
Within the WPC community, most of the research is aimed at answering
questions related to the mechanical properties of the final product. While quantifying this
aspect of WPC behavior is important, little research has been done in relation to
understanding the melt properties. This poses a serious problem, since the choice of
correct formulation, process-ability of the formulation and extruder die designs are based
off an understanding of these flow properties. Since commercial WPC formulations

15
typically involve high wood loading amounts, and a variety of additives, lubricants and
modifiers, the ability to draw conclusions from other types of filled polymer systems is
very limited (Li, 2005). As the industry continues to grow, the need to better understand
the rheology of these systems will play an even more important role in the development
of new WPC products. By quantifying these properties correctly, the industry will be
able to increase production and develop the necessary products to meet the expected
growth.
Most previous work on WPC rheology has been conducted on a capillary die
rheometer (Li, 2004; Li, 2005; Guffey, 2002). The theory behind this method is well
developed and has already been proven useful for rheological studies of WPC and other
highly filled polymer systems. However, the use of an off-line capillary rheometer faces
some major drawbacks when testing WPC systems. Formulations comprised of ABS,
PVC and other heat sensitive polymers cannot easily be used since the melt is subjected
to extended periods of high temperatures. Secondly, the simulation of the actual flow
conditions seen in actual production is not accurately represented in off-line techniques.
Therefore, a better-suited rheometer for the measurement of rheological properties of the
melt is an on-line slit die rheometer. This rheometer uses a theory that is very similar to
the capillary rheometer to obtain the rheological data, but allows for a wider variety of
formulations to be analyzed.
1.3 Objectives
This research project investigates the rheological properties of wood-plastic
composite (WPC) melts by means of a slit die rheometer. The conventional capillary die

16
method presents a problem when working with thermally sensitive melts due to the
extended dell times at elevated temperatures. It is also known that the offline capillary
die method is subject to size effect problems with filled melts, and does not represent the
actual melt flow conditions seen during extrusion from the die. The slit die rheometer
overcomes these problems, as well as determines the shear viscosity, shear stress and
motor current of the melt. The specific objectives of this research are as follow:
1. Develop a technique to accurately measure the rheological properties of different
WPC melts using an in-line slit die.
2. Compare the HDPE/wood slit die shear viscosity values to published capillary die
results.
3. Established the effects of wood filler amount, particle size and species on the
shear stress and motor current in HDPE melts, and
4. Examine the changes in the rheological properties of ABS/maple melts, as the
wood filler percentage, melt temperature and the level of SAN is varied.

17
1.4 References
Clemons, C. “Wood plastic composites in the United States, the interfacing of two
industries.” Forest Products Journal, June 2002, Vol. 52, No. 6, pp. 10-18. Guffey, V.O. and Sabbagh, A.B. “PVC/Wood-Flour Composites Compatibilized with
Chlorinated Polyethylene.” Journal of Vinyl and Additive Technology, December 2002, Vol. 8, No. 4, pp. 259-263.
Kowalska, E. and Pelka, J. “Modification of Recyclates of Polyethylene and Poly(Vinyl
Chloride) with Scrap Paper Cellulose Fibres.” Polymer Recycling, Vol. 6, Nos. 2/3, 2001, pp 109-118.
Li, T.Q. and Wolcott, M.P. “Rheology of HDPE-wood composites. I. Steady state shear
and extensional flow.” Composites Part A: Applied science and manufacturing, Vol. 35, No. 3, April 2004, pp 303-311.
Li, T.Q. and Wolcott, M.P. “Rheology of wood plastics melt: 1. Capillary rheometry of
HDPE filled with maple.” Polymer Engineering Science, 2005. Patterson, J. “New opportunities with wood-flour-foamed PVC.” Journal of Vinyl and
Additive Technology, June 2001, Vol. 7, No 2, pp 138-141 Schut, J.H. “Foaming Expands Possibilities for Wood-Fiber Composites.” July 2001,
Plastics Technology, http://www.plasticstechnology.com/articles/200107fa2.html Shah, B.L. and Matuana, L.M. “Online measurement of rheological properties of
PVC/wood flour composites.” Journal of Vinyl and Additive Technology, September 2004, Vol. 10, No 3., pp. 121-128.
Smith, P.M. “U.S. woodfiber-plastic composite decking market.” In: Proc. Sixth
International Conference on Woodfiber- Plastic Composites. Forest Prod. Soc., Madison, WI. 2001, pp. 13-17.

18
In the last decade, wood-plastic composites (WPCs) have emerged as a viable
replacement to many traditional timber products used in the residential construction
industry. While most WPC research deals with the mechanical properties of these
products, little research has gone into understanding the flow mechanisms of WPC in
production. As the subsequent production of WPC has increased, the need to better
understand the rheological behavior of the melt has become an important concern, since
changes in the rheological properties can alter the overall product shape and mechanical
properties of the composite. In this work, the rheological properties of high-density
polyethylene (HDPE) filled with either maple or pine wood flour were studied with a
specially designed slit die. Melt viscosity was found to increase with wood filler content
and decrease with shear rate. Changes in the wood mesh size and species were
determined to have little effect on the viscosity of the melt. When these results were
compared to identical formulations run using standard capillary die techniques, the slit
die viscosity results were up to 62.5% lower. This difference may be attributed to
differences in processing conditions and die sizes between the two dies. Besides using
the slit die to determine the viscosity of the melt, the shear stress and extruder current
were also determined. Almost identical trends to the shear viscosity results were
observed in the shear stress and extruder motor. This information provides vital
information for the WPC manufacturer and allows for a better final product to be
produced.
CHAPTER 2 – HDPE/WOOD COMPOSITE RHEOLOGY
2.1 Abstract

19
The market for wood plastic composites (WPC) has continued to grow over the
past two decades with 700 million lbs. of WPCs being manufactured in 2001 (Mapleston,
2001). These materials are composed of organic filler with a polymer matrix. As WPCs
have become more accepted they have expanded into a wider variety of applications.
The most growth has occurred in the residential building market as composite deck
boards, siding and window moldings are being used as replacements to traditional timber
products.
2.2 Introduction
While these composites can be manufactured with a variety of thermoplastic
resins, the use of high-density polyethylene (HDPE) continues to dominate commercial
products (Clemons, 2002). A 50% wood filler amount is commonly used in HDPE-based
WPC (Li and Wolcott, 2005). These composites are defined by good mechanical
properties and lower material cost, due to the high percentage of wood filler (Kowalska
and Pelka, 2001). The wood filler adds strength and provides rigidity to the polymer
matrix, while improving processing, machining properties, and material costs.
To correctly design a formulation, the melt rheology of the composite must be
assessed. While undertaking rheological tests, the processor attempts to solve two
common extrusion problems. First, the amount of required empirical testing is reduced,
because the slit or capillary die used to determine the rheology can simulate die flow
conditions (Glomsaker et al., 1999). Secondly, the consequential modifications to the
original die design are reduced through greater understanding of melt rheology.
While most rheological studies of WPC formulations are conducted using off-line
capillary die rheometry (Li and Wolcott, 2004, 2005; Guffey and Sabbagh, 2002), the use

20
of on-line slit die rheometry to test the rheological properties of these materials avoids
some inherent disadvantages prevalent in the capillary die methods. Two major problems
are commonly encountered when using an off-line capillary rheometer. The first problem
is that formulations comprised of heat sensitive polymers and fillers cannot easily be
tested due to the extended dwell time at elevated temperatures required for off-line
techniques. Secondly, an off-line capillary rheometer does not represent the actual flow
conditions encountered by the melt as it is extruded from the die. While providing an
improved simulation of melt flow, an on-line rheometer simulates the particle migration
and orientation within the melt better than off-line techniques (Thorsteinsen, 2003).
To overcome WPCs testing problems in off-line capillary die rheometry, an on-
line slit die rheometer is used to quantify the important melt flow characteristics. This
will involve determining the viscosity, shear rate, and shear stress for a variety of
HDPE/wood composite blends. A technique will be developed to accurately measure the
rheological properties of different WPC formulations in the melt state. This technique
will then be used to compare the rheological values obtained for variety of HDPE/wood
composites using the slit die, to published values obtained from capillary die methods.
2.3 Literature Review
2.3.1 Slit Die Rheology
Slit dies have been used extensively to measure rheological properties of unfilled
polymer melts (Han 1971, 1974). Based on the unfilled polymeric systems Han
investigated, no difference appeared in exit pressure results between the slit die and
2wp hx
τ ∂ = ∂ (1)
21
capillary die results. When examining the viscosity flow curves for the melts, the results
obtained with slit and capillary die strongly correlated.
For accurate results using a slit die, a minimum of three pressure transducers are
required along the land length of the die. Knowing the pressure gradient along the
longitudinal length axis ( /p x−∂ ∂ ), the shear stress and shear viscosity can be obtained.
However, the equations for the slit die are more complicated than the capillary dies and
are based on rectangular Cartesian coordinates. A full derivation of these equations are
found elsewhere (Han 1974), but a brief synopsis is presented. Accordingly, the shear
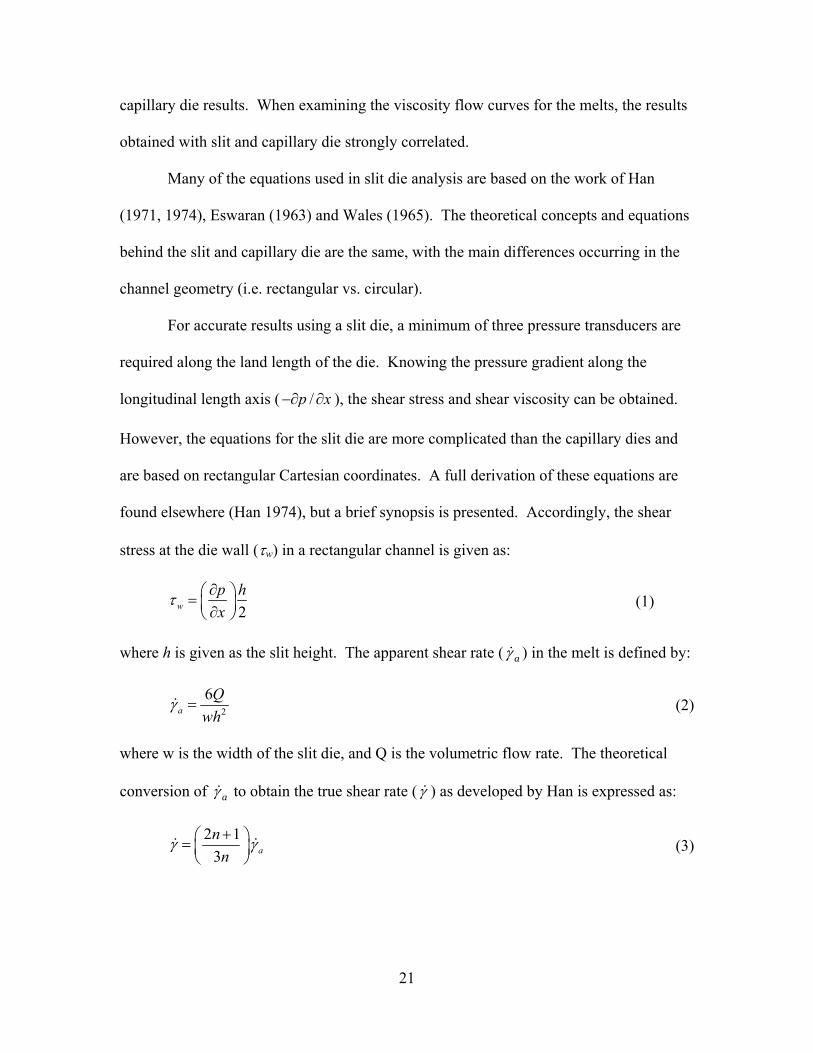
stress at the die wall (τw) in a rectangular channel is given as:
Many of the equations used in slit die analysis are based on the work of Han
(1971, 1974), Eswaran (1963) and Wales (1965). The theoretical concepts and equations
behind the slit and capillary die are the same, with the main differences occurring in the
channel geometry (i.e. rectangular vs. circular).
where h is given as the slit height. The apparent shear rate ( aγ& ) in the melt is defined by:
2
6a
Qwh
γ =& (2)
where w is the width of the slit die, and Q is the volumetric flow rate. The theoretical
conversion of aγ& to obtain the true shear rate (γ& ) as developed by Han is expressed as:
2 13 an
nγ γ+ =
& & (3)
22
where n is the Rabinowitsch correction factor (n= log logw d ad τ γ& ) for shear thinning melts
or a power law (n=1) for Newtonian melts. Note that this derivative is calculated by
testing at least two different shear rates for each formulation (Laun, 1983).
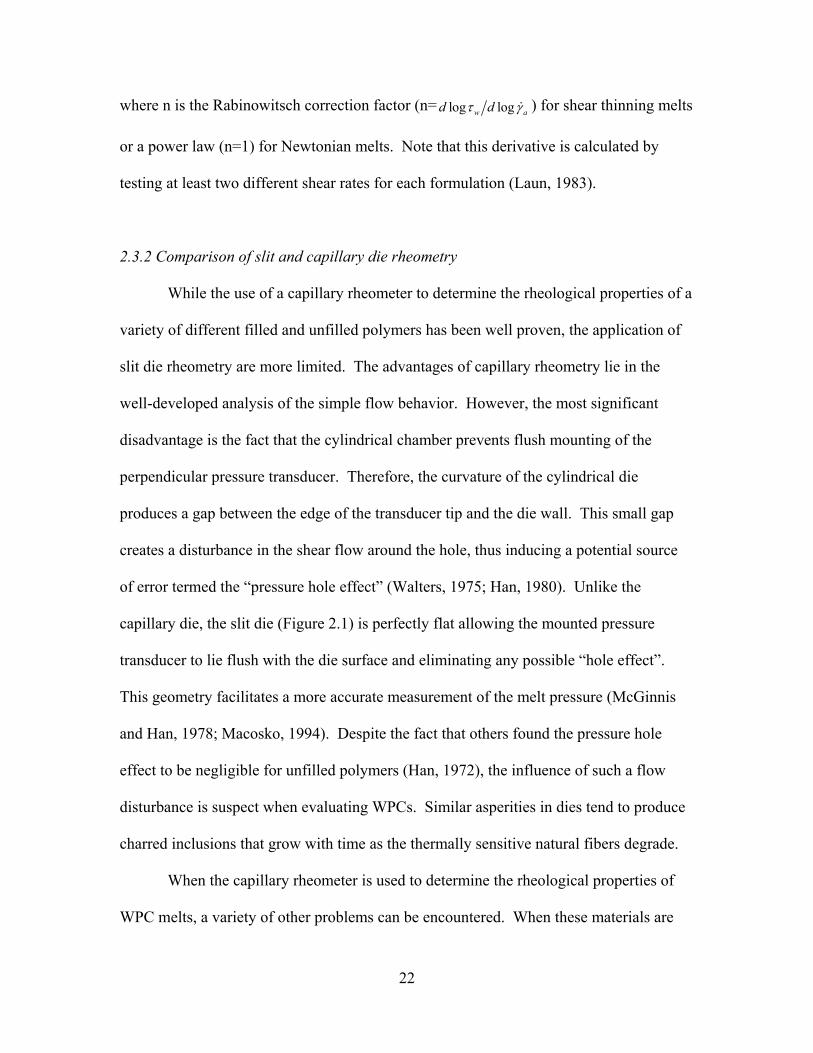
While the use of a capillary rheometer to determine the rheological properties of a
variety of different filled and unfilled polymers has been well proven, the application of
slit die rheometry are more limited. The advantages of capillary rheometry lie in the
well-developed analysis of the simple flow behavior. However, the most significant
disadvantage is the fact that the cylindrical chamber prevents flush mounting of the
perpendicular pressure transducer. Therefore, the curvature of the cylindrical die
produces a gap between the edge of the transducer tip and the die wall. This small gap
creates a disturbance in the shear flow around the hole, thus inducing a potential source
of error termed the “pressure hole effect” (Walters, 1975; Han, 1980). Unlike the
capillary die, the slit die (Figure 2.1) is perfectly flat allowing the mounted pressure
transducer to lie flush with the die surface and eliminating any possible “hole effect”.
This geometry facilitates a more accurate measurement of the melt pressure (McGinnis
and Han, 1978; Macosko, 1994). Despite the fact that others found the pressure hole
effect to be negligible for unfilled polymers (Han, 1972), the influence of such a flow
disturbance is suspect when evaluating WPCs. Similar asperities in dies tend to produce
charred inclusions that grow with time as the thermally sensitive natural fibers degrade.
2.3.2 Comparison of slit and capillary die rheometry
When the capillary rheometer is used to determine the rheological properties of
WPC melts, a variety of other problems can be encountered. When these materials are

23
used in a capillary die rheometer, the particle size of the wood filler is governed by the
exit hole size. This constraint limits the analysis to small particle sizing. In addition,
since wood fibers are anisometric (aspect ratio of ~10), the constrained flow of capillary
dies produce oriented material structures that may not exist in other configurations. The
large exit opening of the slit die geometry reduces some of the particle size problems. To
meet the continuum requirements assumed in design, the minimum dimension of the die
should be 40 times larger than the average filler particle size found in the melt.
Unlike traditional batch capillary rheometers where long soak times are required
to fully develop die flow, the slit die method is a continuous process. This attribute is
especially important for formulations where thermally sensitive matrix resins are blended
with thermally sensitive wood. Polyvinyl chloride exposures to high temperatures can
lead to a thermal instability within the resin and the release of toxic HCL (Penn, 1969).
In the case of acrylonitrile-butadiene-styrene (ABS), this extended temperature exposure
can lead to depolymerization, reducing both molecular weight and mechanical properties
of the final product (Tiganis et al., 2002).
Despite several positives of the slit die, there are some potential negatives to be
minimized during testing. Since the die is mounted directly onto the screw extruder,
there are many variables affecting material flow rate (i.e. screw speed, multiple barrel and
die temperature controllers, feed rate, etc.) that must be monitored. Also, the slit die must
be completely dismantled for cleaning after each run. This is especially important to
facilitate calibration of the pressure transducers at the beginning of each test (Macosko,
1994).

24
For the flow of the material within the slit die to be considered one-dimensional,
the slit must have a constant height-to-width ratio that is equal to or greater than 1:10
(Han, 1971). This condition satisfies the assumption that the flow in the slit is acting as a
set of infinite parallel plates, thereby allowing edge effects to be neglected (Han, 1976).
Based on the designed height of 5.0-mm and the requirements for flow that is free of
edge effects, the slit width was designed at 50.0-mm.
2.3.3 Slit Die Design
Another important aspect in the design of the slit die is the location of the
pressure transducers. Most importantly, the first transducer must provide sufficient
distance from the die entrance to fully develop flow. Han (1971) used flow birefringment
techniques to show that a minimum of 3-4 times the slit height is needed for this length.
For our slit die with a 5.0-mm slit height, a 20.0-mm minimum distance between the end
of the transition and the first transducer was required. To ensure a fully developed flow of
the highly filled melt, the first pressure transducer was placed 50.0-mm downstream from
the entrance of the slit. The remaining two transducers were located at 37.5-mm
intervals.
This slit die design was developed around the principles of continuum flow with a
maximum wood flour particle width of 0.0635-cm (40-mesh). If this requirement is not
satisfied, the melt cannot be considered homogenous, but instead it is considered a multi-
phase flow. To validate the continuum assumptions used in the die design, the particle
size of the dispersed wood filler was analyzed in-situ using a scanning electron
microscope (SEM) (Hitachi S-570).

25
The SEM method is preferred over a simple measurement of particle sizes
because the sieve analysis fails to consider important processing aspects. Since the sieve
analysis is completed before processing, it does not take into account what is happening
to the filler within the melt during processing. The processing steps found within
extrusion can have profound affects on the filler materials, such as, a breakage of the
fibers due to the rotating flights of the extruder screws. George et. al (1996) has shown
that PE filled with pineapple fiber has an increased amount of fiber breakage when the
shear rate is increased. When compared to the pre-extrusion length, the average length of
the pineapple fibers was reduced by 21.7% at a shear rate of 16.4s-1. Fiber breakage is
not the only change that affects the particle size. Wood filler amount within the melt will
also alter the size of the wood filler. Stark and Berger (1997) found that the high
pressures of WPC extrusion can cause the cells of wood flour to collapse. This collapse
leads to a reduction in the particle size.
To conduct the SEM measurements, a representative slit die extrudate containing
60% 40-mesh maple and 40% HDPE was randomly sampled and milled into two 5-mm
cubes. A diamond microtone was then used to surface the cubes on one face normal to
the flow direction. Each sample was sputtered with a 6.0-Å thick gold layer prior to
examining. A series of forty SEM pictures were acquired over the two samples using a
magnification of 490x. The magnification was selected to balance edge detection of the
wood particles and field of view. A total of 150 points were analyzed to determine the
particle heights at given points in the SEM picture. Since every picture was 1200 pixels
wide by 1500 pixels high, ten random x-y coordinates within these ranges were assigned
for each picture. These points were constant throughout the 15 randomly chosen

26
pictures. At each one of these x-y coordinates the height of the particle was measured
using image analysis software (UTHSCSA ImageTool). The same calibration length was
used for all of the pictures since the magnification of the images was constant throughout.
After measuring the particle height, it was determined that 136 points contained a
particle, while 14 points did not.
2.4 Materials
The rheometry was performed using HDPE filled with between 30 and 70 wt%
wood flour. The wood flour filler was commercially obtained (American Wood Fibers)
as either maple (Acer spp.) or pine (Pinus spp.) in the mesh sizes ranging from 40 to 100.
Prior to extrusion, the wood flour moisture content was reduced from 8.0% (as received)
to < 3.0%, in an open-ended extruder (Cincinnati Milicron TC 86) set at 190°C and a
screw speed of 25-rpm. The HDPE reactor flake (Equistar LB-0100-00, MFI = 0.1 g/10
min, MW=91.6 kg/mol) was used as received. All formulations were dry blended in 1.2-
m drum tumbler for 10-min. prior to extrusion to assure a proper dispersion of the
components. A complete listing of the formulations used in this research is found in
Table 2.1.
2.5 Methodology
2.5.1 Slit Die Setup
Following thorough cleaning, to remove damage remnants of material, the slit die
was mounted to a twin-screw conical counter rotating extruder (Cincinnati Milicron
CM35). Three pressure transducers (MPI MTJ07P7.5MSS, MPI MPJ07P5MSS, and
27
Dynisco TPT4636-7.5M-6/18) were mounted flush along the lower slit die wall (Han,
1974; Laun, 1983). Each transducer is shunt calibrated and data was digitally acquired
during the extrusion runs. Each of four die zones were equipped with separate band or
plate heaters and type J thermocouple that were attached to the control system of the
extruder. During extrusion runs, the temperatures of the die and the extruder zones were
controlled to the same temperature at ± 2.0-degrees.
2.5.2 Slit Die Measurements
Thorsteinsen et. al (2003) and Martin et. al (2003) observed that when the melt is
being extruded, the pressures vary during the initial startup phase of the extrusion where
data collection is unadvisable. This period may last between 2 and 20 minutes depending
on the system under study after which data is sampled at a rate of 1-Hz. The collected
data set is comprised of 15 readings for each of the three transducers. This process is
repeated twice over the next two minutes. During the second sampling period, a sixty-
second physical sample is collected by cutting and loosely folding a timed section of
extrudate at the die exit. This method is similar to one used by others (Thorsteinsen et.
al. 2003). The physical sample is used to compute the mass flow rate of the extruder
(Chastagner, 2005a). This parameter was converted to the volumetric flow rate (Q) using
the density of the extrudate as determined using ASTM D-2395.
2.6 Results
2.6.1 Particle Size Analysis
The distribution of particle heights (Figure 2.2) measured in the extrusion cross-
section follows a lognormal distribution type as verified using a Kolmogorov-Smirnov
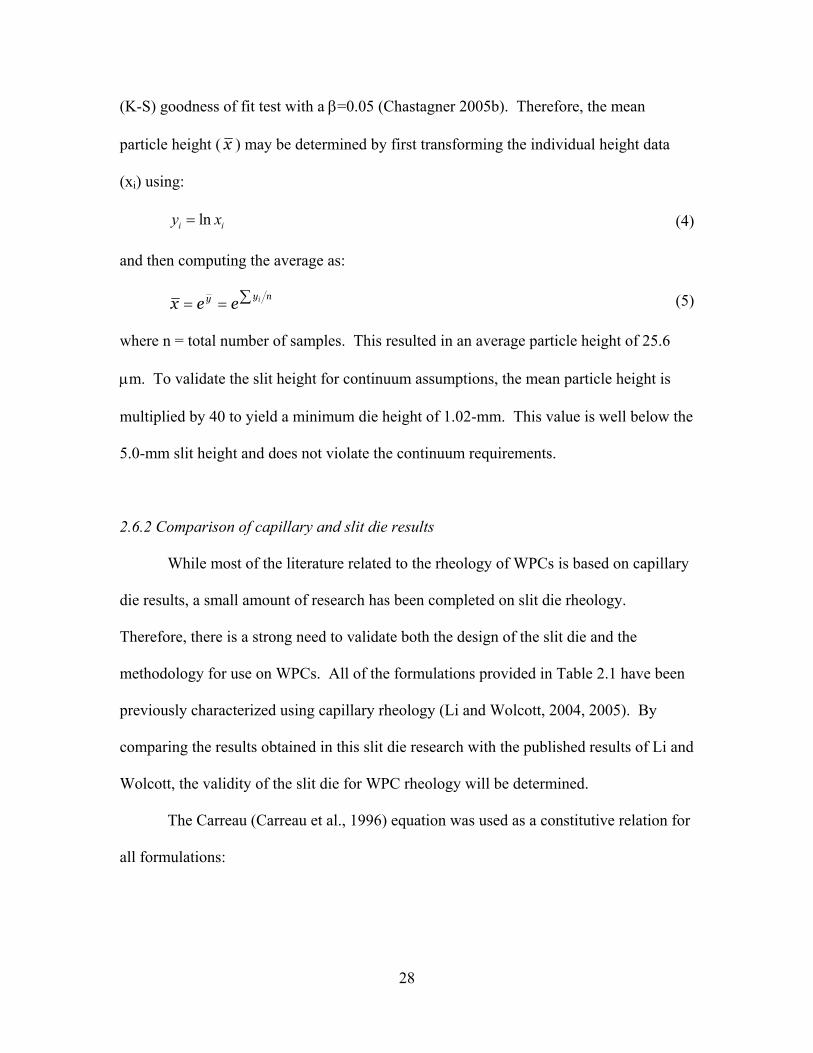
where n = total number of samples. This resulted in an average particle height of 25.6
µm. To validate the slit height for continuum assumptions, the mean particle height is
multiplied by 40 to yield a minimum die height of 1.02-mm. This value is well below the
5.0-mm slit height and does not violate the continuum requirements.
28
(K-S) goodness of fit test with a β=0.05 (Chastagner 2005b). Therefore, the mean
particle height ( x ) may be determined by first transforming the individual height data
(xi) using:
lni iy x= (4)
and then computing the average as:
nyy ieex ∑== (5)
2.6.2 Comparison of capillary and slit die results
While most of the literature related to the rheology of WPCs is based on capillary
die results, a small amount of research has been completed on slit die rheology.
Therefore, there is a strong need to validate both the design of the slit die and the
methodology for use on WPCs. All of the formulations provided in Table 2.1 have been
previously characterized using capillary rheology (Li and Wolcott, 2004, 2005). By
comparing the results obtained in this slit die research with the published results of Li and
Wolcott, the validity of the slit die for WPC rheology will be determined.
The Carreau (Carreau et al., 1996) equation was used as a constitutive relation for
all formulations:

where n and λ are curve fitting parameters, and η∞ and ηo are the viscosity at infinite and
zero shear rate, respectively. While a vast majority of the shear viscosity data appears to
be linear when plotted on a log-log plot, if a complete shear rate spectrum was examined,
it is expected that the data would not follow this trend. In most polymeric systems, a flat
plateau in viscosity is observed at lower shear rates. Then the viscosity reduces
downward into a power-law fitting region. Afterwards, the shear rate increases and the
slope levels off again. Li and Wolcott (2004) observed this change in viscosity when they
examined WPC filled melts in a capillary rheometer. Therefore, the Carreau fit was
chosen because it can predict the leveling off of the viscosity at both the high and low
shear rate values. The power law cannot predict the results accurately since it is limited to
the linear viscosity results. The Carreau fit also allows for the determination of a
predicted ηo value.
29
( )1
20 0 2
1
1n
η η ηη η η
λγ
∞−
∞
−≈ ≈
− + &
(7)
A comparison of the power law and Carreau curve fits are shown in 2.3. Both fits
approximated the linear results of the 70% maple formulation equally well. However, the
Carreau model captured the slight nonlinearity of the 30% maple formulations with better
accuracy. The appearance is validated by the R2 values for the power law and Carreau
model of 0.787 and 0.837, respectively. In comparison, for the 70% formulation, the R2
values are 0.857 for the power law and 0.858 for the Carreau model. Therefore, not only
does the Carreau model give a better fit for the data over the entire shear rate range, but it
also provides a better fit for the linear-like regions of these two formulations as well.

30
Based on this, the Carreau model will be used throughout this analysis. The
Carreau parameters for all formulations are presented in Table 2.2. Figure 2.3 shows a
typical flow curve collected from the slit die and the Carreau curve fitting applied to that
data. Because the shear rate of the melt cannot be absolutely controlled with this slit die
setup, most of the points tend to congregate around a general shear rate value. This
figure, along with other melt flow curves, contains three separate runs of each
formulation. However, in the interest of clarity, only the Carreau curve fit will be plotted
for all of the figures.
2.6.3 Shear Viscosity
A predominate shear thinning behavior is observed for both the pine and maple
formulations tested. Other researchers have also observed this behavior when conducting
research on WPCs (Li and Wolcott, 2004, 2005; Guffey and Sabbagh, 2002; Shah and
Matuana, 2004). However, the degree of shear thinning appears to vary depending on the
composition of the formulation.
A variety of formulations using 40-mesh maple in HDPE-wood formulations were
examined and are shown in Figure 2.4. The wood filler content varied from 30 to 70%
wood content. As the percentage of wood filler in the melt increased, the viscosity of the
melt increased and can be attributed to an increased bridging between the wood particles
contained within the melt. This behavior is comparable with results found by other
authors for both HDPE-wood systems (Li and Wolcott, 2005) and other highly filled
plastics (Vlachopoulos and Strutt, 2003; Han, 1974b). It is also important to note that
with the lower wood content levels (30%) there is a plateau behavior occurring within the
31
viscosity results. This behavior can be attributed to the orientation of the suspended
wood filler within the melt and the shear rate of the test. At the shear rates tested, the
higher wood filler percentage melts already begin to exhibit shear thinning behavior.
This effect is due to the concentration of macromolecular entanglements within the melt
decreasing (Mayadunne et. al, 1996). At the decreased wood filler amounts, with lower
shear rates, the molecular segments are well entangled and the melt is exhibiting a
Newtonian behavior and is still within the level plateau region.
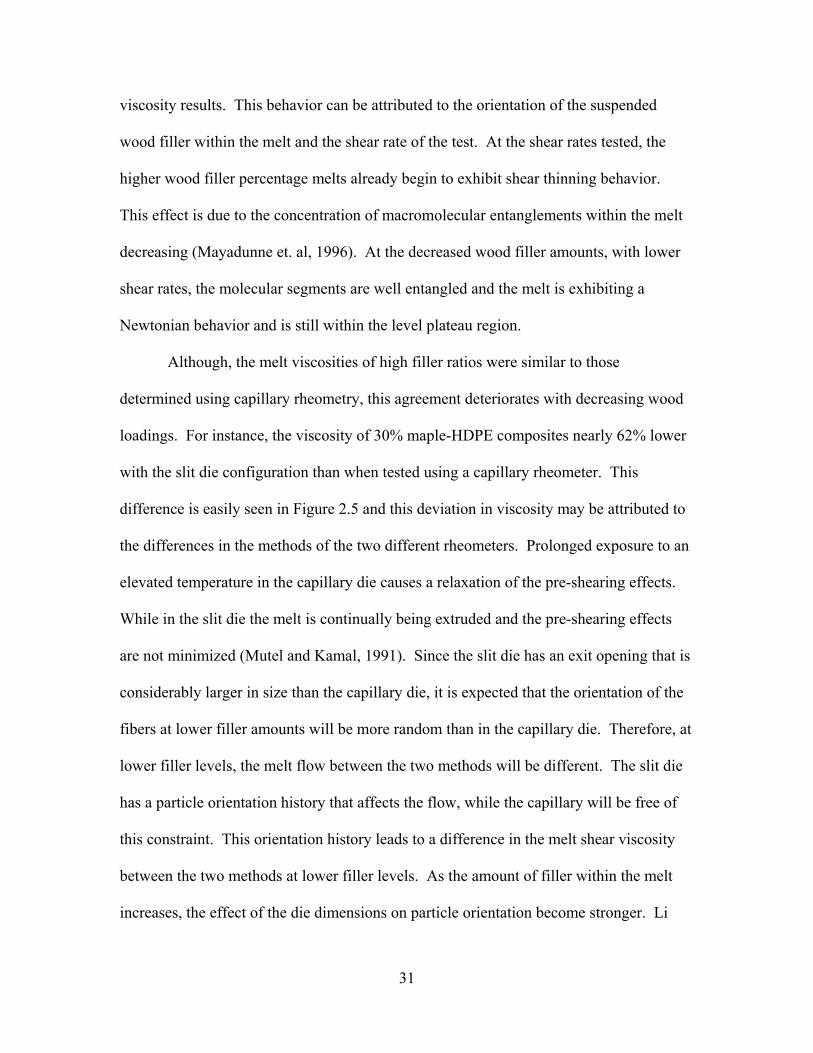
Although, the melt viscosities of high filler ratios were similar to those
determined using capillary rheometry, this agreement deteriorates with decreasing wood
loadings. For instance, the viscosity of 30% maple-HDPE composites nearly 62% lower
with the slit die configuration than when tested using a capillary rheometer. This
difference is easily seen in Figure 2.5 and this deviation in viscosity may be attributed to
the differences in the methods of the two different rheometers. Prolonged exposure to an
elevated temperature in the capillary die causes a relaxation of the pre-shearing effects.
While in the slit die the melt is continually being extruded and the pre-shearing effects
are not minimized (Mutel and Kamal, 1991). Since the slit die has an exit opening that is
considerably larger in size than the capillary die, it is expected that the orientation of the
fibers at lower filler amounts will be more random than in the capillary die. Therefore, at
lower filler levels, the melt flow between the two methods will be different. The slit die
has a particle orientation history that affects the flow, while the capillary will be free of
this constraint. This orientation history leads to a difference in the melt shear viscosity
between the two methods at lower filler levels. As the amount of filler within the melt
increases, the effect of the die dimensions on particle orientation become stronger. Li

32
It is common for different rheometers to produce different shear viscosities when
geometric differences exist in the flow channel (Glomsaker et al., 1999). It is also
important to note that when the preparing the samples for the capillary die results by Li
and Wolcott (2005), the materials were pre-compounded, a step not found in the slit die
tests. Therefore, the shear flow history of the two samples is different, potentially
leading to a difference in the morphology of the melts (Han et al., 1995). Using two
different rheometers, Han showed that for single-phase flows, there is overlap between
the shear viscosity results. However, for multiphase flows, the melt morphology changes
can greatly alter the shear viscosity results. This observed deviation in the slit and
capillary die results may indicate that these melts are multiphase flows. Neither this
work nor the capillary results achieved by Li and Wolcott accounted for this type of flow,
therefore further work is required to determine if this is the reason for the deviation
between the slit and capillary die results.
and Wolcott (2004) have indicated that as the filler level reaches 40 to 60%, maple based
melts have an increasing dependence on die geometry. In the case of higher filler levels,
the random orientation of the particles within the melt will be decreased and the
deviations in the shear viscosity between the two different will be reduced.
Besides a change in viscosity due to different filler percentages, a weak
dependence on the mesh size of the wood filler was found. Figure 2.6 shows that for a
40% maple loading, an increased maple mesh size decreased the overall melt viscosity
slightly. This phenomenon results from a decreased bridging in the smaller particle size,
allowing for slippage of nearby particles as the melt is sheared. Similar results were also
found in capillary die rheology conducted by Li and Wolcott (2005).

33
Upon caparison to the capillary rheology (Li and Wolcott 2004), it appears that
the slit die similar trends in the case of maple-based composites. However, the results of
the pine formulations are in stronger disagreement. Li and Wolcott’s work indicated that
there was no change in the melt viscosity of the 40-mesh pine based composite, when the
filler percentage changed from 40% to 60% (Figure 2.7). Identical formulations
evaluated with the slit die showed a difference in melt viscosity with pine content. Using
the slit die, the results from both the maple and pine indicate that an increase in the wood
filler percentage produces an increase in the shear viscosity of the melt. The
inconsistency with the previous capillary rheology may result from the differences in
thermal histories and size effects. Pine species are known to produce substantial levels of
natural stearates with chemistries similar to some lubricants. Increased soak times or
extrusion temperatures may result in increase migration of the components to the particle
surface. Li and Wolcott (2004) also indicated that at a 40% filler level, the shear flow
curves of the pine-based melt were dependent on the die dimensions. Since there is a
difference in the dimensions of the slit die and the capillary die, there may be differences
in the shear viscosity results. However, both of these causes are purely speculative and
require additional research.
Li and Wolcott (2004) reported differences in viscosity between pine and maple
wood flours in HDPE/wood composites. The results obtained by the slit die method
indicate that both maple and pine exhibit different viscosities with changes in wood filler
percentage. Both wood species follow the same trend, in that the 60% filler level
produces a higher viscosity than the 40% filler level.
34
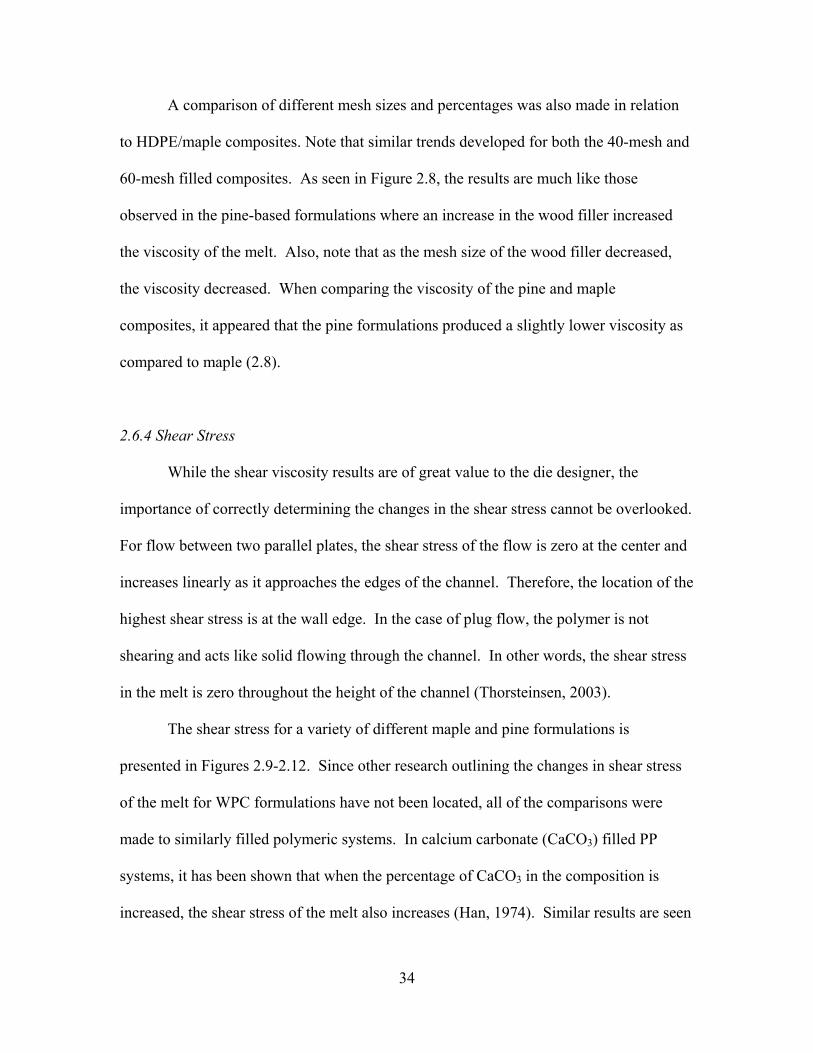
A comparison of different mesh sizes and percentages was also made in relation
to HDPE/maple composites. Note that similar trends developed for both the 40-mesh and
60-mesh filled composites. As seen in Figure 2.8, the results are much like those
observed in the pine-based formulations where an increase in the wood filler increased
the viscosity of the melt. Also, note that as the mesh size of the wood filler decreased,
the viscosity decreased. When comparing the viscosity of the pine and maple
composites, it appeared that the pine formulations produced a slightly lower viscosity as
compared to maple (2.8).
2.6.4 Shear Stress
While the shear viscosity results are of great value to the die designer, the
importance of correctly determining the changes in the shear stress cannot be overlooked.
For flow between two parallel plates, the shear stress of the flow is zero at the center and
increases linearly as it approaches the edges of the channel. Therefore, the location of the
highest shear stress is at the wall edge. In the case of plug flow, the polymer is not
shearing and acts like solid flowing through the channel. In other words, the shear stress
in the melt is zero throughout the height of the channel (Thorsteinsen, 2003).
The shear stress for a variety of different maple and pine formulations is
presented in Figures 2.9-2.12. Since other research outlining the changes in shear stress
of the melt for WPC formulations have not been located, all of the comparisons were
made to similarly filled polymeric systems. In calcium carbonate (CaCO3) filled PP
systems, it has been shown that when the percentage of CaCO3 in the composition is
increased, the shear stress of the melt also increases (Han, 1974). Similar results are seen

35
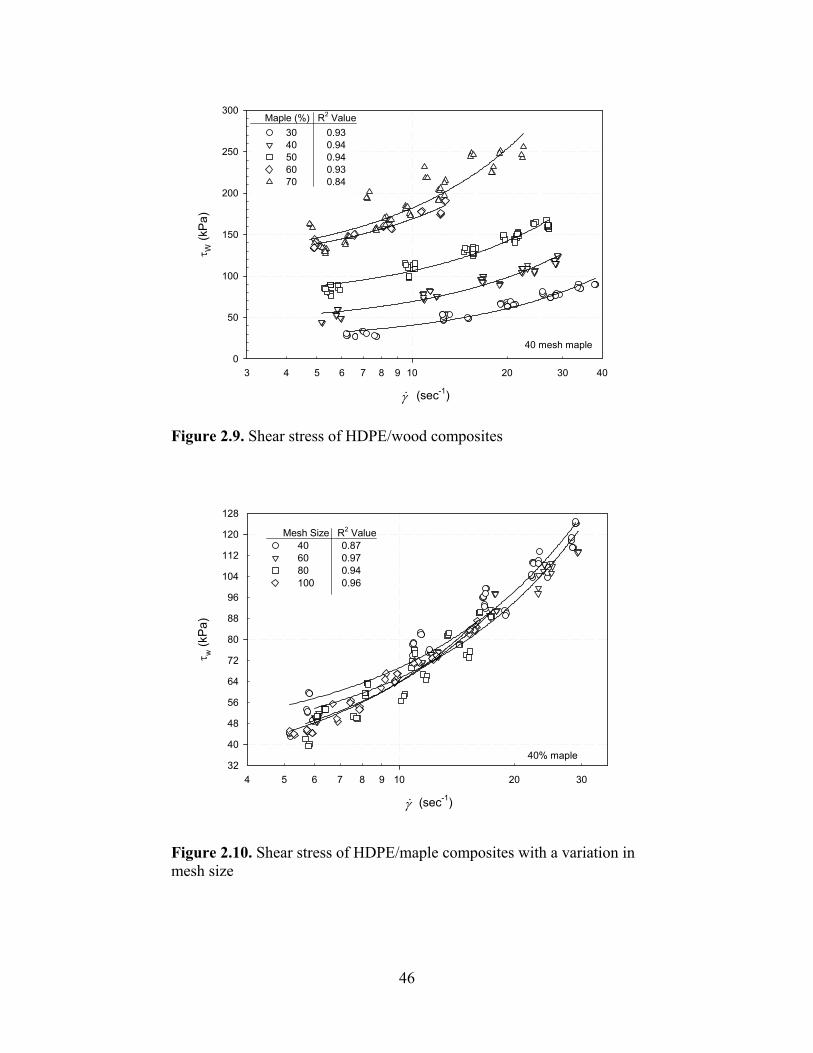
The change in shear stress between different particle sizes of maple is not as
pronounced as the change in wood filler percentage (Figure 2.10). While at first glance it
appears that there is a weak trend toward an increased shear stress with decreased mesh
sizes, this conclusion cannot be made. The data for the 40-mesh size on average has the
highest shear stress values, but the three other mesh sizes reveal little difference.
Therefore, it would be premature to draw any conclusions that an increase in shear stress
is seen as the mesh size decreases.
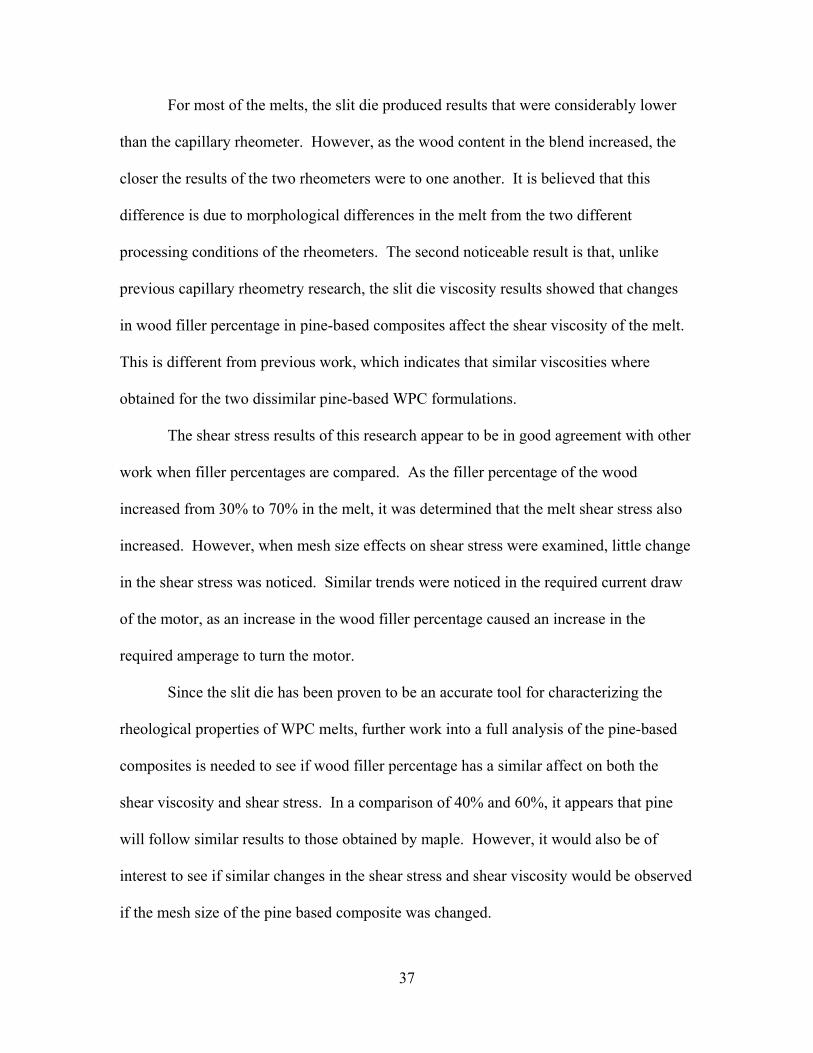
in Figure 2.9 with the maple formulations. As the maple filler percentage increases from
30 to 70%, the shear stress of the melt increases throughout the entire shear rate
spectrum. At both the 60% and 70% wood loadings, the shear stress values deviated
slightly from what was expected. This deviation may be due to the problems encountered
with the feeding of the material.
It is also important to examine any differences between the shear stress of maple
and pine based melts. Both pine and maple, while having different interfacial
interactions with the plastic (Li and Wolcott 2004), produce very similar shear stress
trends. In Figures 2.9-2.12 differences in the shear stress of these pine and maple based
WPCs are shown. In both species, shear stress increases with wood content. The 40-
mesh maple formulations showed a 136% increase at lower shear rates, and a 142%
increase at higher shear rates when the wood level increased from 40 to 60%. Similar
results were obtained in the pine formulations when filler content changed from 40 to
60%. In this case, a 78% increase in shear stress was observed at lower shear rates and
80% increase was observed at the highest shear rate. Similarly, when the particle size was
increased from 40 to 60-mesh in the pine formulation, the shear stress of the melt

Changes in the current draw indicate total energy required to compound and flow
the composite melt in the extruder. Differences can easily be seen in Figure 2.13 from 30
to 70% of 40-mesh maple. Overall, the melt viscosity increased with increases in the
percentage of wood flour. Some of the deviations within the motor current results may
be attributed to the resolution of the display as it only displayed 1.0 amp changes. The
increased current indicates increased viscosity during the combined blending and flow
stages of the extrusion process. This conclusion was compared against the different mesh
size viscosity results of Figure 2.6. As expected, the shear viscosity results also indicated
an increase in viscosity with a decrease in mesh size along with the increases current
draw (Figure 2.14).
36
increased by a maximum of 98 percent. This would indicate that the biggest influence on
shear stress is not the mesh size, but the wood filler percentage in the WPC.
2.6.5. Extruder Motor Current
2.7 Conclusion
While little research has been published in relation to the WPC rheology, the
importance of understanding the melt flow properties is very important. Therefore, this
research was two-fold. First, to prove that the designed slit die produced reasonable flow
properties for WPCs and, secondly, to show that results were similar to findings in the
literature. In examining the results obtained in this research, distinct changes where
noticed in the shear viscosity of the melts when the formulation was run on a slit die
versus capillary rheometer.
37
For most of the melts, the slit die produced results that were considerably lower
than the capillary rheometer. However, as the wood content in the blend increased, the
closer the results of the two rheometers were to one another. It is believed that this
difference is due to morphological differences in the melt from the two different
processing conditions of the rheometers. The second noticeable result is that, unlike
previous capillary rheometry research, the slit die viscosity results showed that changes
in wood filler percentage in pine-based composites affect the shear viscosity of the melt.
This is different from previous work, which indicates that similar viscosities where
obtained for the two dissimilar pine-based WPC formulations.
The shear stress results of this research appear to be in good agreement with other
work when filler percentages are compared. As the filler percentage of the wood
increased from 30% to 70% in the melt, it was determined that the melt shear stress also
increased. However, when mesh size effects on shear stress were examined, little change
in the shear stress was noticed. Similar trends were noticed in the required current draw
of the motor, as an increase in the wood filler percentage caused an increase in the
required amperage to turn the motor.
Since the slit die has been proven to be an accurate tool for characterizing the
rheological properties of WPC melts, further work into a full analysis of the pine-based
composites is needed to see if wood filler percentage has a similar affect on both the
shear viscosity and shear stress. In a comparison of 40% and 60%, it appears that pine
will follow similar results to those obtained by maple. However, it would also be of
interest to see if similar changes in the shear stress and shear viscosity would be observed
if the mesh size of the pine based composite was changed.

38
Since a variety of different polymers are used in the manufacturing of WPC, it is
of great interest to see if similar characterizations of the rheological properties of these
polymers can be achieved. Therefore, further work into the analysis of these polymers
melts using this slit die rheometer will be attempted.

39
Clemons, C. “Wood plastic composites in the United States, the interfacing of two industries.” Forest Products Journal, June 2002, vol. 52, no. 6, pp. 10-18
2.8 References
Carreau, P.J, De Kee, D.C.R., Chabra, R.P. “Rheology of Polymeric Systems: Principles and Applications.” Hanser/Gardner, Cincinnati, OH, 1996
Chastagner, M.W. “Appendix A – Determination of wood plastic composite density.”
Washington State University, Masters Thesis, July 2005a. Chastagner, M.W. “Appendix B – Particle size analysis.” Washington State University,
Masters Thesis, July 2005b.
George, J., Janardhan, R., Anand, J.S., Bhagawan, S.S., and Thomas, S. Melt rheological
behavior of short pineapple fibre reinforced low density polyethylene composites. Polymer. Vol. 37, No. 24, 1996, pp5421-5431
Glomsaker, T., Hinrichsen, E.L., Larsen, A. and Thorsteinsen, P. “Rheological properties
of suspension poly (vinyl chloride) formulations in extrusion dies.” Plastics, Rubber and Composites. Vol. 28, No. 4, 1999. pp. 145-151
Guffey, V.O. and Sabbagh, A.B. “PVC/Wood-Flour Composites Compatibilized With
Chlorinated Polyethylene.” Journal of Vinyl and Additive Technology. Dec. 2002. Vol. 8, No. 4, pp. 259-263.
Han, C.D. On intrinsic errors in pressure-hole measurements in flow of polymer melts.
AIChE, Jan 1972, Vol. 18, No. 1. pp 116-121 Han, C.D. and Charles, M. “Measurement of Axial Pressure Distribution of Molten
Polymers in Flow through a Rectangular Duct.” Transactions of the Society of Rheology. Vol. 15 No. 1. 1971, pp 147-161
Han, C.D. “Measurement of the rheological properties of polymer melts with slit
rheometer. I. HomoPolymer Systems.” Journal of Applied Poly. Science 1971, vol. 15, pp. 2567-2577
Han, C.D. “On slit- and capillary-die rheometry.” Transactions of the Society of
Rheology 1974, vol. 18.1, pp.163-190 Han, C.D. “Rheological Properties of Calcium Carbonate-Filled Polypropylene Melts.”
Journal of Applied Polymer Science 1974b, vol. 18, pp 821-829 Han, C.D. Rheology in Polymer Processing. Academic Press. New York, New York.
1976

40
Li, T.Q. and Wolcott, M.P. “Rheology of wood plastics melt: 1. Capillary rheometry of HDPE filled with maple.” Polymer Engineering Science, In Press.
Han, J.H., Choi-Feng, C., Li D., Han, C.D. “Effect of Flow Geometry on the Rheology of Dispersed Two-phase Blends of Polystyrene and Poly(methyl methacrylate). Polymer. Vol. 36, No. 12, June 1995, pp. 2451-2462
Kowalska, E. and Pelka, J. “Modification of Recyclates of Polyethylene and Poly(Vinyl
Chloride) with Scrap Paper Cellulose Fibres.” Polymer Recycling, Vol. 6, Nos. 2/3, 2001, pp 109-118.
Laun, H.M. “Polymer melt rheology with a slit die.” Rheological Acta v.22 (1983), pp.
171-185
Li, T.Q. and Wolcott, M.P. “Rheology of HDPE-wood composites. I. Steady state shear
and extensional flow.” Composites Part A: Applied science and manufacturing. 2004, pp. 303-311
Macosko, C.W. Rheology Principles Measurements and Applications. New York, New
York. VCH, 1994 Mapleston, P. “It’s one hot market for profile extruders.” Modern Plastics, June 2001,
Vol. 78, No. 6 pp. 49-52 Martin, O., Averous, L. and Delle Valle, G. “In-line determination of plasticized wheat
starch viscoelestic behavior: impact of processing.” Carbohydrate Polymers. Vol. 53. 2003, pp. 169-182
Mayadunne, A., Bhattacharya, S.N., and Kosier, E. Rheology of concentrated
suspensions of polymer melts filled with irregularly shaped particles. Plastics, Rubber and Composites. Vol. 25, No. 3, 1996. pp. 128-137
McGinnis, F.H. and Han, C.D. “Principles and Applications of the Han Slit/Capillary
Rheometer.” Institution of Mechanical Engineers, Conference Proceedings. 1978, pp 227-230
Mutel, A.T. and Kamal, M.R. Rheological behavior and fiber orientation in slit flow of
fiber reinforced thermoplastics. Polymer Composites. Vol. 12, No. 3, June 1991. pp. 137-145
Penn, W.S. PVC Technology. Wiley Interscience, NY, NY. 1969 3rd edition. Pg 177-178 Shah, B.L. and Matuana, L.M. “Online measurement of rheological properties of
PVC/wood flour composites.” Journal of Vinyl and Additive Technology 2004, Vol. 10, No 3., pp. 121-128

University of Texas Health Science Center at San Antonio. UTHSCSA ImageTool Version 3. Feb. 2002
41
Stark, N. and Berge, M.J. Effect of species and particle size on properties of wood-flour-
filled polypropylene composites. Proceedings: Functional Fillers for Thermoplastics and Thermosets. Dec, 1997.
Tiganis, B.E., Burn, L.S., Davis, P. and Hill, A.J. Thermal degradation of acrylonitrile-
butadiene-styrene (ABS) blends. Polymer Degradation and Stability 2002. Vol. 76 pp. 425-434.
Thorsteinsen, P., Hinrichsen, E.L. and Glomsaker, T. “A Dual Slit In-Line Die for
Measuring the Flow Properties of S-PVC Formulations. Journal of Vinyl & Additive Technology. December 2003, Vol. 9, No. 4. pp. 188-197
Vlachopoulos, J. and Strutt, D. “The Role of Rheology in Polymer Extrusion.” New
Technology for Extrusion Conference. Milan, Italy. Nov. 20-21, 2003 Walters, K. Rheometry. John Wiley and Sons. New York, New York. 1975. pp 77

42
2.9 Figures
Figure 2.1. Top and end view of slit die schematic
Figure 2.2. Particle height distribution
Particle height (microns)
0 10 20 30 40 50 60 70 80 90 100110120130140150160 170 180 190 200
Freq
uenc
y
02468
1012141618202224262830323436

(sec-1)
4 5 6 7 8 9 20 30 40 5010
η (k
Pa-
s)
2
3
4
56789
20
30
40
10
ExperimentalPower LawCarreauExperimental
Power Law - R2 = 0.888Carreau - R2= 0.915
30% 40 mesh maple
γ&
Power Law - R2 = 0.909Carreau - R2 = 0.909
70% 40 mesh maple
43
Figure 2.3. Carreau and power law curve fits for 30% 40-mesh maple and 70% 40-mesh maple formulations
(sec-1)
4 5 6 7 8 9 20 30 4010
η (k
Pa-
s)
2
3
4
5
6789
20
30
10
3040506070
40 mesh maple
γ&
Maple (%)
Figure. 2.4. Shear viscosity results for 30%-70% HDPE/wood composites

(sec-1)
4 6 8 20 4010
η (k
Pa-
s)
2
4
6
8
20
40
10
γ&
Maple (%) Slit Capillary3040506070
44
Figure. 2.5. Shear viscosity results for a 40-mesh maple based WPC
(sec-1)
5 6 7 8 9 15 20 25 3010
η (k
Pa-
s)
3
4
5
6
7
8
9
406080100
40% maple
γ&
Mesh
Figure. 2.6. Shear viscosity results for 40, 60, 80 and 100-mesh maple composites

(sec-1)
5 6 7 8 9 20 30 40 50 60 70 80 9010
η (k
Pa-
s)
2
3
4
56789
20
30
40
10
Capillary
Slit
Maple 40 60Pine 40 60
Maple 40 60Pine 40 60
Method Species Filler (%) Symbol
40 mesh
γ&
45
Figure. 2.7. Comparison of capillary die and slit die rheometry results
(sec-1)
4 5 6 7 8 9 20 3010
η (k
Pa-
s)
4
5
6
789
20
30
10
γ&
Maple
Pine
40 40 6060 40 6040 40 6060 40 60
Species Filler Mesh Symbol (%) Size
Figure. 2.8. Comparison of HDPE/wood composite blends viscosity results
(sec-1)
4 5 6 7 8 9 20 3010
τ w (k
Pa)
32
48
56
64
72
88
96
104
112
128
40
80
120 40 0.87 60 0.97 80 0.94 100 0.96
40% maple
γ&
Mesh Size R2 Value
(sec-1)
3 4 5 6 7 8 9 20 30 4010
τ W (k
Pa)
0
50
100
150
200
250
300
30 0.93 40 0.94 50 0.9460 0.9370 0.84
40 mesh maple
γ&
Maple (%) R2 Value
46
Figure 2.9. Shear stress of HDPE/wood composites
Figure 2.10. Shear stress of HDPE/maple composites with a variation in mesh size

(sec-1)
4 5 6 7 8 9 20 30 4010
τ w (k
Pa)
40
50
60
70
8090
200
300
100
γ&
Maple (%) Mesh R2 Value40% 40 R2 = 0.94 60 R2 = 0.9660% 40 R2 = 0.93 60 R2 = 0.94
(sec-1)
2 3 4 5 6 7 8 9 20 3010
τ w (k
Pa)
30
50
70
90
110
130
150
170
190
20
40
60
80
100
120
140
160
180
200
40% 60 0.9440% 40 0.9260% 60 0.8560% 40 0.97
γ&
Pine (%) Mesh R2 Value
47
Figure 2.11. Shear stress of pine based wood plastic composites
Figure 2.12. Shear stress of maple based wood plastic composites

(sec-1)
4 5 6 7 8 9 20 30 4010
I (A
mp)
6
8
10
12
14
16
30 0.8840 0.8650 0.6760 0.8670 0.45
40 mesh maple
γ&
Wood (%) R2 Value
48
Figure 2.13. Changes in extruder motor current due to melt formulation changes. Linear regression curve fits shown for trend deciphering
(sec-1)
5 6 7 8 9 20 3010
I (A
mps
)
7
8
9
10
11
12
13
14
15
40 0.86 60 0.8880 0.79100 0.85
40% Maple
γ&
Mesh Size R2 Value
Figure 2.14. Effect of maple mesh size on the current draw of the extruder motor

Formulations n η0 (kPa-s) λ30(40M)70(PE) 0.254 4.48 0.05740(40M)60(PE) 0.379 10.88 0.16650(40M)50(PE) 0.381 25.96 0.39060(40M)40(PE) 0.323 109.66 1.67670(40M)30(PE) 0.422 167.01 4.45240(60M)60(PE) 0.543 18.25 0.91960(60M)40(PE) 0.389 83.31 1.85440(40P)60(PE) 0.602 16.49 0.95060(40P)40(PE) 0.413 94.28 2.64240(60P)60(PE) 0.466 8.70 0.16160(60P)40(PE) 0.567 34.02 0.87940(80M)60(PE) 0.400 9.44 0.15440(100M)60(PE) 0.695 14.38 1.206
49
2.10 Tables
Table 2.1. Material formulations
Table 2.2. Carreau curve fit values
Formulations n η0 (kPa-s) λ30(40M)70(PE) 0.254 4.48 0.05740(40M)60(PE) 0.379 10.88 0.16650(40M)50(PE) 0.381 25.96 0.39060(40M)40(PE) 0.323 109.66 1.67670(40M)30(PE) 0.422 167.01 4.45240(60M)60(PE) 0.543 18.25 0.91960(60M)40(PE) 0.389 83.31 1.85440(40P)60(PE) 0.602 16.49 0.95060(40P)40(PE) 0.413 94.28 2.64240(60P)60(PE) 0.466 8.70 0.16160(60P)40(PE) 0.567 34.02 0.87940(80M)60(PE) 0.400 9.44 0.15440(100M)60(PE) 0.695 14.38 1.206
Table 2.3 Carreau-Yasuda Values

50
While the use of wood plastic composite (WPC) materials in a variety of
residential building applications has continued to increase, the amount of rheological
research on these materials has been has not. Most of the research into the rheology of
these materials has been concentrated on the use of polyolefin-based resins as the matrix.
However, the use of acrylonitrile-butadiene-styrene (ABS) resin is increasing, as
producers are looking to exploit its excellent mechanical properties. Using a rheological
slit die, the shear viscosity and shear stress of ABS filled with 40-mesh maple wood flour
was studied. The results indicate that as the amount of wood filler or temperature of the
melt increased, the viscosity of the melt decreased throughout the entire shear rate range
investigated. From these viscosity results, a single master curve was developed that
allows for theoretical viscosity values to be determined at higher shear rates. Applying
an Arrhenius curve fit to the shifting factors, the activation energy of the 30%, 35%, and
40% filled melts was found to be 224.6, 298.0 and 286.5 kJ/mol. The shear viscosity of a
high impact ABS was also tested and reduced through the addition of styrene-
acrylonitrile (SAN) to the melt. The addition of the SAN polymer into the melt caused
the viscosity of the melt to decrease. When these viscosity results were compared to
HDPE based WPCs, the viscosity of the ABS melt was 228.7% higher. The shear stress
results obtained using the slit die indicate identical trends as to those observed in the melt
viscosity results.
CHAPTER 3 – RHEOLOGY OF ABS/WOOD COMPOSITES
3.1 Abstract
51
Research regarding wood filled thermoplastics did not begin to grow until the late
1980’s. By combined efforts of the wood and plastics industries, wood plastic
composites (WPC) were developed. As the research and commercial development of
filled thermoplastics expanded, there has been an improved sophistication of the
processing techniques, which in turn has led to an improved overall product performance
(Wolcott and Englund, 1999). Today, this industry has grown into a major player within
the residential building market, with WPC production reaching almost 700 million tons
by the end of the 2001 (Clemons, 2002). As the increased demand for these products
continues, manufacturers will continually be pushing new products to market. For these
products to continually meet customer requirements, a variety of product development,
manufacturing and mechanical testing needs to occur.
3.2 Introduction
Most of the WPC research to date has concentrated on the mechanical properties
of these materials (Sombatsompop and Phromchirasuk, 2004; Djidjelli et al., 2002).
However, to capitalize on mechanical property developments in actual products, a better
understanding of the processing flow conditions must be developed. Processing
properties are especially important because manufacturing conditions and methods can
have a strong influence on overall mechanical properties of the composite (Liang, 2002).
Most of the research on rheological behavior of wood-filled thermoplastics
concentrates on the use of high-density polyethylene, polypropylene and polyvinyl
chloride as the matrix material (Chastagner, 2005; Li and Wolcott, 2004, 2005;
Sombatsompop, 2004, Shah and Matuana, 2004). Within the commercial WPC
community, the use of amorphous styrenic resin composites is gaining interest in an

52
In order to answer some of the unknown questions regarding the flow properties
of ABS/wood composite melts, an on-line slit die rheometer will be used to determine the
important rheological parameters. Using a technique developed by Chastagner (2005),
the viscosity, shear rate and shear stress for a variety of ABS/wood composite blends will
be quantified. This will allow for an investigation into the influence of different ABS
resins, percentages of wood flour and temperature on these melt behavior parameters.
effort to exploit the (1) excellent mechanical properties, (2) natural polar interactions
with the wood fiber, (3) many options for weatherable cap stocks, and (4) paintability of
these polymers. This group of styrenic resins includes polystyrene (PS), acrylonitrile-
butadiene-styrene (ABS), and styrene-acrylonitrile (SAN). Amongst the styrenic resins,
ABS has been the most widely used, since it can lead to a stiffer foamed composite than
the other resins (Schut, 2001).
3.3. Literature Review
The manufacturing process for ABS resin begins with particles of crosslinked
rubber being grafted into an elastomer phase and subsequently embedded into a
continuous resin matrix (Casale et al., 1975). This crosslinked rubber phase provides
ABS with many excellent properties including impact, toughness, hardness, and
bondability. These properties facilitate the extensive use of ABS in the automotive and
consumer electronics industries (Boldizar and Moller, 2003).
While research into the mechanical properties of ABS-based materials is
prevalent, the amount research on ABS rheology is more limited. In the absence of
rheological studies on wood filled ABS materials, inorganic fillers such as CaCO3 (Liang,

53
2002; Tang and Liang, 2003; Liang, 2004), glass beads (Yilmazer, 1989), glass fibers
(Ozkoc et al., 2004) and mica (Pastorini and Nunes, 1999) will be reviewed. The
additions of these fillers to the melt, alters the rheological properties in dramatic ways.
First, the viscosity of the melt tends to increase with filler content. When Liang (2002,
2004) and Tang and Liang (2003) added CaCO3 to virgin ABS polymer, the melt
viscosity of the composite increased dramatically with a corresponding increase in
CaCO3 percentage. Nano-CaCO3 particles produced little change in the viscosity below
20% filler level, where upon higher filler levels increased the viscosity of the melt at least
three fold. Liang also found that these increases in viscosity were independent of testing
temperature.
When glass beads and fibers were used as a filler (Yilmazer, 1989), similar
increases in the viscosity were noted. Glass beads generally change melt viscosity
throughout the entire shear rate range analyzed. However, this was not the case for glass
bead filled ABS, where an increase in the viscosity was only noted at low shear rates. As
shear rate increased, the viscosity converged, with no dependence on filler percentage.
Similar results were obtained when glass fiber was used as filler, however, the increases
in viscosity were less pronounced than with the glass bead filler.
Within the WPC literature, the rheology of wood-filled polyolefins has also been
examined. Li and Wolcott (2004) have researched the changes in the rheological
properties of both pine and maple based HDPE composites using a capillary rheometer.
This work indicated that like inorganic filled ABS, increased filler content resulted in
similar increases in melt viscosity. This is due to the increased amount of wood flour
particles within the melt inhibiting the overall flow of the material as it moves through

54
the die, thus causing the increased shear viscosity. Li and Wolcott observed little change
in the melt viscosity due to different wood mesh sizes used. These capillary results were
expanded on by Chastagner (2005), who used an on-line slit die to test similar HDPE
filled formulations. The shear viscosity results obtained using the slit die allowed for
similar conclusions with respect to particle size effect and wood filler content. The
influence of wood species was examined and it was determined that both the maple and
pine filled melts produced similar viscosity results. Chastagner also examined the affects
of different wood filler content and mesh size on the shear stress. There was indication
that increasing wood content increased the shear stress for both maple and pine based
melts. This result was similar to finding CaCO3 filled PP (Han, 1972). However, mesh
size resulted in little effect on the shear stress.
3.4 Materials
The rheological experiments were performed using both acrylonitrile-butadiene-
styrene (BASF GP-22, MFI = 17.7 cm3/10min) and a blend of ABS (BASF HI-10, MFI =
8.0 cm3/10min) and SAN (BASF LURAN 358N, 22 cm3/10min). These polymers were
then filled with different percentages of 40-mesh maple wood flour (Acer spp.)
(American Wood Fiber, 04010). The amount of wood flour varied from 20 to 40-wt%.
A full listing of these material formulations is found in Table 3.1. The wood flour was
dried from 8 to < 3% moisture content in a steam tube dryer (Louisville Dryer Company)
operated between 153-164° C (307-327° F). The polymers were used in pellet form as
received. All composite formulations were dry blended in 1.2 m. drum tumbler for 10
minutes to facilitate an initial mixing of the polymer resins and wood flour.
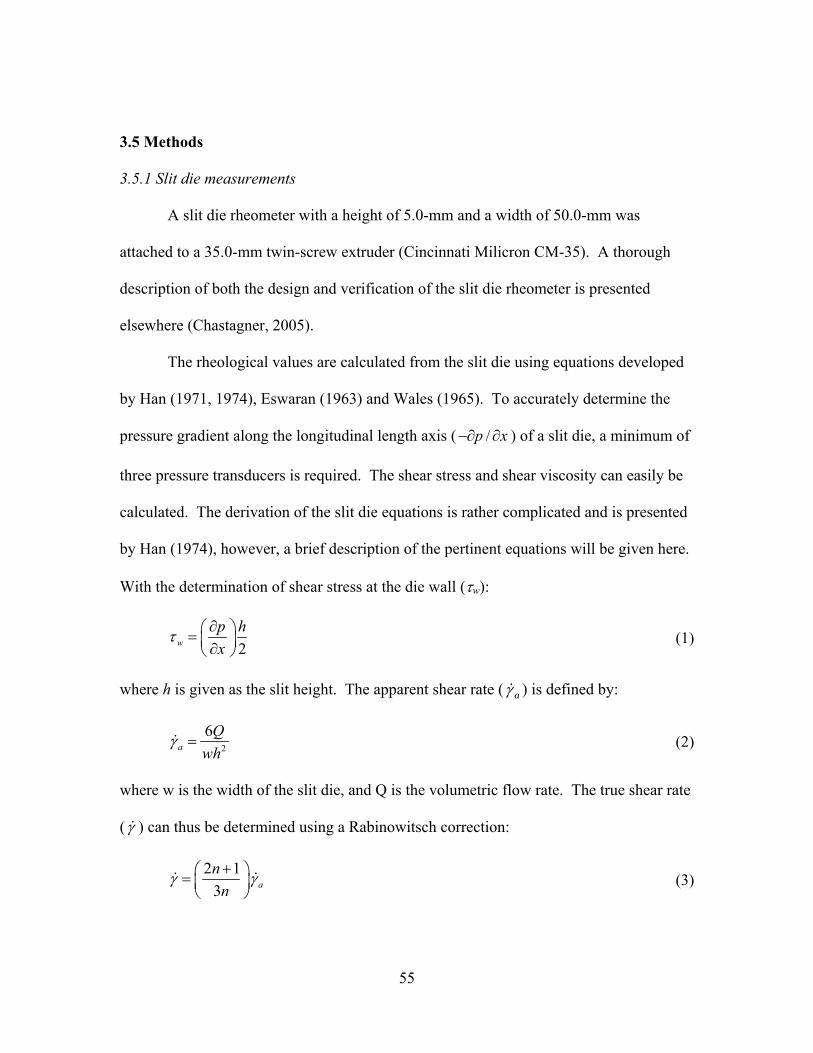
55
3.5 Methods
3.5.1 Slit die measurements
A slit die rheometer with a height of 5.0-mm and a width of 50.0-mm was
attached to a 35.0-mm twin-screw extruder (Cincinnati Milicron CM-35). A thorough
description of both the design and verification of the slit die rheometer is presented
elsewhere (Chastagner, 2005).
The rheological values are calculated from the slit die using equations developed
by Han (1971, 1974), Eswaran (1963) and Wales (1965). To accurately determine the
pressure gradient along the longitudinal length axis ( /p x−∂ ∂ ) of a slit die, a minimum of
three pressure transducers is required. The shear stress and shear viscosity can easily be
calculated. The derivation of the slit die equations is rather complicated and is presented
by Han (1974), however, a brief description of the pertinent equations will be given here.
With the determination of shear stress at the die wall (τw):
2wp hx
τ ∂ = ∂ (1)
where h is given as the slit height. The apparent shear rate ( aγ& ) is defined by:
2
6a
Qwh
γ =& (2)
where w is the width of the slit die, and Q is the volumetric flow rate. The true shear rate
(γ& ) can thus be determined using a Rabinowitsch correction:
2 13 an
nγ γ+ =
& & (3)
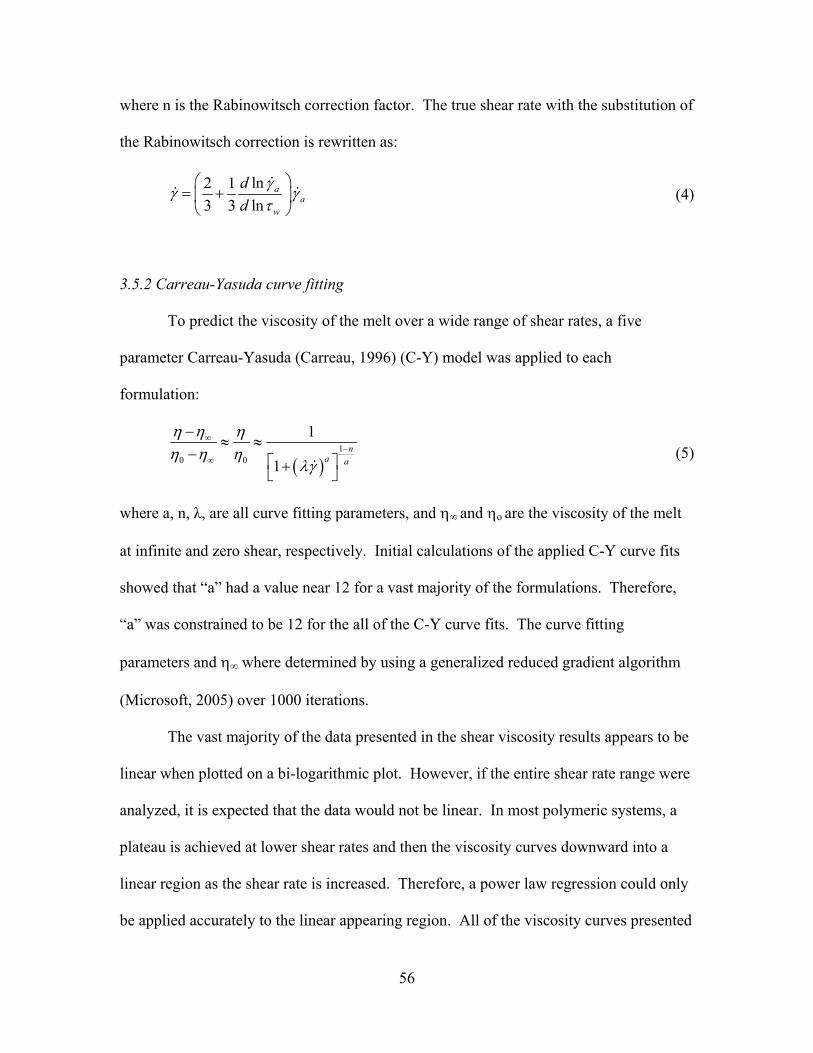
56
where n is the Rabinowitsch correction factor. The true shear rate with the substitution of
the Rabinowitsch correction is rewritten as:
ln2 13 3 ln
aa
w
dd
γγ γτ
= +
&& & (4)
To predict the viscosity of the melt over a wide range of shear rates, a five
parameter Carreau-Yasuda (Carreau, 1996) (C-Y) model was applied to each
formulation:
3.5.2 Carreau-Yasuda curve fitting
( )1
0 0
1
1n
a a
η η ηη η η
λγ
∞−
∞
−≈ ≈
− + &
(5)
where a, n, λ, are all curve fitting parameters, and η∞ and ηo are the viscosity of the melt
at infinite and zero shear, respectively. Initial calculations of the applied C-Y curve fits
showed that “a” had a value near 12 for a vast majority of the formulations. Therefore,
“a” was constrained to be 12 for the all of the C-Y curve fits. The curve fitting
parameters and η∞ where determined by using a generalized reduced gradient algorithm
(Microsoft, 2005) over 1000 iterations.
The vast majority of the data presented in the shear viscosity results appears to be
linear when plotted on a bi-logarithmic plot. However, if the entire shear rate range were
analyzed, it is expected that the data would not be linear. In most polymeric systems, a
plateau is achieved at lower shear rates and then the viscosity curves downward into a
linear region as the shear rate is increased. Therefore, a power law regression could only
be applied accurately to the linear appearing region. All of the viscosity curves presented
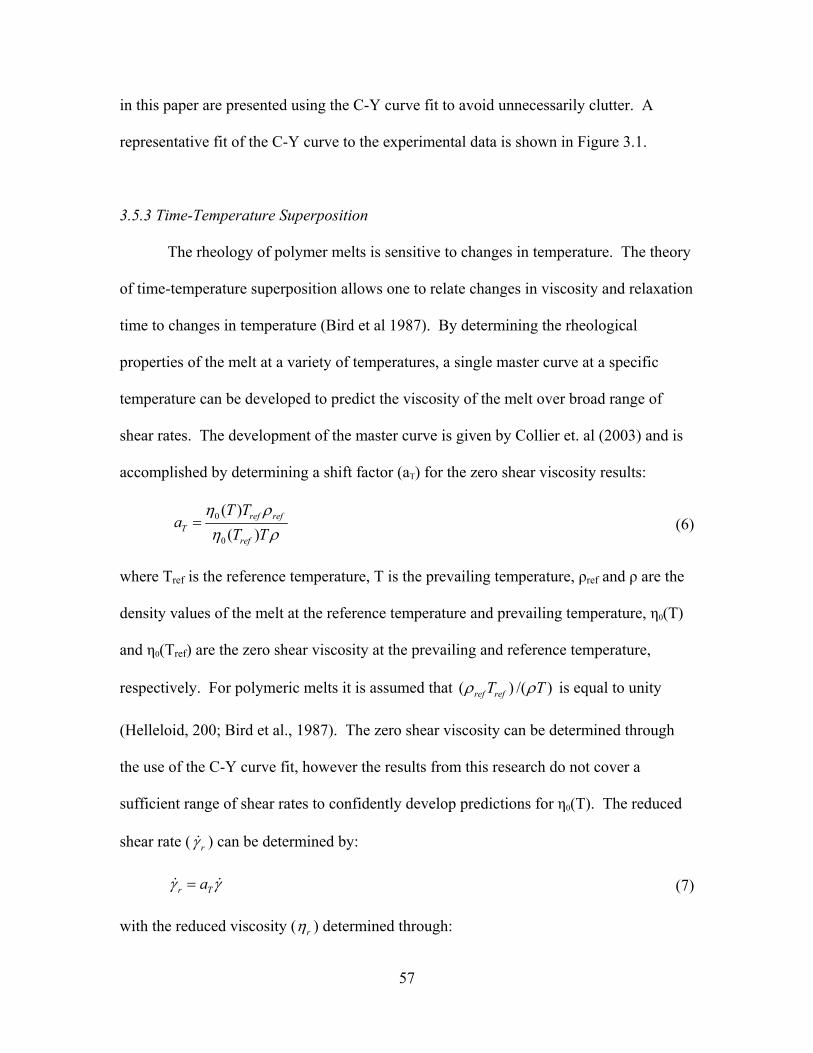
57
in this paper are presented using the C-Y curve fit to avoid unnecessarily clutter. A
representative fit of the C-Y curve to the experimental data is shown in Figure 3.1.
3.5.3 Time-Temperature Superposition
The rheology of polymer melts is sensitive to changes in temperature. The theory
of time-temperature superposition allows one to relate changes in viscosity and relaxation
time to changes in temperature (Bird et al 1987). By determining the rheological
properties of the melt at a variety of temperatures, a single master curve at a specific
temperature can be developed to predict the viscosity of the melt over broad range of
shear rates. The development of the master curve is given by Collier et. al (2003) and is
accomplished by determining a shift factor (aT) for the zero shear viscosity results:
0
0
( )( )
ref refT
ref
T TT T
aη ρη ρ
= (6)
where Tref is the reference temperature, T is the prevailing temperature, ρref and ρ are the
density values of the melt at the reference temperature and prevailing temperature, η0(T)
and η0(Tref) are the zero shear viscosity at the prevailing and reference temperature,
respectively. For polymeric melts it is assumed that ( ) /(ref refT )Tρ ρ is equal to unity
(Helleloid, 200; Bird et al., 1987). The zero shear viscosity can be determined through
the use of the C-Y curve fit, however the results from this research do not cover a
sufficient range of shear rates to confidently develop predictions for η0(T). The reduced
shear rate ( rγ& ) can be determined by:
r Taγ γ=& & (7)
with the reduced viscosity ( rη ) determined through:

where is the viscosity at the prevailing temperature and shear rate. By
graphically aligning the different temperature curves in a plot of
( ,Tη γ& )
rη vs. rγ& , the required
shifting factors for each of the melt temperatures can be determined through the
simultaneous use of equations (7) and (8). The required shifting factors are then related
to temperature through the use of an Arrhenius equation (Miller and Rothstein, 2004):
58
( ),r
T
Ta
η γη =
& (8)
1 1expTref
HaR T T
∆= −
(9)
where R is the universal gas constant and ∆H is the activation energy of the melt.
3.5.4 Experimental Techniques
Using a sampling technique described elsewhere (Chastagner 2005), the
rheological values for a variety of melts were obtained. Five different temperature
profiles of 180, 185, 190, 195 and 200º C. were used for the GP-22 analysis, while the
HI-10/SAN blends were evaluated at only 190º C. The prevailing test temperature was
used for all extruder and die zones. Filled ABS melts are more typically evaluated at
temperatures above 220º C (Yilmazer, 1989), which are higher than those tolerable by the
thermally sensitive wood particles. It should also be noted that while previous work by
Chastagner (2005) on the identical slit die included higher shear rates, the shear rate
range for this set of experiments was limited to a lower shear rate range, because of the
higher melt viscosities and the limits imposed by the extruder motor.

59
The influence of SAN content on the viscosity of a high impact ABS grade (HI-
10) filled with 30% maple flour was evaluated at 190° C (Figure 3.2). In these
formulations, the SAN content was varied from 0 to 20% of the total polymer content in
the formulation. Using a C-Y curve fit for each of the formulations (Table 3.2), the melt
viscosity of these formulations were found to decrease with increasing SAN content. The
shear viscosity of the HI-10 filled with 25%SAN was compared to a similar GP-22
formulation, the viscosity of the SAN filled melt was up to 24.6% higher than the
comparable GP-22 melt (Figure 3.2). When the shear viscosity of the 20% SAN filled
melt was compared to a 30% HDPE-70% maple melt (Chastagner, 2005), the SAN shear
viscosity was up to 228.7% higher than the HDPE viscosity despite the fact that it was
evaluated at 180 rather than 190° C.
3.6 Results
3.6.1 Shear viscosity results
The influence of wood filler level, SAN polymer and temperature on the shear
viscosity of ABS filled melts was examined using a slit die. In general, the shear
viscosity of the melts increased with an increase in wood filler level. Similar increases in
melt viscosity were seen with decreasing temperature and SAN filler content.
Since the influence of SAN into the ABS/wood melt affected the shear viscosity,
it is important to examine the change in melt viscosity due to changes in the wood filler
amount and temperature. When the shear viscosity of GP-22 filled with 30% maple was
tested, there was a distinct decrease in the melt viscosity as the temperature of the melt
decreased (Figure 3.4). When the effects of temperature were tested on maple filler
percentage of 35 and 40% (Figure 3.5), identical results were observed. This increase in

60
viscosity is expected because, as the temperature decreases, there is a reduction in the
amount of chain movement within the polymer, leading to more resistance within the
melt to deform.
However, if the temperature of the melt was held constant and instead the maple
flour content was varied, from 20 to 40%, the shear viscosity was found to increase with
increasing wood levels (Figure 3.3). Similar increases in shear viscosity have also been
found with HDPE/wood melts tested a slit die rheometer (Chastagner, 2005) and a
capillary die rheometer (Li and Wolcott, 2004).
3.6.2 Viscosity Temperature Dependence
Since the shear viscosity of the GP-22 filled with 30, 35 and 40% maple flour was
found to decrease as the temperature of the melt increased, these viscosity changes are
then used for the construction of master curves. These master curves were developed by
plotting the log ( rη ) vs. log ( r ) for a given formulations C-Y curve fit at each specified
temperature. The shifting of the fits was accomplished by graphically aligning the
different temperature curves, to create a single, continuous master curve using 195° C as
the reference temperature (Tref). The master curve for 30% maple and 70% GP-22 at Tref
= 180° C is shown in Figure 3.4, along with the original C-Y curve fits (Table 3.3) and
the resulting shift factors. The agreement of the data throughout the entire temperature
range is good, allowing a single, consistent master curve to be developed. The shift
factors decrease with increasing temperature and are well described using the Arrhenius
equation as shown in Figure 3.6.
γ&

61
The master curves developed for 35 and 40% maple filler amounts display similar
form, with increasing wood content resulting in increased viscosity (Figure 3.5). The
respective shift factors are presented in Figure 3.6, along with the resulting Arrhenius
parameters, including activation energy. Calculation of the activation energy allows for
the determination of the minimum amount of energy input required by the system for
chain segments of polymer to move from their present location to a new location (Rosen,
1993). Since there is a significant amount of energy required for the polymer chains to
translate. Adalja et al. (2001) has shown that the addition of glass fibers dramatically
increases the flow activation energy of low-density polyethylene. When the glass filler
amount increased from 10 to 50%, the corresponding activation energy increased from
27.1 kJ/mol to 209kJ/mol, since the increase in the filler amount restricted the movement
of the polymer chains within the melt.
The temperature of the melt when conducting the rheological test can also alter
the required activation energy of the melt. At temperatures near the glass transition
temperature (Tg), thermal influences on the melt are different than at higher temperatures.
Near Tg (Tg< T< Tg+100º C.) the influence of temperature on ability of the polymer chain
to move is dependent on its neighboring chains and therefore can be described using a
WLF relationship (Ferry, 1980). However, at temperatures above approximately Tg+100º
C. there is less interaction between the chains and the physical behavior of the melt
changes. Therefore an Arrhenius fit is more applicable at these elevated temperatures
(Kao and Bhattacharya, 1998).
When the flow activation energy of the GP-22 filled melts was calculated in this
study using the slope of the of the shifting factors, the activation energy of the 30, 35 and

62
40% maple filled melts was determined using the Arrhenius fit to be 224.6, 298.0 and
286.5 kJ/mol, respectively. These activation energy values are higher than results
obtained for unfilled ABS tested on a capillary die, with Casale et al. (1975) finding
unfilled ABS activation energy values between 77.0 and 128.1 kJ/mol. This difference in
activation energy may be attributed to two factors. First, the additional amounts of wood
filler in the melt is likely to cause an increase in the activation energy, since composite
melts have been found to be more temperature sensitive (Dweiri and Azhari, 2004).
Secondly, as the temperature of the melt decreases, the polymer chains in the melt exhibit
less interaction with their neighboring chains causing a reduction in their mobility. The
relatively low temperatures necessitated by the thermally sensitive wood fibers are likely
to decrease mobility causing an increase in the activation energy. The combination of
these factors is only amplified by the addition of the filler restricting the flow of the melt
(Chen et al, 2003).
3.6.3 Shear Stress Analysis
Since the determination of the shear viscosity is based on the calculated shear
stress value, it is important to observe how the shear stress changes with the different
formulations. Shear stress can also be used to quantify determine the slip velocity of the
melt and if used in conjunction with a varying slit die height, the yield stress of the melt
can be determined. Shear stress at the wall (τw) was determined for both the GP-22 and
HI-10/SAN filled melts. As maple content of the GP-22 composite increased, the shear
stress of the melt increased as well (Figure 3.7). Identical results were observed in the
shear stress results of HDPE melts filled with maple wood flour (Chastagner, 2005). In

63
When the HI-10/SAN filled formulations were evaluated, shear stress results
similar to the GP-22 melts were achieved. Although a general trend of decreased shear
stress with increasing SAN content was noted, certain discrepancies exist and likely
originate from the variability (Figure 3.9) of the results. As in the previous results,
decreased shear stresses corresponded with viscosity reductions. For instance, the pure
HI-10 formulation contains the highest rubber content and resulted in the highest shear
stress values. Addition of SAN reduced the rubber proportion within the melt, reducing
the resistance to flow and the required shear stress to move the melt.
addition, when filler content was held constant shear stress was an observed to increase
with shear stress and decreasing temperature. This result was observed for the 30, 35 and
40% filler contents and a representative plot is shown in Figures 3.8. In general, the
observed increases in shear stress result from higher resistant to flow and correspond with
increased viscosity.
3.7 Conclusions
While most of the focus of the WPC research and development has been centered
on the use of HDPE and PP as a polymer matrix, the introduction of ABS as a viable
replacement to these polymers, would allow for manufactures to apply the excellent
mechanical properties of this polymer to an industry that is continually looking to expand
its applications. However, to date, most wood filled ABS melt research has concentrated
on the mechanical properties of the composite, with little work on the rheology of these
systems.
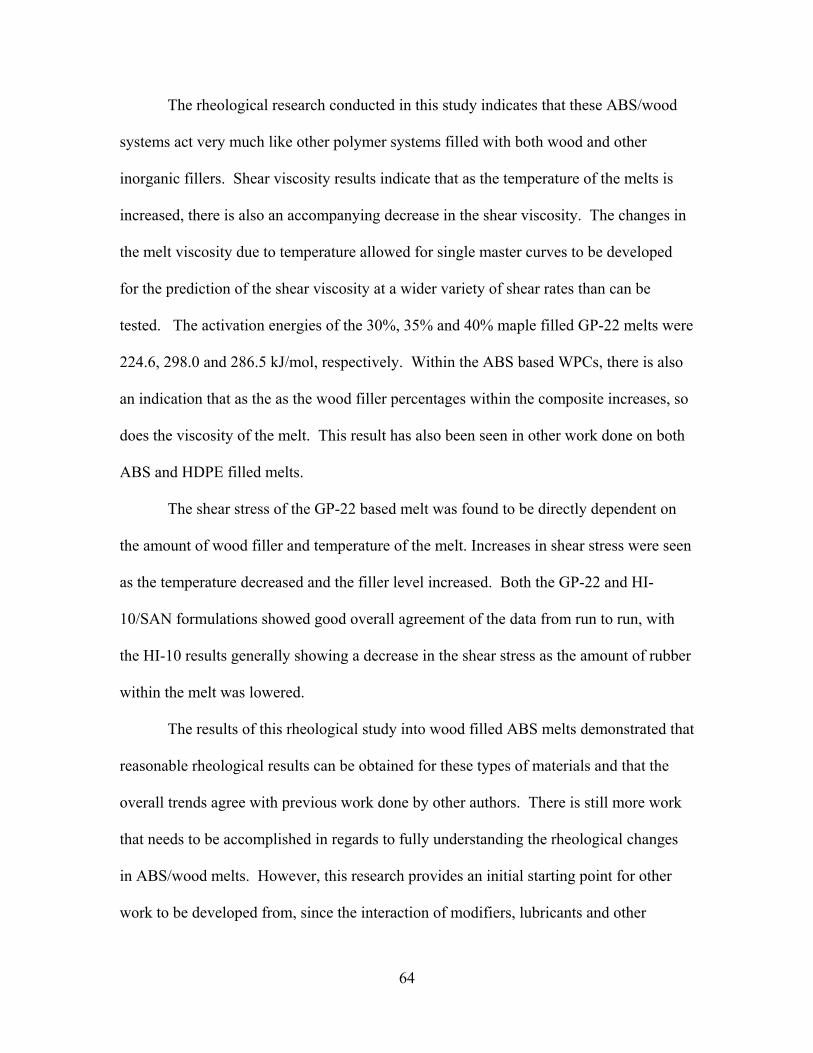
64
The rheological research conducted in this study indicates that these ABS/wood
systems act very much like other polymer systems filled with both wood and other
inorganic fillers. Shear viscosity results indicate that as the temperature of the melts is
increased, there is also an accompanying decrease in the shear viscosity. The changes in
the melt viscosity due to temperature allowed for single master curves to be developed
for the prediction of the shear viscosity at a wider variety of shear rates than can be
tested. The activation energies of the 30%, 35% and 40% maple filled GP-22 melts were
224.6, 298.0 and 286.5 kJ/mol, respectively. Within the ABS based WPCs, there is also
an indication that as the as the wood filler percentages within the composite increases, so
does the viscosity of the melt. This result has also been seen in other work done on both
ABS and HDPE filled melts.
The shear stress of the GP-22 based melt was found to be directly dependent on
the amount of wood filler and temperature of the melt. Increases in shear stress were seen
as the temperature decreased and the filler level increased. Both the GP-22 and HI-
10/SAN formulations showed good overall agreement of the data from run to run, with
the HI-10 results generally showing a decrease in the shear stress as the amount of rubber
within the melt was lowered.
The results of this rheological study into wood filled ABS melts demonstrated that
reasonable rheological results can be obtained for these types of materials and that the
overall trends agree with previous work done by other authors. There is still more work
that needs to be accomplished in regards to fully understanding the rheological changes
in ABS/wood melts. However, this research provides an initial starting point for other
work to be developed from, since the interaction of modifiers, lubricants and other

65
additives on the rheological properties of the ABS/wood melts hasn’t even been
addressed in this research.

66
3.8 References
Adalja, S.b., Otaigbe, J.U. and Thalacker, J. Glass polymer melt hybrids, I: Viscoelastic properties of novel affordable organic-inorganic polymer hybrids. Polymer Engineering and Science. vol. 41, n. 6, 2001. pp. 1055-1067
Bird, R.B., Armstrong, R.C. and Hassager, O. Dynamics of polymeric liquids, Vol. 1,
Fluid dynamics. Wiley, New York, 2nd edition, 1987
Boldizar, A. and Moller, K. Degradation of ABS during repeated processing and accelerated ageing. Polymer Degradation and Stability. 2003. vol. 81, pp. 359-366.
Casale, A., Moroni, A., Spreafico, C. “ABS reins: The Relationship between
Composition and Rheological Behavior.” Advances in Chemistry Series. 1975, n. 142. pp 172-185
Chastagner, M.W. “HDPE/wood composite rheology.” Washington State University;
Master Thesis, Ch. 2, July 2005. Chen, J., Carrot, C., Chalamet, Y., Majests, J. and Taha, M. Rheology of poly(n-butyl
methacrylate) and its composites with calcium carbonate. Journal of Applied Polymer Science, Vol. 88 2003. pp. 1376-1383
Clemons, C. “Wood plastic composites in the United States, the interfacing of two
industries.” Forest Products Journal, June 2002, Vol. 52, No. 6, pp. 10-18. Collier, J.R., Petrovan, S. and Patil, P. Temperature shifting of convergent flow measured
effective elongational viscosity. Journal of Applied Polymer Science. Vol. 87, 2003. pp. 1387-1396
Djidjelli, H., Martinez-Vega, J. Farenc, J., and Bencahour. Effect of Wood flour content
on the thermal, mechanical and dielectric properties of Poly(vinyl chloride). Macromolecular Materials Engineering. 2002. 287. no9. pp. 611-618
Dweiri, R. and Azhari, C.H. Thermal and flow property-morphology relationship of
sugarcane bagasse fiber filled polyamide 6 blends. Journal of Applied Polymer Science. Vol. 92, 2004. pp. 3744-3754
Ferry, J.D. “Viscoelastic Properties of Polymers,” 3rd edition. Wiley, New York, 1980 Helleloid, G.T. On the computation of viscosity-shear rate temperature master curves.
Journal of Applied Mathematics. Issue 1, 2001

67
Liang, J. Melt Extrusion Properties of ABS and ABS-Quasinano-CaCO
Kao, N. and Bhattacharya, S.N. The effect of temperature on the viscoelastic properties of model and industrial dispersions. Journal of Rheology. Vol. 42, n. 3, 1998. pp. 493-506
Li, T.Q. and Wolcott, M.P. Rheology of wood plastics melt: 1. Capillary rheometry of
HDPE filled with maple. Polymer Engineering Science, In Press. Li, T.Q. and Wolcott, M.P. Rheology of HDPE-wood composites. I. Steady state shear
and extensional flow. Composites Part A: Applied science and manufacturing. 2004, pp. 303-311
3 Composite.
Journal of Elastomers and Plastics 2004. vol. 36 pp. 363-374 Liang, J. “Melt rheology of nanometer-calcium-carbonate-filled acrylonitrile-butadiene-
styrene (ABS) copolymer composites during capillary extrusion.” Polymer International. Vol. 51. 2002. pp 1473-1478.
Miller, E. and Rothstein, J.P. Control of the sharkskin instability in the extrusion of
polymer melts using induced temperature gradients. Rheologica Acta. 2004 vol.44 pp 160-173
Microsoft Corporation. Solver uses generalized reduced gradient algorithm. Retrieved
July, 22, 2005. http://support.microsoft.com/default.aspx?scid=kb;en-us;82890 Ozkoc, G., Bayram, G. and Bayramli, E. Effects of polyamide 6 incorporation to the
short glass fiber reinforced ABS composites: an interfacial approach. Polymer 2004. Vol. 45 pp. 8957-8966
Pastorini, M.T. and Nunes, R.C.R. Mica as a Filler for ABS/Polycarbonate Blends.
Journal of Applied Polymer Science, 1999. Vol. 74, pp 1361-1365. Rosen, S. Fundamentals Principles of Polymeric Materials, 2nd edition, John Wiley and
Sons, NY, NY. 1993 Schut, J.H. “Foaming Expands Possibilities for Wood-Fiber Composites.” July 2001,
Plastics Technology, http://www.plasticstechnology.com/articles/200107fa2.html Shah, B.L. and Matuana, L.M. Online measurement of rheological properties of
PVC/woof-flour composites. Journal of Vinyl and Additive Technology. September 2004. Vol. 10, No. 3 pp. 121-128
Sombatsompop, N. and Phromchirasuk, C. Effects of Acrylic-Based processing aids on
processibility, Rheology, Thermal and Structural Stability, and Mechanical Properties of PVC/wood-sawdust composites. Journal of Applied Polymer Science. 2004. Vol. 92 pp 782-790.

68
Tang, C.Y. and Liang, J.Z. A study of the melt behavior of ABS/CaCO3 composites.
Journal of Materials Processing Technology. 2003. Vol. 138, pp. 408-410 Wolcott, M.P. and Englund, K. A Technology Review of Wood-Plastic Composites.
Conference proceedings of 33rd International Particleboard/Composite Materials Symposium. 1999. pp. 103-111
Yilmazer, Y. Viscosity and Die Swell of Acrylonitrile-Butadiene-Styrene Filled with
Glass Beads and Glass Fibers. Polymer Composites. 1989. Vol. 10, No.1, pp. 1-7

(sec-1)
7 8 9 2010
η (k
Pa-
s)
6
7
8
9
20
10
35% MapleCarreau-Yasuda Curve Fit
γ&
Temp = 190 deg. C.
69
3.9 Figures
Figure 3.1 Representative Carreau-Yasuda curve fit of experimental data
(sec-1)
5 6 7 8 9 20 3010
η (k
Pa-
s)
3
4
5
6
789
20
10
γ&
SAN Content190 deg. C.0%5%10%15%20%25%
ABS (GP-22 )HDPE (Equistar) (180 deg. C)
70% Polymer/30% maple
Figure 3.2. Shear flow curve of HI-10/SAN filled with 30% maple, with a comparison to GP-22 and HDPE filled melts
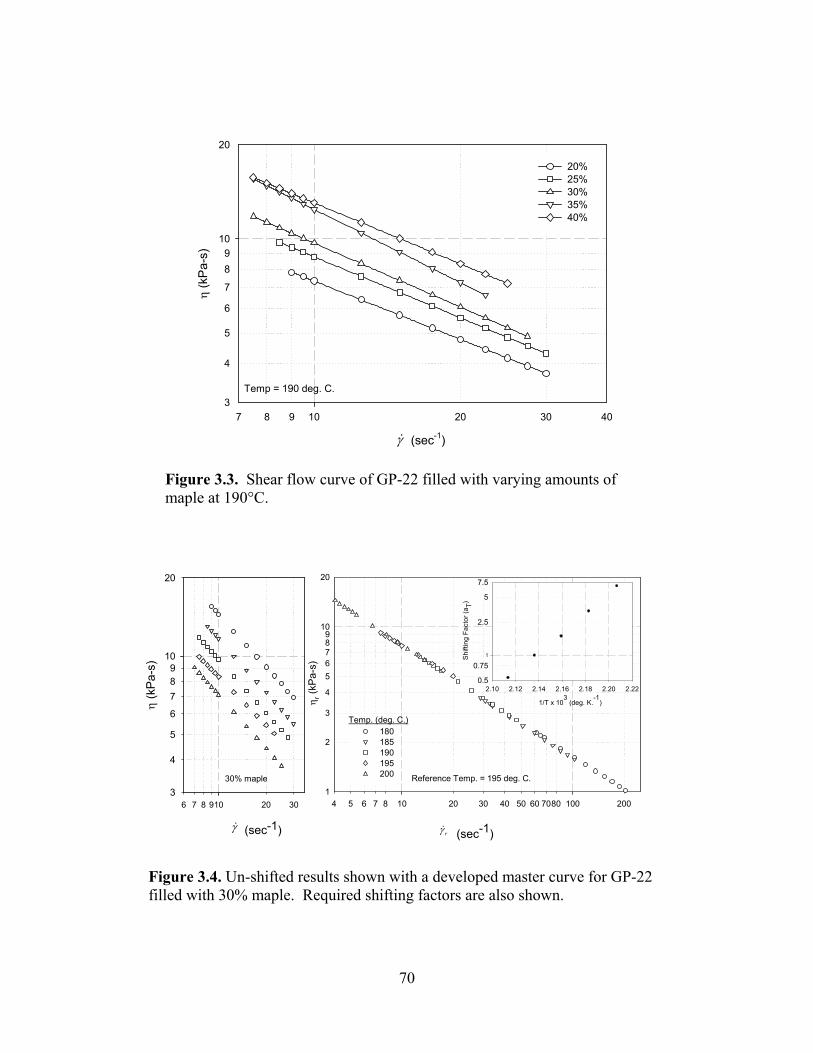
(sec-1)
7 8 9 20 30 410
η (k
Pa-
s)
3
4
5
6
7
89
20
10
20%25%30% 35% 40%
Temp = 190 deg. C.
γ&
70
0
Figure 3.3. Shear flow curve of GP-22 filled with varying amounts of maple at 190°C.
(sec-1)
6 7 8 9 20 3010
η (k
Pa-s
)
3
4
5
6
789
20
10
4 5 6 7 8 20 30 40 50 60 7080 20010 100
η r (kP
a-s)
2
3
4
56789
20
1
10
18018519019520030% maple
Temp. (deg. C.)
1/T x 103 (deg. K.
-1)
2.10 2.12 2.14 2.16 2.18 2.20 2.22
Shi
fting
Fac
tor (
a T)
0.5
0.75
2.5
5
7.5
1
γ& (sec-1)
Reference Temp. = 195 deg. C.
rγ&
Figure 3.4. Un-shifted results shown with a developed master curve for GP-22 filled with 30% maple. Required shifting factors are also shown.

1/T x 103 (deg. K-1)
2.10 2.12 2.14 2.16 2.18 2.20 2.22
Shi
fting
Fac
tor (
a T)
0.4
0.50.60.70.80.9
2
3
4
56789
20
1
10
∆H (kJ/mol)
224.6298.0286.5
Wood% Exp.
303540
Arrhenius
(sec-1)
2 3 4 5 6 8 20 30 40 50 60 80 200 30010 100
η ρ (K
pa-s
)
0.60.70.8
2
3
45678
20
30
1
10
30%35%
40%180185190195200
Temperature
Carreau-Yasuda ParametersMaple Linetype n η0 λ 30% 0.32 88.40 3.59 35% 0.28 100.02 3.14 40% 0.24 104.81 1.94
Reference Temp = 195 deg. C.
rγ&
71
Figure 3.5. Master curve for 30, 35 and 40% maple filled composites, with regression lines indicating Carreau-Yasuda curve fits for actual shifted data.
Figure 3.6. Actual shift factors shown with Arrhenius curve fits and required activation energy.

(sec-1)
4 5 6 7 8 9 20 30 4010
τ w (k
Pa)
50
60
70
80
90
200
100
180 0.93185 0.76190 0.75195 0.47200 0.60
30% 40 mesh maple
γ&
Temp R2
(sec-1)
6 7 8 9 20 30 4010
τ w (k
Pa)
60
70
80
90
200
100
20 0.9425 0.8330 0.47 35 0.7340 0.70
Temperature = 190
γ&
Maple (%) R2
(sec-1)
6 7 8 9 20 30 4010
τ w (k
Pa)
60
70
80
90
200
100
20 0.9425 0.8330 0.47 35 0.7340 0.70
Temperature = 190
γ&
Maple (%) R2
Figure 3.7. Shear stress of GP-22 filled with maple at 190°C. Linear regression curve fit also plotted to allow for determination of trends.
Figure 3.8. Shear stress of GP-22 filled with 30% maple at varying temperature. Linear regression curve fit also shown to facilitate trend determination.
72

(sec-1)
4 5 6 7 8 9 20 3010
τ w (k
Pa)
90
150
200
100
0510152025
γ&
30% 40-mesh maple
SAN (%) /HI-10
73
Figure 3.9. Shear stress of HI-10/SAN filled with 30% maple. Linear regression curve fit also plotted to allow for determination of trends.
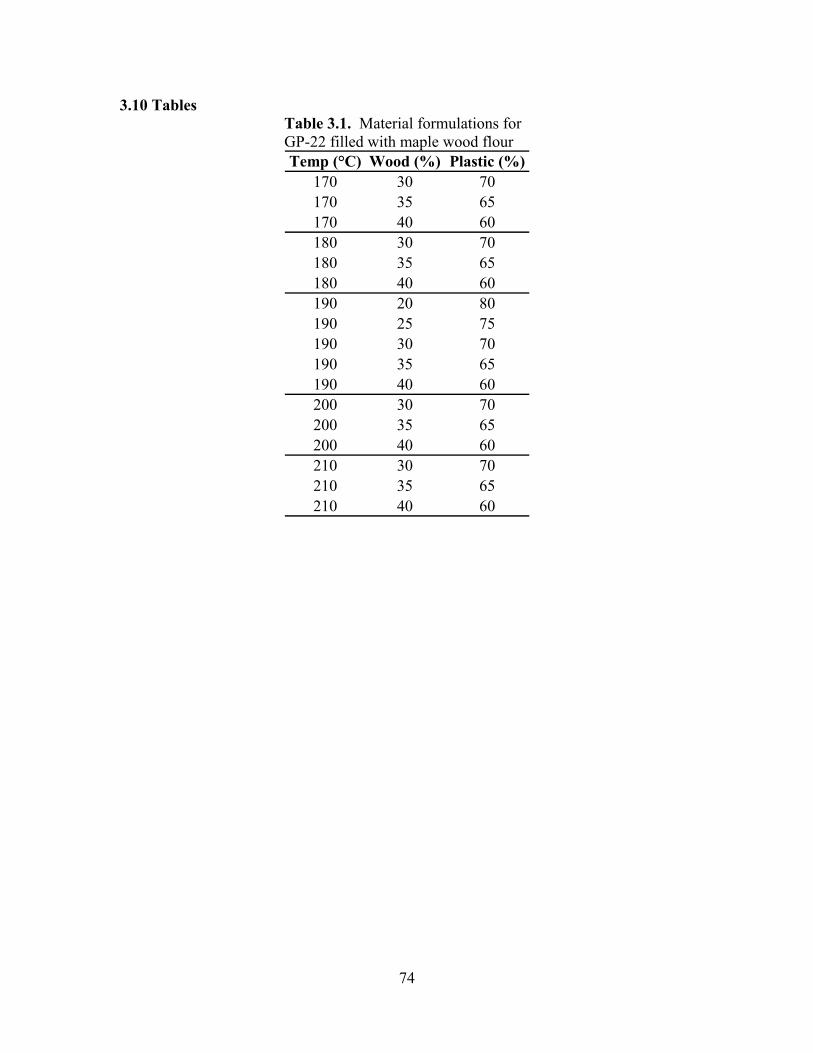
Temp (°C) Wood (%) Plastic (%)170 30 70170 35 65170 40 60180 30 70180 35 65180 40 60190 20 80190 25 75190 30 70190 35 65190 40 60200 30 70200 35 65200 40 60210 30 70210 35 65210 40 60
74
3.10 Tables Table 3.1. Material formulations for GP-22 filled with maple wood flour
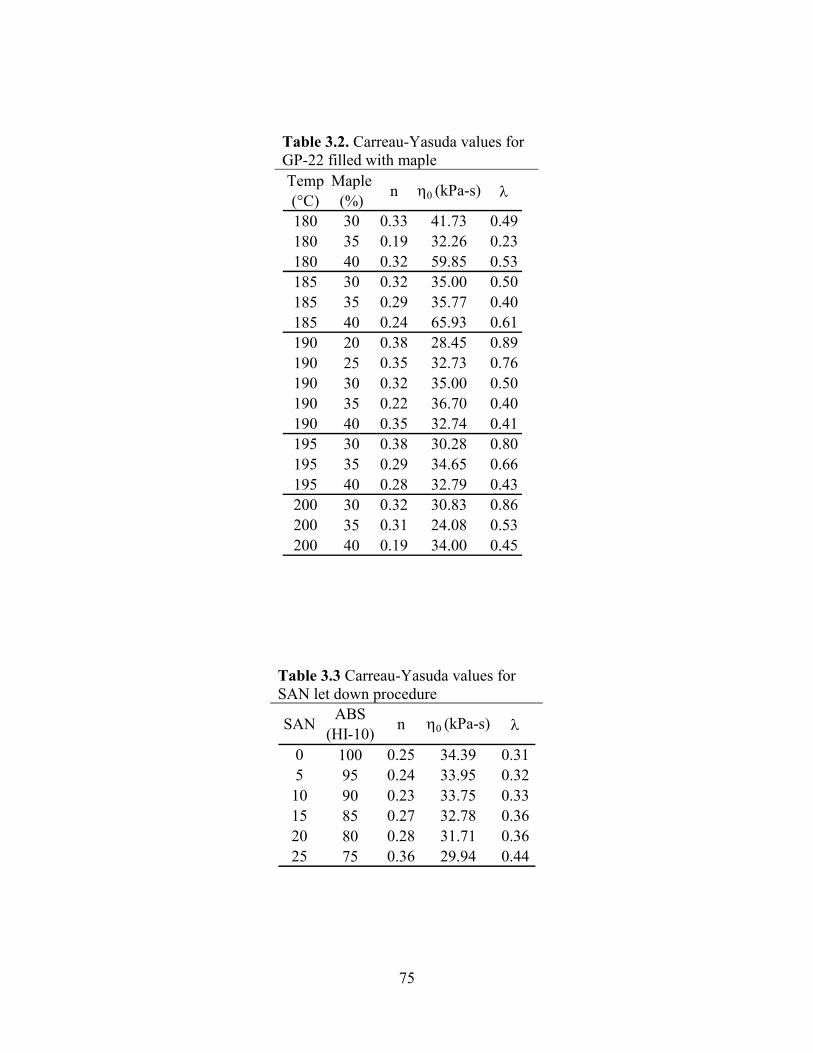
180 30 0.33 41.73 0.49180 35 0.19 32.26 0.23180 40 0.32 59.85 0.53185 30 0.32 35.00 0.50185 35 0.29 35.77 0.40185 40 0.24 65.93 0.61190 20 0.38 28.45 0.89190 25 0.35 32.73 0.76190 30 0.32 35.00 0.50190 35 0.22 36.70 0.40190 40 0.35 32.74 0.41195 30 0.38 30.28 0.80195 35 0.29 34.65 0.66195 40 0.28 32.79 0.43200 30 0.32 30.83 0.86200 35 0.31 24.08 0.53200 40 0.19 34.00 0.45
75
Table 3.2. Carreau-Yasuda values for GP-22 filled with maple
Table 3.3 Carreau-Yasuda values for SAN let down procedure
0 100 0.25 34.39 0.315 95 0.24 33.95 0.3210 90 0.23 33.75 0.3315 85 0.27 32.78 0.3620 80 0.28 31.71 0.3625 75 0.36 29.94 0.44
Pa-s) λTemp (°C)
Maple (%) n η0 (k
λABS
(HI-10)SAN n η0 (kPa-s)

76
CHAPTER 4 – CONLUSIONS AND FUTURE WORK
4.1 Conclusion
t for wood plastic composites (WPC) continues to grow as their
applica In
of the
o
al results of the slit die were compared to results
obtaine wer
lt
tions and subsequent use in residential building construction has increased.
order for manufacturers to keep cost low, accurate developmental testing of these
materials is needed. To date, most of this research has centered on the mechanical
properties of the final product, while little research has examined the flow behavior
WPC melt while it is being extruded. Therefore, the intent of this research was two-fold.
First, to prove that the designed slit die produced reasonable flow properties for WPC
melts by comparing the results to capillary die results and secondly, to use the slit die t
further quantify the rheological properties of HDPE and ABS filled with wood filler as a
variety of variables were altered.
When the HDPE rheologic
s
The marke
d using a capillary die, the slit die produced results that were considerably lo
than the capillary rheometer. However, as the wood content in the blend increased, the
closer the results of the two rheometers became to one another. It is believed that this
difference in viscosity is partly influenced by the different processing conditions the me
undergoes in the two rheometers. A second noticeable difference between the results of
the two methods is that unlike previous capillary rheometry research, the slit die viscosity
results showed that changes in the wood filler percentage in pine-based composites can
effect the shear viscosity of the melt. This is different from previous capillary results,
which indicated that similar viscosities should be obtained for the two dissimilar pine-
based WPC formulations. It is speculated that these observed differences in the slit die

77
lit die shear stress results for HDPE based melts appear to be in good
agreem ge of
As
ent is concentrated on the use of HDPE and PP
as a po
compo
ng
t
y as the
d.
ent with results from other filled polymer systems. When the filler percenta
the wood was increased from 30% to 70%, the melt shear stress corresponding increased.
However, when mesh size was altered, little change in the shear stress was noticed.
Similar results were also observed in the required current draw of the extruder motor.
the amount of wood filler within in the melt increased, so did the required amperage to
turn the motor.
Most WPC research and developm
results might be caused by the pine wood filler producing natural lubricant like
substances.
The s
lymer matrix. Recently, however, the use of ABS has become more popular as
has become as manufactures look to apply its excellent mechanical properties to WPC
products. Very little research on ABS based WPCs is known to exist within the open
literature and relevant melt rheology literature for these composites is non-existent.
The rheological research conducted in this study indicates that ABS/wood
sites behave similar to other filled polymer systems. Shear viscosity results
indicate that as the temperature of the melt is increased, there is also an accompanyi
decrease in the shear viscosity. This observed change in melt viscosity is then used to
develop master curves that aid in the determination of predicted shear viscosity results a
shear rates that cannot be tested. By shifting the viscosity and shear rate using a
calculated shift factors, the master curves showed an increase in the shear viscosit
wood filler percentage within the ABS melt increased. Using the shifting factors and
applying an Arrhenius fit to the results; the activation energy of the melts was calculate

78
tion
omparisons of the GP-22 melt viscosity results to similarly filled HI-10 melts
were al
f SAN
f
elt were found to be directly
depend
-
l examination into the use of a slit die rheometer in
highly
h
The activation energies of the 30%, 35% and 40% maple filled GP-22 melts were 224.6,
298.0 and 286.5 kJ/mol, respectively. These results were found to be higher than unfilled
ABS flow activation energy values calculated from previous capillary die work. It is
very possible that these differences are due to the added wood filler restricting the
amount of possible motion within the polymer chains, thereby increasing the activa
energy.
C
so conducted. The HI-10 melts showed higher shear viscosity results,
independent of shear rate. However, within the HI-10 results, as the amount o
within the melt was increased, there was a noticeable decreases in the shear viscosity o
the melt. This was attributed to the effective reduction in the amount of rubber particles
within the melt. These rubber particles cause a resistance to flow for the polymer chains,
therefore causing an increase in the viscosity of the melt.
The shear stress results of the GP-22 based WPC m
ent on the amount of wood filler and temperature of the melt. Increases in shear
stress were seen as the temperature decreased and the filler level increased. Both the GP
22 and HI-10/SAN formulations showed good overall agreement of the data from run to
run. The HI-10 results showed a general decrease in the shear stress as the amount of
rubber within the melt was lowered.
This research provides an initia
wood filled HDPE and ABS melts. The results of this study demonstrate that
reasonable rheological results can be obtained using a slit die rheometer. This researc
also examines the rheological changes occurring in the melt for ABS/maple composites.

79
4.2 Future work
lit die has been shown to be a reasonable tool for determining the
rheolog ed
e
in this study is also limited to wood and polymer
compos s.
ves,
gical
ical properties of WPC melts, further work into a full analysis of the pine-bas
melts is needed. It is expected that the pine results for shear viscosity and stress will be
similar to maple based melts when there is a change in the pine filler amount, but there is
minimal literature to confirm this result. It would also be of interest to see if similar
changes in the shear stress and viscosity would be observed if the mesh size of the pin
based composite was changed.
The research conducted
However, since the amount of rheological work on both the wood filled HDPE and ABS
is very limited, there is a great deal of research that needs to be accomplished before a
full understanding of flow properties can occur.
Since the s
ites with no added lubricants, coupling agents, modifiers or foaming agent
Since all commercial WPC melts will invariably contain some amount of these additi
it will be important for future work to examine the effects of these materials on the
rheological properties. These additives will have pronounced changes on the rheolo
properties and should be closely examined.

Most rheological studies of the rheology of wood plastic composite (WPC) has
concentrated around the use of off-line capillary die rheometers. Since this type of
rheometer can have limitations when studying WPCs it is important to develop different
techniques that will still be able to measure the rheological properties correctly but will
be able to overcome some of the capillary dies problems. With the introduction of a
rheological slit die as a measurement technique this problem is solved. However, since
the slit die requires a mass flow rate to be calculated for calculating the properties, an
accurate procedure for measuring the density of the wood plastic composite (WPC) is
needed.
80
APPENDIX A -
DETERMINATION OF WOOD PLASTIC COMPOSITE DENSITY
A.1 Introduction
A.2 Literature
When doing the rheological tests using the slit die, it is important to correctly
determine the density of the extrudate over the sixty-second sampling period. A similar
method was used by Thorsteinsen et. al. (2003) to obtain the volumetric flow rate when
examining unfilled PVC systems. This density value is then used for determining the
volumetric flow rate (Q):
mQρ
= (1)
where m is the mass flow rate and ρ is the density of the material. The volumetric flow
rate allows for the calculation of the apparent shear rate ( aγ& ) (Han, 1974):
(3)
81
2
6a
Qwh
γ =& (2)
where w and h are the width and height of the slit die, respectively. The conversion of
aγ& to obtain the true shear rate (γ& ) is expressed as:
2 13 an
nγ γ+ =
& &
where n is the Rabinowitsch correction factor and taken as log logw add τ γ& .
A.3 Measurement
In order to measure the density of the WPC correctly, ASTM D-2395 was
followed for all of the samplings. This standard provides a standard test method for
determining the specific gravity of wood and wood-base materials. Initial tests were
carried out using Mode IV of the standard, to test for the specific gravity of the extrudate.
A 500ml-graduated cylinder was used with a submersion of the sample into a water bath.
This method did not allow for very accurate readings, since the human eye reads the
water level and the graduated steps were very wide apart. Using this technique lead to a
wide variety of results for the specific gravity of the WPC extrudates. Therefore, a better
method of testing the specific gravity of the extrudate was needed.
The use of Mode II was determined to be the best method for this application. By
placing a container filled with water on the balance (Figure A.1), the weight of the water
changes as the buoyant force of the sample displaces a specific amount of water, and the
weight of displaced water is equivalent to the volume of the water displaced. Since the
container would not allow for a straight section of the extrudate to be tested, the need to
compress the overall size of the extrudate had to be reduced. Therefore, a variety of

82
different types of folding of the material were tested; a rolling, a folding and a zigzag
method, with pictures of the three different methods shown in Figure A.2. The rolling
method was eliminated since it was creating too many air pockets between the layers. In
order to test the density of results of the remaining two methods, an experiment was
conducted with 12 one-minute long samples for each of the two different methods. A
random number generator was used to determine the order of the samples in a 24-minute
sampling period. This order can be found in Table A.1. The density of the extrudates
was measured following the ASTM D-2395 standard. A full listing of the densities of the
extrudates is found in Table A.2.
A.4 Results and Discussion
With these densities, a small sample comparison t-test was run to determine if the
two methods were producing the same values (Devore, 2000). The t-test indicated that
the samples had a t-critical value of 0.484, and a P-value of 0.633. Since the null
hypothesis states that the two populations are identical, when tested at significance levels
of 0.01, 0.05 and 0.10, the null hypothesis is not rejected. These results are shown in
Table A.3. Therefore, based on the results of the t-test, since the null hypothesis was not
rejected, it was determined that the two methods produced identical densities for the melt.
Since both methods produce the same result, the zigzag method was chosen over the
folding method, as it is much easier for the operator to perform.
A.5 Conclusions
Since both the zigzag and folding method produce identical results, there is
statistically no real advantage for using one method over the other. However, when the

83
easy of use for the test operator is figured into the equation, the zigzag technique is much
better match. Therefore, the use of the zigzag technique will be used on all future
calculations. This will allow for consistent standard to be employed throughout the entire
set of experiments.

84
A.6 References
ASTM D2395-97. “Standard Test Methods for Specific Gravity of Wood and Wood-Base Materials.” American Society for Testing and Materials.
Devore, J. L. Probability and Statistics for Engineering and the Sciences. 5th edition
Duxbery. Pacific Grove, CA. 2000 Han, C.D. “On slit- and capillary-die rheometry.” Transactions of the Society of
Rheology, 1974. Vol. 18.1, pp.163-190 Thorsteinsen, P., Hinrichsen, E.L. and Glomsaker, T. “A Dual Slit In-Line Die for
Measuring the Flow Properties of S-PVC Formulations. Journal of Vinyl & Additive Technology. December 2003, Vol. 9, No. 4. pp. 188-197

Folding Zigzag
Rolling
Figure A.2. Different types of extrudate folding
Figure A.1. Measurement setup on balance
85
A.7 Figures
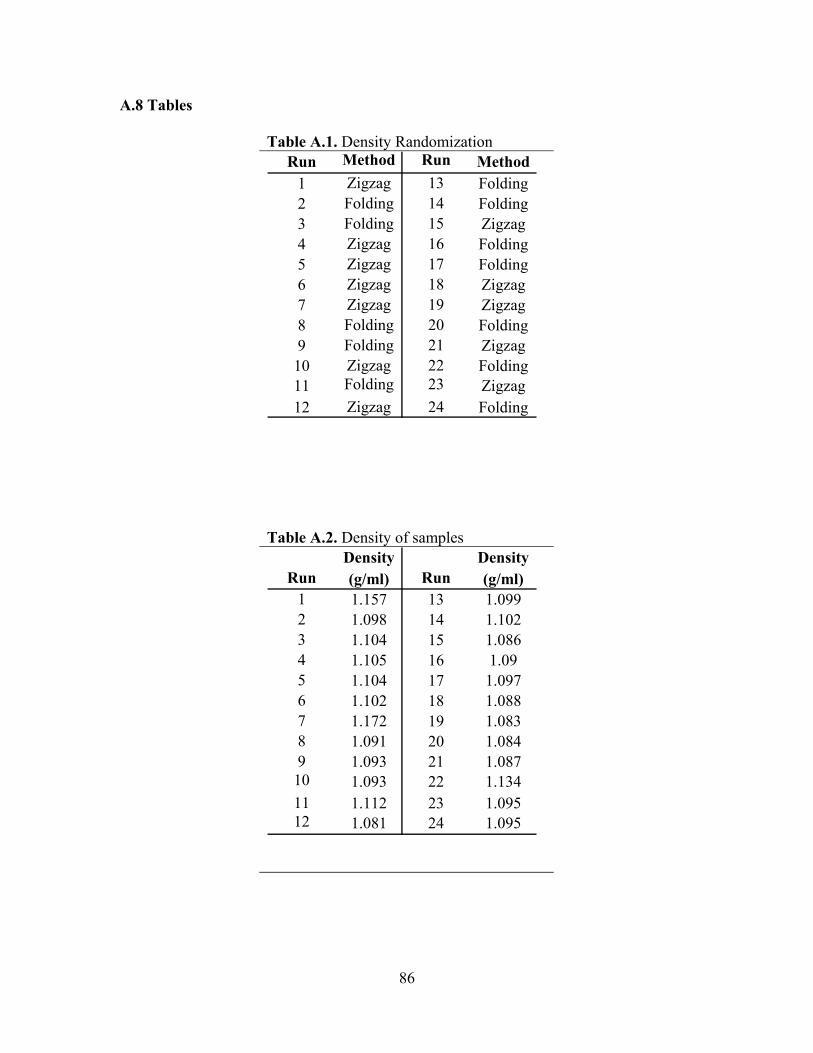
Run Method Run Method1 Zigzag 13 Folding2 Folding 14 Folding3 Folding 15 Zigzag4 Zigzag 16 Folding5 Zigzag 17 Folding6 Zigzag 18 Zigzag7 Zigzag 19 Zigzag8 Folding 20 Folding9 Folding 21 Zigzag10 Zigzag 22 Folding11 Folding 23 Zigzag12 Zigzag 24 Folding
86
A.8 Tables
Table A.1. Density Randomization
Table A.2. Density of samples
Density Density(g/ml) (g/ml)
1 1.157 13 1.0992 1.098 14 1.1023 1.104 15 1.0864 1.105 16 1.095 1.104 17 1.0976 1.102 18 1.0887 1.172 19 1.0838 1.091 20 1.0849 1.093 21 1.08710 1.093 22 1.13411 1.112 23 1.09512 1.081 24 1.095
Run Run
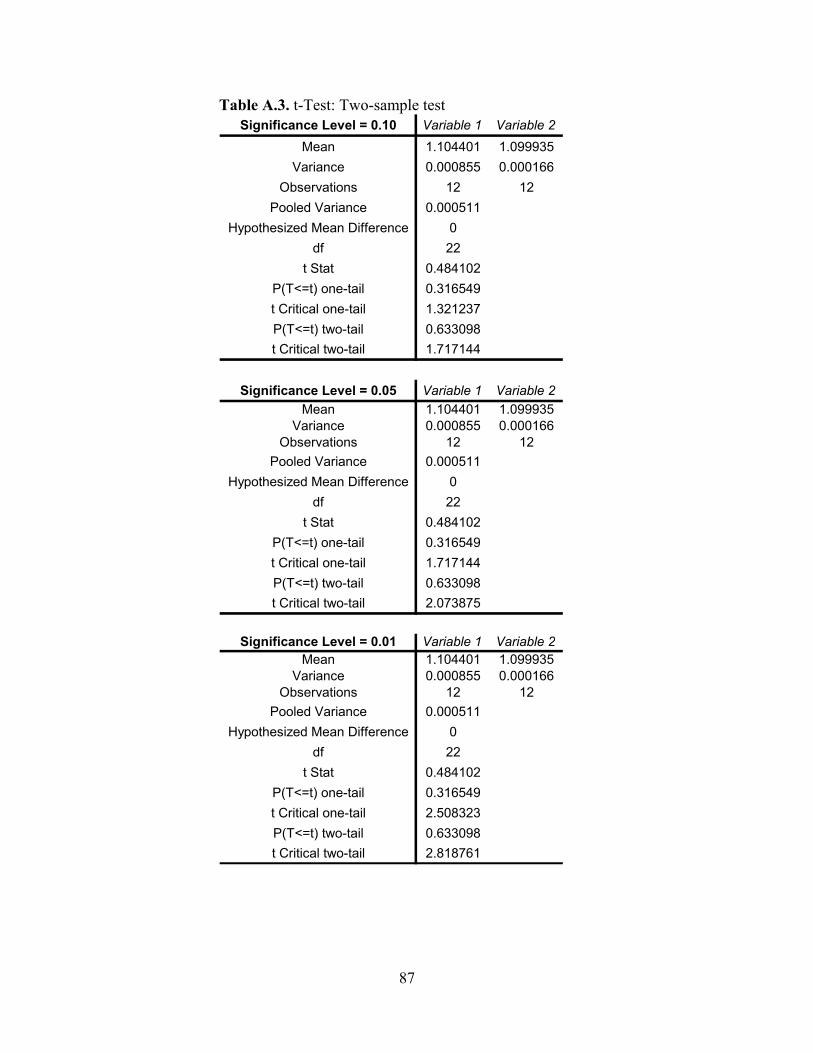
Significance Level = 0.10 Variable 1 Variable 2Mean 1.104401 1.099935
Variance 0.000855 0.000166Observations 12 12
Pooled Variance 0.000511Hypothesized Mean Difference 0
df 22t Stat 0.484102
P(T<=t) one-tail 0.316549t Critical one-tail 1.321237P(T<=t) two-tail 0.633098t Critical two-tail 1.717144
Significance Level = 0.05 Variable 1 Variable 2Mean 1.104401 1.099935
Variance 0.000855 0.000166Observations 12 12
Pooled Variance 0.000511Hypothesized Mean Difference 0
df 22t Stat 0.484102
P(T<=t) one-tail 0.316549t Critical one-tail 1.717144P(T<=t) two-tail 0.633098t Critical two-tail 2.073875
Significance Level = 0.01 Variable 1 Variable 2Mean 1.104401 1.099935
Variance 0.000855 0.000166Observations 12 12
Pooled Variance 0.000511Hypothesized Mean Difference 0
df 22t Stat 0.484102
P(T<=t) one-tail 0.316549t Critical one-tail 2.508323P(T<=t) two-tail 0.633098t Critical two-tail 2.818761
87
Table A.3. t-Test: Two-sample test

88
APPENDIX B -
PARTI YSIS
B.1 Introduction
ed use of wood plastic composites (WPCs) within the residential
buildin of
B.2 Methods and Materials
to correctly measure the rheology of the melt it is
importa ize.
ie
containing
60% 40
0x.
g industry has brought forward the need to accurately understand the rheology
the composite melts. Since the composition of the materials contained within the WPC
melt can have a direct influence on the melt rheology, it is very important to determine
the exact makeup of the materials within the melt. Therefore, the particle size of the
wood filler needs to be measured so that the mesh size is verified.
CLE SIZE ANAL
The expand
In order for the slit die
nt for the smallest die dimension to be 40 times larger than wood particle s
Therefore, this slit die design was developed around the principles of continuum flow
with a maximum wood flour particle height of 0.0635-cm (40-mesh). To validate the d
continuum assumptions, the particle size of the dispersed wood filler was analyzed using
an in-situ by using a scanning electron microscope (SEM) (Hitachi S-570).
To conduct the SEM measurements, a representative slit die extrudate
-mesh maple and 40% HDPE was randomly sampled and milled into two 5-mm
cubes. A diamond microtone was then used to surface the cubes on one face normal to
the flow direction. Each sample was sputtered with a 6.0-Å thick gold layer prior to
examining. A series of forty SEM pictures were acquired using a magnification of 49
The magnification was selected to balance edge detection of the wood particles and field

89
l (2002)
B.3 Results
measuring the particle heights, it was determined that 136 points contained
a partic
Figure
d on
of
as
determ he
ean
of view. Since every picture was 1200 pixels wide by 1500 pixels high, ten random x-y
coordinates within these ranges were assigned for each picture. These points were
constant throughout the 15 randomly chosen pictures. At each one of these x-y
coordinates the height of the particle was measured using UTHSCSA ImageToo
software. The same calibration length was used for all of the pictures since the
magnification of the images was constant throughout.
After
le, while 14 points did not. With the 136 points gathered from the SEM particle
size analysis, it was important to determine what type of distribution the particles
followed. The distribution of the wood flour particles within the melt is shown in
B.1. In order to determine if the particles were following a normal distribution, a
Kolmogorov-Smirnov (K-S) goodness of fit test (Chakravarti, 1967) was performe
the particle distribution. In order to simplify the analysis of the K-S test, Analyse-It
(2003) software was utilized on the data (Table B.1). Assuming a ß of 0.05, a p-value
<0.01 was obtained. This indicates that the particles do not follow a normal distribution
as shown in Figure B.2, where the data does not follow the linear regression line.
Since the distribution of particles did not follow a normal distribution, it w
ined that the particle heights followed a lognormal distribution (Figure B.3). T
verification that the particles heights were following a lognormal distribution was
completed following standard statistical techniques (Haan, 1977). Therefore, the m

(2)
where n = total number of samples. By transforming the particle heights using equation
(1), the new values can be checked to see if they follow a normal distribution. In order to
test this hypothesis, a K-S goodness of fit test was applied to the transformed samples
using Analyse-It software. Assuming a ß of 0.05, a p-value >0.15 was achieved, with
complete statistical results shown in Table B.2. The K-S test states that for the null
hypothesis to not be rejected, a high p value must be obtained. The ability of the data to
fit the linear regression of the K-S test is seen in Figure B.4.
90
particle height ( x ) may be determined by first transforming the individual height data
(xi) using:
lni iy x= (1)
and then computing the average as:
nyy ieex ∑==
Since the particle values were determined to follow a lognormal distribution, the
average transformed mean value of 3.29 µm was transformed back into the original
domain, resulting in an average particle height of 25.6 µm. Therefore, to validate that the
slit dimensions followed the continuum assumptions, the mean particle height was
multiplied by 40 to yield a minimum of 1.02-mm. This value is well below the 5.0-mm
slit height and does not violate the continuum requirements.
B.4 Conclusions
Since this slit die design used to measure the rheology of WPCs has never been
used on these types of filled systems, it is important to make sure that the design is
correct. The verification of the slit die design is confirmed by determining the average

91
particle height of the wood flour within the melt. Using a developed SEM technique it
has been shown that the die design is well within the restrictions of the continuum
assumptions and will allow for accurate results to be achieved when it is used to quantify
the rheological properties of the WPC melt.

92
B.5 References
Analyse-It. Version 1.71. December 11th, 2003. Analyse-it Software Ltd. Chakravarti, Laha, Roy. “Handbook of Methods of Applied Statistics.” Volume 1. John
Wiley and Sons, pp. 392-394, 1967. Haan, C.T. Statistical Methods in Hydrology. The Iowa State University Press. Ames,
Iowa. 1977 University of Texas Health Science Center at San Antonio. UTHSCSA ImageTool
Version 3. Feb. 2002

0
10
20
30
40
50
60
Freq
uenc
y
Figure B.1. Distribution of particle heights
93
B.6 Figures
-3
-2
-1
0
1
2
3
4
5
6
0 20 40 60 80 100 120 140 160 180 200
Particle Size (m-6)
Nor
mal
Qua
ntile
Figure B.2. Kolmogorov-Smirnov fit of normal data
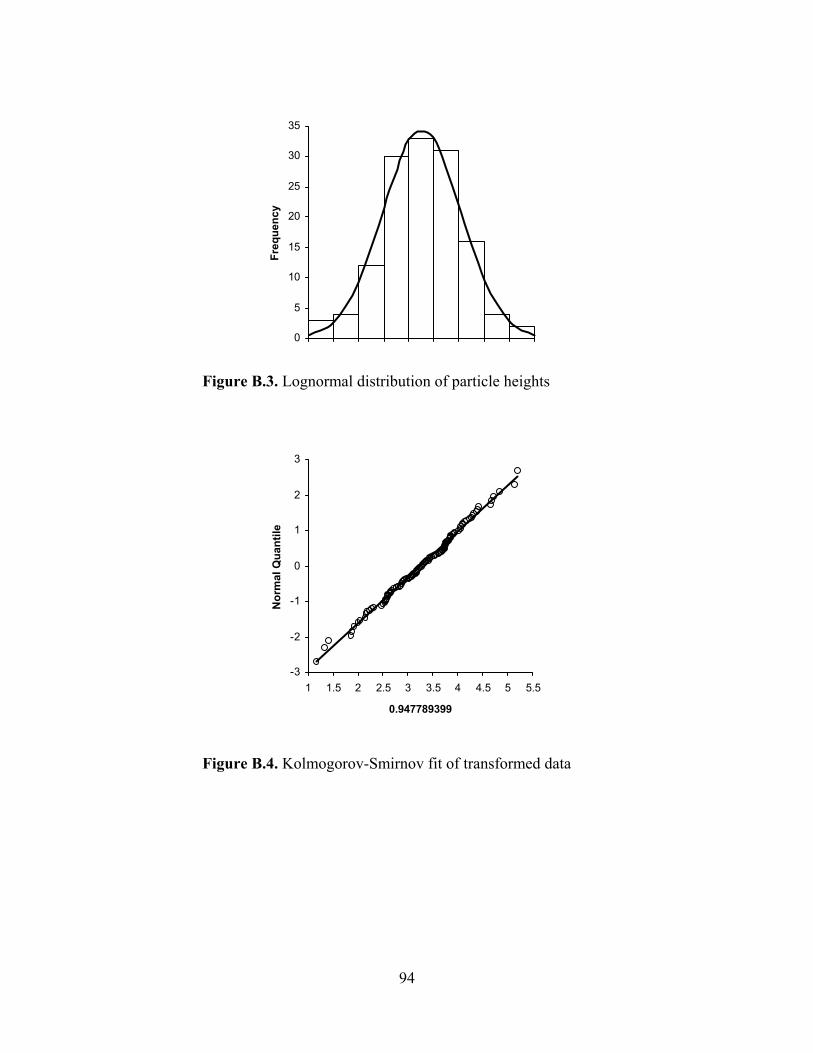
94
0
5
10
15
20
25
30
35
Freq
uenc
y
Figure B.3. Lognormal distribution of particle heights
-3
-2
-1
0
1
2
3
1 1.5 2 2.5 3 3.5 4 4.5 5 5.5
0.947789399
Nor
mal
Qua
ntile
Figure B.4. Kolmogorov-Smirnov fit of transformed data

nMean
95% CIVariance
SDSECV
Median96.2% CI
Percentile2.5th25th50th75th
97.5th
Coefficient pKolmogorov-Smirnov 1.7159 < 0.01
Skewness 2.3839 <0.0001Kurtosis 7.9084 <0.0001
43.46121.002
4.98814.8926.56
2.50584%26.56
22.530 - 31.060
34.64929.694 - 39.603
847.134929.1056
135
95
B.7 Tables
Table B.1 Normalized Data Results
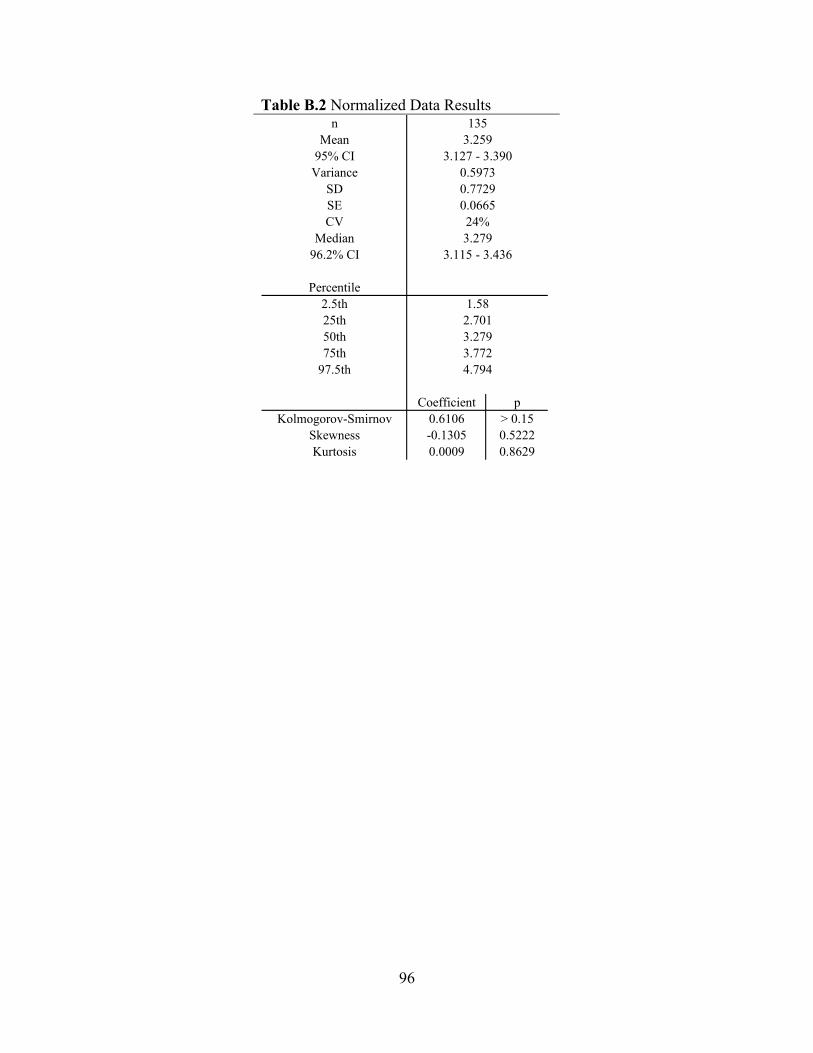
nMean
95% CIVariance
SDSECV
Median96.2% CI
Percentile2.5th25th50th75th
97.5th
Coefficient pKolmogorov-Smirnov 0.6106 > 0.15
Skewness -0.1305 0.5222Kurtosis 0.0009 0.8629
4.794
1.582.7013.2793.772
3.2793.115 - 3.436
1353.259
3.127 - 3.3900.59730.77290.066524%
96
Table B.2 Normalized Data Results