slides: threats to biological diversity: global
TRANSCRIPT

University of Colorado Law School University of Colorado Law School
Colorado Law Scholarly Commons Colorado Law Scholarly Commons
Shifting Baselines and New Meridians: Water, Resources, Landscapes, and the Transformation of the American West (Summer Conference, June 4-6)
2008
6-5-2008
SLIDES: Threats to Biological Diversity: Global, Continental, Local SLIDES: Threats to Biological Diversity: Global, Continental, Local
J. Michael Scott
Follow this and additional works at: https://scholar.law.colorado.edu/water-resources-and-
transformation-of-American-West
Part of the Administrative Law Commons, Animal Law Commons, Aquaculture and Fisheries
Commons, Biodiversity Commons, Climate Commons, Energy and Utilities Law Commons, Energy Policy
Commons, Environmental Health and Protection Commons, Environmental Law Commons, Environmental
Policy Commons, Land Use Law Commons, Law and Politics Commons, Law and Society Commons,
Legal Ethics and Professional Responsibility Commons, Natural Resources and Conservation Commons,
Natural Resources Law Commons, Natural Resources Management and Policy Commons, Oil, Gas, and
Energy Commons, State and Local Government Law Commons, Sustainability Commons, Urban Studies
and Planning Commons, Water Law Commons, and the Water Resource Management Commons
Citation Information Citation Information Scott, J. Michael, "SLIDES: Threats to Biological Diversity: Global, Continental, Local" (2008). Shifting Baselines and New Meridians: Water, Resources, Landscapes, and the Transformation of the American West (Summer Conference, June 4-6). https://scholar.law.colorado.edu/water-resources-and-transformation-of-American-West/15
Reproduced with permission of the Getches-Wilkinson Center for Natural Resources, Energy, and the Environment (formerly the Natural Resources Law Center) at the University of Colorado Law School.

Threats to Biological Diversity: Global, Continental, Local
J. Michael Scott USGS, Idaho Cooperative Fish and Wildlife
Research Unit, University Of Idaho

Adapted from Reid, MEA 2008
Source: U.S. Census

GDP 2005 - 2050 Country GDP 2005 GDP 2050
United States 9.9 trillion 35 trillion
Canada 1.2 trillion n/a
United Kingdom
1.4 trillion 3.8 trillion
Germany 1.9 trillion 3.6 trillion
France 3.1 trillion
Japan 4.0 trillion 6.7 trillion
Italy 1.2 trillion 2.1 trillion
Russia .4 trillion 5.9 trillion
China 1.7 trillion 44 trillion
India 1 trillion 27 trillion
G8 65% of world GDP

Finding
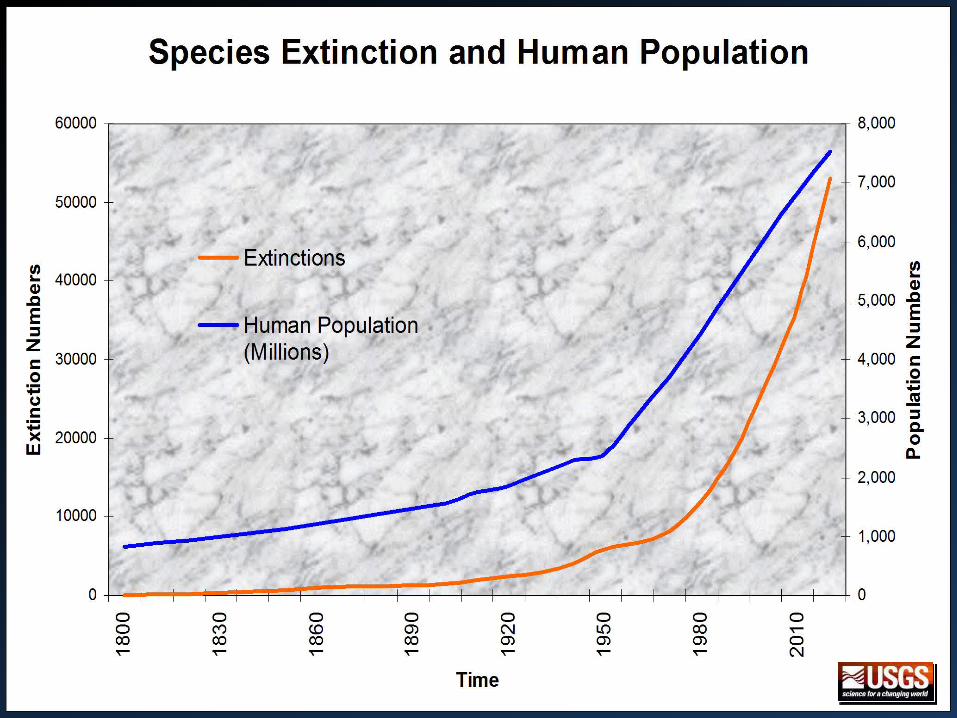
•Human actions are fundamentally, and to a significant extent irreversibly, changing the diversity of life on Earth, and most of these changes represent a loss of biodiversity.
•Changes in important components of biological diversity were more rapid in the past 50 years than at any time in human history. Projections and scenarios indicate that these rates will continue, or accelerate, in the future.
Millennium Ecosystem Assessment (MEA) 2008

Vitousek et al. 1986
“We estimate that organic material equivalent to about 40% of the
present net primary production in terrestrial ecosystems is being co-
opted by human beings each year.”

Unprecedented change: Ecosystems
– More land was converted to cropland in the 30 years after 1950 than in the 150 years between 1700 and 1850.
– 20% of the world’s coral reefs were lost and 20% degraded in the last several decades
– 35% of mangrove area has been lost in the last several decades
– Amount of water in reservoirs quadrupled since 1960
Cultivated Systems in 2000 cover 25% of Earth’s terrestrial surface
Reid, MEA 2008 Adapted from Reid, MEA 2008
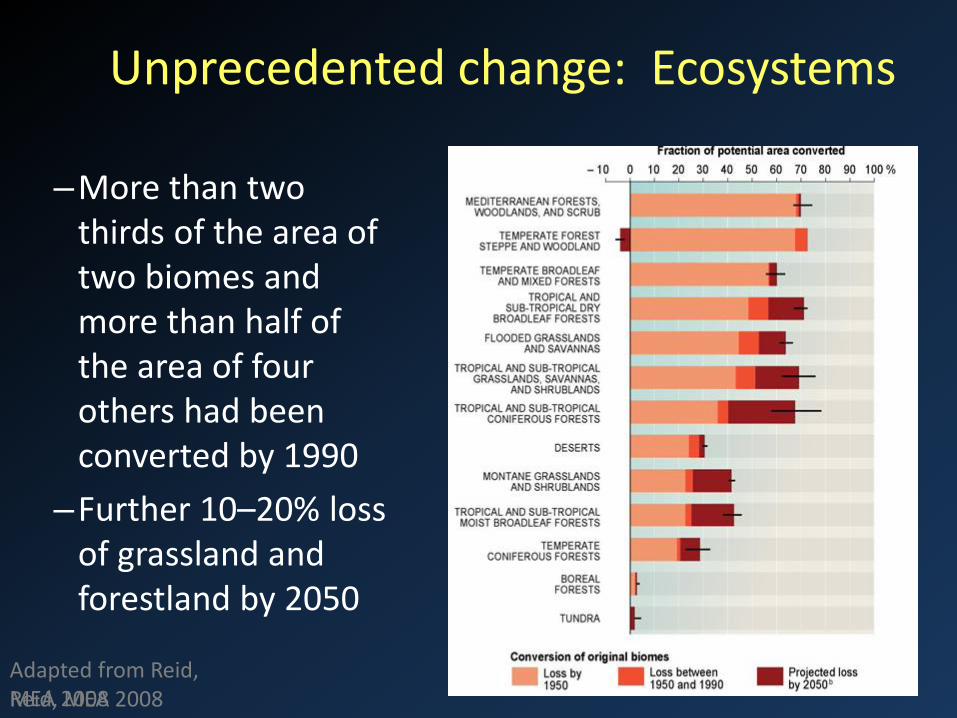
Unprecedented change: Ecosystems
–More than two thirds of the area of two biomes and more than half of the area of four others had been converted by 1990
–Further 10–20% loss of grassland and forestland by 2050
Reid, MEA 2008 Adapted from Reid, MEA 2008

Major Groups of Described Species
Arthropods (64.5%)
Plants (14.3%)
Fungi (4.2%)
Molluscs (4.2%)
Other Inverts (4.0%)
Algae (2.4%)
Protozoans (2.4%)
Nematodes (0.9%)
Viruses & Bacteria(0.5%)Vertebrates (2.7%)
Vertebrates included for comparison.
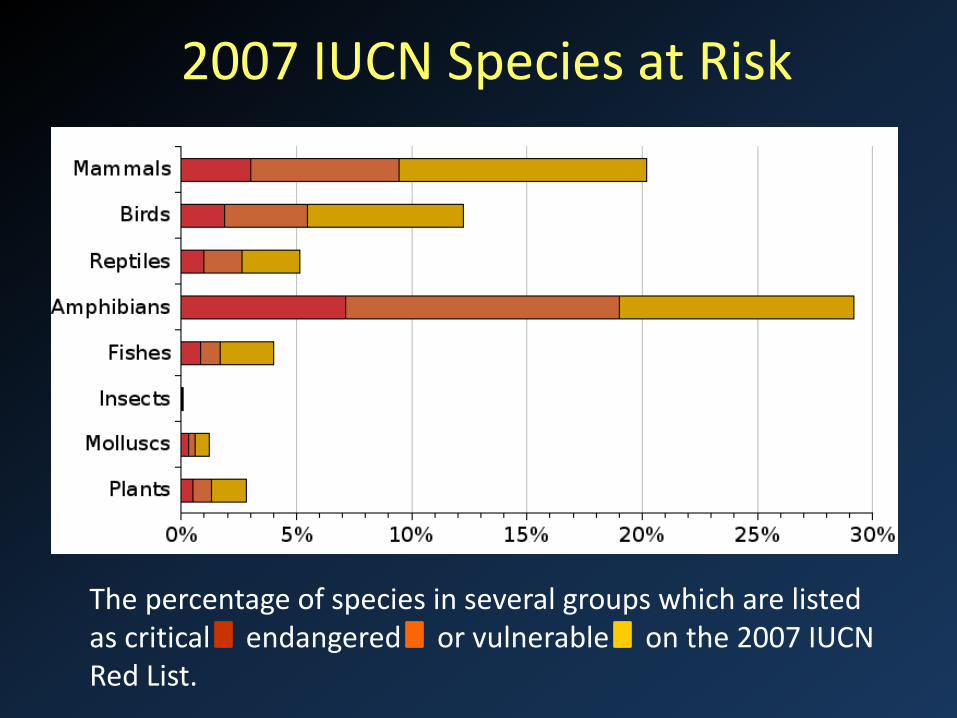
The percentage of species in several groups which are listed as critical endangered or vulnerable on the 2007 IUCN Red List.
2007 IUCN Species at Risk

Significant and largely irreversible changes to species diversity
– Distribution of species is becoming more homogenous
– Population size or range (or both) of the majority of species across a range of taxonomic groups is declining
Reid, MEA 2008 Adapted from Reid, MEA 2008

Significant and largely irreversible changes to species diversity
– Current extinction rate as much as 1,000 times higher than background rates.
– 10% to 50% of mammals, birds, amphibians, conifers, and cycads are threatened with extinction
– Expect loss of roughly 10–15% of plant species as a result of habitat loss over the period 1970–2050 in the MA scenarios
Adapted from Reid, MEA 2008

U.S. Population
0
100
200
300
400
500
600
1800 1825 1850 1875 1900 1925 1950 1975 2000 2025 2050 2075 2100
Year
Mill
ions

Projected Average Annual Percent Change in State Populations: 1995 to
2025

Housing

United States Interstate Highways
Highway Miles in 1958 Highway miles present (2004)
4,831 miles 46,837 miles
USDOT, 2005

Las Vegas 1973 2000

Hetch Hetchy
1911 2000

Major Threats to Biodiversity
0
20
40
60
80
100
HabitatDestruction
ExoticSpecies
Pollution Overharvest Disease
% o
f Spe
cies
Affe
cted
by
Caus
e
Wilcove et al. 2000

Wetlands Loss
• In the previous decade, from 1975 to 1985, wetland losses amounted to nearly three million acres.
• United States Fish and Wildlife Service estimated that during the decade 1985-1995, wetlands continued to disappear at an average rate of 117,000 acres a year.
NY Times 1997

Status
0100200300400500600700800900
1000
1967
1970
1973
1976
1979
1982
1985
1988
1991
1994
1997
2000
2003
ThreatenedEndangered
# of
List
ed S
peci
es
(As of Oct. 31 2003, N=1260)
All listed species were threatened before being endangered… We are not getting
ahead of the curve!


Loss of CRP lands 9/30/2007 – 3/30/2008
Year Acres Change
9/30/2007 36,770,984
3/30/2008 34,697,697 -2,073,287
State Acres 2007 Acres 2008 Change
Washington 1,557,212 1,542,153 -15,059
Oregon 567,565 561,496 -6,069
Idaho 825,102 778,179 -45,923
California 148,899 129,297 -19,602
Nevada n/a n/a n/a
Montana 3,480,851 3,313,131 -167,720
Utah 208,664 199,074 -9,590
Colorado 2,472,094 2,435,201 -136,893
Arizona n/a n/a n/a
New Mexico 590,399 565,749 -24,650
Wyoming 284,287 272,596 -11,691
US
11 western states
USDA FSA, Conservation Reserve Program Statistics

Global Climate Change

– By the end of the century, climate change and its impacts may be the dominant direct driver of biodiversity loss and changes in ecosystem services globally
– Harm to biodiversity will grow worldwide with increasing rates of change in climate and increasing absolute amounts of change
Changes in direct drivers: Climate Change
Climate Change
Adapted from Reid, MEA 2008

Northern Hemisphere Temperature Anomaly
Adapted from Hughes 2000, TREE 15:56-61; Mann et al. 1998, GRL

Climate Change Review
• In the next 100 years: – The global temperature
predicted to rise 3.2 –7.2 F; – Sea-level predicted to
rise 0.91 – 1.41 feet; – Tropical storms
increased in number and intensity.

Major Implications
• Change in ecosystem drivers – Fire – Hydrology – Temperature and weather
events • Changes in species’ distributions
and phenologies • Regime shift in ecological
communities
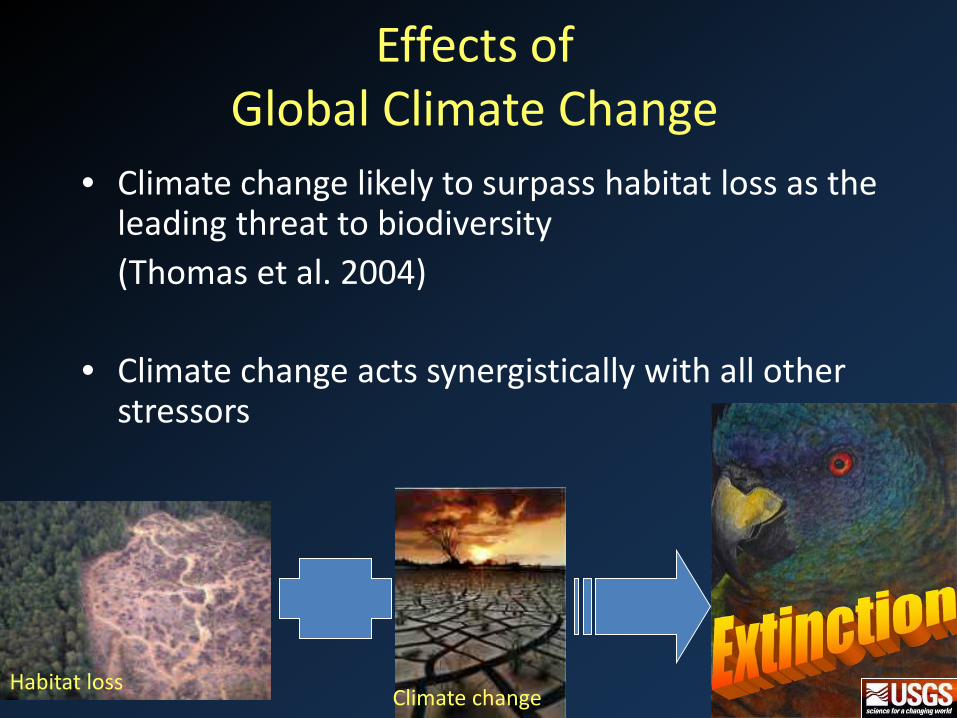
Effects of Global Climate Change
• Climate change likely to surpass habitat loss as the leading threat to biodiversity
(Thomas et al. 2004) • Climate change acts synergistically with all other
stressors
Habitat loss Climate change


Blackwater NWR
Sea level projected to rise 3mm/yr:
1 foot rise by 2050
2 feet rise by 2100
Sea Level Rise

Increase in the intensity and frequency of tropical storms
Rita
http://coastal.er.usgs.gov/hurricanes/rita/images/hurricane-ritaLG.jpg
Katrina
http://www.ascn92.dsl.pipex.com/hurricane_rita_damage/hurricane_rita_050924_Lafitte_LA.jpg

Altered Species Distributions
Edith’s checkerspot butterfly shifted range northward (Parmesan 1996, McLaughlin et al. 1999)
CA shoreline species shifting northwards (Barry et al. 1995)
90% decline in pop. of Sooty Shearwater (1987 – 1994) (Veit et al. 1997)
Polar bears increasingly using coastal areas as sea ice melts earlier and freezes later (Gleason et al. 2006, Schliebe et al. 2006)
Uncompahgre fritillary butterfly on brink of extinction (Britten et al. 1994)

Altered Phenologies
Egg laying date of NA tree swallows ~ 9 days earlier (1959 to 1991) (Dunn & Winkler 1999)
Earlier arrival of migrants (Root et al. 2004)
Lilac blooming ~4 days earlier (NE)
89 of 100 flowering plants in DC area blooming 4.5 days earlier in 2000 vs. 1970.

You’ve got to know when to hold ‘em Know when to fold ‘em Know when to walk away And know when to run.
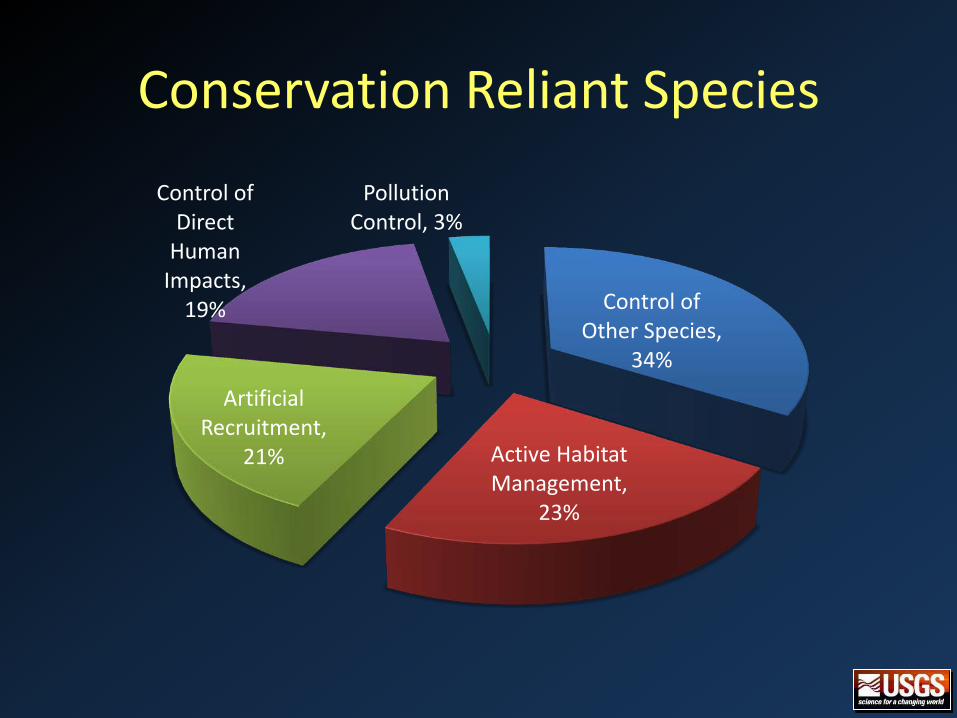
Conservation Reliant Species
Control of Other Species,
34%
Active Habitat Management,
23%
Artificial Recruitment,
21%
Control of Direct
Human Impacts,
19%
Pollution Control, 3%

“The harmful effects of the degradation of ecosystem services (the persistent decrease in the capacity of an ecosystem to deliver services) are being borne disproportionately by the poor, are contributing to growing inequities and disparities across groups of people, and are sometimes the principal factor causing poverty and social conflict.”
Millennium Ecosystem Assessment, 2008

Forecast of Development Patterns in 2030 for Washington D.C./Baltimore
Development 80%
Claire Jantz
Development 20%
Current Trend Ecologically Sustainable