slide presentation from betterbricks/ashrae workshop
TRANSCRIPT

Fred Bauman, PECenter for the Built Environment (CBE)
All contents copyright (C) 2000 The Regents of the University of California
1
Designing UFAD SystemsBetterBricks Workshop, September 7-8, 2005
Designing Underfloor Air Distribution (UFAD) Systems
Workshop forBetterBricks
Cascadia Region of Green Building CouncilPuget Sound / Oregon Chapters of ASHRAE
Seattle – Sept. 7, Portland – Sept. 8, 2005
Fred Bauman, P.E.Center for the Built Environment, University of California, Berkeley
2
Acknowledgments
Taylor EngineeringAllan Daly
Pacific Gas & Electric Co.
ASHRAE
Course Development
Projects, ImagesArup, Flack + Kurtz, Nailor Industries, EH Price, Tate Access Floors, York International
3
Agenda9:00-9:10 Opening Comments9:10-9:30 Introduction 9:30-10:10 Diffusers and Stratification10:10-10:50 Underfloor Plenums10:50 -11:05 Break
11:05-11:45 Load Calculations, Energy11:45-12:00 Comfort and IAQ12:00 -1:00 Lunch
1:00-1:20 Horizontal and Vertical Distribution1:20-1:35 Commissioning and Operations1:35-1:50 Post-Occupancy Evaluations 1:50-2:05 How to Decide to Go with UFAD?2:05-2:15 Wrap-Up, Conclusions2:15 -2:30 Break
2:30-4:00 Panel Discussion
Introduction
9:10 – 9:30
5
CBE Organization
Industry/University Cooperative Research Center (I/UCRC)
National Science Foundation provides support and evaluation
Industry Advisory Board shapes research agenda
Semi-annual meetings emphasize interaction, shared goals and problem solving
6
CBE Industry Partners
Armstrong World Industries
Arup*
California Department of General Services
California Energy Commission
Charles M. Salter Associates
E.H. Price Ltd.
Flack + Kurtz, Inc.
HOK
Keen Engineering, Inc.
Pacific Gas & Electric Co.
RTKL
Skidmore Owings and MerrillSteelcase, Inc.Syska Hennessy GroupTate Access Floors Inc.*Taylor Engineering Team:
• Taylor Engineering• Guttmann & Blaevoet• Southland Industries• Swinerton Builders
TraneU.S. Department of Energy (DOE)*U.S. General Services Administration (GSA)*
York International Corporation
*founding partner
Fred Bauman, PECenter for the Built Environment (CBE)
All contents copyright (C) 2000 The Regents of the University of California
2
Designing UFAD SystemsBetterBricks Workshop, September 7-8, 2005
7
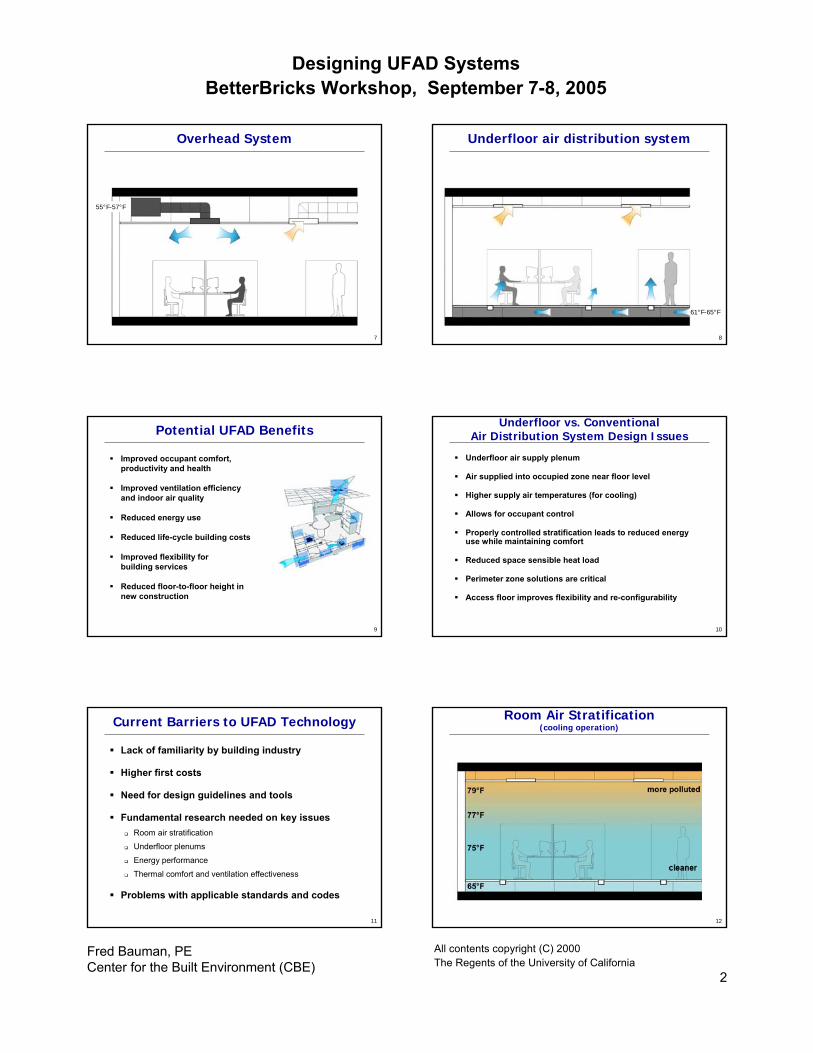
Overhead System
55°F-57°F
8
Underfloor air distribution system
61°F-65°F
9
Potential UFAD Benefits
Improved occupant comfort, productivity and health
Improved ventilation efficiency and indoor air quality
Reduced energy use
Reduced life-cycle building costs
Improved flexibility for building services
Reduced floor-to-floor height in new construction
10
Underfloor vs. Conventional Air Distribution System Design Issues
Underfloor air supply plenum
Air supplied into occupied zone near floor level
Higher supply air temperatures (for cooling)
Allows for occupant control
Properly controlled stratification leads to reduced energy use while maintaining comfort
Reduced space sensible heat load
Perimeter zone solutions are critical
Access floor improves flexibility and re-configurability
11
Current Barriers to UFAD Technology
Lack of familiarity by building industry
Higher first costs
Need for design guidelines and tools
Fundamental research needed on key issuesRoom air stratification
Underfloor plenums
Energy performance
Thermal comfort and ventilation effectiveness
Problems with applicable standards and codes
12
Room Air Stratification(cooling operation)

Fred Bauman, PECenter for the Built Environment (CBE)
All contents copyright (C) 2000 The Regents of the University of California
3
Designing UFAD SystemsBetterBricks Workshop, September 7-8, 2005
13
Floor Construction
14
Integrated Service Plenum
15
Underfloor Air & Power
PLUG & PLAY POWER and CONTROLS
Modular Wiring
VAV
Diffuser
16
Underfloor HVAC Concept
17
ASHRAE Research Project RP-1064:UFAD Design Guide
Project start: September 1999
Primary author – Fred Bauman
Contributing author – Allan Daly
Sponsored by ASHRAE and CBE
Technical oversight by TC 5.3, Room Air Distribution
Guide published by ASHRAE in December 2003
Available from ASHRAE bookstore
Developed ASHRAE Professional Development Seminar (PDS)
18
ASHRAE UFAD Design Guide
CONTENTS (243 pp.)1. Introduction2. Room Air Distribution3. Thermal Comfort and
Indoor Air Quality4. Underfloor Air Supply
Plenums5. UFAD Equipment6. Controls, Operation, and
Maintenance7. Energy Use8. Design, Construction, and
Commissioning
9. Perimeter and Special Systems
10. Cost Considerations11. Standards, Codes, and
Ratings12. Design Methodology13. Examples14. Future Directions15. Glossary16. References and
Annotated Bibliography17. Index

Fred Bauman, PECenter for the Built Environment (CBE)
All contents copyright (C) 2000 The Regents of the University of California
4
Designing UFAD SystemsBetterBricks Workshop, September 7-8, 2005
19
Development of UFAD Design Guide
Design Guide materialResearch (laboratory, field, simulation)
Design experience (literature, interviews, case studies)
Manufacturer’s literature
Includes UFAD and closely related task/ambient conditioning (TAC) systems
Covers topics in which important differences exist between UFAD and conventional overhead design
Identifies areas where more work is needed
20
Current status of UFAD technology
Strong interest due to several attractive featuresCurrent database of UFAD projects in North America
~300 installations
~50-55 million ft2
Routinely considered as HVAC design option
Ongoing research and experience in the field are generating new and improved information
Problems found in completed UFAD installations are often the same as those found in overhead buildings
Conservative design
Poor construction practice
Inadequate commissioning, controls, and operation
21
Raised floor and UFAD adoption
1995: Less than 3% of new office buildings had raised floors, UFAD a “fringe” element
2002: 7% of new offices used raised floors,15% of these with UFAD systems.
2004: 14% -15% have raised floors, ~ 45% of these with UFAD systems.
0%
4%
8%
12%
16%
20%
1995 1997 1999 2001 2003 2005Year
% o
f New
Offi
ce C
onst
ruct
ion
Raised FloorUFAD
22
How Many UFAD Projects are Installed?
Through 2000, approximately 80 projects representing some 20 million sq ft in US.
Between 2000-2002, the number of new projects represented another 25 million sq ft.
CBE currently maintains database of North American UFAD projects with over 300 installations representing 50-55 million sq ft.
The jobs are getting larger. The Bank One Center in Chicago (1.5 million sq ft) was completed in 2003 and several more projects over 1 million sq ft are now in design or under construction.
Diffusers and Stratification
9:30 – 10:10
24
Diffuser types
Swirl
Variable area (VA)
Swirl, horizontal discharge
Linear bar grille

Fred Bauman, PECenter for the Built Environment (CBE)
All contents copyright (C) 2000 The Regents of the University of California
5
Designing UFAD SystemsBetterBricks Workshop, September 7-8, 2005
25
Swirl floor diffuser
Swirl Diffusers
26
Personal control of swirl diffuserRotate face plate
27
Personal control of swirl diffuser
28
Individual Plenum Box
29
Office cubicles
One diffuser per workstation30
Too many!

Fred Bauman, PECenter for the Built Environment (CBE)
All contents copyright (C) 2000 The Regents of the University of California
6
Designing UFAD SystemsBetterBricks Workshop, September 7-8, 2005
31 32
Variable-AreaDiffuser
ProprietaryProduct
33
Variable Air Volume Performance
Maintain constant discharge velocity even as air reduces
CONSISTANT VELOCITY - VARIABLE VOLUME
34
Bar Grilles in Perimeter
35
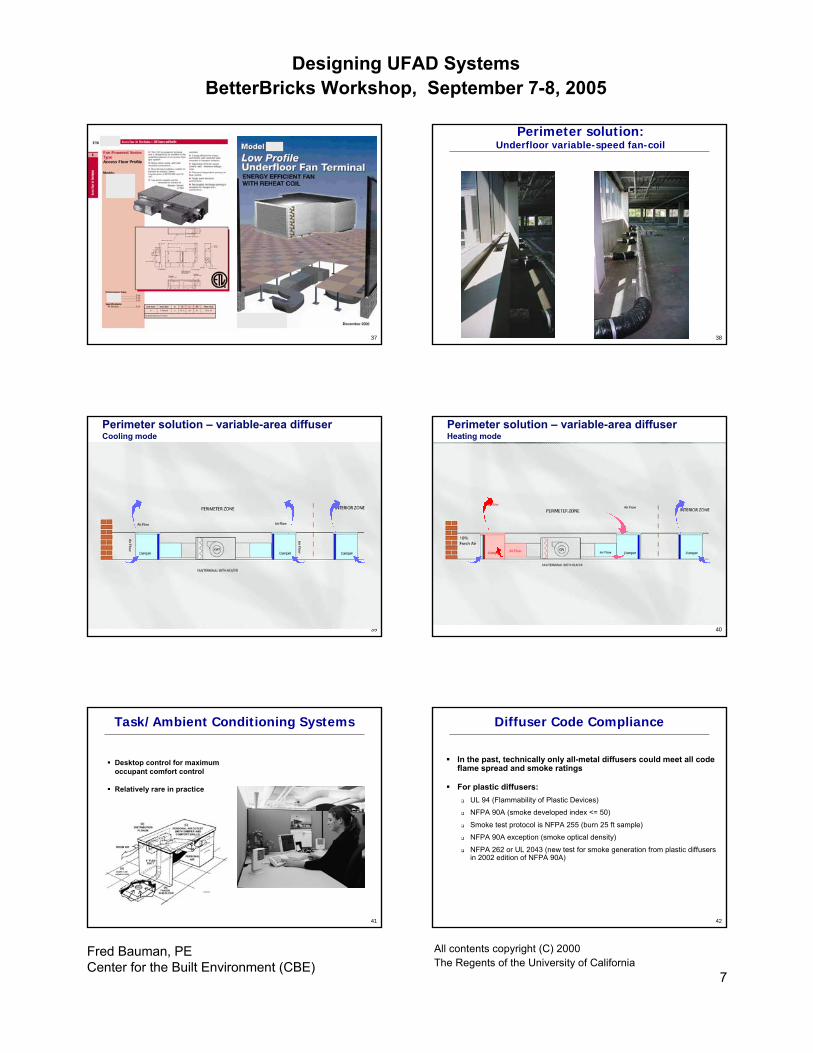
Perimeter solution:Underfloor variable-speed fan-coil
Raised Access Floor
Return Air Plenum
Return Air Grille
Linear Bar Diffuser
Flex Duct
Fan Coil w/ ECM motor
Glazing
T
Heating Coil
No U/A diffusers in perimeter zones
36
Heating Loop Output
130°F
60°F
Discharge AirTemperatureSetpoint
Fan
Spee
d
Max Fan Speed
Design Fan Speed
30% Design Fan Speed
Lowest PossibleFan Speed(~15% Max
Fan Speed)
Deadband Cooling Loop Output
Airf
low
Design Airflow
30% Design Airflow
Minimum Airflow(due to pressurized plenum)
Airflow
Fan Speed
Variable Speed Fan-Coil Control
Fred Bauman, PECenter for the Built Environment (CBE)
All contents copyright (C) 2000 The Regents of the University of California
7
Designing UFAD SystemsBetterBricks Workshop, September 7-8, 2005
37 38
Perimeter solution:Underfloor variable-speed fan-coil
39
Perimeter solution – variable-area diffuserCooling mode
40
Perimeter solution – variable-area diffuserHeating mode
41
Task/Ambient Conditioning Systems
Desktop control for maximum occupant comfort control
Relatively rare in practice
42
Diffuser Code Compliance
In the past, technically only all-metal diffusers could meet all code flame spread and smoke ratings
For plastic diffusers:UL 94 (Flammability of Plastic Devices)
NFPA 90A (smoke developed index <= 50)
Smoke test protocol is NFPA 255 (burn 25 ft sample)
NFPA 90A exception (smoke optical density)
NFPA 262 or UL 2043 (new test for smoke generation from plastic diffusers in 2002 edition of NFPA 90A)

Fred Bauman, PECenter for the Built Environment (CBE)
All contents copyright (C) 2000 The Regents of the University of California
8
Designing UFAD SystemsBetterBricks Workshop, September 7-8, 2005
43
Room air stratification(cooling operation)
44
Overhead Air Distribution System
Mixing system tries to maintain uniform temperature and ventilation conditions throughout space
45
Displacement Ventilation System
Minimize mixing in occupied zone Stratification height (SH) separates upper and lower zones
46
Underfloor Air Distribution System
Increased mixing up to throw height (TH)Diffuser throw below stratification height (SH)
47
Underfloor Air Distribution System
Diffuser throw above stratification level (SH)48
Air Patterns
displacement
swirl

Fred Bauman, PECenter for the Built Environment (CBE)
All contents copyright (C) 2000 The Regents of the University of California
9
Designing UFAD SystemsBetterBricks Workshop, September 7-8, 2005
49
Diffuser Comparison
ModelDischarge
Setting Airflow
Vertical Throw to
50 fpmClear Zone
Radius[ft3/min] [ft] [ft]
Vertical 100 4 - 6 1.5Vertical 75 2.5 - 4.5 1.5
Variable Vertical 150 8 2.0Area Full Spread 110 5 4.5
Vertical 75 / ft 25 -Vertical 40 / ft 18 -
Swirl
Bar
50
Room Air Stratification Testing
ApproachFull-scale laboratory tests of commercially available floor diffusers in realistic office setting.Study impact of various design and operating parameters on room air stratification (RAS).
SignificanceControl of stratification is crucial to:
Proper designSystem sizingEnergy efficient operationThermal comfortIndoor air quality
51
Stratification test results Effect of airflow rate: constant load, swirl diffusers, interior zone
0
1
2
3
4
5
6
7
8
9
10
11
69 70 71 72 73 74 75 76 77 78 79 80 81 82
Room Temperature, °F
Hei
ght,
ft
1.0 cfm/sq. ft0.6 cfm/sq. ft0.3 cfm/sq. ft
5°F ∆TASHRAE Std.55-2004
Still satisfies vertical temperature difference (5°F) with 40% less air
52
Results – Interior office, swirl diffusers
RAS profiles for high room load, 6 workstationsNormalized to 65°F SAT and common deltaT
0
1
2
3
4
5
6
7
8
9
10
65 66 67 68 69 70 71 72 73 74 75 76 77 78 79
Room Temperature, °F
Hei
ght,
ft
High throw, 2 diffusers
Low throw, 8 diffusers
High throw, 2 diffusers
Low throw, 10 diffusers
Lowest throw, 7 DV diffusers
Delta T = 8°F Delta T = 13°F
Low room temperature
High room temperature
Swirl diffusers
53
Variable Area vs. Swirl
0
1
2
3
4
5
6
7
8
9
10
11
69 70 71 72 73 74 75 76 77 78 79 80 81 82
Room Temperature, °F
Hei
ght,
ft
SW-1SW-2VA-1VA-2VA-3
VA Diffuser
Swirl Diffuser
T e s t
R o o m L o a d W /ft 2
R o o m A ir f lo w c fm /f t 2
D if fu s e r f lo w ra te ,
(% o f d e s ig n )
5 0 f p m T h ro w
f t V A -1 2 .6 0 .8 7 0 % 7 V A -2 2 .9 0 .8 3 0 % ~ 7 V A -3 1 .8 0 .4 4 0 % ~ 7 S W -1 2 .5 0 .6 9 0 % ~ 4 S W -2 2 .7 0 .6 4 0 % ~ 2
Source: ASHRAE Journal May 2002
54
Stratification Test Results Effect of supply air temperature: constant load, swirl diffusers, interior zone
Fred Bauman, PECenter for the Built Environment (CBE)
All contents copyright (C) 2000 The Regents of the University of California
10
Designing UFAD SystemsBetterBricks Workshop, September 7-8, 2005
55
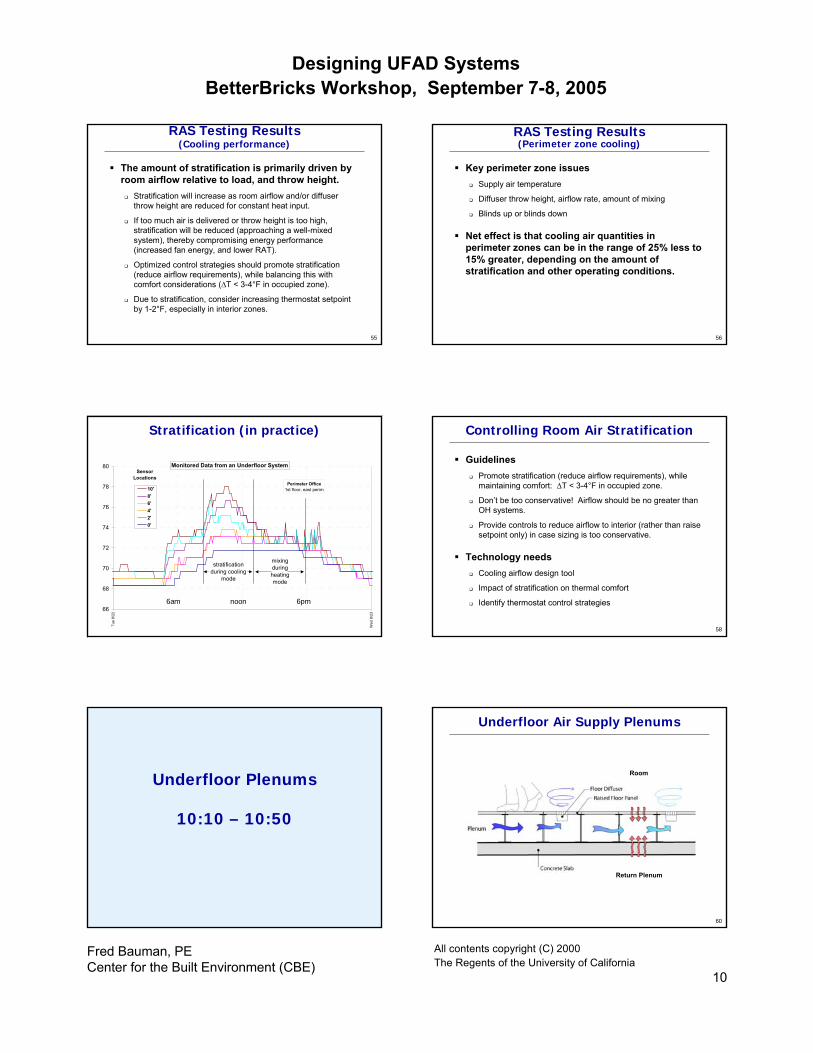
RAS Testing Results(Cooling performance)
The amount of stratification is primarily driven by room airflow relative to load, and throw height.
Stratification will increase as room airflow and/or diffuser throw height are reduced for constant heat input.
If too much air is delivered or throw height is too high, stratification will be reduced (approaching a well-mixed system), thereby compromising energy performance (increased fan energy, and lower RAT).
Optimized control strategies should promote stratification (reduce airflow requirements), while balancing this with comfort considerations (∆T < 3-4°F in occupied zone).
Due to stratification, consider increasing thermostat setpoint by 1-2°F, especially in interior zones.
56
RAS Testing Results (Perimeter zone cooling)
Key perimeter zone issuesSupply air temperature
Diffuser throw height, airflow rate, amount of mixing
Blinds up or blinds down
Net effect is that cooling air quantities in perimeter zones can be in the range of 25% less to 15% greater, depending on the amount of stratification and other operating conditions.
57
Perimeter Office1st floor, east perim
66
68
70
72
74
76
78
80
Tue
8/22
Wed
8/2
3
10'8'6'4'2'0'
Monitored Data from an Underfloor System
stratificationduring cooling
mode
mixingduringheatingmode
SensorLocations
noon6am 6pm
Stratification (in practice)
58
Controlling Room Air Stratification
GuidelinesPromote stratification (reduce airflow requirements), while maintaining comfort: ∆T < 3-4°F in occupied zone.
Don’t be too conservative! Airflow should be no greater than OH systems.
Provide controls to reduce airflow to interior (rather than raise setpoint only) in case sizing is too conservative.
Technology needsCooling airflow design tool
Impact of stratification on thermal comfort
Identify thermostat control strategies
Underfloor Plenums
10:10 – 10:50
60
Underfloor Air Supply Plenums
Room
Return Plenum

Fred Bauman, PECenter for the Built Environment (CBE)
All contents copyright (C) 2000 The Regents of the University of California
11
Designing UFAD SystemsBetterBricks Workshop, September 7-8, 2005
61
Plenum Design Variations
Pressurized plenumPassive diffusers
Most common approach and focus of current practice
Zero-pressure plenumActive (fan-powered) diffusers
Not as popular due to perceived higher costs
Fully ductedNot as popular due to high cost and lack of flexibility
Most designs are hybrid solutions
62
Airflow Performance Issues
Objective – deliver desired amount of airPressurized vs. zero-pressure
Reduced static pressure
Plenum height (obstructions)
Size of plenum zone
Air leakage
Plenum inlet conditions
Inlet velocity
Inlet direction (open, vanes, plates)
Location in zone
Number of inlets in zone
63
Underfloor Air Supply PlenumsResearch Results
Phase 1 – Airflow PerformanceObjective Investigate practical plenum configuration issues, including minimum plenum height, for which acceptable airflow performance can be achieved in pressurized underfloor plenums.
ApproachEmpirical experiments in full-scale underfloor air supply plenum test facility.
64
Full-Scale Plenum Test Facility
40'
80'
M M M
MM M M
M M
M
Flowmeasuring
station
Fan
23"x 23"Duct
Plenum inlet
Measurementpoint (typical)
Removablefloor panels (2)Obstruction #1
Obstruction #2
4' Underfloorbarrier
4" x 14" Floor grills(typical)
5' 10' 10' 10' 10' 10' 10' 10' 5'
Raised Floor
Concrete Slab
24'19'
14'10'
Section View
Plan View
65
Plenum Schematic Cross-Section
1-inch Floor Panel
Concrete Slab
1"
2"
2"
2"
2" Po
lysty
ren
e B
locks
2"3"
7"
Finish Floor Level
Plenum Schematic Cross-Section
66
Results
Airflow delivery is very uniform from an 8-inch pressurized underfloor plenum over a full range of supply volumes (0.5-1.5 cfm/ft2), even at a distance of 80 feet from the plenum inlet.
Uniformity (less than 10% variation) is preserved for solid obstructions with only 1.5 inches of clear space.

Fred Bauman, PECenter for the Built Environment (CBE)
All contents copyright (C) 2000 The Regents of the University of California
12
Designing UFAD SystemsBetterBricks Workshop, September 7-8, 2005
67
Air Flow Ratio: 8-inch plenum
70%
80%
90%
100%
110%
120%
130%
0 10 20 30 40 50 60 70 80
Distance from Fan Inlet (ft)
Del
iver
ed A
ir Fl
ow R
atio
(M
easu
red
flow
/Uni
form
flow
)
1.5 cfm/sf
1.0 cfm/sf
0.5 cfm/sf
68
Publication
“How Low Can You Go?”Air Flow Performance of
Low-Height Underfloor Plenums
F. Bauman, P. Pecora, and T. Webster Center for the Built Environment
University of California Berkeley, California
October 1999
PDF available from: www.cbe.berkeley.edu/underfloorair
69
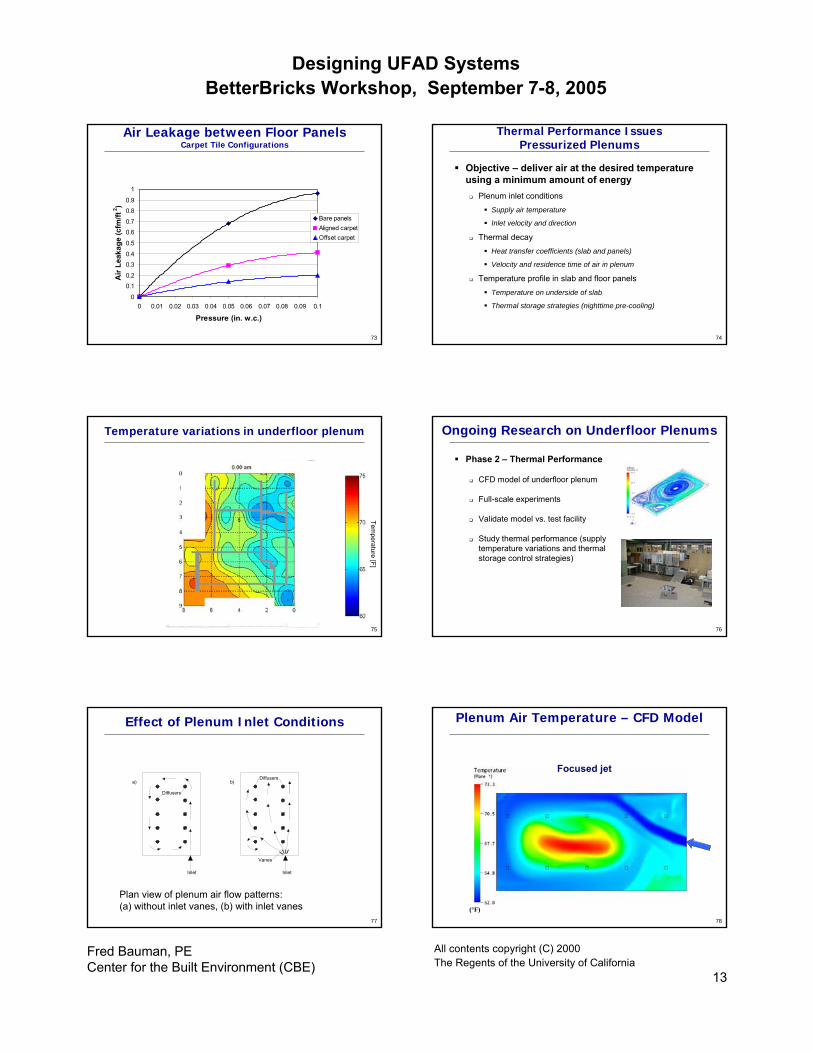
Plenum Air Leakage
Air leakage from a pressurized plenum may impact energy use and can impair system performance if not accounted for.
Types of leakageLeakage between floor panelsLeakage due to poor sealing and construction
Floor Diffuser Floor Panel Air Leakage
70
Smoke TestAir leakage between Floor Panels
71
Air Leakage Test Setup
72
Carpet Tile Configurations
Aligned Offset
Fred Bauman, PECenter for the Built Environment (CBE)
All contents copyright (C) 2000 The Regents of the University of California
13
Designing UFAD SystemsBetterBricks Workshop, September 7-8, 2005
73
0
0.1
0.2
0.3
0.4
0.5
0.6
0.7
0.8
0.9
1
0 0.01 0.02 0.03 0.04 0.05 0.06 0.07 0.08 0.09 0.1
Pressure (in. w.c.)
Air
Leak
age
(cfm
/ft2 )
Bare panelsAligned carpetOffset carpet
Air Leakage between Floor PanelsCarpet Tile Configurations
74
Thermal Performance IssuesPressurized Plenums
Objective – deliver air at the desired temperature using a minimum amount of energy
Plenum inlet conditionsSupply air temperature
Inlet velocity and direction
Thermal decayHeat transfer coefficients (slab and panels)
Velocity and residence time of air in plenum
Temperature profile in slab and floor panels
Temperature on underside of slab
Thermal storage strategies (nighttime pre-cooling)
75
Temperature variations in underfloor plenumTem
perature [F]
76
Ongoing Research on Underfloor Plenums
Phase 2 – Thermal Performance
CFD model of underfloor plenum
Full-scale experiments
Validate model vs. test facility
Study thermal performance (supply temperature variations and thermal storage control strategies)
77
Effect of Plenum Inlet Conditions
a)
Inlet
Diffusers
Diffusersb)
Inlet
Vanes
Plan view of plenum air flow patterns: (a) without inlet vanes, (b) with inlet vanes
78
Plenum Air Temperature – CFD Model
Focused jet
(°F)

Fred Bauman, PECenter for the Built Environment (CBE)
All contents copyright (C) 2000 The Regents of the University of California
14
Designing UFAD SystemsBetterBricks Workshop, September 7-8, 2005
79
CFD model: Particle visualization
Temperature (°F)
80
Full-Scale Plenum Test Facility
81
Underfloor plenum guidelines
Airflow delivery and pressure distributionQuite uniform across open pressurized plenum zone
LeakageAccount for leakage into occupied space in design airflow calculations
Careful attention to construction quality and sealing of plenum
Recommend leak test at end of construction (guidelines needed)
Thermal decay 50-65 ft (15-20 m) maximum to furthest diffuser
Plenum inlet conditions can be important
Break
10:50 – 11:05
Load Calculations,Energy
11:05 - 11:45
84
Does UFAD Require More Air?
Underfloor:Supply Temp: 63 F
Room Setpoint: 75 F
Space Heat Load: 17,297 Btu/hr
CFM = 17,291 Btu/hr = 1,335 CFM
1.1 Btu/hr-cfm-F x (75F-63F)
Overhead:Supply Temp: 55 F
Room Setpoint: 75 F
Space Heat Load: 17,297 Btu/hr
CFM = 17,297 Btu/hr = 786 CFM
1.1 Btu/hr-cfm-F x (75F-55F)
Assuming complete mixing:
Answer: No! The assumption of complete mixing is incorrect!

Fred Bauman, PECenter for the Built Environment (CBE)
All contents copyright (C) 2000 The Regents of the University of California
15
Designing UFAD SystemsBetterBricks Workshop, September 7-8, 2005
85
Overhead Air Distribution System
Mixing system tries to maintain uniform temperature and ventilation conditions throughout space
86
Underfloor Air Distribution System
Increased mixing up to throw height (TH)Diffuser throw below stratification height (SH)
87
Heat Transfer in UFAD Systems
88
Energy Flows in Stratified UFAD System
BackgroundIn a conventional building using an overhead well-mixed system, 100% of the space heat gains are removed by warm return air leaving the room at ceiling level (heat extraction).
QuestionHow is heat removed from a stratified room in a multi-story building with UFAD?
ApproachAssumption of perfect mixing is no longer validSimplified first-law (energy balance) model
PublicationSubmitted to ASHRAE Transactions 2007
89
Cooling Operation of Overhead System
Heat gain into space
100%
Extraction 100%
90
Supply Supply PlenumPlenum
Ceiling-floor radiation
Floor-room convection
Return PlenumReturn Plenum
Return Return PlenumPlenum
Slab
Slab
Treturn
Treturn
Treturn
Tceiling
Tcarpet
Tplenum
Troom, near floor = 72°F
Slab-supply plenum conduction/convection
Slab-supply plenum conduction/convection
Floor-supply plenum conduction/convection
Return-ceiling convection
Return-slab convection
RoomRoom
Raised Floor Raised Floor PanelsPanels
Ceiling-slab radiation
0.6 cfm/ft2, 65°F
78°F
Simplified Model – Heat Transfer Pathways

Fred Bauman, PECenter for the Built Environment (CBE)
All contents copyright (C) 2000 The Regents of the University of California
16
Designing UFAD SystemsBetterBricks Workshop, September 7-8, 2005
91
Predicted Distribution of Room Cooling Load
Heat gain into space
100%
Extraction 57%
Through floor 14%
Through slab 29%
Total into plenum 43%
Baseline results – hung ceiling
92
EnergyPlus Modeling
Considering Radiation is KEY to making sense out of heat flows in UFAD systems (and all systems).
Internal Loads Example(3.6 W/ft2)
Tsupply = 56Tplenum = 63Troom = 75Treturn = 76
System ∆T = 76-56 = 20Room ∆T = 75-63 = 13
18.8
17.8
16.2
17.4
22.5
24.223.9
29.1
24.4
24.3
24.3
23.8
23.8
17.4
13.4
23.6
0
20
40
60
80
100
120
140
160
180
10 15 20 25 30
56
63
75
76
∆Troom=13
∆Tsystem=20
75
93
Load Calculation/Energy Software Tools
Common load/energy calculation programsTrane Trace 700/Load 700
Carrier HAP
Elite
Wrightsoft RSC
DOE2.1, 2.2
No Underfloor Model in any of them!For load calculations, air volumes seem to work out to be the same as overhead calculations (so far…)
EnergyPlus UFAD system development underway!
94
Load Calc’s: What to do?!?
Designers need to understand the physics of these systems
“Standard” load calc’s seem to work(CAVEAT CAVEAT CAVEAT)
Must design systems that can react to dynamic load conditions
VAV system operation important
Resets seem to be very helpful
Systems must be commissioned to make sure they work
95
UFAD: Good Energy Performance
Cooling EnergyFree CoolingMechanical Cooling
Fan EnergyAir PressuresAir Volumes
Reheat EnergyLower ∆TLower Air-Volumes
96
More 100% Free Cooling
Mechanical cooling not required
due to warm supply air temperatures
65oFSupply Air Temperature
85oFReturn Air Temperature
<=65oFOutdoor Air Temperature
Cooling Coilis OFF

Fred Bauman, PECenter for the Built Environment (CBE)
All contents copyright (C) 2000 The Regents of the University of California
17
Designing UFAD SystemsBetterBricks Workshop, September 7-8, 2005
97
More Integrated Economizer Cooling
Higher return air temperature keepssystem at 100% outdoor air longer
65oFSupply Air Temperature
85oFReturn Air Temperature
65oF to <85oFOutdoor Air Temperature
Cooling Coilis On
98
Energy Advantages in the San Francisco Area
San Francisco Outdoor Temperature Distribution(Dry Bulb temperatures between 8am and 8pm)
0
50
100
150
200
250
300
33 37 39 41 43 45 47 49 51 53 55 57 59 61 63 65 67 69 71 73 75 77 79 81 83 85 87 89 91 93 95
Outdoor Dry Bulb Temperature [F]
Hou
rs
2217 Hours100% Economizer
99
UFAD in Other Climates
0
100
200
300
400
500
600
-25
-20
-15
-10 -5 0 5 10 15 20 25 30 35 40 45 50 55 60 65 70 75 80 85 90 95 10
0
0
100
200
300
400
500
600
-25
-20
-15
-10 -5 0 5 10 15 20 25 30 35 40 45 50 55 60 65 70 75 80 85 90 95 10
0
0
100
200
300
400
500
600
-25
-20
-15
-10 -5 0 5 10 15 20 25 30 35 40 45 50 55 60 65 70 75 80 85 90 95 10
0HV
AC
De
sig
n F
und
am
enta
ls
100
Economizer Savings Summary
Example Sensible Cooling Energy as a Function of Outside Air Temperature
0
5,000
10,000
15,000
20,000
25,000
30,000
35,000
50 55 60 65 70 75 80 85 90 95 100
Outside Air Temperature [oF]
Coo
ling
[Btu
]
OH system
UF system
101
Mechanical Cooling Energy Savings
Chiller energy decreases as the chilled water supply temperature increases – the compressor does less work 65oF
65oF
50oF62oF
102
Dehumidification
Chilled water supply temperature is determined by the lowest supply-air temperature needed.
If dehumidification is needed, this is likely to be 55oF or lower.
Affects both mechanical and free cooling.
55oF
55oF
40oF52oF

Fred Bauman, PECenter for the Built Environment (CBE)
All contents copyright (C) 2000 The Regents of the University of California
18
Designing UFAD SystemsBetterBricks Workshop, September 7-8, 2005
103
Mixing OH and UFAD Systems
Chilled water supply temperature is determined by the lowest supply-air temperature needed
If standard OH systems are used, this is likely to be 55oF.
Affects both mechanical and free cooling.
65oF
55oF
40oF52oF
104
System Type
Most UFAD perimeter systems still use reheat coils constant-speed or variable-speed fan units
HW or electric resistance heatUnducted – supplies underfloor air for cooling
VAV change-over air handlers are another more efficient option
Separate air handler per exposureControlled similar to “VVT” system
105
Reheat Energy
ExamplesItem Units Symbol / Equation OH UFAD
Heating Load [Btu/h] Qh 10,000 10,000System Supply Air Temp [F] Tsys 55 63Room Heating Setpoint [F] Tset 70 70Room Supply Air Temp [F] Tsupply 90 110
Supply Air Flow [CFM] Qh / (1.1 x (Tsupply-Tset)) 455 227Reheat [Btu/h] CFM x 1.1 x (Tset - Tsys) 7,500 1,750
23%
106
Structural Slab Thermal Storage
Building physics and anecdotal evidence suggest there is a strong coupling of plenum air and slab.
No validated mathematical models exist that can be used in design.
CBE, CEC, UCSD, and DOE working on it (EIEIO).
107
Reduced Fan Power
Underfloor plenum is the primary air distribution route
UFAD systems use less ductwork than OH systems
Primary fan pressure reduced 1/2 to 1 in. H2O, a reduction of about 25%
Substantial energy savings on primary fan power possible, however this may be offset by fan-powered boxes or terminals used in perimeter zones
108
Fan Energy Savings: Air Volumes
Calculations and practice suggest that UFAD systems do not require more air than OH systems due to stratification
But…
There are many unknowns associated with load calc’s
It appears that built projects in case studies provide too much air
Further research will allow us to design for reduced air volumes

Fred Bauman, PECenter for the Built Environment (CBE)
All contents copyright (C) 2000 The Regents of the University of California
19
Designing UFAD SystemsBetterBricks Workshop, September 7-8, 2005
Comfort and IAQ
11:45 – 12:00
110
Thermal ComfortVariations in Individual Preferences
Clothing
Activity level
Body weight & size
Personal preferences
111
Thermal Comfort
Light office activity, light jacket, slacks
Sedentary, Skirt, blouse, pantyhose
112
Personal Control
Field research: Occupants with no control are twice as sensitiveto temperature changes
Less control = more hot/cold complaints
113
Thermal Comfort
Traditional approachSatisfy up to 80% of building occupants
Underfloor approachAllow personal control of the local thermal environment satisfy up to 100% of occupants reduce occupant complaints
Existing fan-driven (TAC) supply outlets provide sizable range of temperature control:desktop 13°F (7°C); floor 9°F (5°C)
Passive diffusers (no fan power) don’t provide as much local temperature control, but improve perception of individual control
114
Occupant Control Issues
Supply outlet design (swirl, jet)
Passive (pressurized plenum) vs. active (local fan-driven) diffusers
Understandable and easy to use
Frequency of adjustment
Response rate
Range of control
Task/ambient control integration
Fred Bauman, PECenter for the Built Environment (CBE)
All contents copyright (C) 2000 The Regents of the University of California
20
Designing UFAD SystemsBetterBricks Workshop, September 7-8, 2005
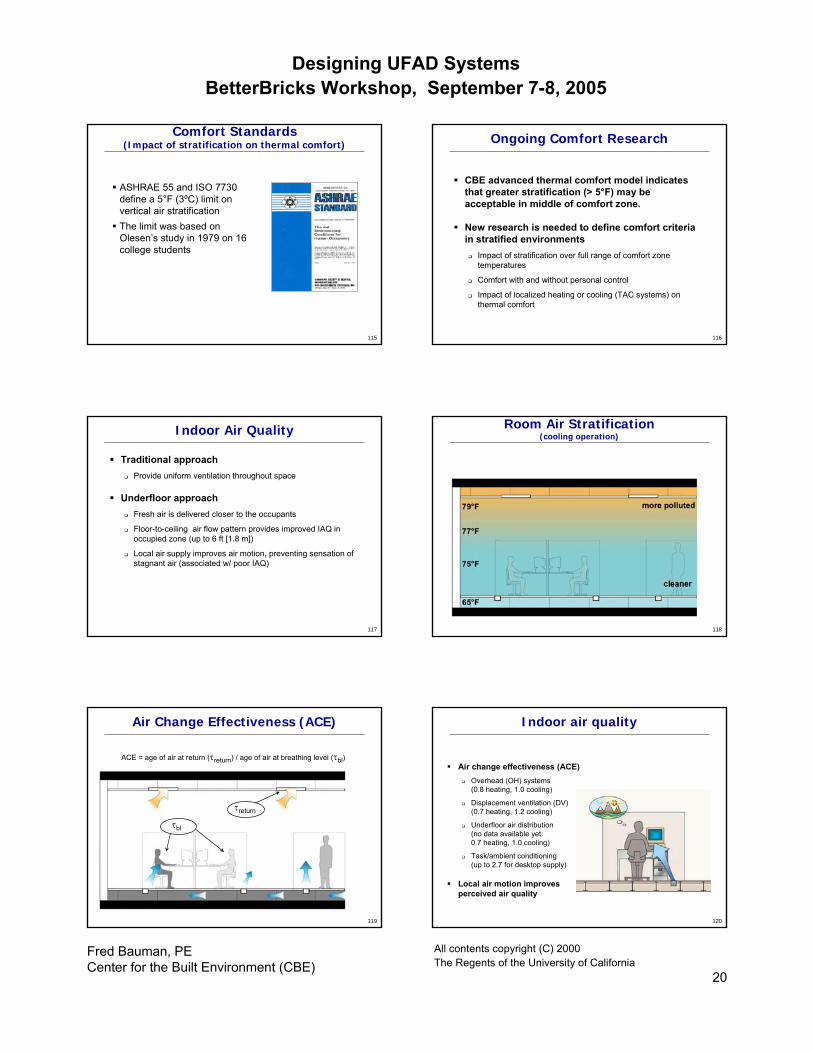
115
Comfort Standards(Impact of stratification on thermal comfort)
ASHRAE 55 and ISO 7730 define a 5°F (3ºC) limit on vertical air stratification The limit was based on Olesen’s study in 1979 on 16 college students
116
Ongoing Comfort Research
CBE advanced thermal comfort model indicates that greater stratification (> 5°F) may be acceptable in middle of comfort zone.
New research is needed to define comfort criteria in stratified environments
Impact of stratification over full range of comfort zone temperatures
Comfort with and without personal control
Impact of localized heating or cooling (TAC systems) on thermal comfort
117
Indoor Air Quality
Traditional approachProvide uniform ventilation throughout space
Underfloor approachFresh air is delivered closer to the occupants
Floor-to-ceiling air flow pattern provides improved IAQ in occupied zone (up to 6 ft [1.8 m])
Local air supply improves air motion, preventing sensation of stagnant air (associated w/ poor IAQ)
118
Room Air Stratification(cooling operation)
119
Air Change Effectiveness (ACE)
ACE = age of air at return (τreturn) / age of air at breathing level (τbl)
τreturn
τbl
120
Indoor air quality
Air change effectiveness (ACE)Overhead (OH) systems(0.8 heating, 1.0 cooling)
Displacement ventilation (DV) (0.7 heating, 1.2 cooling)
Underfloor air distribution(no data available yet: 0.7 heating, 1.0 cooling)
Task/ambient conditioning(up to 2.7 for desktop supply)
Local air motion improves perceived air quality

Fred Bauman, PECenter for the Built Environment (CBE)
All contents copyright (C) 2000 The Regents of the University of California
21
Designing UFAD SystemsBetterBricks Workshop, September 7-8, 2005
121
Research needed
Ventilation performance in UFAD systemsLack of quantitative data on ventilation performance of current-generation UFAD systems
ASHRAE TC 5.3 is preparing research work statement for proposed laboratory and computational fluid dynamics (CFD) study of ventilation performance of stratified systems (UFAD and displacement ventilation)
CBE is seeking funding to conduct field study (with Lawrence Berkeley Laboratory) of ventilation effectiveness and pollutant removal efficiency in existing UFAD office building
Lunch
12:00 - 1:00
Horizontal and VerticalDistribution
1:00 – 1:20
124
Plenum Distribution Criteria
General, uniform air distribution
Relatively equal supply air temperature to each diffuser
Relatively equal pressure in plenum
125
Horizontal Distribution
Layout Example:
Initial Plan –Large amount of
ductwork
126

Fred Bauman, PECenter for the Built Environment (CBE)
All contents copyright (C) 2000 The Regents of the University of California
22
Designing UFAD SystemsBetterBricks Workshop, September 7-8, 2005
127
Shafts
Horizontal Distribution
Layout Example:
Final plan employs multiple shafts to reduce ductwork in the
floor
128
50 foot radius
129
“Air Highways”
130
“Air Highway” Cross Section
131
Large Air Highway
132
Air Highway Construction

Fred Bauman, PECenter for the Built Environment (CBE)
All contents copyright (C) 2000 The Regents of the University of California
23
Designing UFAD SystemsBetterBricks Workshop, September 7-8, 2005
133
Air Highway Goals
Lower costsLess sheet metal
Lower labor rates of floor installers
Lower pressure dropLarger effective duct area
Reduced coordination and conflicts
Leak-free
134
Air Highway Limitations
Questionable actual cost savings
Familiarity of construction by floor contractors, general contractor
Code equivalence to a ductCrossing corridors
Construction coordinationNot complete until floor tiles installedDamage by other trades
Limited pressure capability
Leakage!!!!
135
The need for
Plenum Dividers
Sheet metal plenum dividers subdivide UF plenum
Purpose:Provide more interior control zones
Reduce length of air travel to perimeter UFTsReduced temperature degradation
Allow off-hour isolationMeet Title 24 25000 ft2 isolation area limitation
136
Plenum Dividers
Plenum DividersMaximum 25000 ft2 area per zone
137
Recommendations
Use as little underfloor ductwork as possibleMinimize cost
Minimize conflicts
50 feet from discharge to last outlet seems to be the consensus (more research being done)
Use many vertical shafts to try to eliminate horizontal ductwork
Cost of fire/smoke dampers offset by eliminated ductwork
Reduced velocity leaving shaft, reduces noise
Commissioning and Operations1:20 – 1:35

Fred Bauman, PECenter for the Built Environment (CBE)
All contents copyright (C) 2000 The Regents of the University of California
24
Designing UFAD SystemsBetterBricks Workshop, September 7-8, 2005
139
Plenum Air Leakage
Conduct leakage tests in underfloor plenumBlower panel with variable-speed test fan
Maintain design plenum pressure (e.g., 0.05 in. H2O)
Test #1 – Total leakageFloor panels, electrical outlets, carpet tiles installed according to typical design specifications
Seal all diffusers
Test #2 – Construction quality leakageSeal all openings and gaps on raised floor surface
Floor leakageSubtract Test #2 result from Test #1 result
140
Acceptable Leakage Rates
Construction quality leakage
Not to exceed 0.05 cfm/ft2 at 0.05 in H2O (e.g., 1,000 cfm for a 20,000 ft2 floor plate)
Floor leakage
Not to exceed 0.10 cfm/ft2 at 0.05 in H2O(e.g., 17% leakage for an interior zone with 0.6 cfm/ft2
design airflow)
Consider testing a full-scale mock-up prior to construction. Apply corrections and sealing methods to remaining underfloor plenums and test again.
141
Airflow and Room Air Stratification
No cooling airflow design tool yet available
Systems are commonly oversized, often as a result of over-estimation of design loads
Conduct measurements of vertical temperature profile during fully loaded conditions
Use “stratification measurement tree” consisting of string or pole with several temperature sensors at regular intervals
Prior to measurements, operate building long enough (up to one week) to ensure thermal mass of structural slab is in equilibrium
If stratification in the occupied zone (up to 6 ft) is not at least 3°F, further adjustments should be made
142
Adjusting Stratification(at peak load)
AdjustAirflow quantity
Plenum pressure max setpoint
# of diffusers
TStat setpoint
Goal∆T ~ 3-4°F in occupied zone
Equivalent comfort (same average temperature)
143
Other Considerations
Close coordination between designers, contractors, commissioning agents, and building operators
Building operators must be properly trained on UFAD design and operation
Raise TStat setpoints to avoid overcooling (interior zones)
Avoid overriding higher airflows into open plenum – impacts the entire plenum zone
If plenum air temperature is too high, corrections may be needed
Account for temperature gain to plenum supply air, particularly in key areas
Perimeter zones
Conference rooms
BMS should allow easy retrieval and review of archived trend logs to evaluate system performance
Post-Occupancy Evaluations
1:35 – 1:50
Fred Bauman, PECenter for the Built Environment (CBE)
All contents copyright (C) 2000 The Regents of the University of California
25
Designing UFAD SystemsBetterBricks Workshop, September 7-8, 2005
145
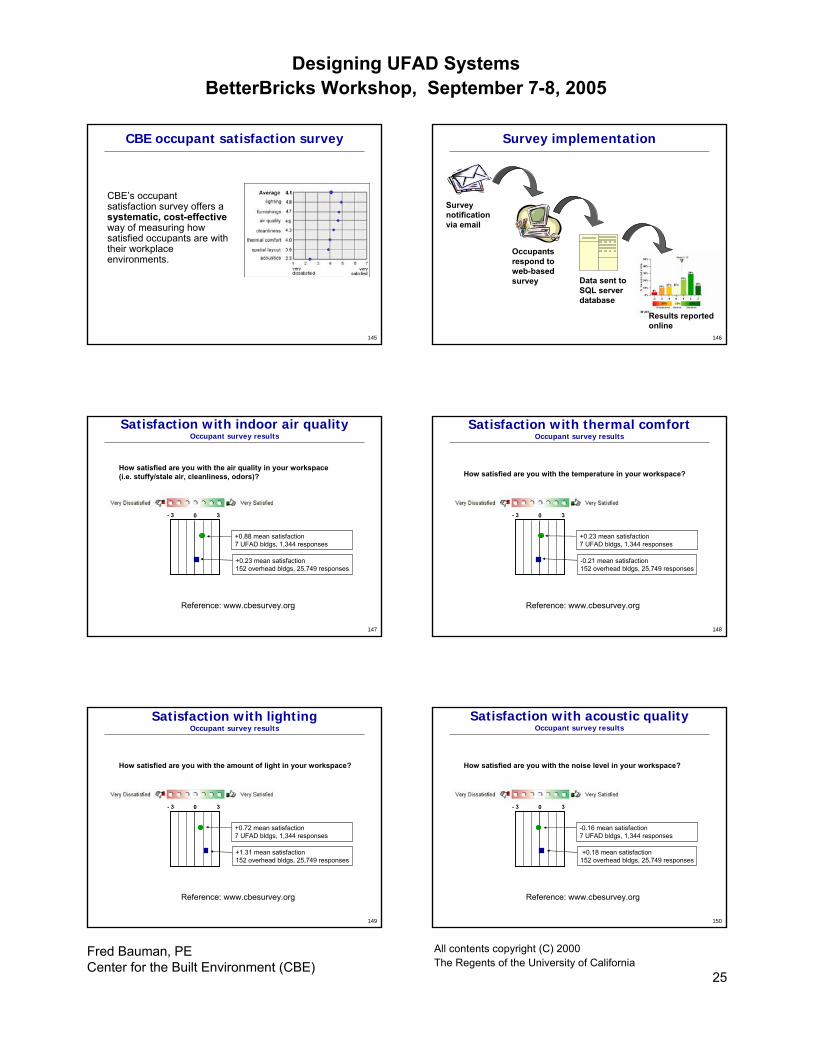
CBE occupant satisfaction survey
CBE’s occupant satisfaction survey offers a systematic, cost-effectiveway of measuring how satisfied occupants are with their workplace environments.
146
Survey implementation
Survey notification via email
Occupants respond to web-based survey Data sent to
SQL server database
Results reported online
147
Satisfaction with indoor air qualityOccupant survey results
- 3 30
+0.88 mean satisfaction7 UFAD bldgs, 1,344 responses
+0.23 mean satisfaction152 overhead bldgs, 25,749 responses
Reference: www.cbesurvey.org
How satisfied are you with the air quality in your workspace (i.e. stuffy/stale air, cleanliness, odors)?
148
Satisfaction with thermal comfortOccupant survey results
- 3 30
+0.23 mean satisfaction7 UFAD bldgs, 1,344 responses
-0.21 mean satisfaction152 overhead bldgs, 25,749 responses
Reference: www.cbesurvey.org
How satisfied are you with the temperature in your workspace?
149
Satisfaction with lightingOccupant survey results
- 3 30
+0.72 mean satisfaction7 UFAD bldgs, 1,344 responses
+1.31 mean satisfaction152 overhead bldgs, 25,749 responses
Reference: www.cbesurvey.org
How satisfied are you with the amount of light in your workspace?
150
Satisfaction with acoustic qualityOccupant survey results
- 3 30
-0.16 mean satisfaction7 UFAD bldgs, 1,344 responses
+0.18 mean satisfaction152 overhead bldgs, 25,749 responses
Reference: www.cbesurvey.org
How satisfied are you with the noise level in your workspace?

Fred Bauman, PECenter for the Built Environment (CBE)
All contents copyright (C) 2000 The Regents of the University of California
26
Designing UFAD SystemsBetterBricks Workshop, September 7-8, 2005
151
Satisfaction with cleanlinessOccupant survey results
- 3 30
+1.45 mean satisfaction7 UFAD bldgs, 1,344 responses
+0.94 mean satisfaction152 overhead bldgs, 25,749 responses
Reference: www.cbesurvey.org
How satisfied are you with the general cleanliness of the overall building?
152
CBE UFAD project databasewww.cbe.berkeley.edu/underfloorair/casestudies.htm
~300 projects in North AmericaWeb-based questionnaire collecting key building characteristics ~32 buildings under active study; 13 have completed operations section of questionnaire
153
UFAD building operations questionnaireCompleted by facility managers
Based on your knowledge of how the UFAD system has been operating and your experience in other non-UFAD buildings, how much better or worse is this building in comparison to conventional buildings with respect to:
Much better Much worse3 -30
Operations issue NMean
response
0.1513Effort and cost of maintenance
0.5413Hot and cold complaints
0.6213Overall performance of UFAD system
0.6713Energy use
0.9213Making changes to tenant space
154
UFAD building operations questionnaireCompleted by facility managers
Based on your experience with this building, indicate how serious of a problem the following have been:
No problem Serious problem3 -30
Operations issue NMean
response
-0.1713Air leakage from construction joints
0.1713Plenum airflow and thermal decay
0.9213Air leakage from panel joints
1.2513Dust and dirt in plenum
1.6713Temp. stratification in occupied spaces
2.0813Moisture, mold, related problems
How to Decide toGo with UFAD?
1:50 – 2:05
156
Cost considerations – UFAD vs. overhead
Accurate first and life-cycle cost estimates are crucial early in design process
Added first cost of raised floor system can be offset (in part) by reduction in ductwork and electrical/telecomm installation costs
Recent projects have demonstrated that first costs for UFAD can be very comparable to overhead systems
Range from $1.00-1.50/ft2 reduction to $4.00-6.00/ft2 premium
Well-recognized that raised floor systems reduce life-cycle costs associated with churn
As more designers become familiar with UFAD and more manufacturers enter the market, costs will come down further

Fred Bauman, PECenter for the Built Environment (CBE)
All contents copyright (C) 2000 The Regents of the University of California
27
Designing UFAD SystemsBetterBricks Workshop, September 7-8, 2005
157
Relative costs
$-
$50
$100
$150
$200
$250
Cost of Labor Cost of Energy Incremental Cost of UFAD
Offi
ce B
uild
ing
Cos
t per
Squ
are
Foot
A 1% Savings in Productivity
~1 year payback
158
Ongoing CBE UFAD Cost Analysis Project
Objective: Develop comprehensive first and life-cycle cost model for UFAD systems
Funded by U.S. GSA
Began summer 2002, ~$450K budget
Project statusFirst cost model complete
Development of life-cycle cost model underway
Complete model and total cost analysis complete by September 2006
159
Approach - Affected first cost elements
The model evaluates each affected element and computes the UFAD to overhead (OH) system cost difference
Access Floor: Installation of access floors & carpets
Façade & structure: Allowance for reducing floor-to-floor height
HVAC: Cooling and heating loads calculation for sizing and pricing tenant area HVAC costs
Electrical: Power distribution and voice and data differences
Raised Core: Raised slab in core (non-UFAD) area
Ceiling Treatments: Ceiling cavity paint, lighting, acoustical treatment, fireproofing steel beams, and sprinklers
Furniture: Difference between system-powered and conventional furniture
160
Comparison of electrical first costsCBE first cost model
$0.41$2.09
$0.38
$2.72$0.76
$1.91
$10.06$6.80
$10.06$6.80
$10.06 $6.80
$1.83
$1.78$1.83
$1.78$1.83
$1.78
-$2.27-$1.45 -$2.13
-$1.23-$3.00
$0
$2
$4
$6
$8
$10
$12
$14
$16
OH: Pow
er po
le, po
wered
UFAD: Con
venti
onal,
non-p
owere
d
UFAD: Con
venti
onal,
powere
d
UFAD: Mod
ular, n
on-po
wered
UFAD: Mod
ular, p
owere
d
UFAD: Mod
ular, n
on-po
wered,
RF labo
r
Elec
tric
al c
ost,
$/G
sf
-$20-$18-$16-$14-$12-$10-$8-$6-$4-$2$0
Workstation - LaborWorkstation - MaterialV&D - LaborV&D - MaterialElectrical - LaborElectrical - Material
Cost differential, $/Gsf
161
When to Use Underfloor Air?
Office buildings -- all are possible but best for:Open office plans
Owner Occupied Buildings
Dry, Mild ClimatesEnergy benefits best in mild climates without high humidity levels – little or no chiller plant savings in humid climates
162
When to Use Underfloor Air?
Spec Office Buildings – not as commonGrowing number of successful projects in recent years
Multiple tenants with diverse loads and full height walls may be a problem depending on system design
If first costs are higher than conventional systems, it is important to developer for UFAD building to command higher rents

Fred Bauman, PECenter for the Built Environment (CBE)
All contents copyright (C) 2000 The Regents of the University of California
28
Designing UFAD SystemsBetterBricks Workshop, September 7-8, 2005
163
When to Use Underfloor Air?
Churches, Theaters, Auditoriums True displacement if supplied under seats at low velocity
Trading Floors
Tall spacesBanks
In recent years, increased number of projectsLibraries
Schools
Court Houses
Institutional
Wrap-Up,Conclusions
2:05 – 2:15
165
Last Thoughts…
Significant energy savings possibleDepends strongly on climate
Depends on designing the systems correctly
More Research NeededLoad calc’s
Stratification
Underfloor plenum
Energy Simulation will be KeySlab, plenum, stratification
166
Underfloor Air Technology Websitewww.cbe.berkeley.edu/underfloorair
Objective:Develop and maintain website dedicated to providing a complete and unbiased description of underfloor air distribution technology
Audience:- engineers and architects- building owners- developers- CBE partners and clients- manufacturers and rep’s- facility managers- corporate real estate- researchers
167
Underfloor Air Technology Website
Key Features:
- simple graphical tools highlighting basic concepts
- technical overviews explaining process, benefits and limitations
- detailed summaries of research on UFAD and related technologies
- guidelines for applying the technology
- case studies of existing systems
168
Current Research by CBE
Design toolsWhole-building energy simulation program (EnergyPlus):Ongoing 3-year project sponsored by California Energy Commission (CEC), U.S. DOE, CBE, and York (completion in June 2006)
Cooling airflow design tool:New project sponsored by CEC and others (completion in Nov. 2006)
Field Studies -- Whole-building performance dataOngoing field study of Calif. State office building sponsored by Calif. State Dept. of General Services (completion in Dec. 2006)
Cost analysis toolOngoing 4-year project sponsored by U.S. GSA to develop first and life-cycle cost model comparing UFAD with OH systems (completion in Sept. 2006)
Fred Bauman, PECenter for the Built Environment (CBE)
All contents copyright (C) 2000 The Regents of the University of California
29
Designing UFAD SystemsBetterBricks Workshop, September 7-8, 2005
169
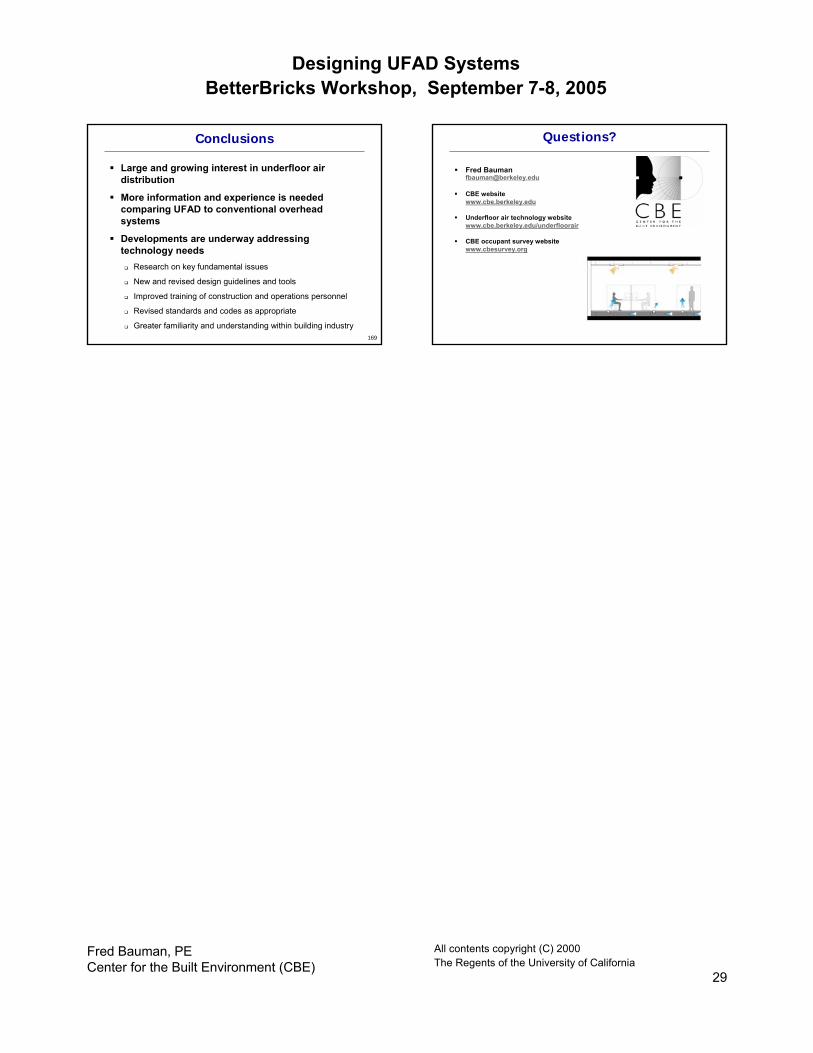
Conclusions
Large and growing interest in underfloor air distribution
More information and experience is needed comparing UFAD to conventional overhead systems
Developments are underway addressing technology needs
Research on key fundamental issues
New and revised design guidelines and tools
Improved training of construction and operations personnel
Revised standards and codes as appropriate
Greater familiarity and understanding within building industry
Questions?
Fred [email protected]
CBE websitewww.cbe.berkeley.edu
Underfloor air technology website www.cbe.berkeley.edu/underfloorair
CBE occupant survey websitewww.cbesurvey.org