slide 1© student lending analytics, llc nchelp spring convention what schools and families want...
Post on 19-Dec-2015
213 views
TRANSCRIPT

Slide 1© Student Lending Analytics, LLC
NCHELP Spring ConventionWhat Schools And Families Want
This presentation does not constitute formal policy or legal advice and should not be relied upon as such.

Slide 2© Student Lending Analytics, LLC
What Schools and Families Want Agenda
Federal Student Loans– Trends in projected market share for FFEL and Direct Lending
programs– Schools rate the strengths and weaknesses of the programs– Updated information on “Who’s Going Direct?”
Private Student Loans– Cutback in private loan availability leading to sharp increase in federal loans– Schools remains concerned about availability of private loans for 2009-10– Schools utilizing variety of strategies to deal with expected shortfall
Financial Literacy programs– Recent research suggests significant room for improving financial literacy of
students– Schools recognize importance of programs but suffer from resource
constraints when it comes to implementation– $500 million fund likely to lead to explosion of on-line offerings catering to
college population

Slide 3© Student Lending Analytics, LLC
SLA Flash Survey: Trends in FFEL and DIRECT Lending Programs
Current Plans for FFELP Participants (Overall) - Respondents
56%
18%15%
11%
19%15%
49%
18%
0.0%
10.0%
20.0%
30.0%
40.0%
50.0%
60.0%
Committed toFFELP
Considered DL,Expect Stay in
FFELP
Considering DL Decided to go DLfor 09-10
Per
cen
tage
of
Tot
al
Respondents
Loan Volume
Survey question: Which description most accurately describes your school's federal student loan plans for the 2009-10 school year?
Source: SLA Flash Survey: Trends in FFEL and Direct Lending, March 2009 (551 respondents)

Slide 4© Student Lending Analytics, LLC
SLA Flash Survey: Trends in FFEL and DIRECT Lending Programs
Current Plans for FFELP Participants (By School Type]
52%
64%
15%19% 20%
13% 13%
23%
13%
8% 8%
54%
0.0%
10.0%
20.0%
30.0%
40.0%
50.0%
60.0%
70.0%
Committed toFFELP
Considered DL,Expect Stay in
FFELP
Considering DL Decided to go DLfor 09-10
Per
cen
tage
of
Tot
al F
FE
LP
Res
pon
den
ts
4-Year Private
4-Year Public
2-Year Public
Survey question : Which description most accurately describes your school's federal student loan plans for the 2009-10 school year? Source: SLA Flash Survey: Trends in FFEL and Direct Lending, March 2009 (551 respondents)
Slide 5© Student Lending Analytics, LLC
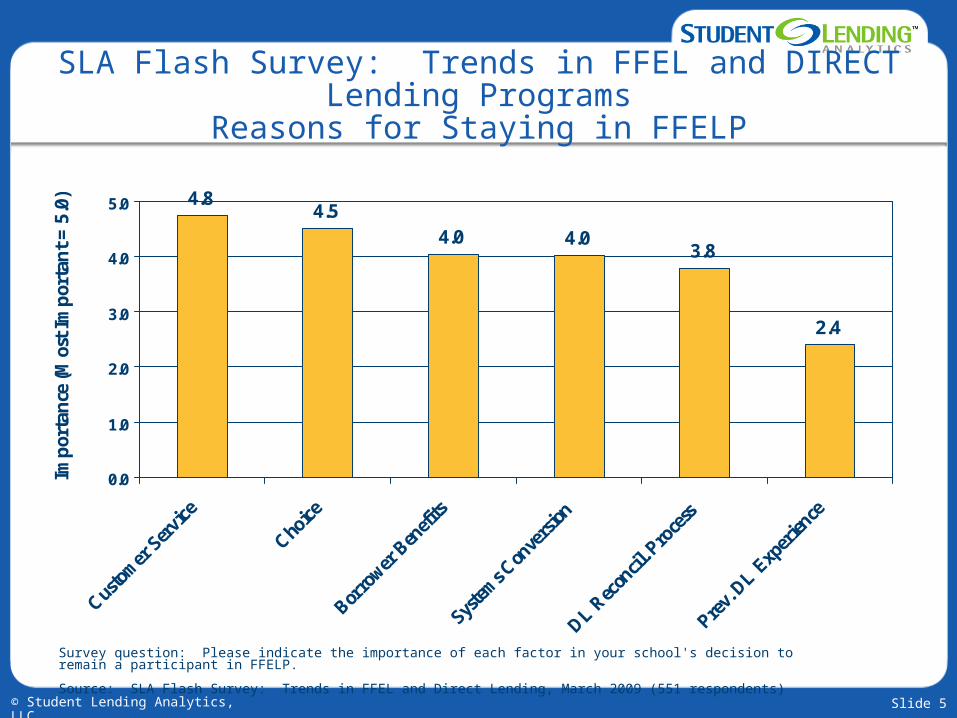
SLA Flash Survey: Trends in FFEL and DIRECT Lending Programs
Reasons for Staying in FFELP
4.84.5
4.0 4.03.8
2.4
0.0
1.0
2.0
3.0
4.0
5.0
Custo
mer
Ser
vice
Choice
Borro
wer B
enefi
ts
Syste
ms C
onve
rsion
DL Rec
oncil
. Pro
cess
Prev.
DL Exp
erien
ce
Imp
orta
nce
(M
ost
Imp
orta
nt
= 5
.0)
Survey question: Please indicate the importance of each factor in your school's decision to remain a participant in FFELP.
Source: SLA Flash Survey: Trends in FFEL and Direct Lending, March 2009 (551 respondents)

Slide 6© Student Lending Analytics, LLC
SLA Flash Survey: Trends in FFEL and DIRECT Lending Programs
Reasons Considering (or Switching To] DL Program
4.33.9 3.9 3.8 3.8
3.5
2.9
0.0
1.0
2.0
3.0
4.0
5.0
Finan
cial S
tren
gth
Cust.
Serv
ice
Borro
wer B
enefi
ts
Borro
wer C
onfu
sion
Lende
r List
Mai
nt.
Lende
r List
Reg
s.
Not E
nough
Len
ders
Imp
orta
nce
(M
ost
Imp
orta
nt
= 5
.0)
Survey question: Please indicate the relative importance of each factor in your decision to switch to Direct Lending (or to consider making the switch)Source: SLA Flash Survey: Trends in FFEL and Direct Lending, March 2009 (551 respondents)

Slide 7© Student Lending Analytics, LLC
What Schools and Families WantWho’s Going Direct?
2007-08School City, State FFEL VolumeNew York Institute of Tech. New York, NY $138,100,000Auburn University Auburn, AL $110,564,411University of Connecticut Storrs, CT $109,898,958University of Louisville Louisville, KY $90,847,216Middle Tennessee State Murfreesboro, TN $86,700,000Stony Brook University Stony Brook, NY $86,632,833Azusa Pacific University Azusa, CA $77,000,000CSU-Sacramento Sacramento, CA $69,702,474CSU-Long Beach Long Beach, CA $67,116,543Lesley University Cambridge, MA $64,193,033
Source: SLA research, May 2009

Slide 8© Student Lending Analytics, LLC
SLA Flash Survey: Trends in FFEL and DIRECT Lending Programs
Impact of Obama Budget Blueprint on FFEL/DL Decision
65%
32%
3%
0.0
No Impact on Decision More Likely to Go To DL Less Likely to Go DL
Per
cen
tage
of
Tot
al R
esp
ond
ents
C
onsi
der
ing
Mov
e to
Dir
ect
Len
din
g
Survey question: To what extent has the Obama Administration's recent budget proposal to shift entirely to Direct Lending had an impact on your school's decision-making process for 2009-10?Source: SLA Flash Survey: Trends in FFEL and Direct Lending, March 2009 (551 respondents)

Slide 9© Student Lending Analytics, LLC
SLA Flash Survey: Lender Customer Service Loan Processing Ratings
3.5 3.4 3.3 3.3 3.33.2 3.2 3.1 3.0
2.9
1.8
0.0
1.0
2.0
3.0
4.0
Lende
r 1
DIRECT
Lende
r 3
Lende
r 4
Lende
r 5
Lende
r 6
Lende
r 7
Lende
r 8
Lende
r 9
Lende
r 10
Lende
r 11
Rat
ing
Sca
le (
Str
ongl
y A
gree
= 4
.0)
Survey statement: This lender processes transactions (cash & non-cash) in a timely manner after loans are certified.
Source: SLA Flash Survey: Lender Customer Service Survey, October 2008
Slide 10© Student Lending Analytics, LLC
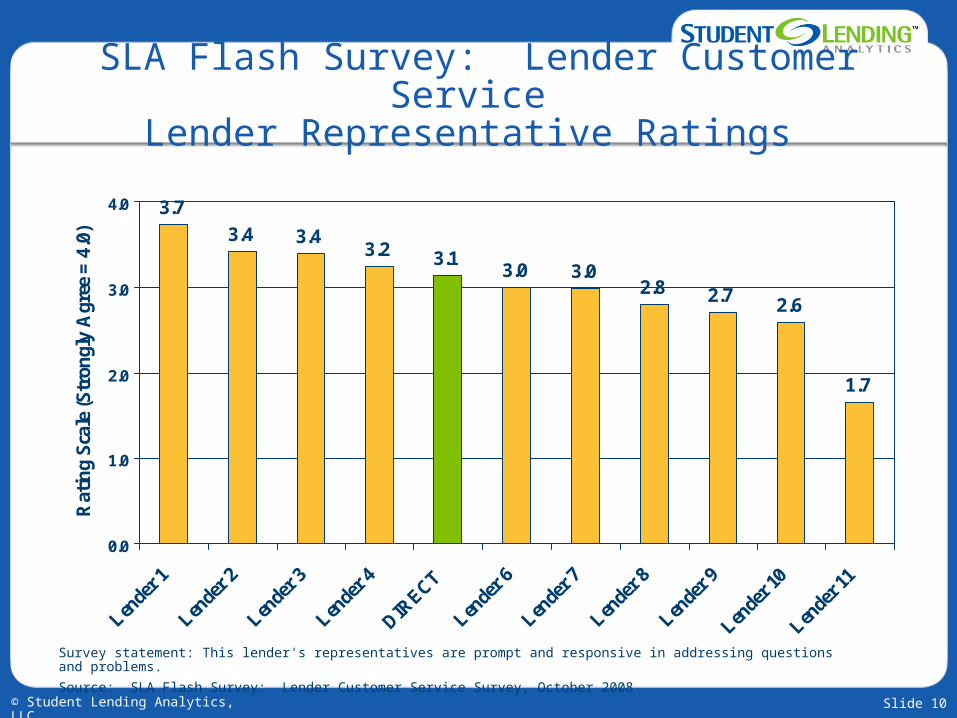
SLA Flash Survey: Lender Customer Service Lender Representative Ratings
3.7
3.4 3.43.2 3.1
3.0 3.02.8 2.7 2.6
1.7
0.0
1.0
2.0
3.0
4.0
Lende
r 1
Lende
r 2
Lende
r 3
Lende
r 4
DIRECT
Lende
r 6
Lende
r 7
Lende
r 8
Lende
r 9
Lende
r 10
Lende
r 11
Rat
ing
Sca
le (
Str
ongl
y A
gree
= 4
.0)
Survey statement: This lender's representatives are prompt and responsive in addressing questions and problems. Source: SLA Flash Survey: Lender Customer Service Survey, October 2008

Slide 11© Student Lending Analytics, LLC
SLA Flash Survey: Lender Customer Service On-Line Application Ratings
3.43.2 3.1 3.1
2.9 2.8 2.8 2.8 2.7 2.62.3
0.0
1.0
2.0
3.0
4.0
Lende
r 1
Lende
r 2
Lende
r 3
Lende
r 4
Lende
r 5
Lende
r 6
Lende
r 7
DIRECT
Lende
r 9
Lende
r 10
Lende
r 11
Rat
ing
Sca
le (
Str
ongl
y A
gree
= 4
.0)
Survey statement: This lender's on-line application process for borrowers is user-friendly.
Source: SLA Flash Survey: Lender Customer Service Survey, October 2008
Slide 12© Student Lending Analytics, LLC
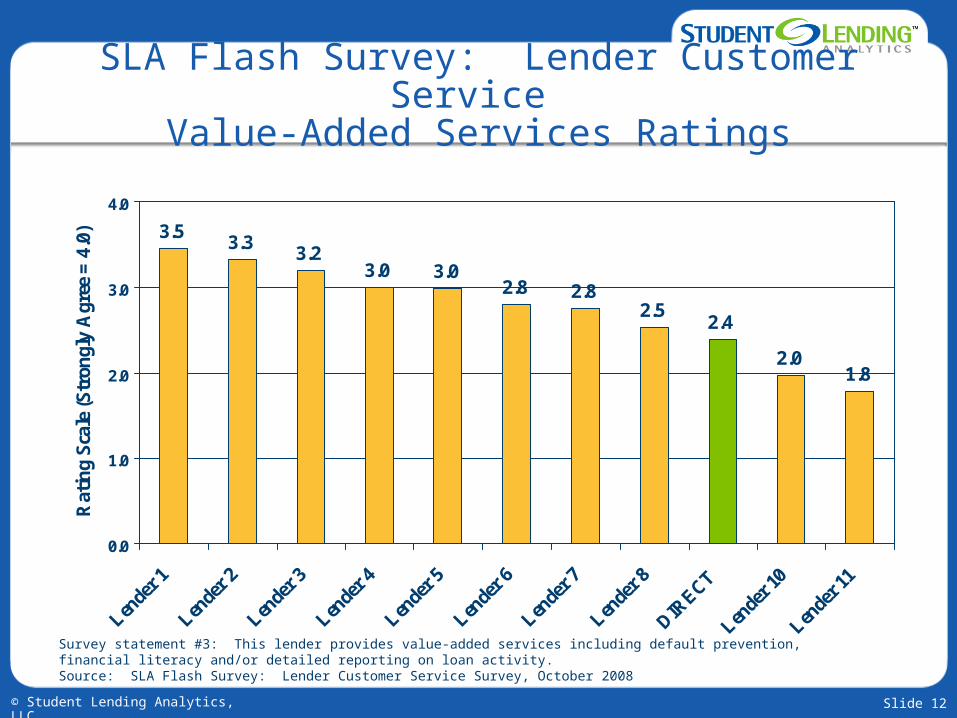
SLA Flash Survey: Lender Customer Service Value-Added Services Ratings
3.53.3
3.23.0 3.0
2.8 2.82.5
2.4
2.01.8
0.0
1.0
2.0
3.0
4.0
Lende
r 1
Lende
r 2
Lende
r 3
Lende
r 4
Lende
r 5
Lende
r 6
Lende
r 7
Lende
r 8
DIRECT
Lende
r 10
Lende
r 11
Rat
ing
Sca
le (
Str
ongl
y A
gree
= 4
.0)
Survey statement #3: This lender provides value-added services including default prevention, financial literacy and/or detailed reporting on loan activity.Source: SLA Flash Survey: Lender Customer Service Survey, October 2008
Slide 13© Student Lending Analytics, LLC
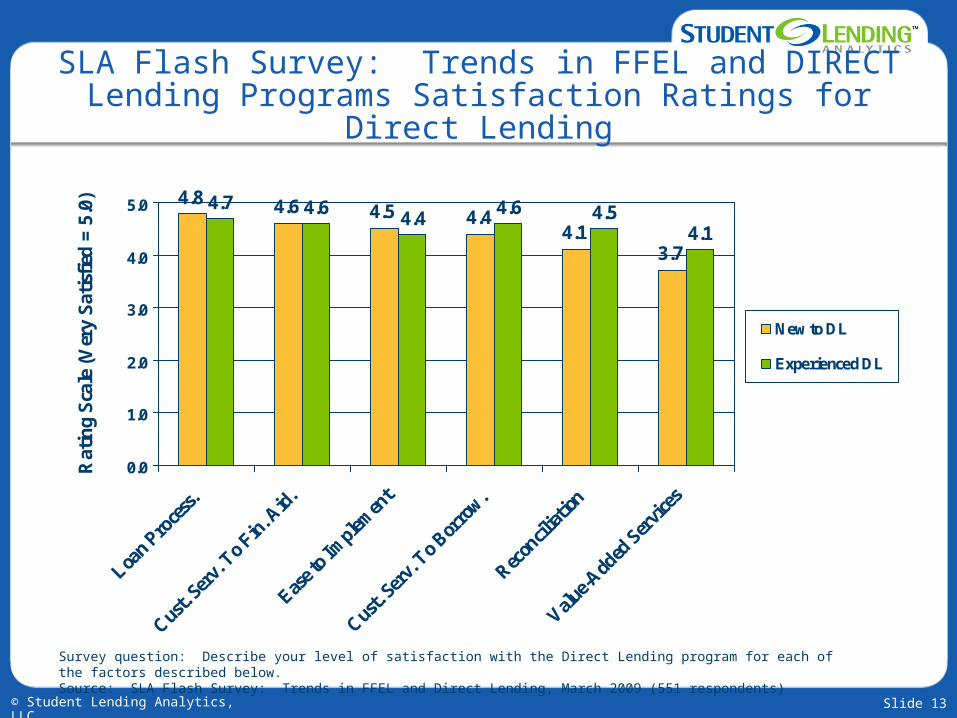
SLA Flash Survey: Trends in FFEL and DIRECT Lending Programs Satisfaction Ratings for Direct
Lending
4.8 4.6 4.5 4.44.1
3.7
4.7 4.64.4
4.6 4.54.1
0.0
1.0
2.0
3.0
4.0
5.0
Loan
Proce
ss.
Cust.
Serv
. To F
in. A
id.
Ease t
o Im
plem
ent
Cust.
Serv
. To B
orro
w.
Recon
ciliat
ion
Value
-Add
ed S
ervi
ces
Rat
ing
Sca
le (
Ver
y S
atis
fied
= 5
.0)
New to DL
Experienced DL
Survey question: Describe your level of satisfaction with the Direct Lending program for each of the factors described below. Source: SLA Flash Survey: Trends in FFEL and Direct Lending, March 2009 (551 respondents)
Slide 14© Student Lending Analytics, LLC
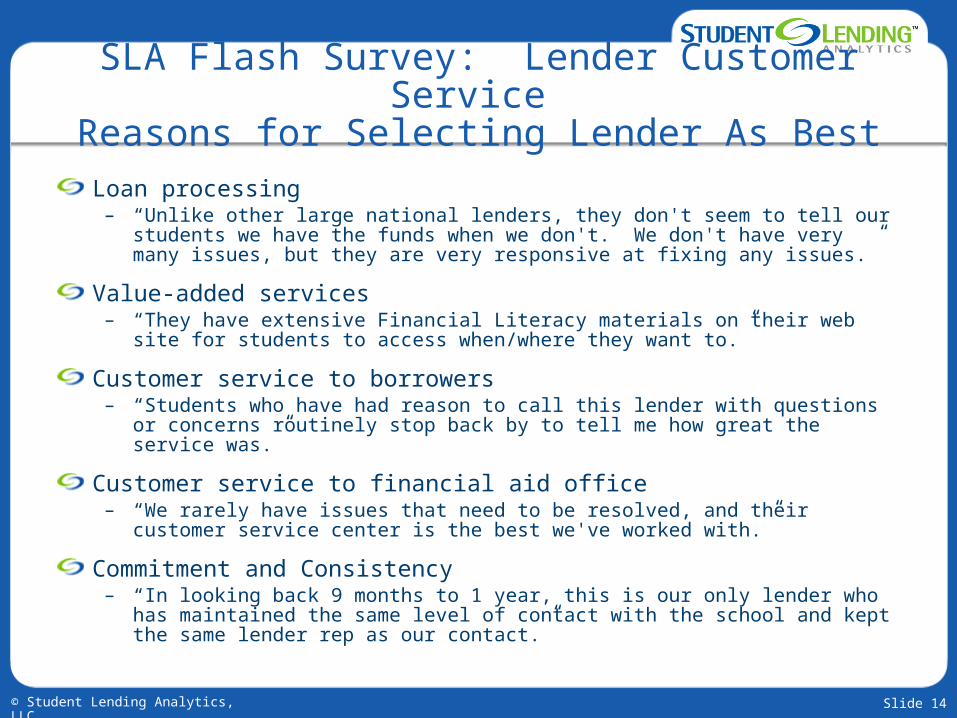
SLA Flash Survey: Lender Customer Service Reasons for Selecting Lender As Best
Loan processing– “Unlike other large national lenders, they don't seem to tell our students we have the
funds when we don't. We don't have very many issues, but they are very responsive at fixing any issues.”
Value-added services– “They have extensive Financial Literacy materials on their web site for students to
access when/where they want to.”
Customer service to borrowers– “Students who have had reason to call this lender with questions or concerns routinely
stop back by to tell me how great the service was.”
Customer service to financial aid office– “We rarely have issues that need to be resolved, and their customer service center is
the best we've worked with.”
Commitment and Consistency– “In looking back 9 months to 1 year, this is our only lender who has maintained the
same level of contact with the school and kept the same lender rep as our contact.”
Slide 15© Student Lending Analytics, LLC
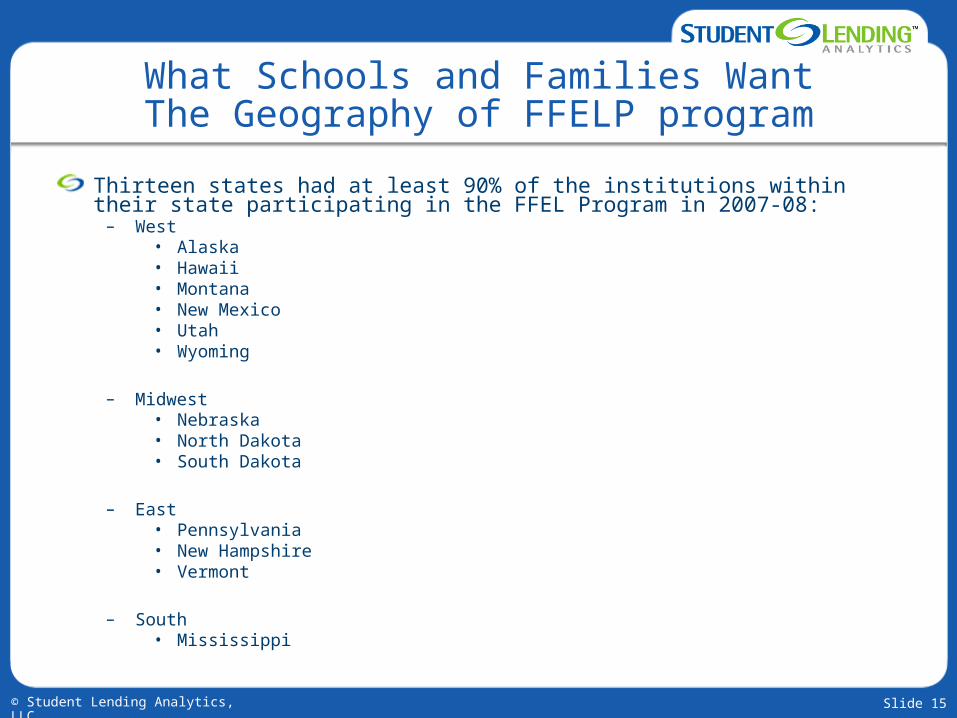
What Schools and Families WantThe Geography of FFELP program
Thirteen states had at least 90% of the institutions within their state participating in the FFEL Program in 2007-08:
– West• Alaska• Hawaii• Montana• New Mexico• Utah• Wyoming
– Midwest• Nebraska• North Dakota• South Dakota
– East• Pennsylvania• New Hampshire• Vermont
– South• Mississippi
Slide 16© Student Lending Analytics, LLC
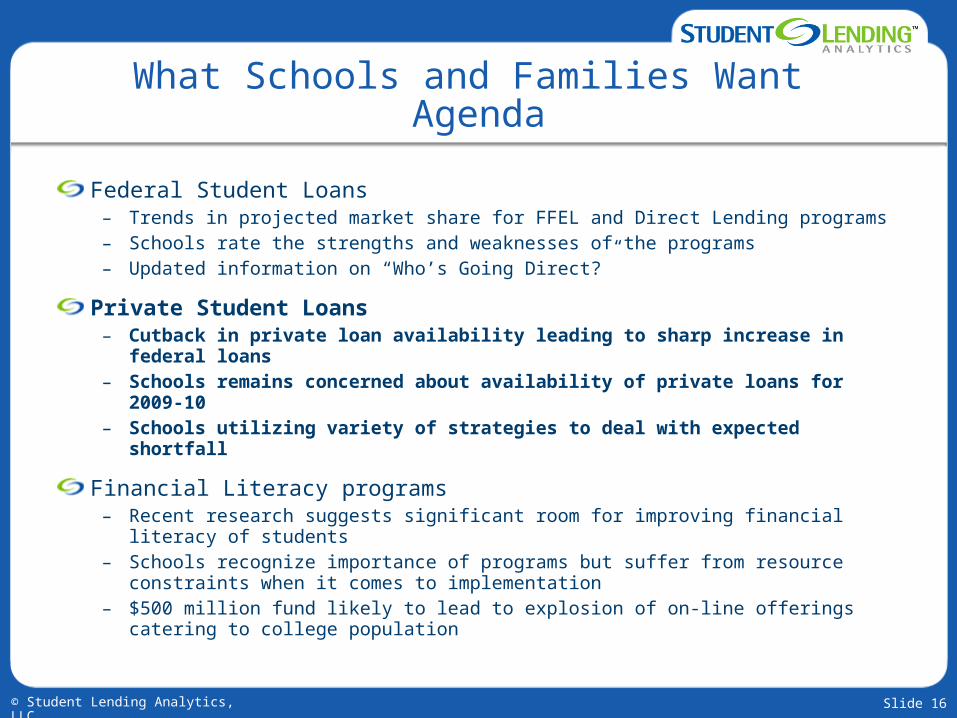
What Schools and Families Want Agenda
Federal Student Loans– Trends in projected market share for FFEL and Direct Lending programs– Schools rate the strengths and weaknesses of the programs– Updated information on “Who’s Going Direct?”
Private Student Loans– Cutback in private loan availability leading to sharp increase in federal loans– Schools remains concerned about availability of private loans for 2009-10– Schools utilizing variety of strategies to deal with expected shortfall
Financial Literacy programs– Recent research suggests significant room for improving financial literacy of students– Schools recognize importance of programs but suffer from resource constraints when
it comes to implementation– $500 million fund likely to lead to explosion of on-line offerings catering to college
population
Slide 17© Student Lending Analytics, LLC
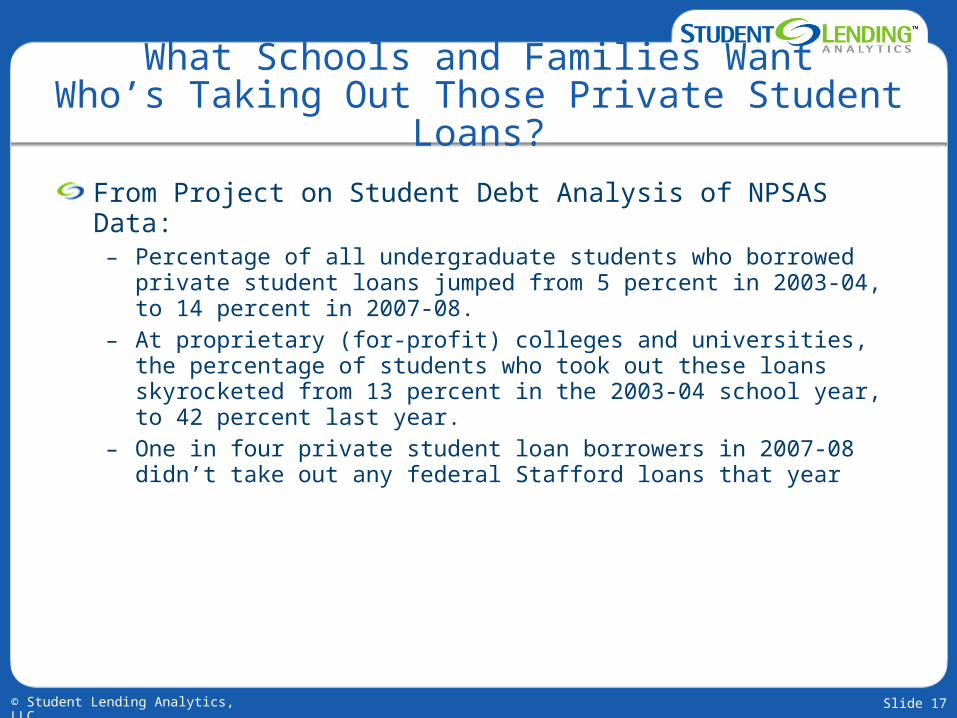
What Schools and Families WantWho’s Taking Out Those Private Student
Loans?
From Project on Student Debt Analysis of NPSAS Data:– Percentage of all undergraduate students who borrowed private student
loans jumped from 5 percent in 2003-04, to 14 percent in 2007-08. – At proprietary (for-profit) colleges and universities, the percentage of
students who took out these loans skyrocketed from 13 percent in the 2003-04 school year, to 42 percent last year.
– One in four private student loan borrowers in 2007-08 didn’t take out any federal Stafford loans that year

Slide 18© Student Lending Analytics, LLC
What Schools and Families Want How Has The Supply of Private Student Loans Been Impacted by
Credit Crunch?
Supply of private loans declined rapidly in August-September 2008…– Lenders representing over 30-35% of private loan market left the market
• Credit line pulled: College Loan Corp., Education Finance Partners
• Parent company afflicted by sub-prime issues: Wachovia, CampusDoor
• Inability to access ABS market: Key Bank, Bank of America (TERI)
While incumbents have not picked up the slack…– Securitization markets have been relatively dormant since 2007
• Recent Sallie Mae deals have been done at extremely high prices
– Concerns over consumer credit quality has plagued student loans• Sallie Mae expected to write-off $1 billion in private student loans in 2009
– Limited access to capital
And new entrants have added much new supply into market– Discover entered market in 2007– Credit unions starting to increase their market presence– Peer-to-peer lenders, Fynanz and GreenNote, met with limited success

Slide 19© Student Lending Analytics, LLC
What Schools And Families Want How Have Students Adjusted To The Decline in Availability of
Private Loans?
While traditional funding sources to finance a college education have been whacked…
– Home equity has plummeted given nationwide declines in home prices– 529 plans have suffered in the bear market which reduced equity values over
50%
Students turning to federal loans in record numbers– According to the Department of Education, federal loans have seen 20.8%
growth through the end of February for the 2008-09 academic year• Stafford unsubsidized loans increased by $2,000 in July 2008• 10% increase above trend in federal loan borrowings amounts to about $7
billion in incremental borrowing– Parent PLUS loan growth appears to be flat
• Sallie Mae, the largest FFELP lender, saw 57% growth in Stafford volume in their internal brands for 2008 while Parent PLUS volume was flat over the same timeframe
Leading indicator, FAFSA filings, are up 20.8% in first quarter, so expect this trend of increased federal loan borrowings to continue

Slide 20© Student Lending Analytics, LLC
What Schools and Families WantStudent Concern About Transparency
Selected comments from SLA Private Student Loan Ratings survey:
“While the interest rate was not disclosed on the website after being approved without a cosigner, I called the customer service line and they were very helpful: they told me what my rate was, which was prime plus 2 or 3%. I asked if I could get a lower rate with a cosigner and they said I could try, so I did and got a much lower rate.”
“They want you to sign the promissory note before you know what the interest rate is. The interest rate is not part of the promissory note. I had to call their customer service department to find out that my rate would be prime + 1/2%. Why do they expect us to sign a promissory note before we know what the interest rate is?”

Slide 21© Student Lending Analytics, LLC
What Schools and Families Want Transparent Disclosures
• University Credit Union (Maine)
• University of Southern California Credit Union
3-month LIBOR + Margin= Interest Rate
Borrower (with Cosigner)
Borrower Only (No Cosigner)
FICO Score Margin Margin
750 and above 2.00% 2.00%
730 to 749 2.50% 3.00%
700 to 729 3.00% 3.50%
680 to 699 4.00% 4.50%
660 to 679 5.50% 6.00%

Slide 22© Student Lending Analytics, LLC
What Schools and Families Want Degree of Concern Regarding Private Student
Loans
14%
44%
17%
52%
6%
38%
4%
31%
0.0%
10.0%
20.0%
30.0%
40.0%
50.0%
60.0%
Very Concerned Somewhat Concerned
Per
cen
tage
of
Tot
al R
esp
ond
ents
Overall
4-year private
4-year public
2-year public
Survey question: How concerned are you about the availability of PRIVATE loans for your students for the 2009-10 academic year?Source: SLA Flash Survey: Private Student Loans, June 2009 (187 respondents)

Slide 23© Student Lending Analytics, LLC
What Schools and Families Want Prevalence of Lender Lists for Private Loans
56%
34%
10%
69%
21%
10%
42%
54%
4%
12%
65%
23%
0.0%
10.0%
20.0%
30.0%
40.0%
50.0%
60.0%
70.0%
Yes No Not Sure
Per
cen
tage
of
Tot
al R
esp
ond
ents
Overall
4-year private
4-year public
2-year public
Survey question: Is your institution planning to provide students with a lender list for private loans for the 2009-10 school year?Source: SLA Flash Survey: Private Student Loans, June 2009 (187 respondents)

Slide 24© Student Lending Analytics, LLC
What Schools and Families Want Lender Selection Process for 2009-10
35%
32%
12%
8%
14%
0.0%
10.0%
20.0%
30.0%
40.0%
Formal RFI Keep List from08-09
All Lenders Last3-5 Yrs
Informal Process OtherPer
cen
tage
of
Res
pon
den
ts W
ith
Len
der
Lis
t fo
r 20
09-1
0
Survey question: Please describe your institution's process for developing a lender list for private student loans.Source: SLA Flash Survey: Private Student Loans, June 2009 (187 respondents)

Slide 25© Student Lending Analytics, LLC
What Schools and Families Want Selection Criteria for Private Lenders
23%
18%15%
13%
10%8%
5% 5%4%
0.0%
5.0%
10.0%
15.0%
20.0%
25.0%
Loan C
ost
Loan A
pprova
l Rat
es/T
erm
s
Custo
mer
Serv
ice
Technolo
gy
Lender
Bac
kgrou
nd
Borro
wer B
enef
its
Transp
aren
cy
Default
Initi
ativ
es/ L
itera
cy
Direct
-to-C
onsu
mer
Mar
keting
Ave
rage
Wei
ghti
ng
Source: Survey of SLA Clients, June 2009

Slide 26© Student Lending Analytics, LLC
What Schools and Families Want Lenders On Private Loan Lists
0%
17%
48%
24%
12%
0.0%
10.0%
20.0%
30.0%
40.0%
50.0%
1 2 to 3 4 to 5 5 to 7 Over 8
Per
cen
tage
of
Res
pon
den
ts W
ith
Len
der
Lis
t fo
r 20
09-1
0
Survey question: How many lenders does your institution plan to have on your lender list for private loans for the 2009-10 academic year? Source: SLA Flash Survey: Private Student Loans, June 2009 (187 respondents)
Slide 27© Student Lending Analytics, LLC
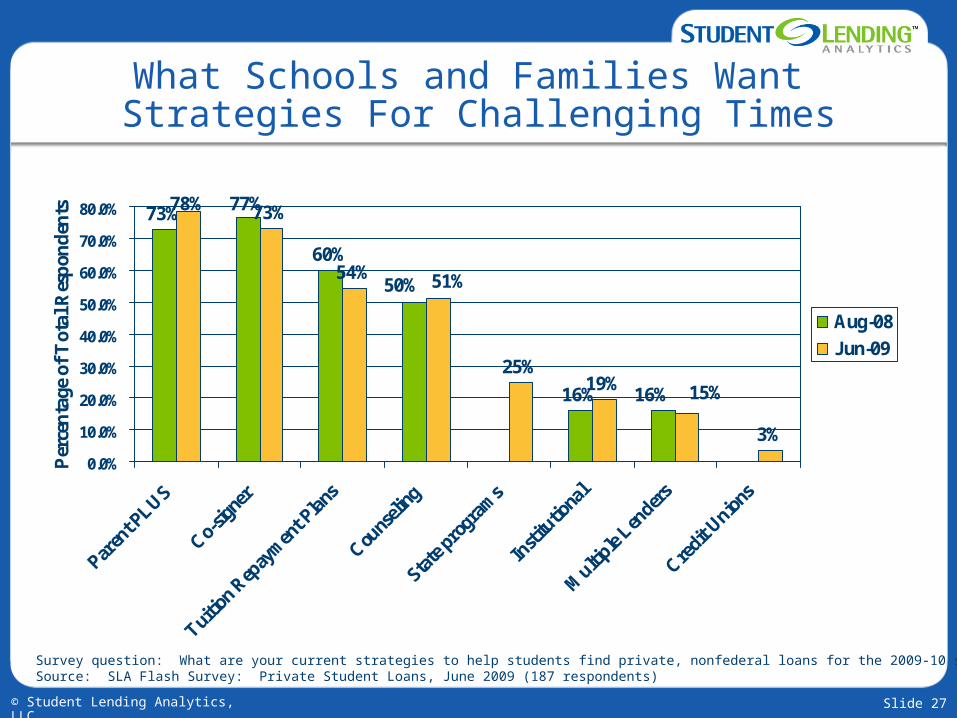
What Schools and Families Want Strategies For Challenging Times
73% 77%
60%
16%
78% 73%
54%
25%19%
3%
16%
50%
15%
51%
0.0%
10.0%
20.0%
30.0%
40.0%
50.0%
60.0%
70.0%
80.0%
Paren
t PLUS
Co-sig
ner
Tuitio
n Rep
aym
ent P
lans
Couns
eling
State
pro
gram
s
Insti
tutio
nal
Multi
ple Len
ders
Credi
t Unio
ns
Per
cen
tage
of
Tot
al R
esp
ond
ents
Aug-08
Jun-09
Survey question: What are your current strategies to help students find private, nonfederal loans for the 2009-10 school year?Source: SLA Flash Survey: Private Student Loans, June 2009 (187 respondents)

Slide 28© Student Lending Analytics, LLC
What Schools and Families WantOther Strategies/Observations
“Reach out to lenders who may be coming out with new loan programs that have favorable terms.”
“We're only recommending private loans to foreign students who will need to provide a co-signer. Although we're not recommending PELs to other types of students, we are leaving it up to them providing counseling on good and bad points of PELs vs federal loans.”
“We package students with a PLUS or Grad/PLUS loan, those seeking alternative loans [must] request [one] or are due to PLUS denial.”
“The issue is not availability. the banks keep raising their interest rates and fees. We are a grad business school only and even our students who have excellent scores are getting high rates. If students get co-signers, they get much better rates.”

Slide 29© Student Lending Analytics, LLC
What Schools and Families Want Agenda
Federal Student Loans– Trends in projected market share for FFEL and Direct Lending programs– Schools rate the strengths and weaknesses of the programs– Updated information on “Who’s Going Direct?”
Private Student Loans– Cutback in private loan availability leading to sharp increase in federal loans– Schools remains concerned about availability of private loans for 2009-10– Schools utilizing variety of strategies to deal with expected shortfall
Financial Literacy programs– Recent research suggests significant room for improving financial
literacy of students– $500 million fund likely to lead to explosion of on-line offerings
catering to high school/college populations– Schools recognize importance of programs but suffer from resource
constraints when it comes to implementation

Slide 30© Student Lending Analytics, LLC
What Schools and Families WantFinancial Literacy Research
Negative trends at the high school level– The financial literacy of high school students has fallen to its lowest level
ever, with a score of just 48.3 percent.
College students score 30% higher than high school students– Scores increase by each grade level in college
In terms of their topical strengths and weaknesses:– Strengths: Income and Spending– Weaknesses: Money Management and Saving
College student test results question efficacy of high school courses in personal finance or money management– May not be appropriate until students care (situation specific)
Simulations/Interactive exercises seem particularly effective Source: The Financial Literacy of Young American Adults, by Lewis Mandell, Ph.D.

Slide 31© Student Lending Analytics, LLC
What Schools and Families Want$500 Million College Access and Completion
Innovation Fund
Proposed in 2010 budget with $2.5 billion commitment over 5 years
To fund outreach and literacy programs on state-by-state basis– Support federal/state partnerships to increase college completion rates
Recent credit card bill also may spur literacy programs– Education/Treasury/Office of Financial Literacy to study current activities– Looking into funding these programs through credit card transaction fees
Expect an explosion of online financial literacy programs– College Foundation, Inc. – NSLP– USA Funds

Slide 32© Student Lending Analytics, LLC
What Schools and Families Want Increased Interest in Financial Literacy
Programs
63%
37%
0.0%
10.0%
20.0%
30.0%
40.0%
50.0%
60.0%
70.0%
80.0%
Yes No
Per
cen
tage
of
Tot
al R
esp
ond
ents
Survey question: Have you seen an increased interest in financial literacy by the students at your institution?
Source: SLA Flash Survey: Financial Literacy, September 2008 (200 respondents)

Slide 33© Student Lending Analytics, LLC
What Schools and Families Want Prevalence of Financial Literacy Programs
39%
59%
33%
26%
0.0%
10.0%
20.0%
30.0%
40.0%
50.0%
60.0%
Overall 4-year public 4-year private 2-year public
Per
cen
tage
of
Tot
al R
esp
ond
ents
Survey question: Does your institution currently offer a financial literacy program beyond standard entrance and exit loan counseling to your students?Source: SLA Flash Survey: Financial Literacy, September 2008 (200 respondents)

Slide 34© Student Lending Analytics, LLC
What Schools and Families Want Financial Literacy Topics
88%
74% 73%
57%53% 51%
41% 38% 35%31%
0.0%
10.0%
20.0%
30.0%
40.0%
50.0%
60.0%
70.0%
80.0%
90.0%
Budget
ing
Loan R
epay
men
t
Credit
Cards
Protec
ting P
rivac
y
Credit
Repor
t
Schola
rship
/Gra
nts
Balancin
g Chec
kbook
Findin
g Loa
ns
Earnin
gs P
oten
tial
Inve
sting
Per
cen
tage
of
Tot
al R
esp
ond
ents
Survey question: What are the topic(s) covered by your financial literacy training?
Source: SLA Flash Survey: Financial Literacy, September 2008 (200 respondents)

Slide 35© Student Lending Analytics, LLC
What Schools and Families Want Content Delivery for Financial Literacy
Programs
82%
46%43%
30%
18%
0.0%
10.0%
20.0%
30.0%
40.0%
50.0%
60.0%
70.0%
80.0%
90.0%
In-person groupworkshops
Handouts Reference page onwebsite
Online tutorials Other
Per
cen
tage
of
Tot
al R
esp
ond
ents
Survey question: How does your institution administer the financial literacy program?
Source: SLA Flash Survey: Financial Literacy, September 2008 (200 respondents)
Slide 36© Student Lending Analytics, LLC
What Schools and Families WantRecommended Financial Literacy Sources
Student groups – Students in Free Enterprise (SIFE) association
Schools– Brigham Young University– James Madison University– Midwestern University– Montgomery College– Texas Tech’s Red to Black Program – University of Georgia – University of Wisconsin-Madison– Virginia Tech
Media– Magazines: Money, Kiplinger– Online: Motley Fool, CNN Money

Slide 37© Student Lending Analytics, LLC
What Schools and Families WantRecommended Financial Literacy Sources
(continued)
Guarantors– TGSLC – Positive Balance– NSLP – Financial Literacy Online– NY HESC– USA Funds Life Skills– EdFund– MGSLP
Non-Profits/Associations– NASFAA– National Endowment for Financial Education (NEFE) – Cashcourse.org
WASFAA Spring Training 2008 – Developing and Delivering Financial Literacy Program

Slide 38© Student Lending Analytics, LLC
What Schools and Families WantQuestions
????

Slide 39© Student Lending Analytics, LLC
Student Lending AnalyticsBackground
Founded in 2007
Independent Research and Advisory Service with NO lender affiliations
Mission: Find best lenders for students through an analytically rigorous and comprehensive process
Services– SLA grades private loans with SLA Private Loan Ratings– RFI Management of FFEL and Private Loans– Research
Successes to Date– Managed RFI process at institutions with over $850 million in loan volume– Inside Student Lending, our monthly newsletter, reaches over 5,000 financial aid
administrators– Student Lending Analytics Blog has become the go-to source for breaking
developments and analysis on the student lending industry– SLA Flash Surveys have included the insights from over 1,500 financial aid
professionals on a variety of timely topics– Private Loan Options and the SLA’s 2008 Alternative Loan Guide provides
students and financial aid offices with an objective and focused list of private lenders

Slide 40© Student Lending Analytics, LLC
The Student Lending Analytics ProcessRFI Management

Slide 41© Student Lending Analytics, LLC
Student Lending AnalyticsResearch Services
Inform financial aid offices on industry developments (implications for their lender lists and relationships)
– Student Lending Analytics Blog• Timely insights to developments in student lending industry
– Alerts• Legislation, lender exits, earnings calls, industry insight
– Monthly newsletter• August – Tips for Lender Lists
– Webinars• April – Lessons Learned in Trenches of Lender Selection Process• September – HEOA and Lender Lists• December – Conversation about FFEL and Direct Lending Programs
– Surveys (summaries available on our website)• FFEL vs. Direct Lending• RFI Practices• Implementing increased Federal Stafford loan limits• Alternative Loans• Private Loans for International Students
– Legislative and regulatory updates– White papers– Help Line to answer questions/resolve issues throughout the year

Slide 42© Student Lending Analytics, LLC
Student Lending AnalyticsContact Information
For more information about SLA contact us at: Tim Ranzetta
Student Lending Analytics LLC
650-218-8408
www.studentlendinganalytics.com