slide 1. slide 2 how to classify a star and to place it on the h-r diagram correctly?? need to know...
Post on 22-Dec-2015
213 views
TRANSCRIPT

Slide 1

Slide 2
How to classify a star and to place it on the H-R diagram correctly??
• Need to know its luminosity, but it is difficult, because distance is unknown
• If you can estimate a star’s diameter and/or mass, you can figure out its luminosity
• Then you can also find the distance to this star

Slide 3
The Radii of Stars in the Hertzsprung-Russell Diagram
10,000 times the
sun’s radius
100 times the
sun’s radius
As large as the sun
Rigel Betelgeuse
Sun
Polaris

Slide 4
The Relative Sizes of Stars in the Hertzsprung-Russell Diagram

Slide 5
Is there any spectral signature of giants?
The width of spectral lines!
How to distinguish between main-sequence stars and giants?

Slide 6
Spectral Lines of Giants
=> Absorption lines in spectra of giants and supergiants are narrower than in main sequence stars
Pressure and density in the atmospheres of giants are lower than in main sequence stars.
=> From the line widths, we can estimate the size and therefore, the luminosity of a star.
Distance estimate (spectroscopic parallax)

Slide 7
Luminosity Classes
Ia Bright Supergiants
Ib Supergiants
II Bright Giants
III Giants
IV Subgiants
V Main-Sequence Stars
IaIb
IIIII
IV
V

Slide 8
Luminosity classes
• Ia bright supergiant
• Ib Supergiant
• II bright giant
• III giant
• IV subgiant
• V main-sequence star

Slide 9
Example Luminosity Classes
• Our Sun: G2 star on the Main Sequence:
G2V
• Polaris: G2 star with Supergiant luminosity:
G2Ib

Slide 10
Mass is the most important parameter.
Knowing masses of stars would allow us to calculate their luminosities, lifetime and all other properties.
But how to measure masses??
Measuring masses

Slide 11
Binary StarsMore than 50 % of all stars in our Milky Way
are not single stars, but belong to binaries:
Pairs or multiple systems of stars which
orbit their common center of mass.
If we can measure and understand their orbital
motion, we can
estimate the stellar masses.
Measuring masses

Slide 12
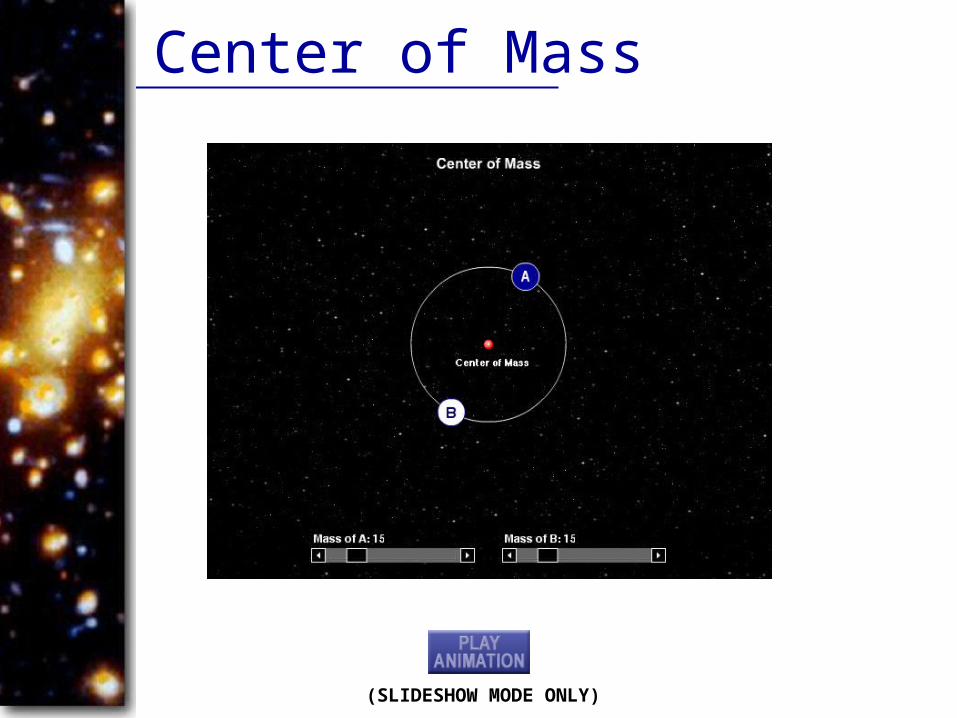
The Center of Mass
center of mass = balance point of the system.Both masses equal => center of mass is in the middle, rA = rB.
The more unequal the masses are, the more it shifts toward the more massive star.
Slide 13
Center of Mass
(SLIDESHOW MODE ONLY)

Slide 14
m1m2
0221
21 rr
mGmFF
1F
2F
0r
1
2
2
1
d
d
m
m

Slide 15
Estimating Stellar Masses
Recall Kepler’s 3rd Law:
Py2 = aAU
3
Valid for the Solar system: star with 1 solar mass in the center.
We find almost the same law for binary stars with masses MA and MB different
from 1 solar mass:
MA + MB = aAU
3 ____ Py
2
(MA and MB in units of solar masses)

Slide 16
Examples: Estimating Mass
Binary system with period of P = 32 years and separation of a = 16 AU:
MA + MB = = 4 solar masses.163____322
How to measure period and separation?
Arbitrary units:
22
324
PG
aMM BA

Slide 17
Visual Binaries
The ideal case:
Both stars can be seen directly, and
their separation and relative motion can be followed directly.

Slide 18
Visual binaries
The Castor system The Sirius system
The two stars are separately visible in the telescope

Slide 19
Detecting the presence of a companion by its gravitational influence on the primary star.
Wobbling motion of Sirius A
Slide 20
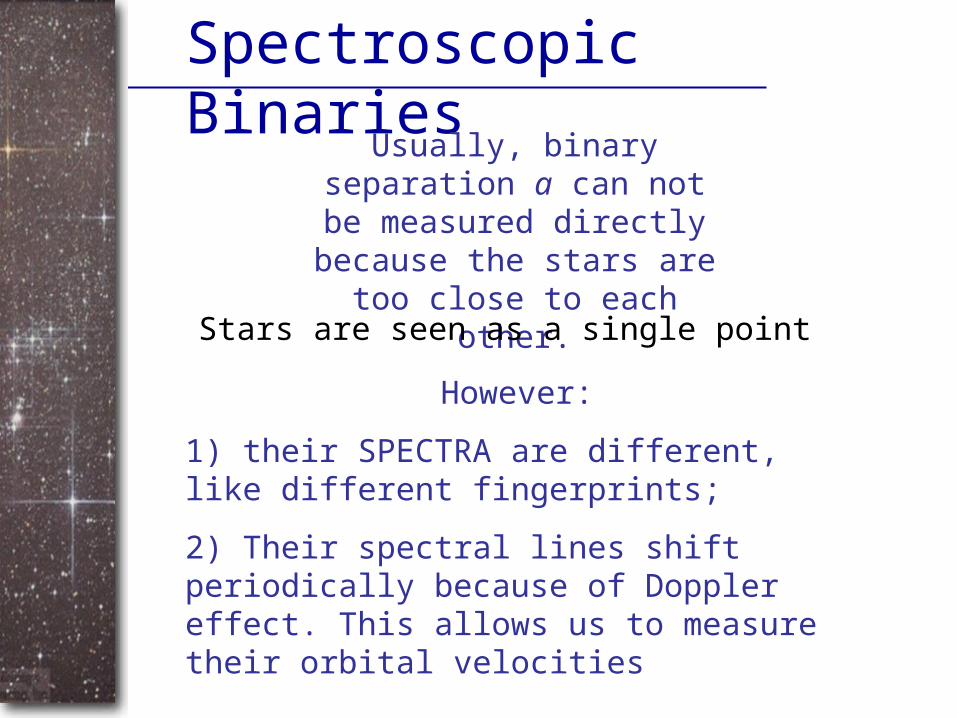
Spectroscopic Binaries
Usually, binary separation a can not be measured directly
because the stars are too close to each other.
However:
1) their SPECTRA are different, like different fingerprints;
2) Their spectral lines shift periodically because of Doppler effect. This allows us to measure their orbital velocities
Stars are seen as a single point

Slide 21
The Doppler EffectThe light of a moving source is blue/red shifted by
/0 = vr/c
0 = actual wavelength
emitted by the source
Wavelength change due to
Doppler effect
vr = radial velocity( along
the line of sight)
Blue Shift (to higher frequencies)
Red Shift (to lower frequencies)
vr
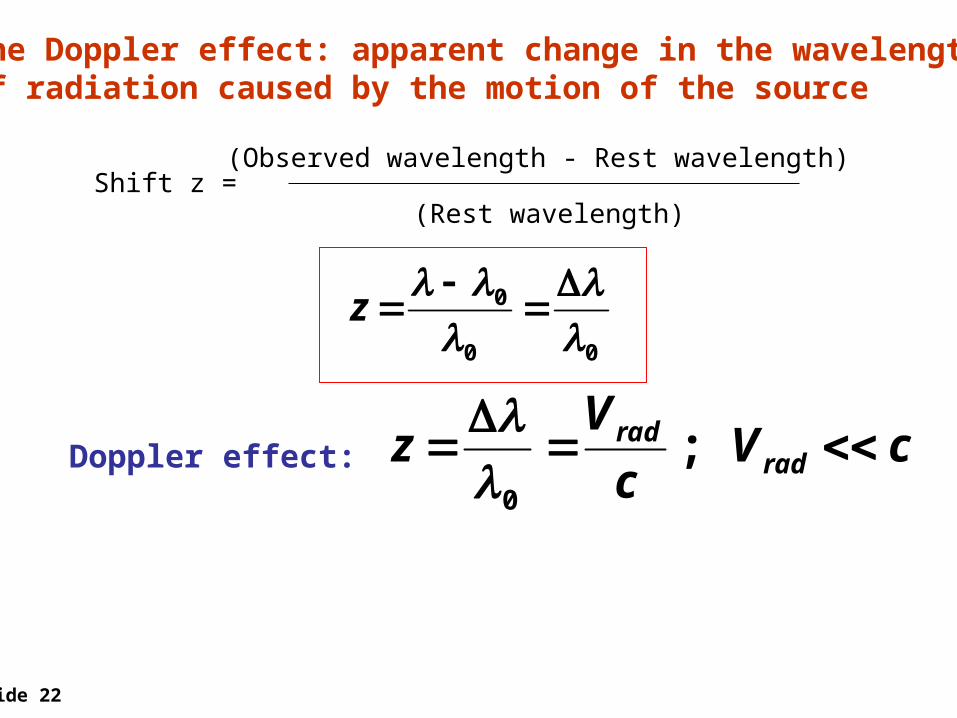
Slide 22
Shift z = (Observed wavelength - Rest wavelength)
(Rest wavelength)
Doppler effect: cVc
Vz rad
rad
;0
00
0
z
The Doppler effect: apparent change in the wavelength of radiation caused by the motion of the source

Slide 23
Doppler effect
1c
;c
radial
00
radial
V
f
fV
The Doppler effect: apparent change in the wavelength of radiation caused by the motion of the source
RADIAL velocity!!

Slide 24
The Doppler Effect The Doppler effect allows us to
measure the source’s radial velocity.
vr
/0 = vr/c

Slide 25
Spectroscopic BinariesThe approaching star produces blue shifted lines; the receding star produces red shifted lines in the spectrum.
Doppler shift Measurement of radial velocities
Estimate of separation a
Estimate of masses

Slide 26
Spectroscopic binaries
Stars are seen as a single point
• Spectra of both stars are distinguishable
• Sometimes spectrum of only one star is seen

Slide 27
Spectroscopic Binaries (3)T
ime
Typical sequence of spectra from a spectroscopic binary system

Slide 28
Determining the orbital period

Slide 29
• Measure the orbital period
• Measure the radial component of the orbital velocities
• Can estimate the orbit size
• Can determine masses!
;2
3
21 P
aMM

Slide 30
1. Below is a radial velocity curve for a spectroscopic binary. Estimate the mass of each star if the mass of the binary system is 6 solar masses.
Time (days)
V (km/sec)r
-15
-20
-25
-10
-5Star A
Star B
MA dA = MB dB
V ~ 2d/P
2
1
A
B
A
B
B
A
V
V
d
d
M
M
6 BA MM

Slide 31
Only the function of masses and inclination anglecan be measured

Slide 32

Slide 33
...BUT
THE PLANET CANNOT BE SEEN
MOTIONS OF THE STAR
BETRAYITS PRESENCE !

Slide 34
X
EARTH
X
JUPITER
150 000 000 km
30 km/s
450 km
9 cm/s
780 000 000 km
13 km/s
750 000 km
13 m/s

Slide 35
2010
2000
2005
1995
1990
2015
2020
0.002”
MOTIONS OF THE SUN VIEWED FROM A STAR 30 LIGHT YEARS AWAY
0.002’’ IS THE ANGULAR SIZE OF A MAN ON THE MOON OR A STANDARD NEWSPAPER FONT 300 KM AWAY Unobservable!

Slide 36
STELLARWOBBLE
RECEDING:
REDDER
APPROACHING:
BLUER

Slide 37

Slide 38
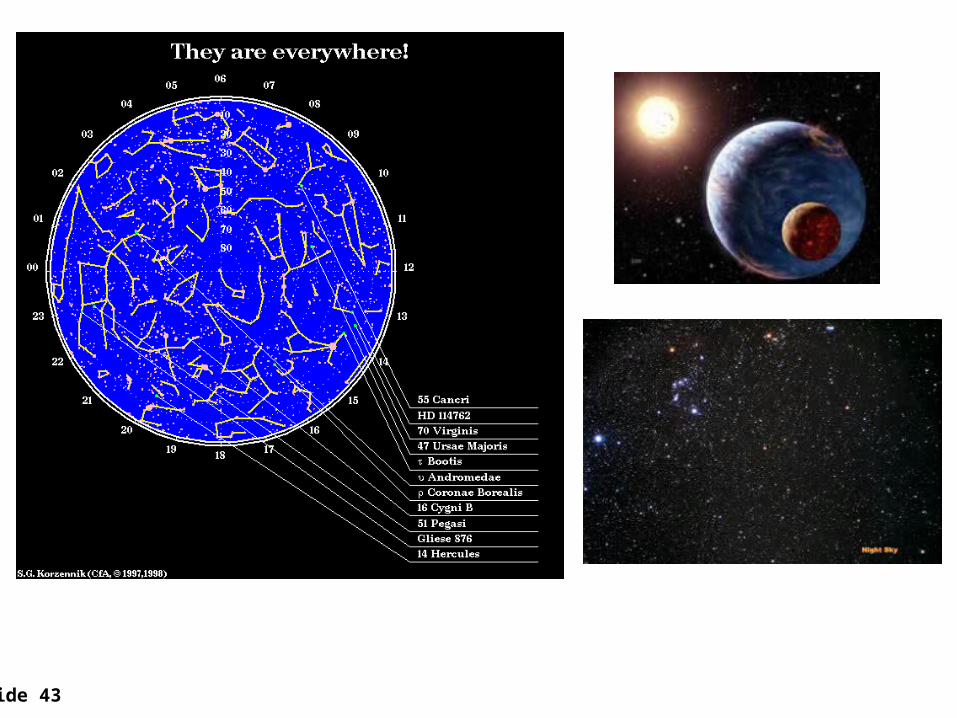
Over 100 planets discovered

Slide 39
EXPECTED:
NEARLY CIRCULARNEARLY CIRCULAR ORBITS ORBITS
BIG PLANETS BIG PLANETS FAR AWAY FROM THE STARFAR AWAY FROM THE STAR
NONO PLANETS BIGGER THAN JUPITER PLANETS BIGGER THAN JUPITER
DISCOVERED:
STRONGLY ELONGATEDSTRONGLY ELONGATED ORBITS ORBITS
BIG PLANETS BIG PLANETS VERY CLOSE TOVERY CLOSE TO THE STARTHE STAR
MANYMANY PLANETS BIGGER THAN JUPITER PLANETS BIGGER THAN JUPITER

Slide 40
Planetary system of And
Solar system
0.06 AU4.5 days0.75 MJ
2.5 AU3.5 years
4 MJ
0.85 AU242 days
2 MJ
0.39 AU89 days
0.73 AU228 days
1 AU1 year 1.54 AU
1.9 years
Source: Harvard-Smithsonian CfA

Slide 41
Habitable zones

Slide 42
Signs of life in the spectrum:
Slide 43

Slide 44
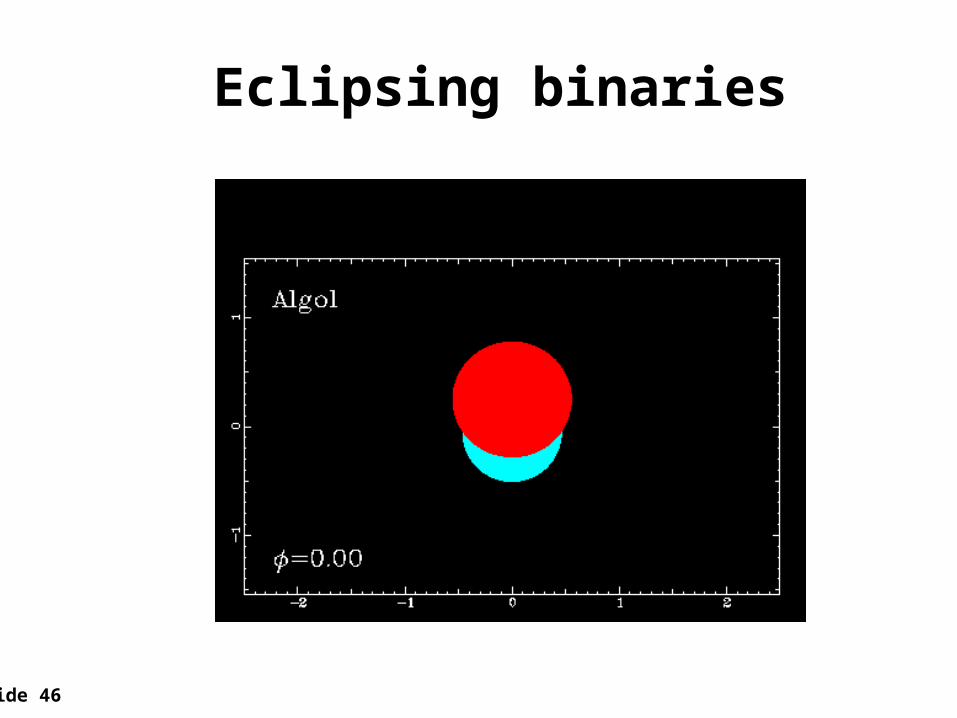
The Puzzle of Algol

Slide 45
John Goodricke 1764-1786
Explained Algol puzzle in 1783
Slide 46
Eclipsing binaries

Slide 47
Eclipsing Binaries
Usually, inclination angle of binary systems is
unknown uncertainty in mass estimates.
Special case:
Eclipsing Binaries
Here, we know that we are looking at the
system edge-on!

Slide 48
The light curve of Algol

Slide 49

Slide 50
Measuring orbital period and diameters

Slide 51
Measuring diameters
D = Vorb (t2 – t1)

Slide 52
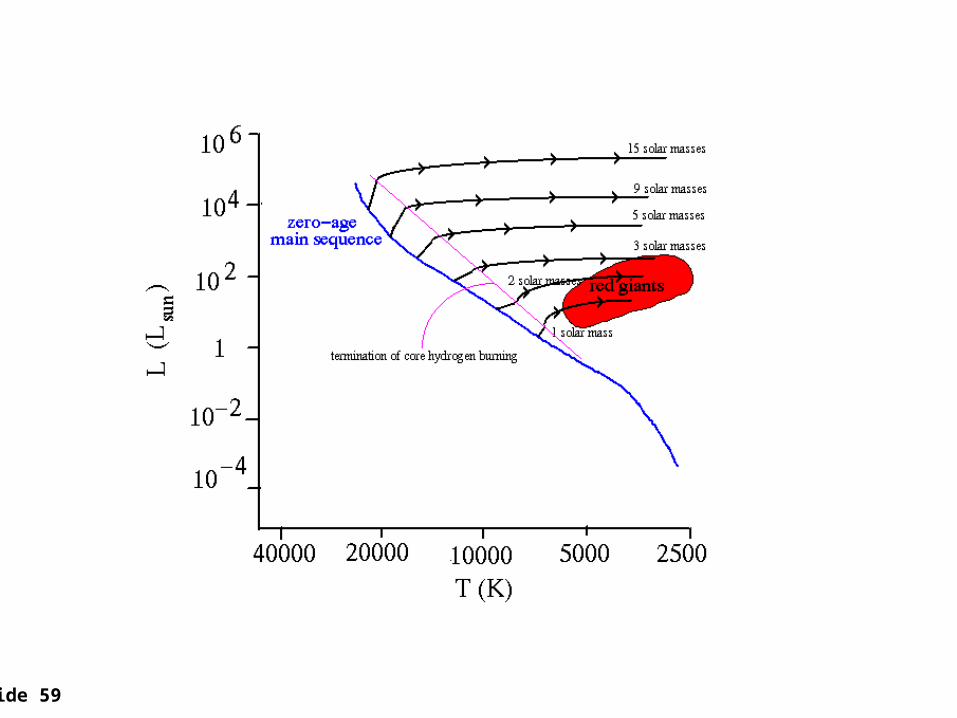
Specific segments of the main sequence are occupiedby stars of a specific mass
L~ M3.5 dependence, but Cutoff at masses > 100 M and < 0.08 M

Slide 53
Puzzles of H-R diagram
• Why > 90% of stars are on the main sequence?
• Reason for mass-luminosity dependence and mass cutoff
• Same stars at different stages of life or just different stars?

Slide 54
How can we learn about the life of stars??
• Our life span is ~ 80 years
• Human civilization exists ~ 5000 years
• Our Sun exists at least 4.6 billion years!

Slide 55
Star Clusters – “School Classes” for Stars
They consist of stars of the same age !
Open clusters100’s of stars
Globular clusters100,000 of stars

Slide 56 p. 188
Pleiades

Slide 57

Slide 58
Age of the cluster from turnoff point
Turnoff point: stars of that mass are going to die and move away from the main sequence
Slide 59

Slide 60

Slide 61

Slide 62
Stars spent most of their lives on the Main Sequence. That is why it is so populated!
At the end of its life the star moves away from the Main Sequence
More massive and more luminous stars die faster
Hypothesis: Stars on the Main Sequence live due to nuclear fusion of hydrogen!
• Stars stay on the main sequence until all hydrogen in the core is consumed • Then something should happen

Slide 63
H-R diagram
• 90% of stars are on the main sequence and obey the mass-luminosity dependence L ~ M3.5
• Stars on the main sequence generate energy due to nuclear fusion of hydrogen
• In the end of their lives stars move to the upper right corner of the H-R diagram

Slide 64
Check this hypothesis
• Mass should be most important parameter
• It determines the pressure in the star center and the central temperature
• It determines the surface temperature
5.3
sunsun M
M
L
L
5.3ML
How to get this dependence?

Slide 65
Gravity Holds a Star Together
Stars are held together by gravity. Gravity tries to compress everything to the center. What holds an ordinary star up and prevents total collapse is thermal and radiation pressure. The thermal and radiation pressure tries to expand the star layers outward to infinity.
1. Newton’s gravitation law2. Hydrostatic equilibrium3. Equation of state4. Energy transport
Mass determines all star’s properties

Slide 66
star mass (solar masses) time (years) Spectral type
60 3 million O3
30 11 million O7
10 32 million B4
3 370 million A5
1.5 3 billion F5
1 10 billion G2 (Sun)
0.1 1000's billions M7
Lifetime T ~ M/L ~ 1/M3.5-1 = 1/M2.5 ; p ~ 3.5
M = 4M; 32
15.2
M
M
T
T sun
sun
Lifetime = Amount of hydrogen fuel
Rate of energy loss
T ~ 3x10⁸ years

Slide 67

Slide 68
How to explain the cutoff at masses > 100 M and < 0.08 M

Slide 69
Maximum Masses of Main-Sequence Stars
Carinae
Mmax ~ 50 - 100 solar masses
a) More massive clouds fragment into smaller pieces during star formation.
b) Very massive stars lose mass in strong stellar winds
Example: Carinae: Binary system of a 60 Msun and 70 Msun star. Dramatic mass loss; major eruption in 1843 created double lobes.

Slide 70
Too massive and luminous stars throw off their outerlayers due to radiation pressure
Eta Carinae
High-mass cutoff at M ~ 100 Msun

Slide 71
Minimum Mass of Main-Sequence Stars
Mmin = 0.08 Msun
At masses below 0.08 Msun, stellar progenitors do not get hot enough to ignite thermonuclear fusion.
Brown Dwarfs
Gliese 229B

Slide 72
Low-mass cutoff of the main sequence: M ~ 0.08 Msun
Gliese 229B: only 0.02 M
Brown dwarfs: temperature is too low to ignite nuclear fusion

Slide 73
Conclusion Based on this evidence, we conclude: Stars spend most of their lives as main sequence stars. During its lifetime, the surface temperature and luminosity stays almost constant.
Something else could happen in the star birth process. Something else could happen in the star death process.
The star's mass determines what the temperature and luminosity is during the star's main sequence lifetime.
More mass -> hotter. More mass -> more luminous. Also, more mass -> bigger.