slide 1 computers for the post-pc era david patterson, katherine yelick university of california at...
Post on 22-Dec-2015
214 views
TRANSCRIPT

Slide 1
Computers for the Post-PC Era
David Patterson, Katherine YelickUniversity of California at Berkeley
UC Berkeley IRAM Group UC Berkeley ISTORE Group
February 2000

Slide 2
Perspective on Post-PC Era• PostPC Era will be driven by 2 technologies:
1) “Gadgets”:Tiny Embedded or Mobile Devices–ubiquitous: in everything–e.g., successor to PDA,
cell phone, wearable computers
2) Infrastructure to Support such Devices–e.g., successor to Big Fat Web Servers, Database
Servers

Slide 3
Outline1) Example microprocessor for PostPC
gadgets
2) Motivation and the ISTORE project vision– AME: Availability, Maintainability, Evolutionary growth
– ISTORE’s research principles
– Proposed techniques for achieving AME
– Benchmarks for AME
• Conclusions and future work

Slide 4
Intelligent RAM: IRAMMicroprocessor & DRAM on a
single chip:– 10X capacity vs. SRAM– on-chip memory latency
5-10X, bandwidth 50-100X
– improve energy efficiency 2X-4X (no off-chip bus)
– serial I/O 5-10X v. buses– smaller board area/volume
IRAM advantages extend to:– a single chip system– a building block for larger systems
DRAM
fab
Proc
Bus
D R A M
I/OI/O
$ $Proc
L2$
Logic
fabBus
D R A M
BusI/OI/O

Slide 5
New Architecture Directions
• “…media processing will become the dominant force in computer arch. and microprocessor design.”
• “...new media-rich applications ... involve significant real-time processing of continuous media streams, and make heavy use of vectors of packed 8-, 16-, 32-bit integer and Fl. Pt.”
• Needs include real-time response, continuous media data types (no temporal locality), fine grain parallelism, coarse grain parallelism, memory bandwidth– “How Multimedia Workloads Will Change Processor Design”,
Diefendorff & Dubey, IEEE Computer (9/97)
Slide 6
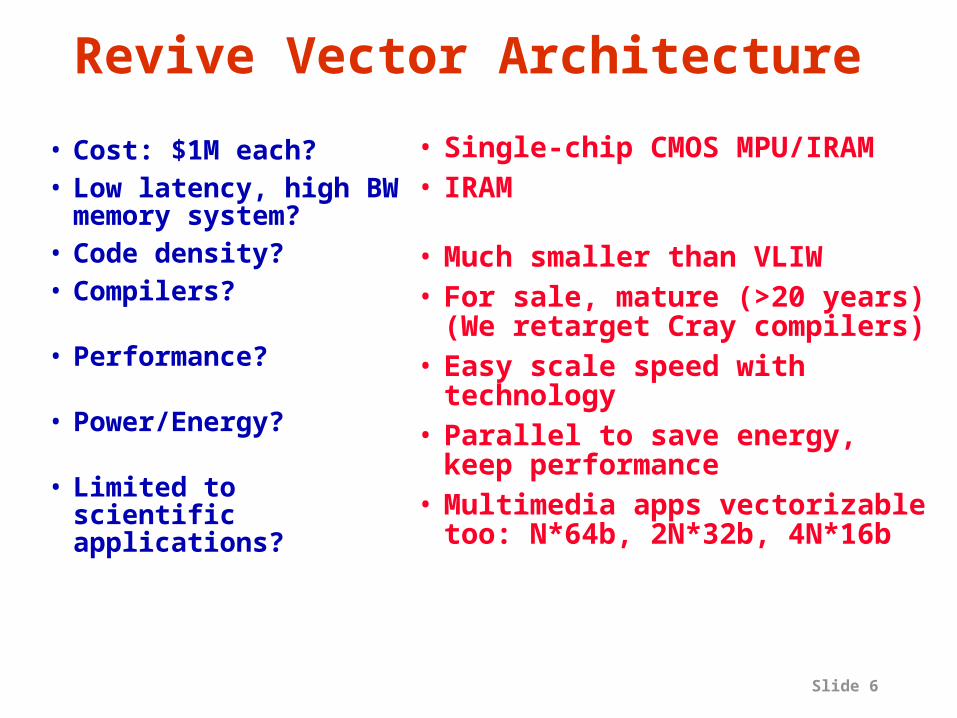
Revive Vector Architecture
• Cost: $1M each?• Low latency, high
BW memory system?• Code density?• Compilers?
• Performance?
• Power/Energy?
• Limited to scientific applications?
• Single-chip CMOS MPU/IRAM• IRAM
• Much smaller than VLIW• For sale, mature (>20 years)
(We retarget Cray compilers)• Easy scale speed with
technology• Parallel to save energy, keep
performance• Multimedia apps vectorizable
too: N*64b, 2N*32b, 4N*16b

Slide 7
V-IRAM1: Low Power v. High Perf.
Memory Crossbar Switch
M
M
…
M
M
M
…
M
M
M
…
M
M
M
…
M
M
M
…
M
M
M
…
M
…
M
M
…
M
M
M
…
M
M
M
…
M
M
M
…
M
+
Vector Registers
x
÷
Load/Store
16K I cache 16K D cache
2-way Superscalar
VectorProcessor
4 x 64 4 x 64 4 x 64 4 x 64 4 x 64
4 x 64or
8 x 32or
16 x 16
4 x 644 x 64
QueueInstruction
I/OI/O
I/OI/O
SerialI/O
Slide 8
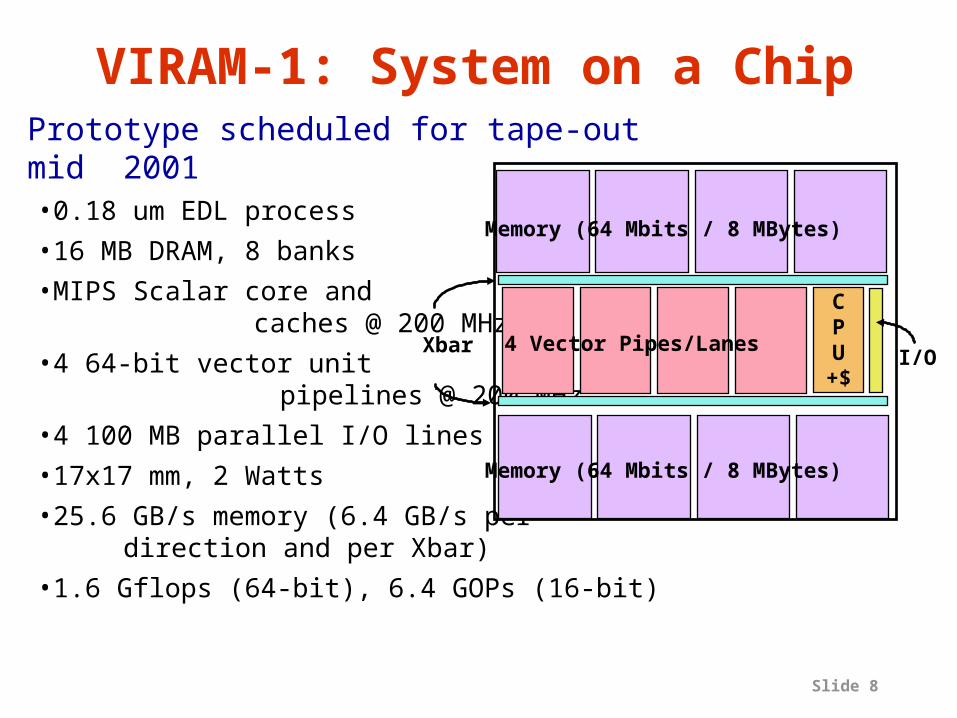
VIRAM-1: System on a ChipPrototype scheduled for tape-out mid 2001•0.18 um EDL process
•16 MB DRAM, 8 banks
•MIPS Scalar core and caches @ 200 MHz
•4 64-bit vector unit pipelines @ 200 MHz
•4 100 MB parallel I/O lines
•17x17 mm, 2 Watts
•25.6 GB/s memory (6.4 GB/s per direction and per Xbar)
•1.6 Gflops (64-bit), 6.4 GOPs (16-bit)
CPU+$
I/O4 Vector Pipes/Lanes
Memory (64 Mbits / 8 MBytes)
Memory (64 Mbits / 8 MBytes)
Xbar
Slide 9
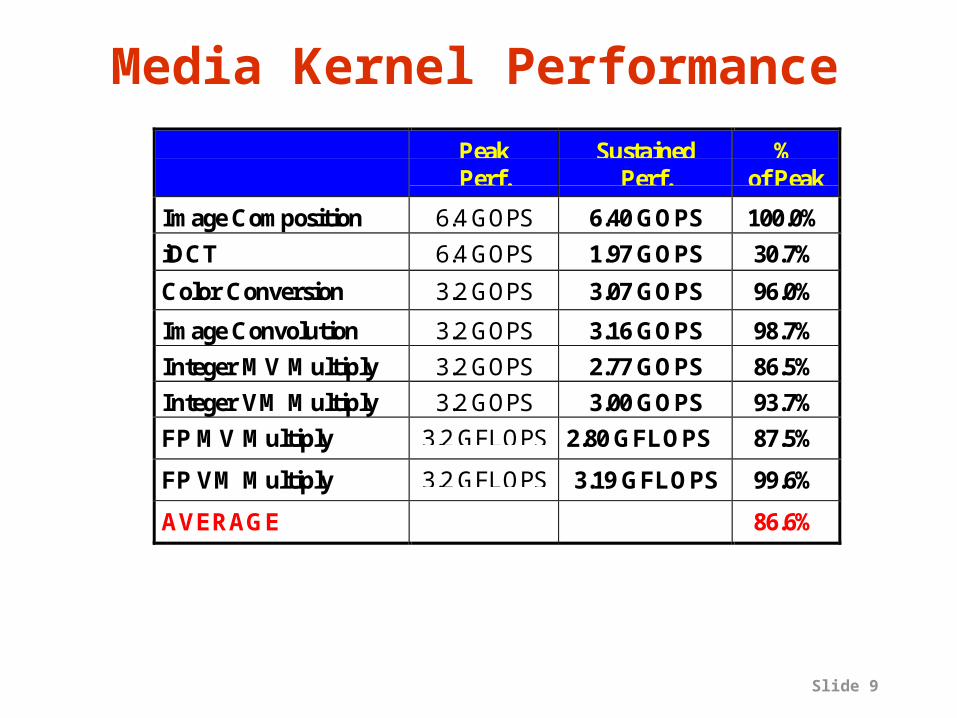
Media Kernel PerformancePeakPerf.
SustainedPerf.
%of Peak
Image Composition 6.4 GOPS 6.40 GOPS 100.0%
iDCT 6.4 GOPS 1.97 GOPS 30.7%
Color Conversion 3.2 GOPS 3.07 GOPS 96.0%
Image Convolution 3.2 GOPS 3.16 GOPS 98.7%
Integer MV Multiply 3.2 GOPS 2.77 GOPS 86.5%
Integer VM Multiply 3.2 GOPS 3.00 GOPS 93.7%
FP MV Multiply 3.2 GFLOPS 2.80 GFLOPS 87.5%
FP VM Multiply 3.2 GFLOPS 3.19 GFLOPS 99.6%
AVERAGE 86.6%

Slide 10
IRAM Chip Challenges• Merged Logic-DRAM process Cost: Cost of
wafer, Impact on yield, testing cost of logic and DRAM
• Price: on-chip DRAM v. separate DRAM chips?
• Delay in transistor speeds, memory cell sizes in Merged process vs. Logic only or DRAM only
• DRAM block: flexibility via DRAM “compiler” (vary size, width, no. subbanks) vs. fixed block
• Apps: advantages in memory bandwidth, energy, system size to offset challenges?

Slide 11
Other examples: IBM “Blue Gene”
• 1 PetaFLOPS in 2003 for $100M?• Application: Protein Folding• Blue Gene Chip
– 25-32 Multithreaded RISC processors + 0.5MB Embedded DRAM / processor + high speed Network Interface on 20 x 20 mm chip– 1 GFLOPS / processor
• 2’ x 2’ Board = 64 chips (1.6K-2K CPUs)• Rack = 8 Boards (512 chips,13K-16K CPUs) • System = 64-80 Racks (512 boards,32-40Kchips)• Total 1 million processors, 1 MW in just 2000 sq. ft.• Since single app, unbalanced system to save money
– Traditional ratios: 1 MIPS, 1 MB, 1 Mbit/s I/O– Blue Gene ratios: 1 MIPS, 0.005 MB, 0.2 Mbit/s I/O

Slide 12
Other examples: Sony Playstation 2
• Emotion Engine: 6.2 GFLOPS, 75 million polygons per second (Microprocessor Report, 13:5)
– Superscalar MIPS core + vector coprocessor + graphics/DRAM– Claim: “Toy Story” realism brought to games

Slide 13
Outline1) Example microprocessor for PostPC
gadgets
2) Motivation and the ISTORE project vision– AME: Availability, Maintainability, Evolutionary growth
– ISTORE’s research principles
– Proposed techniques for achieving AME
– Benchmarks for AME
• Conclusions and future work

Slide 14
The problem space: big data• Big demand for enormous amounts of data
– today: high-end enterprise and Internet applications» enterprise decision-support, data mining databases» online applications: e-commerce, mail, web, archives
– future: infrastructure services, richer data» computational & storage back-ends for mobile devices» more multimedia content» more use of historical data to provide better services
• Today’s SMP server designs can’t easily scale• Bigger scaling problems than performance!

Slide 15
Lampson: Systems Challenges• Systems that work
– Meeting their specs– Always available– Adapting to changing environment– Evolving while they run– Made from unreliable components– Growing without practical limit
• Credible simulations or analysis• Writing good specs• Testing• Performance
– Understanding when it doesn’t matter
“Computer Systems Research-Past and Future”
Keynote address, 17th SOSP,
Dec. 1999Butler Lampson
Microsoft
Slide 16
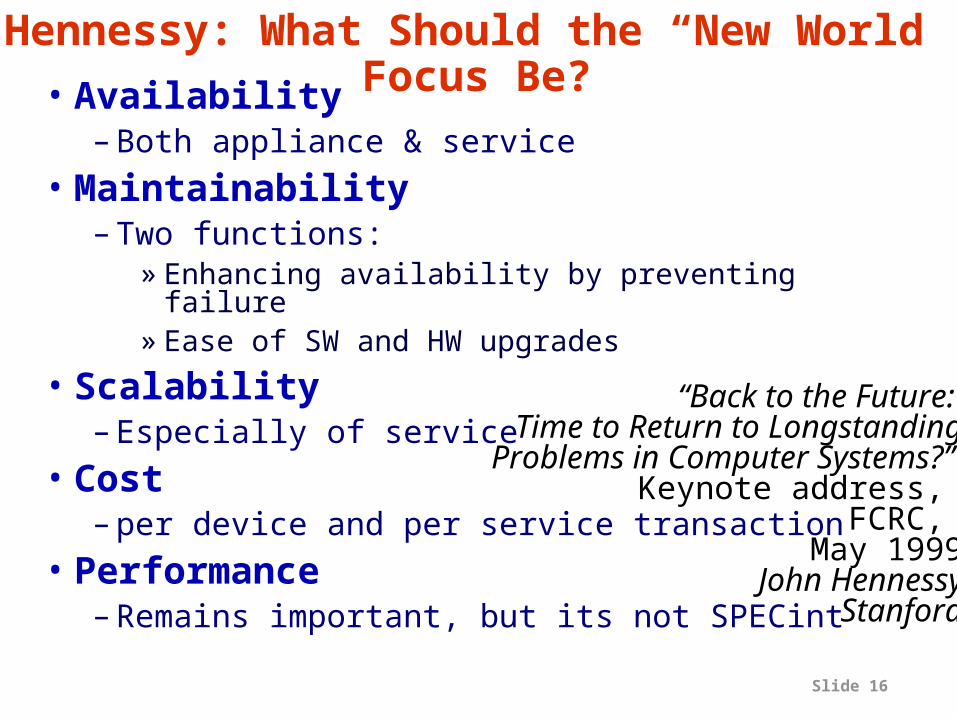
Hennessy: What Should the “New World” Focus Be?• Availability
– Both appliance & service• Maintainability
– Two functions:» Enhancing availability by preventing failure» Ease of SW and HW upgrades
• Scalability– Especially of service
• Cost– per device and per service transaction
• Performance– Remains important, but its not SPECint
“Back to the Future: Time to Return to Longstanding
Problems in Computer Systems?” Keynote address,
FCRC, May 1999
John HennessyStanford

Slide 17
The real scalability problems: AME
• Availability– systems should continue to meet quality of service
goals despite hardware and software failures
• Maintainability– systems should require only minimal ongoing
human administration, regardless of scale or complexity
• Evolutionary Growth– systems should evolve gracefully in terms of
performance, maintainability, and availability as they are grown/upgraded/expanded
• These are problems at today’s scales, and will only get worse as systems grow

Slide 18
The ISTORE project vision• Our goal:
develop principles and investigatehardware/software techniques for
buildingstorage-based server systems that:
–are highly available–require minimal maintenance–robustly handle evolutionary growth–are scalable to O(10000) nodes

Slide 19
Principles for achieving AME (1)
• No single points of failure• Redundancy everywhere• Performance robustness is more
important than peak performance– “performance robustness” implies that real-world
performance is comparable to best-case performance
• Performance can be sacrificed for improvements in AME– resources should be dedicated to AME
» compare: biological systems spend > 50% of resources on maintenance
– can make up performance by scaling system

Slide 20
Principles for achieving AME (2)
• Introspection– reactive techniques to detect and adapt to
failures, workload variations, and system evolution
– proactive techniques to anticipate and avert problems before they happen

Slide 21
Outline1) Example microprocessor for PostPC
gadgets
2) Motivation and the ISTORE project vision– AME: Availability, Maintainability, Evolutionary
growth
– ISTORE’s research principles
– Proposed techniques for achieving AME
– Benchmarks for AME
• Conclusions and future work

Slide 22
Hardware techniques• Fully shared-nothing cluster
organization– truly scalable architecture– architecture that tolerates partial failure– automatic hardware redundancy

Slide 23
Hardware techniques (2)• No Central Processor Unit:
distribute processing with storage– Serial lines, switches also growing with Moore’s
Law; less need today to centralize vs. bus oriented systems
– Most storage servers limited by speed of CPUs; why does this make sense?
– Why not amortize sheet metal, power, cooling infrastructure for disk to add processor, memory, and network?
– If AME is important, must provide resources to be used to help AME: local processors responsible for health and maintenance of their storage

Slide 24
Hardware techniques (3)• Heavily instrumented hardware
– sensors for temp, vibration, humidity, power, intrusion
– helps detect environmental problems before they can affect system integrity
• Independent diagnostic processor on each node– provides remote control of power, remote console
access to the node, selection of node boot code– collects, stores, processes environmental data for
abnormalities– non-volatile “flight recorder” functionality– all diagnostic processors connected via independent
diagnostic network

Slide 25
Hardware techniques (4)• On-demand network
partitioning/isolation– Internet applications must remain available
despite failures of components, therefore can isolate a subset for preventative maintenance
– Allows testing, repair of online system– Managed by diagnostic processor and network
switches via diagnostic network

Slide 26
Hardware techniques (5)• Built-in fault injection capabilities
– Power control to individual node components– Injectable glitches into I/O and memory busses– Managed by diagnostic processor – Used for proactive hardware introspection
» automated detection of flaky components» controlled testing of error-recovery mechanisms
– Important for AME benchmarking (see next slide)

Slide 27
“Hardware” techniques (6)• Benchmarking
– One reason for 1000X processor performance was ability to measure (vs. debate) which is better
» e.g., Which most important to improve: clock rate, clocks per instruction, or instructions executed?
– Need AME benchmarks“what gets measured gets done”“benchmarks shape a field”“quantification brings rigor”

Slide 28
ISTORE-1 hardware platform• 80-node x86-based cluster, 1.4TB storage
– cluster nodes are plug-and-play, intelligent, network-attached storage “bricks”
» a single field-replaceable unit to simplify maintenance
– each node is a full x86 PC w/256MB DRAM, 18GB disk– more CPU than NAS; fewer disks/node than cluster
ISTORE Chassis80 nodes, 8 per tray2 levels of switches•20 100 Mbit/s•2 1 Gbit/sEnvironment Monitoring:UPS, redundant PS,fans, heat and vibration sensors...
Intelligent Disk “Brick”Portable PC CPU: Pentium II/266 + DRAM
Redundant NICs (4 100 Mb/s links)Diagnostic Processor
Disk
Half-height canister

Slide 29
A glimpse into the future?• System-on-a-chip enables computer,
memory, redundant network interfaces without significantly increasing size of disk
• ISTORE HW in 5-7 years:– building block: 2006 MicroDrive
integrated with IRAM » 9GB disk, 50 MB/sec from disk» connected via crossbar switch
– 10,000 nodes fit into one rack!
• O(10,000) scale is our ultimate design point

Slide 30
Software techniques• Fully-distributed, shared-nothing code
– centralization breaks as systems scale up O(10000)
– avoids single-point-of-failure front ends
• Redundant data storage– required for high availability, simplifies self-
testing– replication at the level of application objects
» application can control consistency policy» more opportunity for data placement optimization
Slide 31
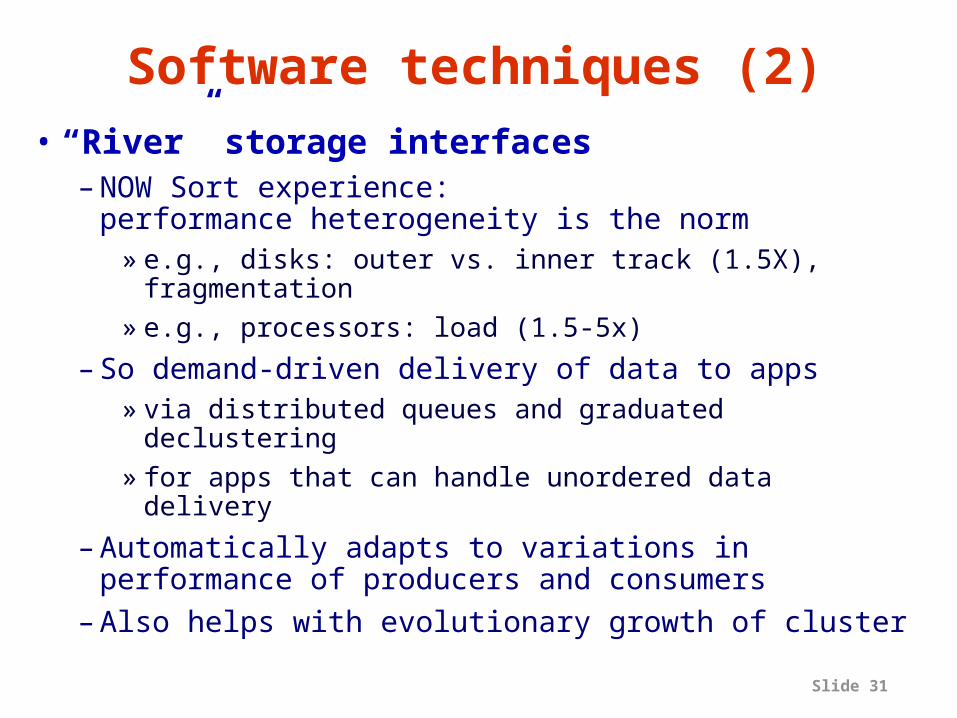
Software techniques (2)• “River” storage interfaces
– NOW Sort experience: performance heterogeneity is the norm
» e.g., disks: outer vs. inner track (1.5X), fragmentation
» e.g., processors: load (1.5-5x)
– So demand-driven delivery of data to apps» via distributed queues and graduated declustering» for apps that can handle unordered data delivery
– Automatically adapts to variations in performance of producers and consumers
– Also helps with evolutionary growth of cluster

Slide 32
Software techniques (3)• Reactive introspection
– Use statistical techniques to identify normal behavior and detect deviations from it
– Policy-driven automatic adaptation to abnormal behavior once detected
» initially, rely on human administrator to specify policy
» eventually, system learns to solve problems on its own by experimenting on isolated subsets of the nodes
•one candidate: reinforcement learning

Slide 33
Software techniques (4)• Proactive introspection
– Continuous online self-testing of HW and SW» in deployed systems!» goal is to shake out “Heisenbugs” before they’re
encountered in normal operation» needs data redundancy, node isolation, fault injection
– Techniques:» fault injection: triggering hardware and software
error handling paths to verify their integrity/existence» stress testing: push HW/SW to their limits» scrubbing: periodic restoration of potentially
“decaying” hardware or software state•self-scrubbing data structures (like MVS)•ECC scrubbing for disks and memory

Slide 34
Outline1) Example microprocessor for PostPC
gadgets
2) Motivation and the ISTORE project vision– AME: Availability, Maintainability, Evolutionary
growth
– ISTORE’s research principles
– Proposed techniques for achieving AME
– Benchmarks for AME
• Conclusions and future work

Slide 35
Availability benchmark methodology• Goal: quantify variation in QoS metrics as
events occur that affect system availability• Leverage existing performance benchmarks
– to generate fair workloads– to measure & trace quality of service metrics
• Use fault injection to compromise system– hardware faults (disk, memory, network, power)– software faults (corrupt input, driver error returns)– maintenance events (repairs, SW/HW upgrades)
• Examine single-fault and multi-fault workloads– the availability analogues of performance micro- and
macro-benchmarks

Slide 36
Time (2-minute intervals)0 5 10 15 20 25 30 35 40 45 50 55 60
Per
form
ance
160
170
180
190
200
210
}normal behavior(99% conf)
injecteddisk failure
reconstruction
• Results are most accessible graphically– plot change in QoS metrics over time– compare to “normal” behavior?
» 99% confidence intervals calculated from no-fault runs
Methodology: reporting results
• Graphs can be distilled into numbers?

Slide 37
Time (2-minute intervals)0 10 20 30 40 50 60 70 80 90 100 110
Hit
s p
er s
eco
nd
140
150
160
170
180
190
200
210
data diskfaulted
reconstruction(manual)
sparefaulted
disks replaced
}normal behavior(99% conf)
Time (2-minute intervals)0 10 20 30 40 50 60 70 80 90 100 110
Hit
s p
er s
eco
nd
140
150
160
170
180
190
200
210
220
data diskfaulted
reconstruction(automatic)
sparefaulted
reconstruction(automatic)
}normal behavior(99% conf)
disks replaced
Example results: multiple-faults
• Windows reconstructs ~3x faster than Linux• Windows reconstruction noticeably affects application
performance, while Linux reconstruction does not
Windows2000/IIS
Linux/Apache

Slide 38
Conclusions (1): ISTORE• Availability, Maintainability, and
Evolutionary growth are key challenges for server systems– more important even than performance
• ISTORE is investigating ways to bring AME to large-scale, storage-intensive servers– via clusters of network-attached, computationally-
enhanced storage nodes running distributed code– via hardware and software introspection– we are currently performing application studies to
investigate and compare techniques• Availability benchmarks a powerful tool?
– revealed undocumented design decisions affecting SW RAID availability on Linux and Windows 2000

Slide 39
Conclusions (2)• IRAM attractive for two Post-PC
applications because of low power, small size, high memory bandwidth– Gadgets: Embedded/Mobile devices– Infrastructure: Intelligent Storage and Networks
• PostPC infrastructure requires – New Goals: Availability, Maintainability, Evolution – New Principles: Introspection, Performance
Robustness– New Techniques: Isolation/fault insertion, Software
scrubbing– New Benchmarks: measure, compare AME metrics

Slide 40
Berkeley Future work• IRAM: fab and test chip• ISTORE
– implement AME-enhancing techniques in a variety of Internet, enterprise, and info retrieval applications
– select the best techniques and integrate into a generic runtime system with “AME API”
– add maintainability benchmarks» can we quantify administrative work needed to
maintain a certain level of availability?– Perhaps look at data security via encryption?– Even consider denial of service?

Slide 41
For more information:
http://iram.cs.berkeley.edu/[email protected]
The UC Berkeley IRAM/ISTORE Projects:
Computers for the PostPC Era

Slide 42
Backup Slides
(mostly in the area of benchmarking)

Slide 43
Case study• Software RAID-5 plus web server
– Linux/Apache vs. Windows 2000/IIS
• Why software RAID?– well-defined availability guarantees
» RAID-5 volume should tolerate a single disk failure» reduced performance (degraded mode) after failure» may automatically rebuild redundancy onto spare
disk
– simple system– easy to inject storage faults
• Why web server?– an application with measurable QoS metrics that
depend on RAID availability and performance

Slide 44
Benchmark environment: metrics
• QoS metrics measured– hits per second
» roughly tracks response time in our experiments
– degree of fault tolerance in storage system
• Workload generator and data collector– SpecWeb99 web benchmark
» simulates realistic high-volume user load» mostly static read-only workload; some dynamic
content» modified to run continuously and to measure
average hits per second over each 2-minute interval
Slide 45
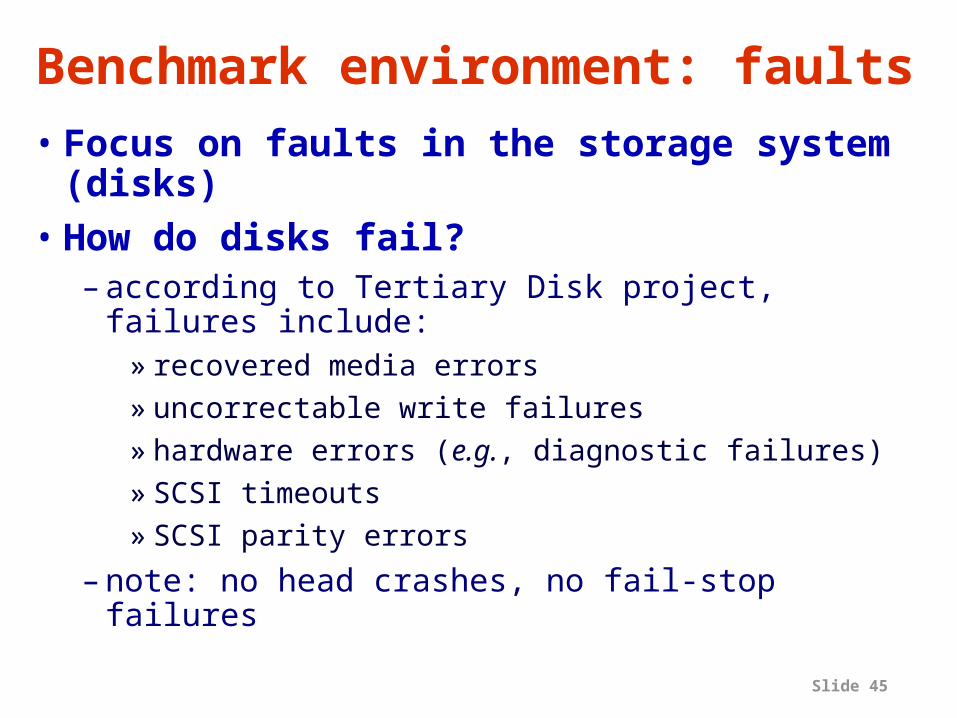
Benchmark environment: faults
• Focus on faults in the storage system (disks)
• How do disks fail?– according to Tertiary Disk project, failures include:
» recovered media errors» uncorrectable write failures» hardware errors (e.g., diagnostic failures)» SCSI timeouts» SCSI parity errors
– note: no head crashes, no fail-stop failures

Slide 46
Disk fault injection technique• To inject reproducible failures, we replaced
one disk in the RAID with an emulated disk– a PC that appears as a disk on the SCSI bus– I/O requests processed in software, reflected to local
disk– fault injection performed by altering SCSI command
processing in the emulation software
• Types of emulated faults:– media errors (transient, correctable, uncorrectable)– hardware errors (firmware, mechanical)– parity errors– power failures– disk hangs/timeouts

Slide 47
System configuration
• RAID-5 Volume: 3GB capacity, 1GB used per disk– 3 physical disks, 1 emulated disk, 1 emulated spare disk
• 2 web clients connected via 100Mb switched Ethernet
IBM18 GB
10k RPM
IBM18 GB
10k RPM
IBM18 GB
10k RPM
Server
AMD K6-2-33364 MB DRAM
Linux or Win2000
IDEsystem
disk
= Fast/Wide SCSI bus, 20 MB/sec
Adaptec2940
Adaptec2940
Adaptec2940 Adaptec
2940
RAIDdata disks
IBM18 GB
10k RPM
SCSIsystem
disk
Disk Emulator
AMD K6-2-350Windows NT 4.0
ASC VirtualSCSI lib.
Adaptec2940
emulatorbacking disk
(NTFS)AdvStorASC-U2W
UltraSCSI
EmulatedSpareDisk
EmulatedDisk
Slide 48
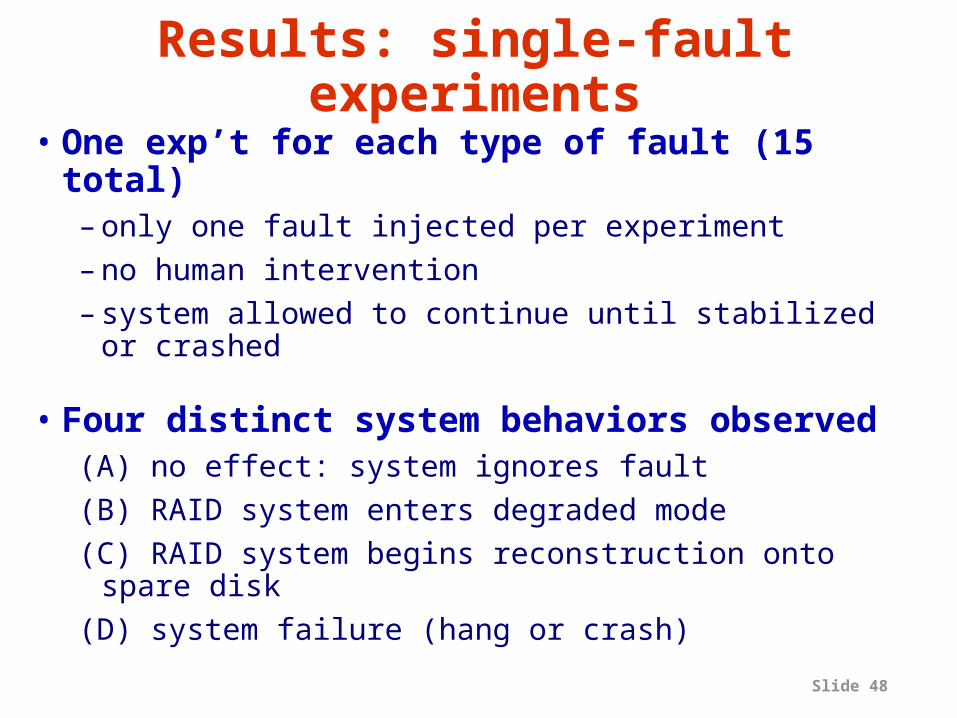
Results: single-fault experiments
• One exp’t for each type of fault (15 total)– only one fault injected per experiment– no human intervention– system allowed to continue until stabilized or
crashed
• Four distinct system behaviors observed(A) no effect: system ignores fault(B) RAID system enters degraded mode(C) RAID system begins reconstruction onto spare disk(D) system failure (hang or crash)

Slide 49
State of the Art: Ultrastar 72ZX– 73.4 GB, 3.5 inch disk– 2¢/MB– 16 MB track buffer– 11 platters, 22 surfaces– 15,110 cylinders– 7 Gbit/sq. in. areal
density– 17 watts (idle)– 0.1 ms controller time– 5.3 ms avg. seek
(seek 1 track => 0.6 ms)– 3 ms = 1/2 rotation– 37 to 22 MB/s to media
source: www.ibm.com; www.pricewatch.com; 2/14/00
Latency = Queuing Time + Controller time +Seek Time + Rotation Time + Size / Bandwidth
per access
per byte{+
Sector
Track
Cylinder
Head PlatterArm
Embed. Proc.
Track Buffer