slide 1-1mdassana/stp226/ppt/ch1.pdf · political polling provides an example of inferential ......
TRANSCRIPT

Slide 1-1

Slide 1-2 Copyright © 2012, 2008, 2005 Pearson Education, Inc.
Chapter 1
The Nature of Statistics

Slide 1-3 Copyright © 2012, 2008, 2005 Pearson Education, Inc.
Section 1.1
Statistics Basics
Slide 1-4 Copyright © 2012, 2008, 2005 Pearson Education, Inc.
Definition 1.1
Descriptive statistics includes the construction of
graphs, charts, and tables and the calculation of
various descriptive measures such as averages,
measures of variation, and percentiles.
The 1948 Baseball Season. In 1948, the Washington
Senators played 153 games, winning 56 and losing
97. They finished seventh in the American League
and were led in hitting by Bud Stewart, whose
batting average was .279.
Descriptive Statistics
Descriptive Statistics consists of methods for organizing
and summarizing information.
Slide 1-5 Copyright © 2012, 2008, 2005 Pearson Education, Inc.
Definition 1.2
Political polling provides an example of inferential
statistics. Interviewing everyone of voting age in the
United States on their voting preferences would be
expensive and unrealistic. Statisticians who want to
gauge the sentiment of the entire population of U.S.
voters can afford to interview only a carefully chosen
group of a few thousand voters. This group is called
a sample of the population.
Population and Sample
Population: The collection of all individuals or items under
consideration in a statistical study.
Sample: That part of the population from which information
is obtained.
Slide 1-6 Copyright © 2012, 2008, 2005 Pearson Education, Inc.
Definition 1.3
Statisticians analyze the information obtained from a
sample of the voting population to make inferences
(draw conclusions) about the preferences of the entire
voting population. Inferential statistics provides
methods for drawing such conclusions.
Inferential Statistics
Inferential statistics: consists of methods for drawing and
measuring the reliability of conclusions about a population
based on information obtained from a sample of the
population.
Slide 1-7 Copyright © 2012, 2008, 2005 Pearson Education, Inc.
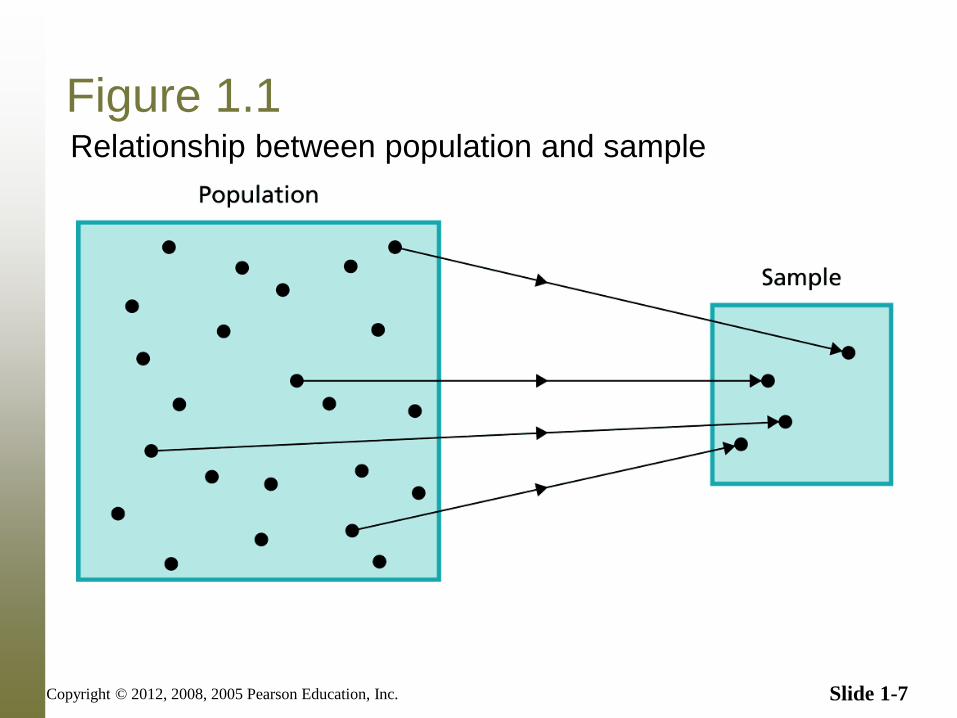
Figure 1.1 Relationship between population and sample
Slide 1-8 Copyright © 2012, 2008, 2005 Pearson Education, Inc.
Section 1.2
Simple Random Sampling
Slide 1-9 Copyright © 2012, 2008, 2005 Pearson Education, Inc.
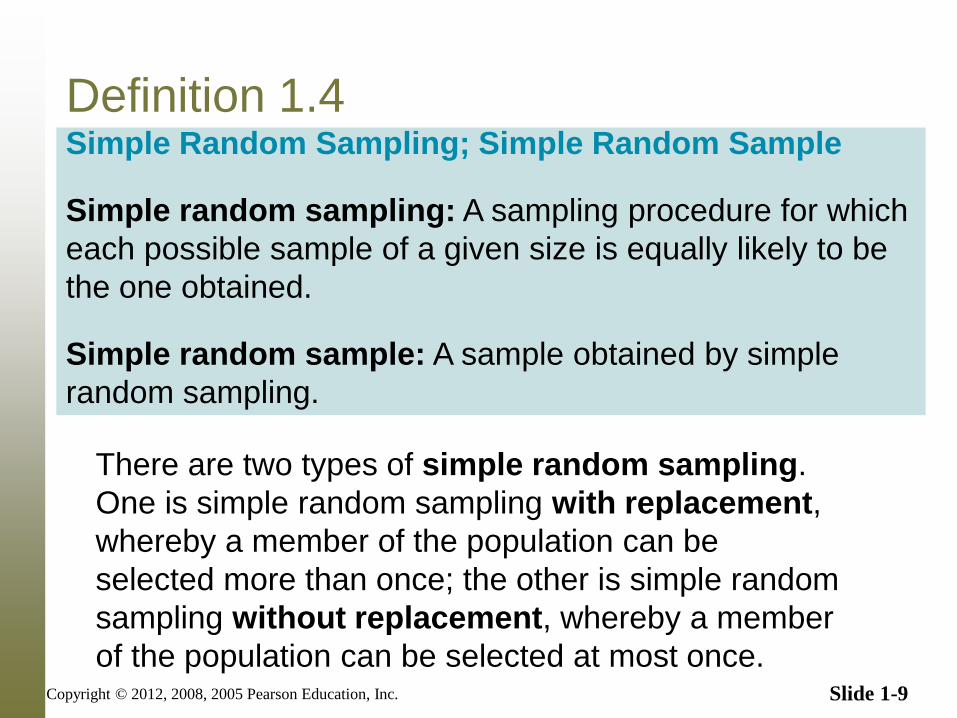
Definition 1.4
There are two types of simple random sampling.
One is simple random sampling with replacement,
whereby a member of the population can be
selected more than once; the other is simple random
sampling without replacement, whereby a member
of the population can be selected at most once.
Simple Random Sampling; Simple Random Sample
Simple random sampling: A sampling procedure for which
each possible sample of a given size is equally likely to be
the one obtained.
Simple random sample: A sample obtained by simple
random sampling.
Slide 1-10 Copyright © 2012, 2008, 2005 Pearson Education, Inc.
Random-Number Tables
Obtaining a simple random sample by picking slips
of paper out of a box is usually impractical,
especially when the population is large. Fortunately,
we can use several practical procedures to get
simple random samples. One common method
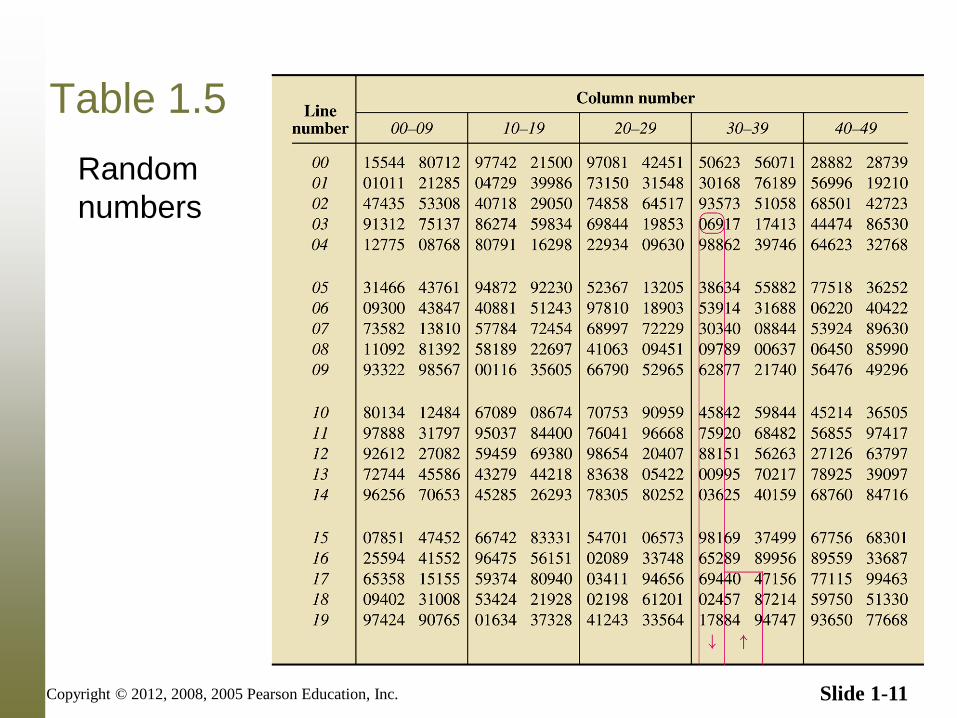
involves a table of random numbers – a table of
randomly chosen digits, as illustrated in Table 1.5.
Slide 1-11 Copyright © 2012, 2008, 2005 Pearson Education, Inc.
Table 1.5
Random
numbers
Slide 1-12 Copyright © 2012, 2008, 2005 Pearson Education, Inc.
Random-Number Generators
Nowadays, statisticians prefer statistical software
packages or graphing calculators, rather than
random-number tables, to obtain simple random
samples. The built-in programs for doing so are
called random-number generators. When using
random-number generators, be aware of whether
they provide samples with replacement or samples
without replacement.

Slide 1-13 Copyright © 2012, 2008, 2005 Pearson Education, Inc.
Section 1.3
Other Sampling Designs
Slide 1-14 Copyright © 2012, 2008, 2005 Pearson Education, Inc.
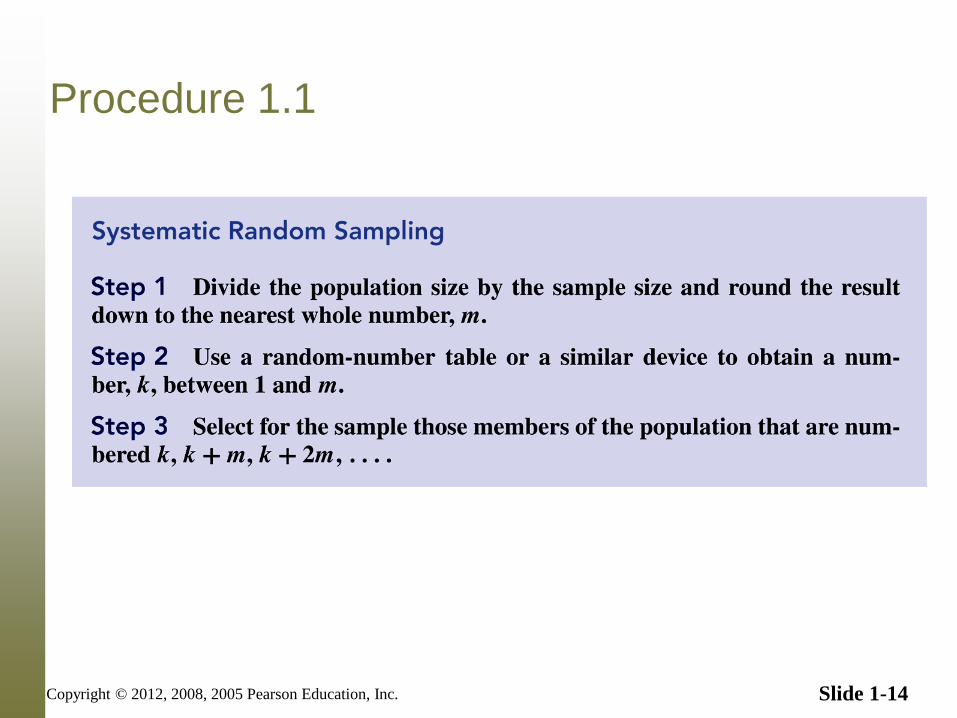
Procedure 1.1
Slide 1-15 Copyright © 2012, 2008, 2005 Pearson Education, Inc.
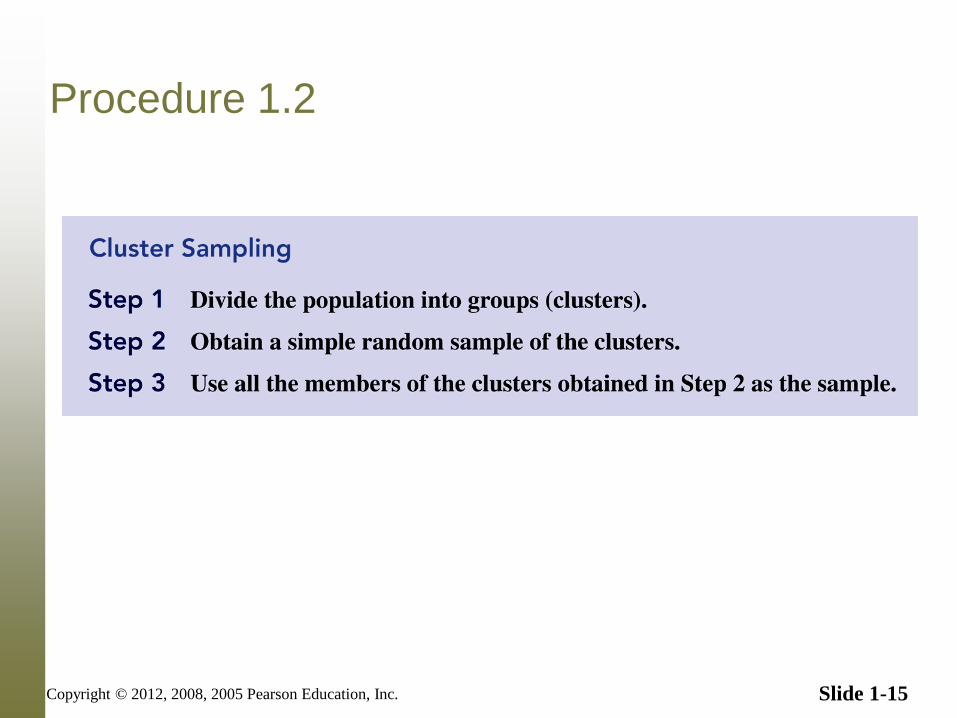
Procedure 1.2
Slide 1-16 Copyright © 2012, 2008, 2005 Pearson Education, Inc.
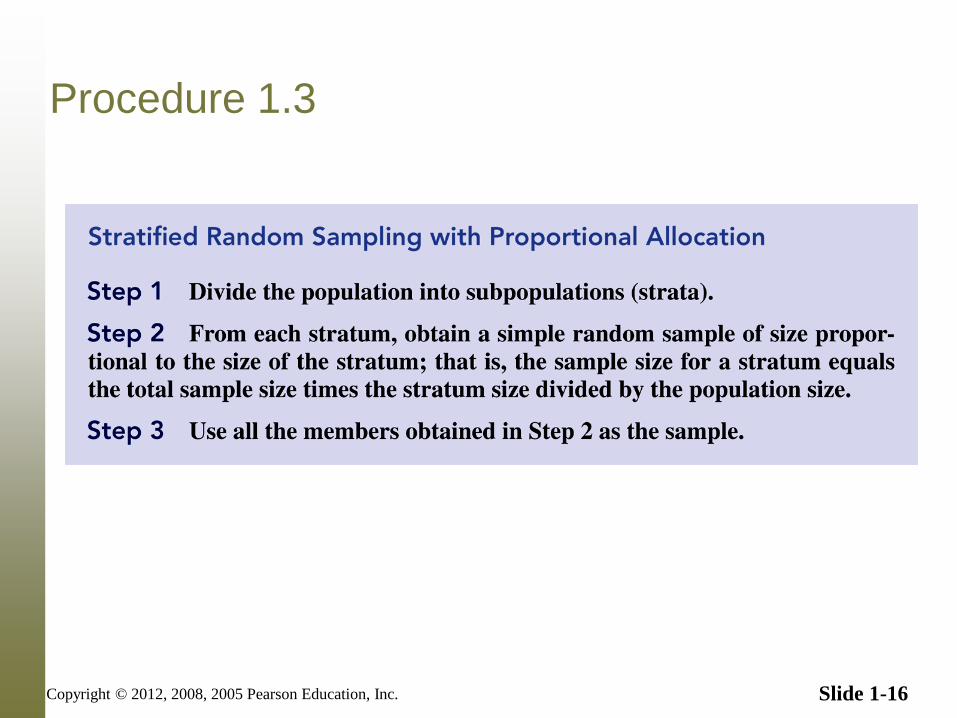
Procedure 1.3

Slide 1-17 Copyright © 2012, 2008, 2005 Pearson Education, Inc.
Section 1.4
Experimental Designs
Slide 1-18 Copyright © 2012, 2008, 2005 Pearson Education, Inc.
Definition 1.5
Folic Acid and Birth Defects. For the study, the doctors
enrolled 4753 women prior to conception, and divided
them randomly into two groups. One group took daily
multivitamins containing 0.8 mg of folic acid, whereas the
other group received only trace elements. In the language
of experimental design, each woman in the folic acid
study is an experimental unit, or a subject.
Experimental Units; Subjects
In a designed experiment, the individuals or items on which
the experiment is performed are called experimental units.
When the experimental units are humans, the term subject
is often used in place of experimental unit.
Slide 1-19 Copyright © 2012, 2008, 2005 Pearson Education, Inc.
Key Fact 1.1 Principles of Experimental Design The following principles of experimental design enable a researcher to conclude that differences in the results of an experiment not reasonably attributable to chance are likely caused by the treatments.
• Control: Two or more treatments should be compared.
• Randomization: The experimental units should be randomly
divided into groups to avoid unintentional selection bias in
constituting the groups.
• Replication: A sufficient number of experimental units
should be used to ensure that randomization creates
groups that resemble each other closely and to increase
the chances of detecting any differences among the
treatments.
Slide 1-20 Copyright © 2012, 2008, 2005 Pearson Education, Inc.
Folic Acid and Birth Defects
・ Control: The doctors compared the rate of major birth
defects for the women who took folic acid to that for the
women who took only trace elements.
・ Randomization: The women were divided randomly
into two groups to avoid unintentional selection bias.
・ Replication: A large number of women were recruited
for the study to make it likely that the two groups
created by randomization would be similar and also to
increase the chances of detecting any effect due to the
folic acid.

Slide 1-21 Copyright © 2012, 2008, 2005 Pearson Education, Inc.
Folic Acid and Birth Defects
One of the most common experimental situations
involves a specified treatment and placebo, an inert
or innocuous medical substance. Technically, both
the specified treatment and placebo are treatments.
The group receiving the specified treatment is called
the treatment group, and the group receiving
placebo is called the control group. In the folic acid
study, the women who took folic acid constituted the
treatment group and those who took only trace
elements constituted the control group.
Slide 1-22 Copyright © 2012, 2008, 2005 Pearson Education, Inc.
Definition 1.6
Response Variable, Factors, Levels, and Treatments
Response variable: The characteristic of the
experimental outcome that is to be measured or observed.
Factor: A variable whose effect on the response variable
is of interest in the experiment.
Levels: The possible values of a factor.
Treatment: Each experimental condition. For one-factor
experiments, the treatments are the levels of the single
Factor. For multifactor experiments, each treatment is a
Combination of levels of the factors.

Slide 1-23 Copyright © 2012, 2008, 2005 Pearson Education, Inc.
Example 1.12 Experimental Design
Weight Gain of Golden Torch Cacti
The Golden Torch Cactus (Trichocereus spachianus), a
cactus native to Argentina, has excellent landscape
potential. William Feldman and Frank Crosswhite, two
researchers at the Boyce Thompson Southwestern
Arboretum, investigated the optimal method for
producing these cacti. The researchers examined,
among other things, the effects of a hydrophilic polymer
and irrigation regime on weight gain. Hydrophilic
polymers are used as soil additives to keep moisture in
the root zone. For this study, the researchers chose
Broadleaf P-4 polyacrylamide, abbreviated P4. The
hydrophilic polymer was either used or not used, and
five irrigation regimes were employed: none, light,
medium, heavy, and very heavy.
Slide 1-24 Copyright © 2012, 2008, 2005 Pearson Education, Inc.
Example 1.12 Experimental Design
Weight Gain of Golden Torch Cacti
Identify the
a. experimental units.
b. response variable.
c. factors.
d. levels of each factor.
e. treatments.
Slide 1-25 Copyright © 2012, 2008, 2005 Pearson Education, Inc.
Example 1.12 Experimental Design
Weight Gain of Golden Torch Cacti
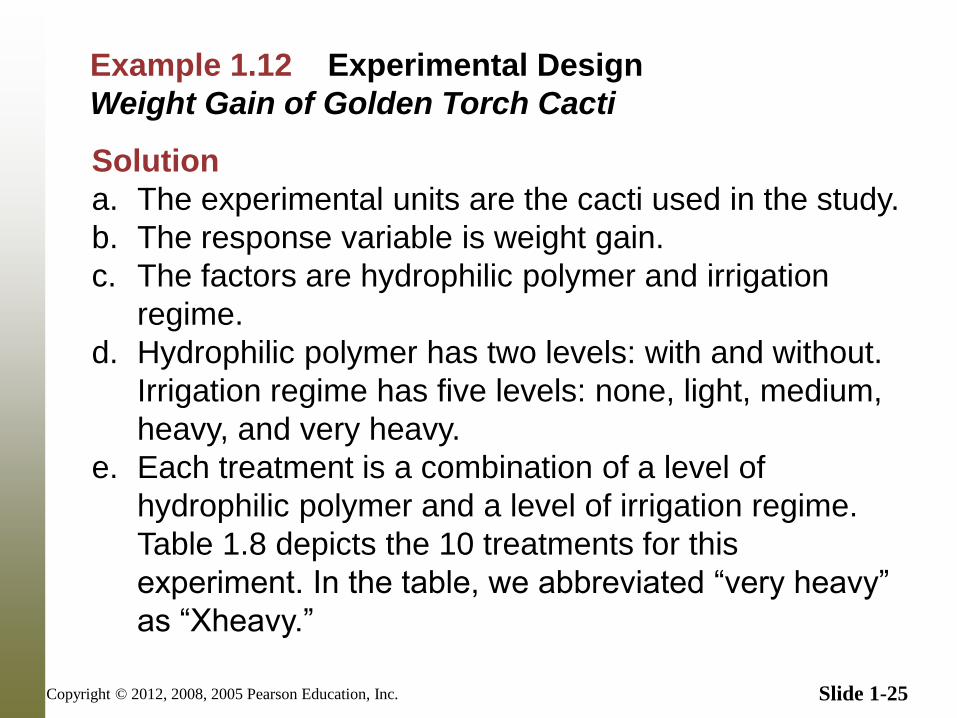
Solution
a. The experimental units are the cacti used in the study.
b. The response variable is weight gain.
c. The factors are hydrophilic polymer and irrigation
regime.
d. Hydrophilic polymer has two levels: with and without.
Irrigation regime has five levels: none, light, medium,
heavy, and very heavy.
e. Each treatment is a combination of a level of
hydrophilic polymer and a level of irrigation regime.
Table 1.8 depicts the 10 treatments for this
experiment. In the table, we abbreviated “very heavy”
as “Xheavy.”
Slide 1-26 Copyright © 2012, 2008, 2005 Pearson Education, Inc.
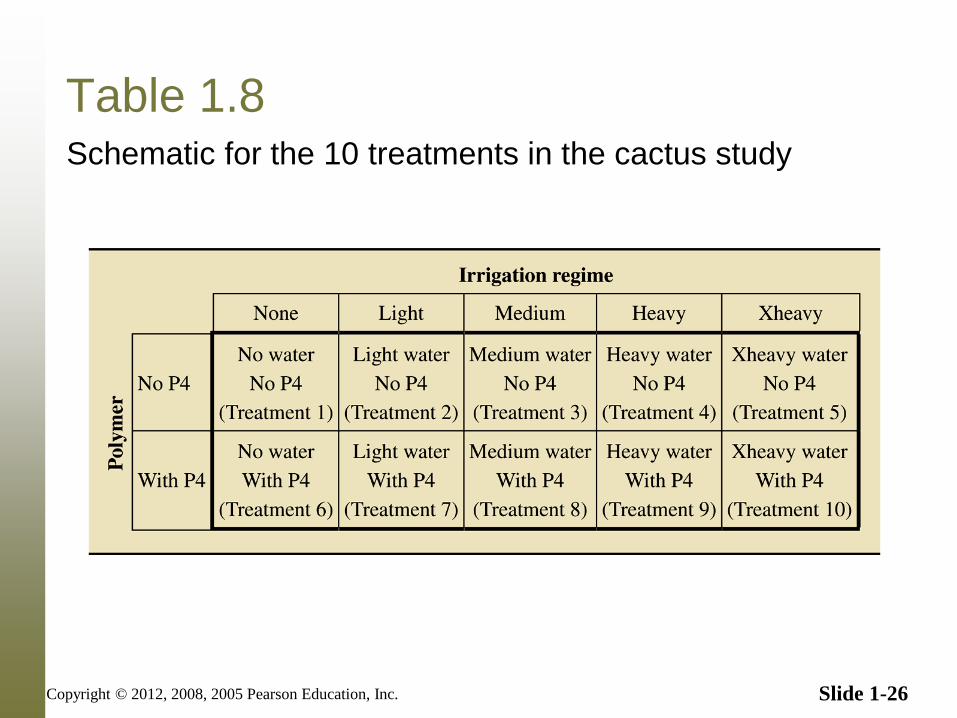
Table 1.8 Schematic for the 10 treatments in the cactus study
Slide 1-27 Copyright © 2012, 2008, 2005 Pearson Education, Inc.
Definition 1.7
Once we have chosen the treatments, we must decide
how the experimental units are to be assigned to the
treatments (or vice versa). The women in the folic acid
study were randomly divided into two groups; one group
received folic acid and the other only trace elements. In
the cactus study, 40 cacti were divided randomly into 10
groups of four cacti each and then each group was
assigned a different treatment from among the 10
depicted in Table 1.8. Both of these experiments used a
completely randomized design.
Completely Randomized Design In a completely randomized design, all the experimental
units are assigned randomly among all the treatments.
Slide 1-28 Copyright © 2012, 2008, 2005 Pearson Education, Inc.
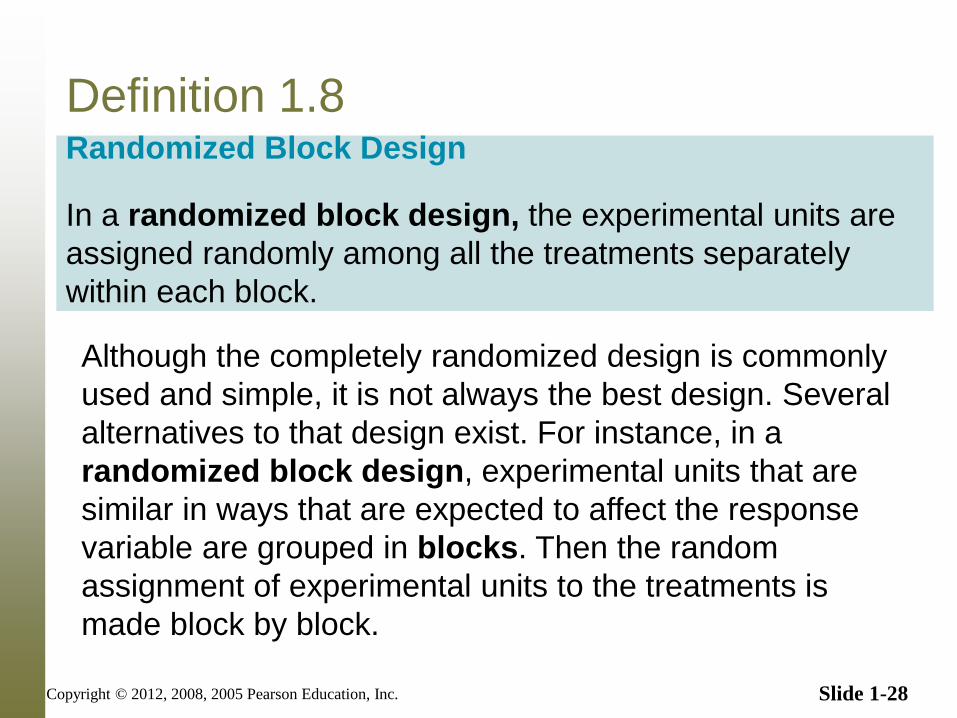
Definition 1.8
Although the completely randomized design is commonly
used and simple, it is not always the best design. Several
alternatives to that design exist. For instance, in a
randomized block design, experimental units that are
similar in ways that are expected to affect the response
variable are grouped in blocks. Then the random
assignment of experimental units to the treatments is
made block by block.
Randomized Block Design
In a randomized block design, the experimental units are
assigned randomly among all the treatments separately
within each block.
Slide 1-29 Copyright © 2012, 2008, 2005 Pearson Education, Inc.
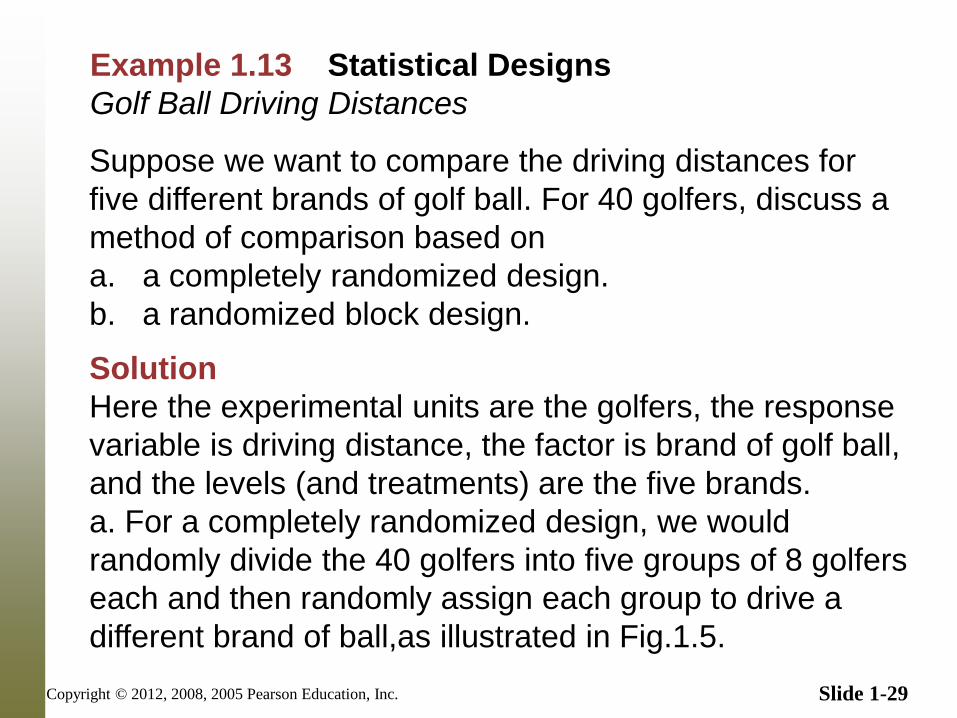
Example 1.13 Statistical Designs
Golf Ball Driving Distances
Suppose we want to compare the driving distances for
five different brands of golf ball. For 40 golfers, discuss a
method of comparison based on
a. a completely randomized design.
b. a randomized block design.
Solution
Here the experimental units are the golfers, the response
variable is driving distance, the factor is brand of golf ball,
and the levels (and treatments) are the five brands.
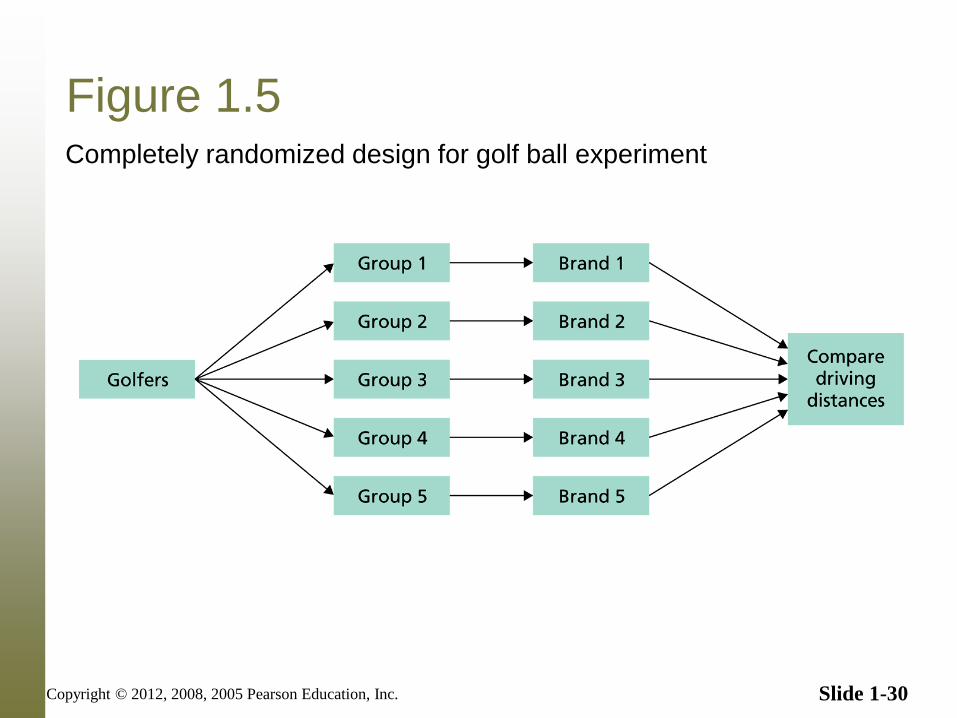
a. For a completely randomized design, we would
randomly divide the 40 golfers into five groups of 8 golfers
each and then randomly assign each group to drive a
different brand of ball,as illustrated in Fig.1.5.
Slide 1-30 Copyright © 2012, 2008, 2005 Pearson Education, Inc.
Figure 1.5 Completely randomized design for golf ball experiment
Slide 1-31 Copyright © 2012, 2008, 2005 Pearson Education, Inc.
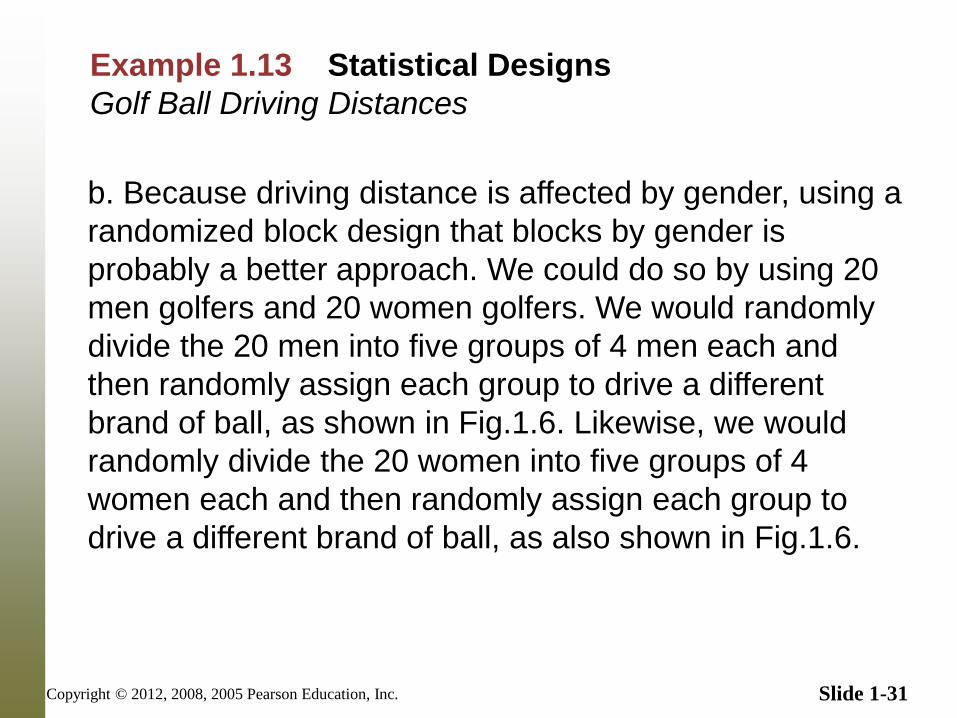
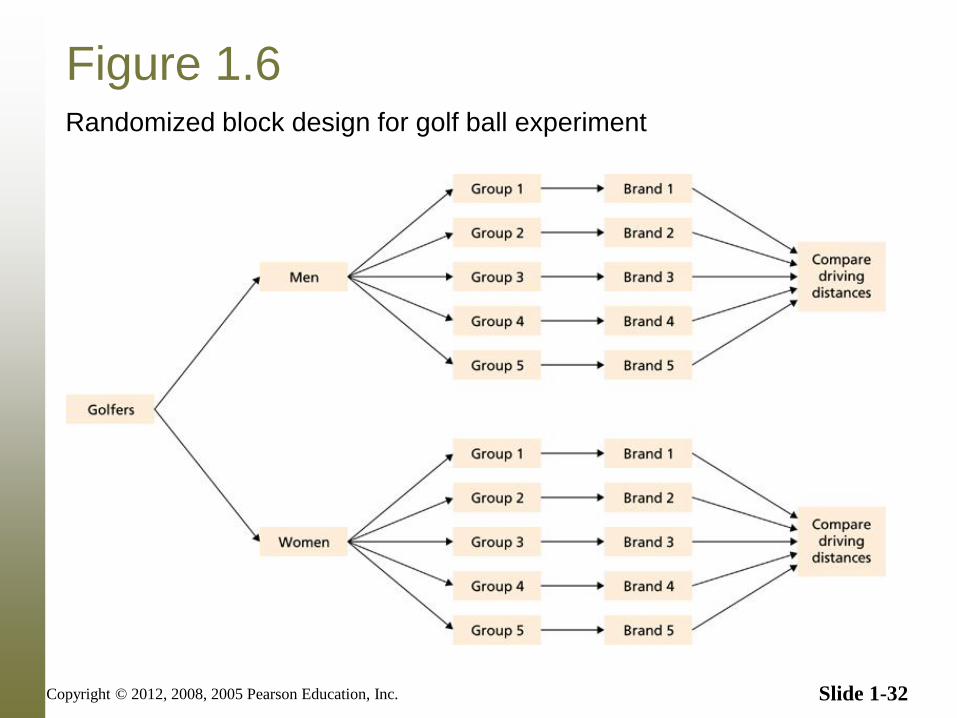
Example 1.13 Statistical Designs
Golf Ball Driving Distances
b. Because driving distance is affected by gender, using a
randomized block design that blocks by gender is
probably a better approach. We could do so by using 20
men golfers and 20 women golfers. We would randomly
divide the 20 men into five groups of 4 men each and
then randomly assign each group to drive a different
brand of ball, as shown in Fig.1.6. Likewise, we would
randomly divide the 20 women into five groups of 4
women each and then randomly assign each group to
drive a different brand of ball, as also shown in Fig.1.6.
Slide 1-32 Copyright © 2012, 2008, 2005 Pearson Education, Inc.
Figure 1.6 Randomized block design for golf ball experiment
Slide 1-33 Copyright © 2012, 2008, 2005 Pearson Education, Inc.
By blocking, we can isolate and remove the variation in
driving distances between men and women and thereby
make it easier to detect any differences in driving
distances among the five brands of golf ball. Additionally,
blocking permits us to analyze separately the differences
in driving distances among the five brands for men and
women.
As illustrated in Example 1.13, blocking can isolate and
remove systematic differences among blocks, thereby
making any differences among treatments easier to
detect. Blocking also makes possible the separate
analysis of treatment effects on each block.