slag-metal equilibrium calculations for estimation …929554/...1 slag-metal equilibrium...
TRANSCRIPT

1
Slag-metal equilibrium calculations for estimation of oxygen
activity in molten steel during ladle treatment
J. Ekengård*, M. Andersson
*, P. Jönsson
* and J. Lehmann
**
*Royal Institute of Technology, Sweden
**IRSID, France
Abstract In the present paper three different methods to calculate the equilibrium oxygen activity
have been compared with measured oxygen activities and oxygen activities based on
sulphur equilibrium between slag and steel during ladle treatment at Scana Björneborg.
Three slag models were used to estimate the oxide component activities of Al2O3 and SiO2
in the top slag and in the equilibrium calculations the dilute solution model for the liquid
steel phase was used. The results show significant discrepancies between the calculated and
measured oxygen activities and the reasons for the differences are discussed.
Key words: oxygen activity, slag model, sampling, plant trial

2
1. INTRODUCTION
During ladle refining, the composition of the top slag will influence the quality of the
steel, for example, the sulphur content [1]
and inclusion characteristics [2]
. Oxygen is of vital
importance for the formation of non-metallic inclusions and it is therefore important to
study how the top slag can affect the behavior of oxygen in the liquid steel. The top slag
will interact with the molten steel phase and exchange reactions will take place. The final
result of these reactions is governed by the thermodynamic and kinetic conditions during
the particular refining operation.
Vacuum degassing is one important ladle refining operation where vigorous stirring and
mixing between the slag and metal phase take place at low pressure. It has been shown
earlier [3,4] that the kinetic conditions for sulphur refining during degassing are very good,
since the final partition of sulphur between slag and metal bulk will be close to the
equilibrium sulphur distribution. Furthermore, the exchange of sulphur between metal and
slag is particularly closely linked to in particular the activity of oxygen dissolved in the
steel phase through the reaction
metalslagslagmetal OSOS 22 (1)
If equilibrium can be established with respect to sulphur during the degassing operation,
it would be reasonable to expect the same for oxygen.
The present work is a part of a larger project within the Swedish Steel Producers'
Association (Jernkontoret), aiming to study the interaction between slag and metal during
ladle treatment. One important aspect of the study was to evaluate how sulphur partition
based oxygen activity data correlates with predicted data throughout different parts of the
ladle process. The objective was to compare three oxide activity calculation models; i)
Ohta-Suito [5], ii) ThermoSlag
[6] and iii) Irsid
[7] model, which are all acknowledged
calculation models for oxide activities in slag phases. Application of these models in order
to estimate theoretical oxygen activity was carried out together with a comparison between
equilibrium and estimated sulphur partition based oxygen activity.
It should be noted that it is quite difficult to measure oxygen activity in liquid steel melts.
It is well known [8]
that measurements with galvanic cells are influenced by the choice of
solid electrolyte, reference electrode material and the steel temperature. If the solid
electrolyte exhibits significant electronic conductivity during the measurement, the
measured value can be lower than the actual level. For example, a ZrO2(CaO) electrolyte
exhibits electronic conductivity at oxygen activities below 10-3
, while a ThO2(7%Y2O3)
electrolyte can be used down to 10-4[9]
. In the present work a solid electrolyte of MgO-
stabilized ZrO2 has been used, for which it is reported that n-type electronic conductivity
readily occurs at reducing conditions with temperatures between 1500 to 1600 C. [8]
Finally, it should be stated that since it is quite difficult to measure the oxygen activity in
liquid steel melts, it is expected that a disagreement between measurements and
calculations of the oxygen activity will exist. Part of the aim with this research was to
quantify the magnitude of this disagreement. For example, the introduction of the oxygen
probe into the steel bath brings enough oxygen to locally oxidize the main deoxidizer of the
bath, i.e. aluminum. Therefore, it would not be surprising to measure an oxygen activity not
far from the equilibrium with pure alumina. In addition, complete equilibrium is not
reached – if it were, the inclusions composition would be identical to the slag composition.

3
In the present paper a theoretical background for the calculation methods is given. The
full-scale plant trials are described, taking into account alloying, slag and steel
compositions, temperature and measured oxygen activity based on dissolved oxygen in the
steel bulk. Five low-alloyed heats were evaluated during ladle treatment and vacuum
degassing. Finally, the results are presented and discussed and some conclusions are drawn.

4
2. THEORETICAL BACKGROUND The approach chosen in this study was to calculate the equilibrium between dissolved
aluminum in the metal phase and alumina in the slag in order to estimate the theoretical
oxygen activity in the steel. For comparison the corresponding equilibrium between silicon
and silica was also used to calculate the oxygen activity. Additionally, the sulphur
distribution between slag and metal was used, together with estimations of the sulphide
capacity, to calculate the oxygen activity in the metal bath.
2.1 Silicon-oxygen and aluminum-oxygen equilibrium
Equation (2) and (3) describe the equilibrium reactions between aluminum and oxygen
and silicon and oxygen respectively as
slagmetalmetal OAlOAl 3232 (2)
slagmetalmetal SiOOSi 22 (3)
with the corresponding Gibbs free energy values
TG 714.38611520511 [J/mol] [10]
(4)
TG 655.2205415802 [J/mol] [10]
(5)
where T is the temperature. Solid alumina and silica respectively were chosen as the
standard state in the calculations. The respective equilibrium constants are therefore written
as
32
11
32expOAl
OAl
aaa
RTGK (6)
2
22
2expOSi
SiO
aaa
RTGK (7)
where R is the gas constant, 32OAla and
2SiOa are the activities of the alumina and silica
respectively. The parameters Ala , Sia and Oa are the activities of aluminum, silicon and
oxygen dissolved in the steel.
The activities of aluminum and silicon in the steel were calculated using Henry’s law and
the dilute solution model. This was a reasonable assumption since the maximum total
content of alloying elements in the studied steel grade was relatively low, around 1.4%.
The activity of aluminum and silicon can therefore be written as
Alwtfa AlAl % (8)
Siwtfa SiSi % (9)
where Alf and Sif are the activity coefficients of aluminum and silicon in the metal phase.
The activity coefficients are calculated using the Wagner’s equation according to
jef jii %log (10)

5
where j represents the dissolved elements in the molten steel, and jie is the interaction
parameter for element i. The interaction parameters were taken from a publication by
Jernkontoret [11] and are listed in Table 1.
When calculating the oxygen activity using equations (6) and (7) the activities of
alumina and silica have to be estimated. These activities were calculated using the
following three models
1. Ohta-Suito slag model [5]
2. ThermoSlag (KTH-model) [6]
3. Irsid slag model [7]
In Table 2 the main characteristics of the models can be seen.
2.1.1. Slag model by Ohta and Suito The first is a model by Ohta and Suito [5], who applied a slag-metal equilibrium
technique to experimentally determine the activity data at 1600 C. They developed an
empirical expression, using multiple regression analysis, for estimation of the activity of
alumina and silica respectively. According to Ohta and Suito the activity of alumina and
silica can be expressed as
560.1%033.0
%
%167.0%275.0log
32
2
32
OAlwtSiOwt
MgOwtCaOwta OAl (11)
456.6%
%595.0)%(123.0
)%(061.0)%(036.0log
22
322
CaOwtSiOwtSiOwt
OAlwtMgOwtaSiO
(12)
2.1.2. ThermoSlag model The second model is the ThermoSlag model
[6] (in previous literature called the KTH
model), developed at the Department of Metallurgy, Royal Institute of Technology in
Stockholm. This semi-empirical model can predict thermodynamic properties in multi-
component slag systems. The model describes high order slag systems by using
experimental information from the binary subsystems. It describes oxide melts including
silicate solutions as an O2-
matrix with the relevant cations distributed in it. Only the
interactions between cations, e.g. Fe2+, Ca2+, Mg2+, and Mn2+ together with Si4+ in the
presence of oxygen are considered in the model predictions. These basic cations distort the
oxygen matrix and arrange the ionic melt. The configuration will be a function of
composition and temperature.
2.1.3. Irsid slag model The third model is the Irsid slag model [7], which was used together with the ThermoCalc
software [12]
through its slag database. The model formalism is based on a description of the
slag structure originally suggested by Kapoor and Frohberg [13]. The silica melts are built

6
upon symmetric and asymmetric cells composed of one oxygen ion surrounded by two
cations of either the same or a different kind.
2.2. Sulphur-oxygen equilibrium
The equilibrium distribution of sulphur between slag and metal [14]
can be expressed as
OSSmetal
slag afCTS
Slogloglog375.1
935
][%
)(%log (13)
where (%S)slag and [%S]metal are the concentrations of sulphur in the slag and steel melt,
respectively, CS is the sulphide capacity of the slag and fS is the activity coefficient of
sulphur in the steel melt. If the sulphur distribution between slag and metal from the slag
and steel analyses is used in equation (13), the theoretical equilibrium oxygen activity can
thus be calculated, provided that the sulphide capacity, temperature and the activity
coefficient of sulphur are known. The activity coefficient of sulphur can quite easily be
estimated by equation (10) and this approach was chosen in the present work.
2.2.1. Sulphide capacity The sulphide capacity is related to the sulphur content in the slag in equilibrium with a
gas phase with partial pressures of sulphur and oxygen, 2Sp and
2Op , respectively, through
the equilibrium reaction
slaggasslaggas SOOS )()( 2
2212
221 (14)
The equilibrium constant K for this reaction can be expressed as
2
2
2
2
2
2
2
2 )(%
S
O
O
slagS
S
O
O
S
pp
aSf
pp
aa
K (15)
where 2S
a is the activity of sulphide ions, 2O
a is the activity of oxygen ions and 2S
f is the
activity coefficient of sulphide ion in the slag phase. Consequently the sulphide capacity of
any slag composition at a given temperature can also be expressed as
2
2)(%S
OslagS p
pSC (16)
which is a useful relationship for experimental determinations of the sulphide capacity.
When combining equations (15) and (16) the equation [15]

7
2
2
S
OS f
aKC (17)
can be derived. As can be seen by inspection of the right hand side of equation (17), the
sulphide capacity is a property of the slag, only depending on temperature and slag
composition.
In the present work, the ThermoSlag model [16]
for calculation of the sulphide capacity was
applied. The model expresses the sulphide capacity as
TRXG
C mixiiS
14exp (18)
where 14G is the Gibbs free energy of equation (14), i represents the oxide component
(i = CaO, MnO, Al2O3, SiO2, FeO, MgO) and Xi is the molar fraction of component i in the
slag phase. The term i is expressed as a linear function of the temperature for each
component in the slag in the absence of interaction between the different species and mix
represents the mutual binary and ternary interaction between the cations in the slag phase
as described earlier. Pure liquid FeO is chosen as a standard state, for which the term
mixiiX is taken as zero. Thus, 14G in equation (18) has been determined from
sulphide capacity measurements of pure liquid FeO as
TG 815.5811853514 [J/mol] (19)

8
3. PLANT TRIALS Samples from five heats during ladle treatment and vacuum degassing at Scana Steel
Björneborg were analyzed and evaluated with respect to steel and slag composition as well
as temperature and oxygen activity.
3.1 Process description
Scana Steel Björneborg is a scrap based steel plant, which develops, refines and markets
tailor-made steel for components used in sectors such as defense, offshore, energy, marine
and machinery construction. The scrap is melted in an electric arc furnace (EAF) and
tapped into a ladle where the steel is deslagged if necessary. If the furnace slag has been
raked off, a synthetic slag is added together with alloys and deoxidants such as aluminum
and silicon. Graphite electrodes are used to compensate for heat loss and induction stirring
together with argon gas stirring is used for mixing of the steel. When the steel analysis and
temperature are at the desired levels, the ladle is transported to the vacuum degassing
station for removal of hydrogen, sulphur and non-metallic inclusions as well as to
homogenize the steel bath before casting. The steel is cast in 4-70 ton ingots by uphill
casting.
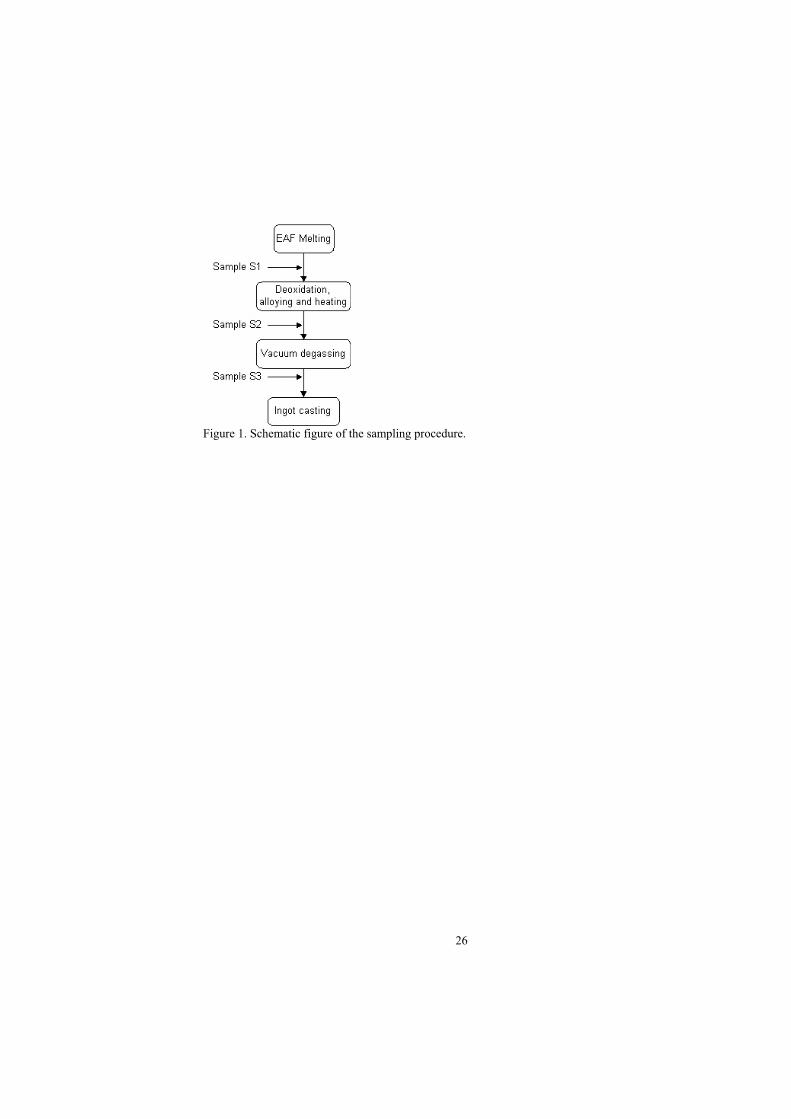
3.2 Sampling procedure
The plant trials were carried out on steel grades with as low alloy levels as possible, but
with measurable dissolved oxygen levels. The steel grades used in the trials were alloyed
with carbon and manganese and deoxidized with aluminum and silicon. Three samples
were taken during the ladle refining: i) in the ladle after arrival from the EAF (Sample S1),
ii) before vacuum treatment (Sample S2), and iii) after vacuum treatment (Sample S3).
Each sampling occasion included a steel sample, which was a 12 mm thick lollipop kind
taken with a manual sampling lance, a slag sample taken with a slag sampling scoop, and
an oxygen activity measurement (Celox[17]
sample) that also gave a temperature
measurement. Process parameters like charge weight, slag raking and added amount of
deoxidants were also logged using the steel plant’s follow-up system, and are listed in
Table 3. A schematic figure of the process flow and sampling sequence is shown in
Figure 1.
3.3 Analysis procedure
3.3.1. Slag analysis The collected slag sample was ground and analyzed with an X-ray fluorescence method.
This procedure gave the oxide compositions of the various samples. The apparatus used
was an ARL 9800 X-ray fluorescence analyzer. The variation in the analysis results was
±0.5%. The slag analyses are given in Table 4.
3.3.2. Steel analysis The steel samples were polished and then analyzed with an ARL 3460 Metals analyzer
spectrometer for all relevant elements except carbon and sulphur. A Leco CS400 melt
analyzer was used to get the carbon and sulphur analyses. The accuracy of analysis was;
±0.023wt-% for carbon, ±0.005wt-% for manganese, ±0.006wt-% for silicon, ±0.0022wt-%
for aluminum and ±0.023wt-% for sulphur. The steel analyses are given in Table 5.
3.3.3. Oxygen activity analysis The oxygen activities were measured with a Celox [17] instrument from Heraeus-
ElectroNite. It uses a solid electrolyte with a known oxygen activity (Mo/Cr +

9
Cr2O3//ZrO2(MgO)//a(O)Fe/Fe) as reference electrode and measures the EMF difference
between the reference electrode and a bath contact electrode. This EMF difference together
with the bath temperature measured with a thermocouple in the same sensor then gave the
oxygen activity in the steel bath through Nernst’s law
EMF =)2(
)1(ln
2
2
O
O
pp
nFRT
(20)
where 2Op (2) is the reference value of the cell,
2Op (1) is the oxygen potential in the steel
bath, n is the number of electrons taking part in the cell reaction and F is Faradays constant.
The accuracy of the oxygen activity reading on the Celox equipment was 3% [17]
. The
measured oxygen activities and the corresponding temperatures readings are given in Table
5.

10
4. RESULTS AND DISCUSSION
4.1 Analysis results
In Table 3 the most important ladle operation parameters and oxygen activities
calculated from the sulphur partition can be seen. The results from the analysis of slag and
steel samples, including temperatures and measured oxygen activities are shown in Tables
4 and 5.
4.2 Oxide activity calculations
The oxide activities for Al2O3 and SiO2 in the top slag were calculated for all samples
S1, S2 and S3, using the three different calculation models described above. The values
were calculated with four slag components, CaO, SiO2, Al2O3 and MgO, taken from the
samples and normalized. The prediction results and are given in Table 6, 7 and 8 for Ohta-
Suito, ThermoSlag and Irsid models, respectively.
4.2.1. Model comparisons of Al2O3 and SiO2 activity In Figure 2 the calculated activity of Al2O3 is plotted as a function of sampling occasion
as an average for the five evaluated melts. In all of the three evaluated models the alumina
activity is seen to increase continuously during the progress of the ladle treatment process.
It can also be seen that the Irsid model gave lower values in comparison to the other two
models in all samples. In sample S2, the Ohta-Suito model gave a similar value as the
ThermoSlag model but higher than the Irsid model. In sample S3, the ThermoSlag model
showed higher values than both Ohta-Suito and Irsid model. The standard deviations were
largest for the Ohta-Suito and ThermoSlag data in sample S3. It was also observed that the
standard deviations for the calculated alumina activities, when using the Ohta-Suito model,
were generally larger compared to the other two models. The alumina activities calculated
by the Irsid model had, in most cases, the smallest standard deviations. The standard
deviations of the alumina activities calculated by the ThermoSlag model were, for the S3
samples, twice as large as the slag samples in S1 and S2. The observed trend was that the
values calculated using the ThermoSlag and Ohta-Suito models were in closer agreement
with each other for all samples than the values calculated using the Irsid model.
In Figure 3 the corresponding calculated activities of SiO2 are plotted as function of
sampling occasion. The values predicted using the Ohta-Suito and Irsid models first
increased during ladle treatment and then decreased during the degassing operation. The
Irsid model showed lower values than both the other two models, while the ThermoSlag
and Ohta-Suito models predicted values that were of the same order of magnitude.
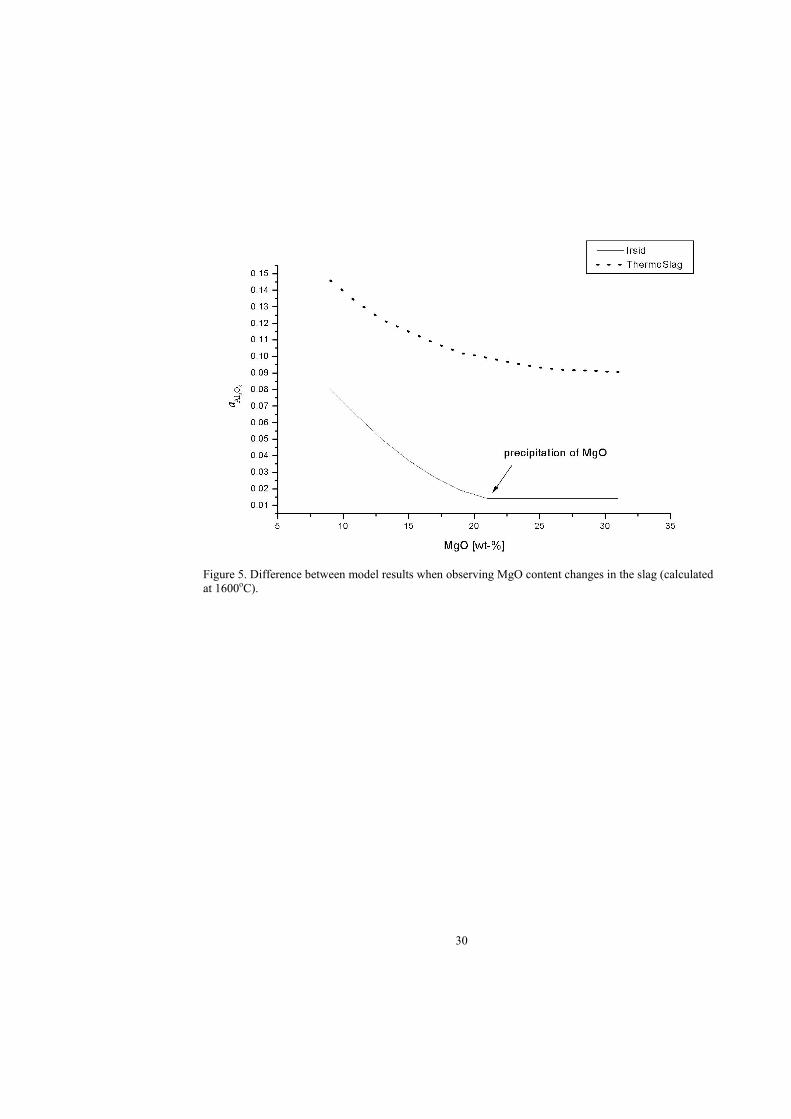
4.2.2. Effect of solid phase precipitation Precipitated phases in the slag could give differences in the model results. This happens
since the Ohta-Suito and ThermoSlag models only consider the liquid slag phase when
calculating the oxide activities, while the Irsid model also takes the precipitated phases into
account.
In order to find out if precipitated phases in the slags could affect the oxide activities in the slag, the activities of alumina using the Irsid and ThermoSlag models were plotted as
function of temperature and amount of MgO. The calculations were made for a typical slag
composition and the results can be seen in Figure 4 and 5. It can be observed that for the
Irsid model, precipitation of MgO affects the calculated alumina activity from 1770 C and
above, and from approximately 21 wt-% MgO and above. Since the temperature and MgO

11
content in the present slag samples are beneath these critical levels, the precipitation of
solid phases in the slag should therefore have a minor influence on the results.
The most probable explanation is therefore that the difference between the model
predictions regarding oxide activities is an effect of the natural differences between the
built-up structure, functionality and sensibility to temperature and composition in the three
models used.
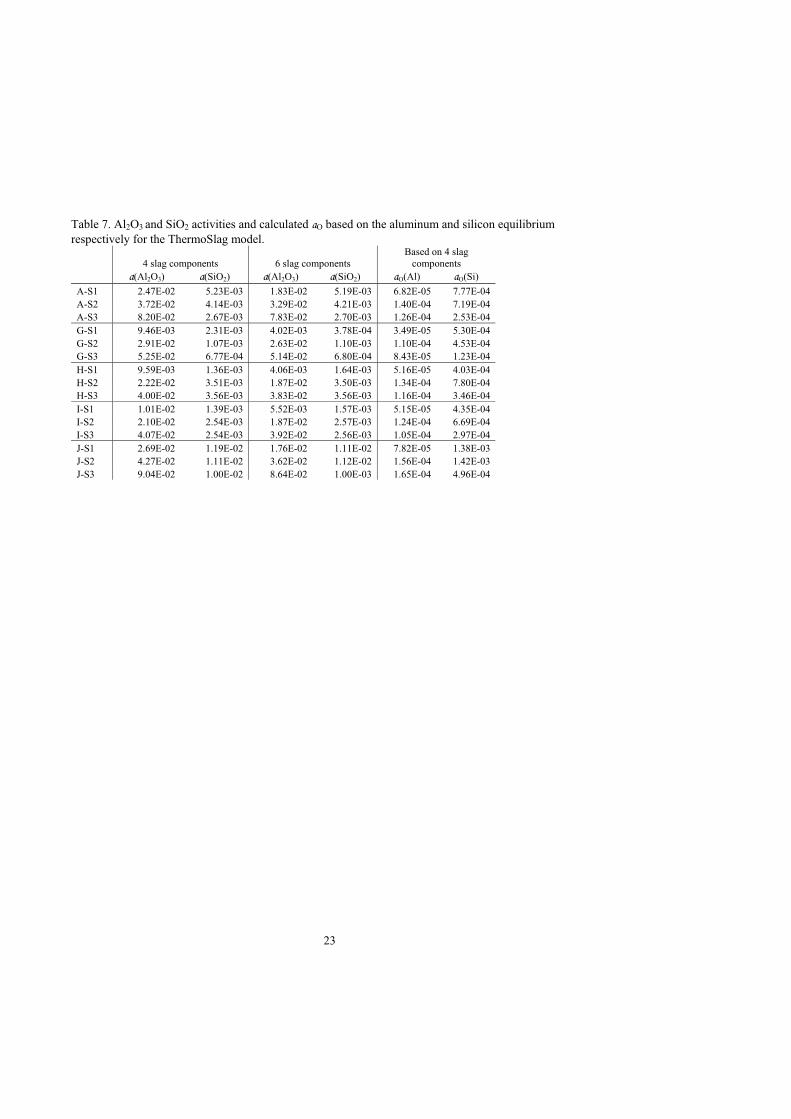
4.2.3. Number of oxide species included in model calculations In order to compare the calculated model results (ThermoSlag and Irsid), when
calculating with four or six slag components, the oxide activities using the ThermoSlag and
Irsid models were calculated also with six slag components, including FeO and MnO in the
calculation. The Ohta-Suito model was not included in this comparison, since it can only
consider the four main slag components Al2O3, CaO, MgO and SiO2. The results for this
comparison can be seen in Tables 7 and 8. In the case of Al2O3 it can be observed that the
effect of introducing FeO and MnO in the given slag composition was generally larger for
the predicted oxide activities using the ThermoSlag model compared to the predicted oxide
activities using the Irsid model. In the case of the silica activity, this tendency was not as
obvious as for the alumina activity. In Table 9 shows the calculated activity coefficients of
alumina using the Irsid and ThermoSlag models are shown. It can be seen that the activity
coefficient did not change much when calculations based on four and six slag components
were compared.
The differences when calculating with four or six slag components was not considered
further, neither in the Al2O3 nor the SiO2 activity calculations. Therefore, the oxide
activities calculated with four slag components were used in the further calculations.
4.3 Oxygen activity calculations
The calculations of the equilibrium oxygen activity based on the results from the three
different slag models have been made both for the deoxidation reactions with aluminum
and silicon (equations (2) and (3)). For calculation of the activities of Al and Si, the
procedure outlined by equations (8)-(10) was applied. The bulk analysis of the molten
steel in Table 5 and the interaction parameters in Table 1 were then used, together with the
dilute solution model. The results of these calculations are shown in Tables 6, 7 and 8 for
the predicted oxide activities using the Ohta-Suito, ThermoSlag and Irsid model,
respectively. In Table 3 the oxygen activities based on the sulphur partition between slag
and steel can be seen, these values were calculated using equation (13).
4.3.1. Effect of ladle treatment on calculated oxygen activity values The results for the theoretical oxygen activity values, Al
Oa , from the aluminum
deoxidation reaction, equation (2), showed a uniform behavior during the ladle treatment
when comparing the three models. Between samples S1 and S2 the oxygen activity Al
Oa
increased, but decreased again during the vacuum degassing, between samples S2 and S3.
This was observed for all the three slag models. It could also be observed that the measured
oxygen activity values showed the same qualitative behavior as the theoretically calculated Al
Oa , i.e. an increase between samples S1 and S2 and a decrease between samples S2 and
S3. The trend during ladle treatment for the oxygen activity values Si
Oa , based on the

12
silicon deoxidation reaction, equation (3), was not as clear as for Al
Oa , but there was always
a decrease during degassing.
The behavior of Al
Oa can be explained by the fact that between samples S1 and S2 the
dissolved aluminum content in the steel melt decreases, the temperature increases and the
activity of alumina in the slag increases. If equation (6) is studied, it can be seen that the
behavior of these factors will increase the oxygen activity. Between samples S2 and S3,
the dissolved aluminum content in the steel continued to decrease and the alumina activity
in the slag increased, but at the same time there was a temperature drop of 80-97 C. The
temperature drop has a large impact on the equilibrium constant of equation (2), shifting
the equilibrium towards the right hand side, and the total effect will be a decrease of the
oxygen activity.
In principle the same thermodynamic explanation can be applied to the behavior of Si
Oa
during the ladle treatment. However, the dissolved silicon content in the steel does not
decrease as systematically as aluminum during the ladle operation. Also, the absolute level
of the activity of silica was almost constant during the ladle treatment when compared to
the alumina activity. These factors might explain why the trend for Si
Oa was not as clear as
for Al
Oa between samples S1 and S2.
The theoretical oxygen activity S
Oa , based on the sulphur partition between slag and steel
(equation (13)), showed another behavior than the observations above. In most of the heats
it usually decreased during the ladle treatment. After vacuum degassing, S
Oa reached its
minimum around 0.4 10-4
– 2.2 10-4
. The sulphur partition between slag and metal at the
start of the ladle operation (sample S1) was rather low, which would result in a
comparatively high oxygen activity. The next sample (S2) had uneven sulphur partition
values, when comparing the different heats. One reason could be that the sulphur was not
distributed homogeneously in the slag. This resulted in a large variation of calculated
oxygen activity S
Oa .
In order to correlate the oxygen activity values predicted using the three models to
experimental (sample based) data, the oxygen activity values predicted using the sulphur
equilibrium were plotted as function of the oxygen activities predicted using the three
theoretical models after degassing. This can be seen in Figure 6. There was no obvious
relation between sulphur based and model based oxygen activities for any of the models.
The closest agreement can be seen for the calculation based on aluminum equilibrium,
when the sulphur based oxygen activity was low.
4.3.2. Comparison between aluminum and silicon deoxidation reaction From Tables 6, 7, and 8 it is clear that the silicon deoxidation reaction (equation (3)),
rendered higher theoretical oxygen activity values compared to the aluminum deoxidation
reaction (equation (2)). This was consistent for all the three slag models. It could also be
observed that the ratio between Si
Oa and Al
Oa decreased during the ladle treatment, which
indicated that an exchange reaction took place between the slag and steel phases with
respect to silicon and aluminum. In order to find out how far from equilibrium the
measured values were, the calculated oxide activities from the ThermoSlag model in Table
7 were used to calculate the aluminum and silicon activities using equation (21) with

13
corresponding Gibbs free energy value [10] and the 1% dilute solution model mentioned
above with interaction coefficients from Table 1.
3(SiO2)slag + 4[Al]metal = 3[Si]metal + 2(Al2O3)slag (21)
21G = - 668607 + 113,435 T [J/mol] (22)
In Figure 7, the calculated activity of silicon in the steel resulting from the above
calculation procedure is plotted as function of the aluminum activity in the steel before
(BD) and after (AD) degassing. The aluminum and silicon activity data based on analysis
results in Table 5 are also plotted in the figure. When studying the average activity values
based on the sample analysis, it can be seen that the silicon activity does not change much
during degassing but the aluminum does. The aluminum activity is far from the equilibrium
line before degassing but approaches equilibrium during degassing. After degassing, the
activity of aluminum is still higher than the equilibrium value but closer than before
degassing. This would confirm that neither before nor after degassing the slag is in
equilibrium with the metal. It also confirms that aluminum reduces silica during degassing.
The closest agreement between measured oxygen activities and those calculated after
vacuum degassing was obtained for the silicon based oxygen activity Si
Oa , although the steel
was aluminum deoxidized. However, this may be due to the fact that the conditions at the
end of ladle treatment were still in a non-equilibrium state with respect to oxygen.
4.4. Final Comments
The present results show that it is very difficult to calculate an overall slag-metal
equilibrium with respect to oxygen for industrial applications, especially for the studied
plant operation practice. It was difficult to find an agreement between measured oxygen
activities and calculated equilibrium values. As mentioned earlier, it is well known that it is
difficult to obtain reliable oxygen sensor measurements at steelmaking temperatures and
reducing conditions. However, in the present study it was also difficult to correlate oxygen activity based on slag/steel sulphur partition with oxygen activity based on the three present
slag models, in combination with the dilute solution model for the steel phase. The latter
should be easier to correlate when both oxygen activity estimations are based upon the
same slag and steel analysis. There can be more than one reason for the discrepancies and a
few suggestions are discussed below.
If equilibrium between the top slag and the steel melt should be attained, the kinetics for
mass transfer between slag and metal has to been sufficient. During vacuum degassing the
stirring is usually quite intensive and mixing between the two phases should be extensive.
That would be favorable for mass transfer between the two phases. However, when the
melting temperature of the top slag for samples S3 were evaluated by using phase diagrams
in Slag Atlas [18] it was found that all slag compositions were MgO saturated (or possibly
spinel saturated) and had melting temperatures well above the measured temperatures of
the steel. The lowest melting point was about 1700 C, while the highest actual (measured)
temperature was 1583 C. This is shown in Figure 8a and b. It is not unlikely that a top
slag, which is not completely liquid, will not have the same favorable properties to be
mixed with the molten metal compared to a fully liquid slag phase. How large this kinetic
effect will be is though not estimated in this work.

14
Finally, the calculated equilibrium values were based on steel samples for which the
compositions represent the steel bulk rather than that of the liquid steel in the slag-metal
mixing zone. If this reasoning is correct it follows that activities of dissolved elements, e.g.
oxygen or aluminum could be governed by local equilibrium conditions and the bulk
equilibrium condition would then not be the same as the equilibrium condition in the slag-
metal mixing zone.

15
6. CONCLUSIONS
Three models (Ohta-Suito, ThermoSlag and Irsid) for calculating activities of slag
components were used to calculate 32OAla and
2SiOa in ladle slags out of plant data from trials
at Scana Björneborg, Sweden. The results show large differences in calculated oxide
activities between the different slag models. The predicted oxide activities using Ohta-
Suito and ThermoSlag models were in closer agreement with each other compared to the
Irsid model which rendered lower activity values compared to the other two models. It is
important to take into account the respective limitations and boundary conditions when
comparing the models with each other.
The calculated slag activities were then used to calculate the oxygen activities using the
Al/O/Al2O3 and the Si/O/SiO2 equilibrium. The results showed that the slag and steel even
after the vigorous stirring during the vacuum treatment were in a non-equilibrium situation
with respect to the above deoxidation reactions. Further, the measured oxygen activity data
showed the same qualitative behavior as the calculated oxygen activity data during the
ladle treatment process. This was most clear for the oxygen activity based on the aluminum
deoxidation reaction.
The oxygen activities calculated from the two deoxidation reactions were compared with
calculated oxygen activity based on the sulphur partition between slag and metal after
vacuum degassing. In most cases the oxygen activity calculated from the Al/O/Al2O3
equilibrium had the best agreement with the corresponding oxygen activities based on the
sulphur partition data.
Finally, it should be noted that this study is seen as a first attempt to obtain more
knowledge. The authors plan to carry out more plant trials under well-controlled conditions to further study the effect of slag/steel interaction on oxygen activity in steel.
ACKNOWLEDGEMENTS
The authors wish to thank Mikael Andreasson, Lars Nordström and Niklas Raunegger at
Scana Björneborg for support and fruitful discussions during the trials and the analysis
personnel at AvestaPolarit in Degerfors for analyzing the slag samples. Prof. Du Sichen
and Dr Malin Selleby, both at the Department of Material Science and Engineering at
Stockholm’s Royal Institute of Technology are also gratefully acknowledged.

16
REFERENCES 1. M. Andersson, M. Hallberg, L. Jonsson and P. Jönsson, Ironmaking and
Steelmaking, Vol.29, No.3, 2002, pp.224-232.
2. M-K. Göransson, TRITA-MET 132, Division of Metallurgy, Dept. Of Science and
Eng., Royal Institute of Techn., Stockholm, Sweden, 2001.
3. M. Andersson, TRITA-MET 112, Division of Metallurgy, Dept. Of Science and
Eng., Royal Institute of Techn., Stockholm, Sweden, 2000.
4. P. Fredriksson, Ph.D. Thesis, ISBN 91-7283-592-3, Stockholm, Sweden, 2003.
5. H. Ohta, H. Suito, Met.Trans. B, vol.29B, pp.119-129, 1998.
6. J. Björkvall, TRITA-MET 070, Division of Metallurgy, Dept. of Materials Science
and Eng., Royal Institute of Techn., Stockholm, Sweden, 2000.
7. H. Gaye,D. Coulombet, PCM RE.1064, CECA No 7210 – CF/301, Institut de
Recherches de la Sidérurgie Française, March 1984.
8. E.C. Subbaro, Solid Electrolytes and Their Applications, Plenum Press, New York
1980.
9. E.T. Turkdogan and R.J. Fruehan, CIM Quarterly, Vol II, 1972, p 371.
10. P. Hayes, Process Principles in Minerals and Materials Production, Hayes
Publishing Co, Brisbane, Australia, 1993.
11. Jernkontorets interaktionsparameterrapport: Jernkontorets forskning Serie D, nr 488
2108/82, 1984.
12. ThermoCalc®
software, “SLAG” database, Royal Institute of Technology,
Stockholm, Sweden
13. M.G. Frohberg, M.L. Kapoor, Thermodynamic Models of Slags, Physical Chemistry and Steelmaking, Vol. 2, Versailles, France, 23-25 Oct. 1978, pp. 2.3-
2.7.
14. M.A.T. Andersson, P.G. Jönsson and M.M. Nzotta, ISIJ Int., No. 11, Vol. 39,
1999, p. 1140. 15. C.J.B. Fincham, F.D. Richardsson, Proc R Soc A, 1954, vol. 223, pp.40-62. 16. M.M. Nzotta, D. Sichen, S. Seetharaman, Met. Trans. B, vol. 30B, pp.909-920,
1999. 17. Celox
® product folder, Hereaus-ElectroNite, 2000.
18. Slag Atlas, 2:nd Ed. Verein Deutscher Eisenhüttenleute (VDEh), Verlag Stahleisen
Gmbh, (1995).

17
Table 1. Interaction parameters [11]. i i
Oe iAle i
Sie
C -0.440 0.091 0.240 0.113
Si -0.131 0.056 0.110 0.065
S -0.133 0.048 0.057 -0.028
Mn -0.020 0.070 0.281 -0.025
Al -1.000 0.043 0.059 0.054
O -0.200 -1.680 -0.230 -0.27
iSe

18
Table 2. The three calculation models used. Model
Characteristics Ohta-Suito
ThermoSlag Irsid
Theoretical base Pure empirical model.
Measured oxide activity for
slag systems with different
composition together with
multiple regression analysis
gives an expression for the
respective oxide activity as
function of slag
composition.
Thermodynamic model that
considers the interactions
between cations in an oxygen
matrix. Thermodynamic
properties for multicomponent
slag systems are calculated
solely from the binary slag
systems.
Thermodynamic cell model
that calculates properties of
multicomponent liquid slags.
Built on a cell structure with
anions and considers the
Gibbs free energy of mixing.
Main limitations T=constant=1873 K
wt-% CaO=10-60
wt-% SiO2=10-50
wt-% Al2O3=0-50
wt-% MgO=0-30
Limitation in number of
assessed systems, the model
extrapolates property values.

19
Table 3. Relevant ladle parameters including sulphide capacity and distribution.
Heat
Weight
(ton)
Slag
raking
Al
added
(kg)
FeSi
added
(kg)
Sulphide
capacity
(Cs)
Measured sulphur
distribution
(%S)slag/[%S]metal
Oxygen activity
based on sulphur
equilibrium
A-S1 58 yes 60 190 7.32E-04 6.3 9.96E-04
A-S2 8.22E-04 24.7 2.87E-04
A-S3 4.38E-04 48.6 7.50E-05
G-S1 47.5 no 100 160 3.17E-03 19.0 1.41E-03
G-S2 1.50E-03 19.9 6.33E-04
G-S3 6.70E-04 137.0 4.00E-05
H-S1 57.5 no 80 190 1.48E-03 9.9 1.27E-03
H-S2 1.05E-03 15.8 5.62E-04
H-S3 1.34E-03 49.8 2.20E-04
I-S1 53 no 70 193 1.37E-03 8.1 1.44E-03
I-S2 1.14E-03 20.1 4.84E-04
I-S3 5.82E-04 57.1 8.40E-05
J-S1 47.3 no 70 159 6.03E-04 5.7 8.89E-04
J-S2 6.53E-04 14.7 3.77E-04
J-S3 2.96E-04 15.0 1.64E-04

20
Table 4. Slag analysis normalized to 4 oxide slag components and sulphur Slag analysis
Heat wt-% Al2O3 wt-% CaO wt-% MgO wt-% SiO2 wt-% S % of total
slag analysis
A-S1 12.8 46.5 14.7 26 0.13 89.5
A-S2 15.8 44.2 16.4 23.6 0.35 86.9
A-S3 22.2 40.1 19.2 18.5 0.53 92.5
G-S1 16.1 58.4 8.2 17.3 0.21 73.9
G-S2 19.2 49.2 13.0 18.6 0.18 93.1
G-S3 25.0 44.9 16.2 13.9 0.41 94.5
H-S1 11.5 53.4 12.1 23.0 0.13 75.8
H-S2 13.6 48.6 13.0 24.8 0.18 90.1
H-S3 15.9 47.1 13.7 23.3 0.35 92.7
I-S1 11.2 50.6 15.9 22.3 0.12 81.3
I-S2 13.8 47.2 16.0 23.0 0.24 92.2
I-S3 16.8 45.6 16.2 21.4 0.40 92.6
J-S1 10.4 39.2 21.4 29.0 0.09 82.9
J-S2 13.0 37.4 22.0 27.6 0.21 83.4
J-S3 16.8 36.0 22.1 25.1 0.18 88.6

21
Table 5. Steel analysis, measured oxygen activity and temperatures.
Heat C [%] Mn [%] Si [%] Al [%] S [%] aO 104 (*) T(°C)
A-S1 0.350 0.360 0.215 0.089 0.020 3.05 1632
A-S2 0.390 0.692 0.246 0.056 0.014 5.67 1656
A-S3 0.440 0.687 0.262 0.019 0.011 3.9 1576
G-S1 0.210 0.183 0.234 0.152 0.011 2.31 1630
G-S2 0.260 0.675 0.215 0.092 0.009 4.93 1667
G-S3 0.430 0.679 0.250 0.025 0.003 3.22 1570
H-S1 0.300 0.268 0.210 0.080 0.013 N/A 1628
H-S2 0.350 0.736 0.189 0.050 0.011 7.02 1659
H-S3 0.440 0.762 0.182 0.015 0.007 5.48 1576
I-S1 0.320 0.268 0.197 0.089 0.014 3.01 1632
I-S2 0.380 0.726 0.198 0.058 0.012 N/A 1663
I-S3 0.450 0.746 0.203 0.020 0.007 5.2 1583
J-S1 0.270 0.493 0.199 0.102 0.016 3.39 1647
J-S2 0.290 0.648 0.235 0.068 0.014 6.15 1669
J-S3 0.440 0.655 0.255 0.013 0.012 5.88 1575
(*) reference state 1% (by weight) hypothetical solution

22
Table 6. Al2O3 and SiO2 activities and calculated aO for the Ohta-Suito model (4 slag components).
a(Al2O3) a(SiO2) aO(Al) aO(Si)
A-S1 2.92E-02 5.23E-03 7.21E-05 7.77E-04
A-S2 3.65E-02 4.83E-03 1.40E-04 7.76E-04
A-S3 5.65E-02 3.93E-03 1.12E-04 3.07E-04
G-S1 1.33E-02 5.93E-04 3.91E-05 2.69E-04
G-S2 2.91E-02 1.76E-03 1.10E-04 5.81E-04
G-S3 3.73E-02 1.50E-03 7.52E-05 1.84E-04
H-S1 1.85E-02 1.78E-03 6.43E-05 4.62E-04
H-S2 2.74E-02 3.84E-03 1.44E-04 8.17E-04
H-S3 3.22E-02 3.80E-03 1.08E-04 3.57E-04
I-S1 2.02E-02 1.90E-03 6.49E-05 5.09E-04
I-S2 2.80E-02 3.17E-03 1.37E-04 7.47E-04
I-S3 3.41E-02 3.19E-03 9.91E-05 3.32E-04
J-S1 3.43E-02 1.18E-02 8.48E-05 1.37E-03
J-S2 4.26E-02 1.22E-02 1.56E-04 1.49E-03
J-S3 5.58E-02 1.09E-02 1.40E-04 5.18E-04
23
Table 7. Al2O3 and SiO2 activities and calculated aO based on the aluminum and silicon equilibrium
respectively for the ThermoSlag model.
4 slag components 6 slag components
Based on 4 slag
components
a(Al2O3) a(SiO2) a(Al2O3) a(SiO2) aO(Al) aO(Si)
A-S1 2.47E-02 5.23E-03 1.83E-02 5.19E-03 6.82E-05 7.77E-04
A-S2 3.72E-02 4.14E-03 3.29E-02 4.21E-03 1.40E-04 7.19E-04
A-S3 8.20E-02 2.67E-03 7.83E-02 2.70E-03 1.26E-04 2.53E-04
G-S1 9.46E-03 2.31E-03 4.02E-03 3.78E-04 3.49E-05 5.30E-04
G-S2 2.91E-02 1.07E-03 2.63E-02 1.10E-03 1.10E-04 4.53E-04
G-S3 5.25E-02 6.77E-04 5.14E-02 6.80E-04 8.43E-05 1.23E-04
H-S1 9.59E-03 1.36E-03 4.06E-03 1.64E-03 5.16E-05 4.03E-04
H-S2 2.22E-02 3.51E-03 1.87E-02 3.50E-03 1.34E-04 7.80E-04
H-S3 4.00E-02 3.56E-03 3.83E-02 3.56E-03 1.16E-04 3.46E-04
I-S1 1.01E-02 1.39E-03 5.52E-03 1.57E-03 5.15E-05 4.35E-04
I-S2 2.10E-02 2.54E-03 1.87E-02 2.57E-03 1.24E-04 6.69E-04
I-S3 4.07E-02 2.54E-03 3.92E-02 2.56E-03 1.05E-04 2.97E-04
J-S1 2.69E-02 1.19E-02 1.76E-02 1.11E-02 7.82E-05 1.38E-03
J-S2 4.27E-02 1.11E-02 3.62E-02 1.12E-02 1.56E-04 1.42E-03
J-S3 9.04E-02 1.00E-02 8.64E-02 1.00E-03 1.65E-04 4.96E-04

24
Table 8. Al2O3 and SiO2 activities and calculated aO based on the aluminum and silicon equilibrium
respectively for the Irsid model.
4 slag components 6 slag components
Based on 4 slag
components
a(Al2O3) a(SiO2) a(Al2O3) a(SiO2) aO(Al) aO(Si)
A-S1 5.53E-03 1.77E-03 4.68E-03 1.62E-03 4.14E-05 4.52E-04
A-S2 5.91E-03 1.54E-03 5.66E-03 1.55E-03 7.60E-05 4.38E-04
A-S3 1.38E-02 1.33E-03 1.33E-02 1.31E-03 6.98E-05 1.79E-04
G-S1 7.61E-04 9.77E-05 6.99E-04 1.54E-04 1.51E-05 1.09E-04
G-S2 3.22E-03 4.87E-04 3.06E-03 4.84E-04 5.26E-05 3.05E-04
G-S3 8.33E-03 3.92E-04 8.25E-03 3.93E-04 4.57E-05 9.39E-05
H-S1 1.20E-03 3.67E-04 8.41E-04 3.84E-04 2.58E-05 2.10E-04
H-S2 4.45E-03 1.38E-03 4.08E-03 1.33E-03 7.84E-05 4.89E-04
H-S3 6.85E-03 1.11E-03 6.66E-03 1.10E-03 6.47E-05 1.93E-04
I-S1 1.42E-03 4.35E-04 1.03E-03 4.22E-04 2.68E-05 2.43E-04
I-S2 3.16E-03 9.16E-04 2.91E-03 8.86E-04 6.61E-05 4.02E-04
I-S3 6.88E-03 9.81E-04 6.70E-03 9.70E-04 5.81E-05 1.84E-04
J-S1 6.41E-03 3.52E-03 4.61E-03 2.69E-03 4.85E-05 7.48E-04
J-S2 9.02E-03 4.35E-03 8.09E-03 4.09E-03 9.30E-05 8.88E-04
J-S3 1.57E-02 3.46E-03 1.52E-02 3.37E-03 9.20E-05 2.92E-04

25
Table 9. Alumina activity coefficients after degassing for the three models used. f(Al2O3) Ohta-Suito ThermoSlag 4 ThermoSlag 6 Irsid 4 Irsid 6
A-S3 2.54E-03 3.69E-03 3.52E-03 6.21E-04 5.98E-04
G-S3 1.49E-03 2.10E-03 2.05E-03 3.33E-04 3.30E-04
H-S3 2.02E-03 2.52E-03 2.41E-03 4.31E-04 4.19E-04
I-S3 2.04E-03 2.43E-03 2.34E-03 4.10E-04 3.99E-04
J-S3 3.32E-03 5.38E-03 5.14E-03 9.34E-04 9.05E-04
26
Figure 1. Schematic figure of the sampling procedure.

27
Figure 2. Calculated activity of Al2O3 in the slag vs. sampling occasion (standard deviations corresponds to
1s).

28
Figure 3. Calculated activity of SiO2 in the slag vs. sampling occasion (standard deviations corresponds to
1s).

29
Figure 4. Difference between model results when observing temperature changes.
30
Figure 5. Difference between model results when observing MgO content changes in the slag (calculated
at 1600oC).

31
Figure 6. Calculated oxygen activity based on the sulphur equilibrium as function of the calculated
oxygen activity based on the aluminum and silicon equilibrium for the three models.

32
Figure 7. Average silicon activity vs. aluminum activity before and after degassing.

33
G3 A3
Figure 8a. Composition of slag sample S3 from heat A and G.

34
I3
H3 J3
Figure 8b. Composition of slag sample S3 from heat H, I and J.