slack to keep shrinking, fed to keep tightening€¦ · slack to keep shrinking, fed to keep...
TRANSCRIPT

www.hifreqecon.com/WebinarJuly2017
Slack To Keep Shrinking, Fed To Keep Tightening– Jim O’Sullivan, Chief U.S. Economist
www.hifreqecon.com/WebinarJuly2017
HFE Global Webinar — July 20, 2017 Jim O’Sullivan, Chief U.S. Economist
Daily Notes on the United States
0
2
4
6
8
10
12
83 87 91 95 99 03 07 11 15
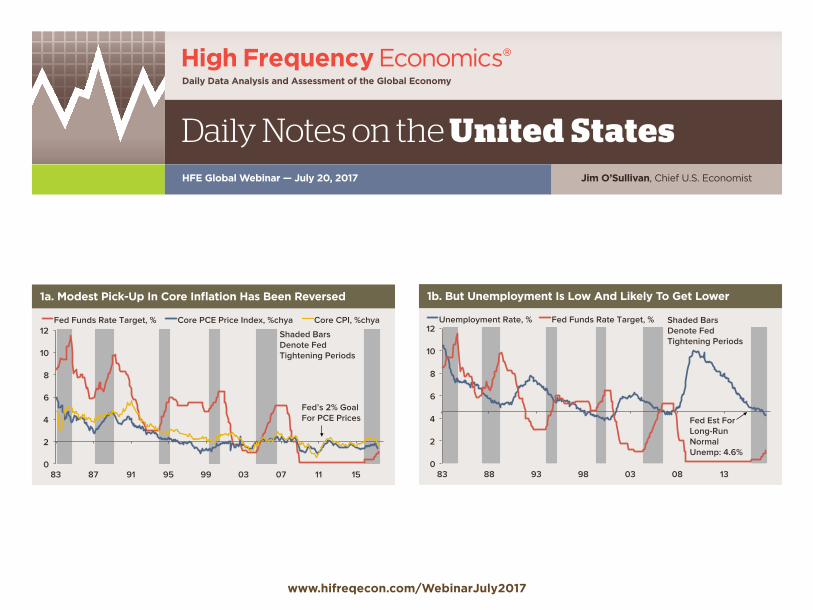
Fed Funds Rate Target, % Core PCE Price Index, %chya Core CPI, %chya
Shaded Bars Denote Fed Tightening Periods
Fed’s 2% Goal For PCE Prices
1a. Modest Pick-Up In Core Inflation Has Been Reversed
0
2
4
6
8
10
12
83 88 93 98 03 08 13
Unemployment Rate, % Fed Funds Rate Target, % Shaded Bars Denote Fed Tightening Periods
Fed Est For Long-Run Normal Unemp: 4.6%
1b. But Unemployment Is Low And Likely To Get Lower

www.hifreqecon.com/WebinarJuly2017
HFE Global Webinar — July 20, 2017 Jim O’Sullivan, Chief U.S. Economist
Daily Notes on the United States
-3.0
-2.4
-1.8
-1.2
-0.6
0.0
0.6
1.2
-5
-4
-3
-2
-1
0
1
2
85 90 95 00 05 10 15
CBO Estimate Of Unemployment Gap* (Left) Acceleration/Deceleration In Core PCE Price Index† (Right)
*Reported unemployment rate minus CBO estimate of NAIRU. †%chya minus %chya one year earlier.
2b. Upward Pressure On Inflation From Reduced Slack Just Starting
-2.4
-1.2
0.0
1.2
-5.0
-2.5
0.0
2.5
83 87 91 95 99 03 07 11 15
CBO Estimate Of Unemployment Gap* (Left) Acceleration/Deceleration In Private Wage Component Of ECI† (Right)
*Reported unemployment rate minus CBO estimate of NAIRU. †%chya minus %chya one year earlier.
2a. Upward Pressure On Wages From Reduced Slack Just Starting

www.hifreqecon.com/WebinarJuly2017
HFE Global Webinar — July 20, 2017 Jim O’Sullivan, Chief U.S. Economist
Daily Notes on the United States
1.0
2.2
3.4
4.6
07 08 09 10 11 12 13 14 15 16 17
Average of Three Measures, %chya ECI: Private Sector Wages Per Hour, %chya Employment Report: Average Hourly Earnings, %chya Atlanta Fed Per-Hour Wage Tracker, %chya
3a. Hourly Earnings Have Stopped Accelerating—Temporarily?
-8
-4
0
4
8
12
00 02 04 06 08 10 12 14 16
Wage And Salary Income, %chya, 3-Month Average Federal Withheld Employment-Based Tax Receipts Adjusted For Tax Law Changes, %chya, Smoothed 13-Week Average Acceleration Of
Income Into 2012
Delay Of Income Into 2017
3b. Withheld Receipts Are Outpacing Reported Wage Income
www.hifreqecon.com/WebinarJuly2017
HFE Global Webinar — July 20, 2017 Jim O’Sullivan, Chief U.S. Economist
Daily Notes on the United States
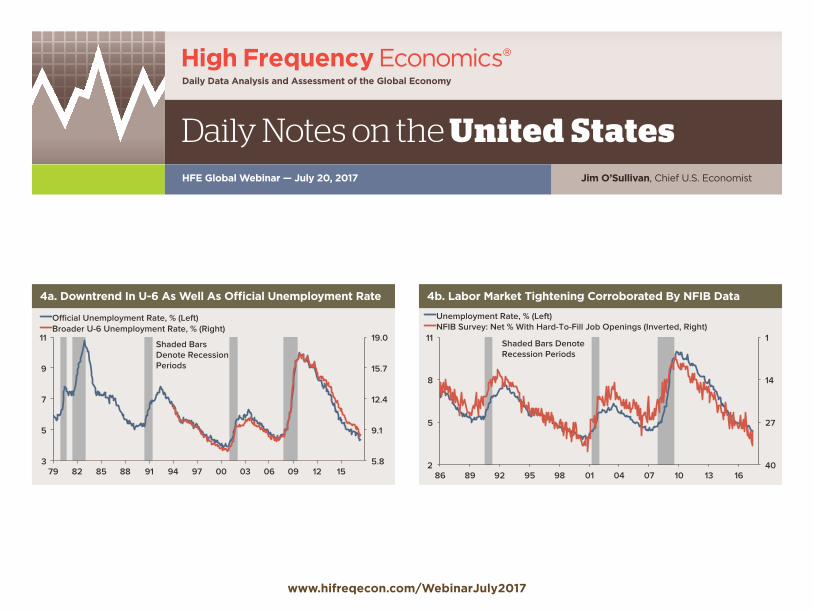
1
14
27
40 2
5
8
11
86 89 92 95 98 01 04 07 10 13 16
Unemployment Rate, % (Left) NFIB Survey: Net % With Hard-To-Fill Job Openings (Inverted, Right)
Shaded Bars Denote Recession Periods
4b. Labor Market Tightening Corroborated By NFIB Data
5.8
9.1
12.4
15.7
19.0
3
5
7
9
11
79 82 85 88 91 94 97 00 03 06 09 12 15
Official Unemployment Rate, % (Left) Broader U-6 Unemployment Rate, % (Right)
Shaded Bars Denote Recession Periods
4a. Downtrend In U-6 As Well As Official Unemployment Rate

www.hifreqecon.com/WebinarJuly2017
HFE Global Webinar — July 20, 2017 Jim O’Sullivan, Chief U.S. Economist
Daily Notes on the United States
200
300
400
500
600
700
70 75 80 85 90 95 00 05 10 15
Weekly Four-Week Average Shaded Bars Denote Recession Periods
Initial Claims, Thousands Per Week
5a. Jobless Claims Remain Low
5b. Payrolls Gains Remain Strong, With Offsets In The Details
Change, Thousands Per Month
20162017 Thru
June ChangePayrolls 187 180 -7
Government 17 9 -8Private 170 171 1
Manufacturing -1 9 10Mining & Logging -6 8 14Construction 13 19 6Wholesale Trade 3 6 3Retail Trade 17 -6 -23Trans & Warehousing 8 3 -4Utilities 0 0 0Information 0 -7 -7Financial Activities 15 14 -1Prof & Business Services 45 48 4
Temporary Help 3 12 9Education 7 2 -5Health & Social Assistance 39 36 -3Leisure & Hospitality 28 30 2Other Services 4 10 6

www.hifreqecon.com/WebinarJuly2017
HFE Global Webinar — July 20, 2017 Jim O’Sullivan, Chief U.S. Economist
Daily Notes on the United States
-6
-5
-4
-3
-2
-1
0
0 4 8 12 16 20 24 28 32 36
1961-69 1970-73 1975-80 1980-81 1982-90 1991-2001 2001-07 2009- Change In Unemployment Rate From Peak During Recoveries, Percentage Points
Quarters After Peak
Current Cycle
6b. ...Yet Unemployment Rate Has Been Falling Rapidly
100
110
120
130
140
150
160
0 4 8 12 16 20 24 28 32 36
1961-69 1970-73 1975-80 1980-81 1982-90 1991-2001 2001-07 2009- Real GDP During Recoveries, Trough=100
Quarters After Trough
Current Cycle
6a. GDP Growth Has Been Weak By Past Standards

www.hifreqecon.com/WebinarJuly2017
HFE Global Webinar — July 20, 2017 Jim O’Sullivan, Chief U.S. Economist
Daily Notes on the United States
74
84
94
104
114
-10
-5
0
5
10
86 89 92 95 98 01 04 07 10 13 16
Real GDP, %q/q, Annual Rate (Left) NFIB Small Business Optimism Index (Right)
Shaded Bars Denote Recession Periods
7b. NFIB Optimism Index Is Still High Enough For 5% Growth
25
45
65
85
105
125
-5
-3
0
3
5
8
91 93 95 97 99 01 03 05 07 09 11 13 15 17
Real Consumer Spending, %ch From 3 Months Ago In 3-Month Avg, AR (Left)* Expectations Component Of Conference Board Confidence Index (Right)
2011 Debt-Limit Scare
Fiscal Cliff Threat
Shutdown
Clinton Election
*Including HFE estimate for June 2017
7a. Spending Has Not Been As Strong As The Confidence Data

www.hifreqecon.com/WebinarJuly2017
HFE Global Webinar — July 20, 2017 Jim O’Sullivan, Chief U.S. Economist
Daily Notes on the United States
-36
-27
-18
-9
0
9
18
27
26
32
38
44
50
56
62
68
96 99 02 05 08 11 14 17
Manufacturing ISM Export Orders Index (Left) Real Good Exports, %ch From 6 Months Ago In 3-Month Avg, Annual Rate (Right)
1998
8b. Exports Have Picked Up, Albeit Not As Much As ISM Data
31
37
43
49
55
61
67
-9
-6
-3
0
3
6
9
97 00 03 06 09 12 15
Real GDP, %ch, Q/Q, Annual Rate (Left) Composite ISM Index (Manufacturing And Non-Manufacturing Combined, Right)
8a. ISM Indexes Look High Enough For Near-4% Growth

www.hifreqecon.com/WebinarJuly2017
HFE Global Webinar — July 20, 2017 Jim O’Sullivan, Chief U.S. Economist
Daily Notes on the United States
-20
-10
0
10
20
30
40
50
92 96 00 04 08 12 16
Bloomberg Consumer Comfort Polarization Index: Republican Minus Democrats Vertical Lines Mark Presidential Elections
9b. The “Polarization” Index Has Continued To Rise
10
24
38
52
66
80
06 08 10 12 14 16
Overall Index Democrats Republicans Independents
Vertical Lines Mark Presidential Elections
Weekly Bloomberg Consumer Comfort Index
9a. Confidence Data Have Shown Increased Partisanship

www.hifreqecon.com/WebinarJuly2017
HFE Global Webinar — July 20, 2017 Jim O’Sullivan, Chief U.S. Economist
Daily Notes on the United States
Nominal Funds Rate Target (%) Change In Funds Rate (Pct Pts) Core PCE Prices (%chya) Real Funds Rate*Start End Start End First 12 Months Full Cycle Start End Start EndMar 83 Aug 84 8.50 11.50 0.9 3.0 5.9 4.0 2.6 7.5Apr 87 Feb 89 6.00 9.75 0.8** 3.8 2.8 4.7 3.2 5.1Feb 94 Feb 95 3.00 6.00 2.5 3.0 2.2 2.3 0.8 3.7Jun 99 May 00 4.75 6.50 1.8 1.8 1.2 1.7 3.5 4.8Jun 04 Jun 06 1.00 5.25 2.0 4.3 1.9 2.4 -0.9 2.9Dec 15 0.13 0.5 1.4 -1.3* Deflated with %chya in core PCE prices. **The 1987-89 cycle was temporarily interrupted by the 1987 stock market crash.
10a. Fed Tightening Cycles
10b. Fed Officials’ Estimates For Appropriate Fed Funds Rate
% At Year-End, as of Jun 2017 FOMC Meeting
2017 2018 2019Longer
RunMedian Estimate 1.375 2.125 2.938 3.0Mean Estimate 1.38 2.23 2.85 2.92
10c. Fed Officials’ Economic Projections
Median, %ch Q4/Q4, Unless Noted, as of Jun 2017 FOMC Meeting
2017 2018 2019Longer
RunReal GDP 2.2 2.1 1.9 1.8Unemploy. Rate 4.3 4.2 4.2 4.6PCE Prices 1.6 2.0 2.0 2.0Core PCE Prices 1.7 2.0 2.0
*Q4 Level, %

www.hifreqecon.com/WebinarJuly2017
HFE Global Webinar — July 20, 2017 Jim O’Sullivan, Chief U.S. Economist
Daily Notes on the United States
23
45
67
89
54
76
98
120
61 65 69 73 77 81 85 89 93 97 01 05 09 13 17
University of Michigan Sentiment Index (Left) Gallup Approval Rating For The President, % (Right)
BHO GWB WJC
DJT
LBJ
JFK
RMN
GHWB
GRF
JEC RWR
11b. Consumer Confidence Vs. The President’s Approval Rating
-14
-12
-10
-8
-6
-4
-2
0
2
95 98 01 04 07 10 13 16
Bloomberg U.S. Financial Conditions
*Based on nine financial markets series, covering money markets, bond markets and equity markets; positive readings imply accomodative financial conditions.
Shaded Bars Denote Periods Of Recession
1998
European Sovereign Debt Fears
U.S. Debt-Limit Saga
Early 2016
11a. Despite Fed Tightening, Financial Conditions Have Eased
www.hifreqecon.com/WebinarJuly2017
HFE Global Webinar — July 20, 2017 Jim O’Sullivan, Chief U.S. Economist
Daily Notes on the United States
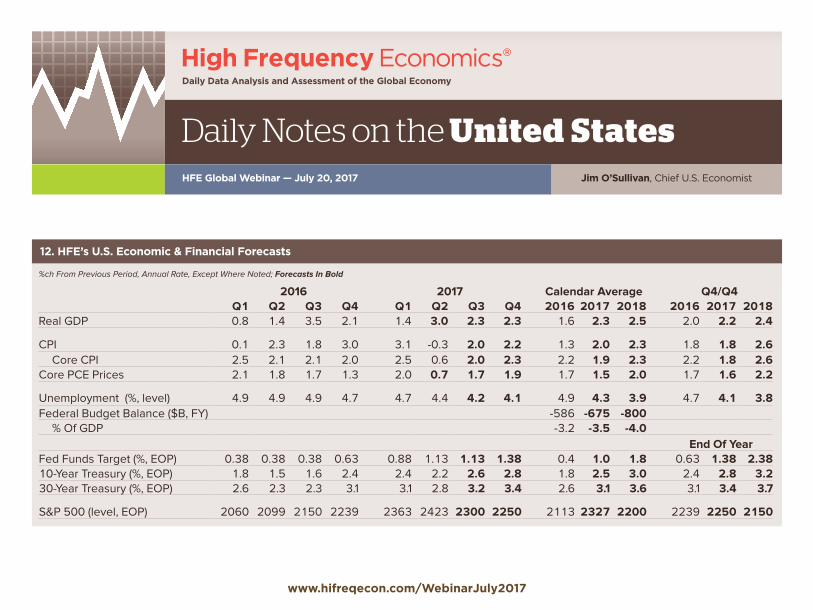
%ch From Previous Period, Annual Rate, Except Where Noted; Forecasts In Bold
2016 2017 Calendar Average Q4/Q4Q1 Q2 Q3 Q4 Q1 Q2 Q3 Q4 2016 2017 2018 2016 2017 2018
Real GDP 0.8 1.4 3.5 2.1 1.4 3.0 2.3 2.3 1.6 2.3 2.5 2.0 2.2 2.4
CPI 0.1 2.3 1.8 3.0 3.1 -0.3 2.0 2.2 1.3 2.0 2.3 1.8 1.8 2.6Core CPI 2.5 2.1 2.1 2.0 2.5 0.6 2.0 2.3 2.2 1.9 2.3 2.2 1.8 2.6
Core PCE Prices 2.1 1.8 1.7 1.3 2.0 0.7 1.7 1.9 1.7 1.5 2.0 1.7 1.6 2.2
Unemployment (%, level) 4.9 4.9 4.9 4.7 4.7 4.4 4.2 4.1 4.9 4.3 3.9 4.7 4.1 3.8Federal Budget Balance ($B, FY) -586 -675 -800
% Of GDP -3.2 -3.5 -4.0End Of Year
Fed Funds Target (%, EOP) 0.38 0.38 0.38 0.63 0.88 1.13 1.13 1.38 0.4 1.0 1.8 0.63 1.38 2.3810-Year Treasury (%, EOP) 1.8 1.5 1.6 2.4 2.4 2.2 2.6 2.8 1.8 2.5 3.0 2.4 2.8 3.230-Year Treasury (%, EOP) 2.6 2.3 2.3 3.1 3.1 2.8 3.2 3.4 2.6 3.1 3.6 3.1 3.4 3.7
S&P 500 (level, EOP) 2060 2099 2150 2239 2363 2423 2300 2250 2113 2327 2200 2239 2250 2150
12. HFE’s U.S. Economic & Financial Forecasts

www.hifreqecon.com/WebinarJuly2017
HFE Global Webinar — July 20, 2017 Jim O’Sullivan, Chief U.S. Economist
Daily Notes on the United States
-6
-3
0
3
6
9
-2
-1
0
1
2
3
77 80 83 86 89 92 95 98 01 04 07 10 13 16
Yield Curve: 10-Year Minus 2-Year Treasury Yield, Percentage Points (Left) Real GDP, %chya (Right)
Shaded Bars Denotes Recession Periods
13c. Yield Curve Inversions Generally Precede Recessions
13a. Long Expansion, But “Expansions Do Not Die Of OldAge”
RecessionsDuration (Months) Expansions
Duration (Months)
1945 8 1945-48 371948-49 11 1949-53 451953-54 10 1954-57 391957-58 8 1958-60 241960-61 10 1961-69 1061970 11 1970-73 361973-75 16 1975-80 581980 6 1980-81 121981-82 16 1982-90 921990-91 8 1991-2001 1202001 8 2001-07 732008-09 18 2009-? 96 So Far
Averages: Averages:1854-1919 21.6 1854-1919 26.61919-45 18.2 1919-45 35.0 1945-2009 11.1 1945-2009 58.4
-4
0
4
8
12
16
20
24
77 83 89 95 01 07 13
Real Fed Funds Rate, Deflated With %Y/Y In Core PCE Prices, % Nominal Fed Funds Rate, %
Shaded Bars Denote Recession Periods
13b. Recent Recessions Preceded By Fed Tightening Cycles

www.hifreqecon.com/WebinarJuly2017
Slack To Keep Shrinking, Fed To Keep Tightening– Jim O’Sullivan, Chief U.S. Economist