skyscanner - central region headquarters and a wet summer and fall across central and north central...
TRANSCRIPT
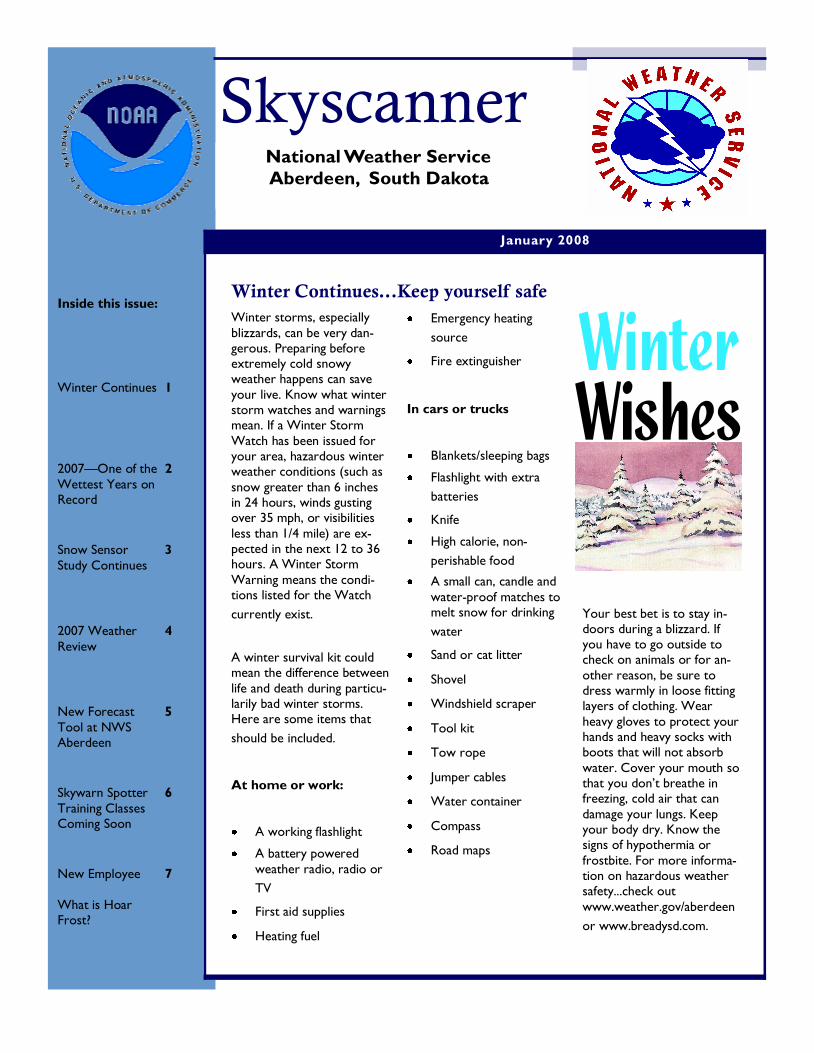
Your best bet is to stay in-doors during a blizzard. If you have to go outside to check on animals or for an-
other reason, be sure to dress warmly in loose fitting layers of clothing. Wear
heavy gloves to protect your hands and heavy socks with boots that will not absorb
water. Cover your mouth so that you don’t breathe in freezing, cold air that can
damage your lungs. Keep your body dry. Know the signs of hypothermia or
frostbite. For more informa-tion on hazardous weather safety...check out
www.weather.gov/aberdeen
or www.breadysd.com.
Winter storms, especially
blizzards, can be very dan-gerous. Preparing before extremely cold snowy weather happens can save
your live. Know what winter storm watches and warnings mean. If a Winter Storm
Watch has been issued for your area, hazardous winter weather conditions (such as
snow greater than 6 inches in 24 hours, winds gusting over 35 mph, or visibilities
less than 1/4 mile) are ex-pected in the next 12 to 36 hours. A Winter Storm
Warning means the condi-tions listed for the Watch
currently exist.
A winter survival kit could mean the difference between
life and death during particu-larily bad winter storms. Here are some items that
should be included.
At home or work:
A working flashlight
A battery powered
weather radio, radio or
TV
First aid supplies
Heating fuel
Emergency heating
source
Fire extinguisher
In cars or trucks
Blankets/sleeping bags
Flashlight with extra
batteries
Knife
High calorie, non-
perishable food
A small can, candle and
water-proof matches to melt snow for drinking
water
Sand or cat litter
Shovel
Windshield scraper
Tool kit
Tow rope
Jumper cables
Water container
Compass
Road maps
Winter Continues...Keep yourself safe
January 2008
Skyscanner
Inside this issue:
Winter Continues 1
2007—One of the
Wettest Years on Record
2
Snow Sensor
Study Continues
3
2007 Weather
Review
4
New Forecast
Tool at NWS Aberdeen
5
Skywarn Spotter
Training Classes Coming Soon
6
New Employee
What is Hoar Frost?
7
National Weather Service
Aberdeen, South Dakota

Due in part to a wet
spring across mostly
northeast South Dakota
and west central Minne-
sota, and a wet summer
and fall across central
and north central South
Dakota, many locations
across the area ap-
proached or broke re-
cord yearly rainfall to-
tals in 2007. Note that
all precipitation records
referred to here are
from 1932 to the pre-
sent.
The wet year was char-
acterized by extreme
precipitation events,
both monthly and daily,
throughout the
area. Monthly precipita-
tion records were bro-
ken at Aberdeen (May,
12.23"), Mobridge
(August, 6.20"), Pierre
(October, 5.69"), and
Watertown (February,
2.07" - a month which
also tied the all-time
snowiest month in Wa-
tertown with 27.0 inches
of snow). In addition,
several extreme daily
rainfall events occurred:
Aberdeen shattered its
all-time daily and 24-
hour rainfall records
with 7.62" of rain on
May 5, 2007 (7.75" in
24 hours). On the same
day, Groton broke the
South Dakota state 24-
hour rainfall record with
8.74" of rain. Mobridge
recorded 4.43" of rain
on August 17, 2007,
breaking its all-time
daily rainfall re-
cord. 7.02 inches of
rain fell at Wheaton,
MN on June 2, 2007,
which also was a new
daily record for that
location.
Wheaton broke the pre-
vious annual precipita-
tion record of 32.59
inches set in 1995, re-
cording 34.16 inches in
2007. Aberdeen had its
second wettest year on
record with 28.22
inches of precipita-
tion. The record is
28.50 inches set in
1998. Precipitation data
for Wheaton and Aber-
deen on which the re-
cords are based date to
1932.
The following table out-
lines final 2007 precipi-
tation totals, total
yearly precipitation rank
for 2007, the record
and normal annual pre-
cipitation amounts, and
the period of record for
precipitation.
2007—One of the Wettest Years on Record
“Many
locations across
the area
approached or
broke record
yearly rainfall
totals in 2007”
Page 2 Skyscanner
Location
2007 Precipi-
tation
Precipitation Rank: 2007
Record An-nual
Precipitation
Normal An-nual
Precipitation
Period of Re-
cord
Wheaton 34.16" 1st (Wettest) 32.59" (1995) 22.54" 1932 - 2007 (76 years)
Aberdeen 28.22"
2nd wettest 28.50" (1998) 20.22"
1932 - 2007 (76 years)
Pierre 25.95"
5th wettest 31.24" (1997) 19.88"
1933 - 2007 (75 years)
Mobridge 21.46"
11th wettest 25.78" (1946) 16.94"
1932 - 2007 (76 years)
Kennebec 22.70" 15th wettest 26.28" (1998) 18.71" 1932 - 2007 (76 years)
Sisseton 26.15" 19th wettest 33.48" (2005) 22.08" 1932 - 2007 (76 years)
Watertown 24.18"
23rd wettest 40.04" (1977) 21.94"
1932 - 2007 (76 years)
Timber Lake 18.16"
31st wettest 28.48" (1995) 18.60"
1932 - 2007 (76 years)
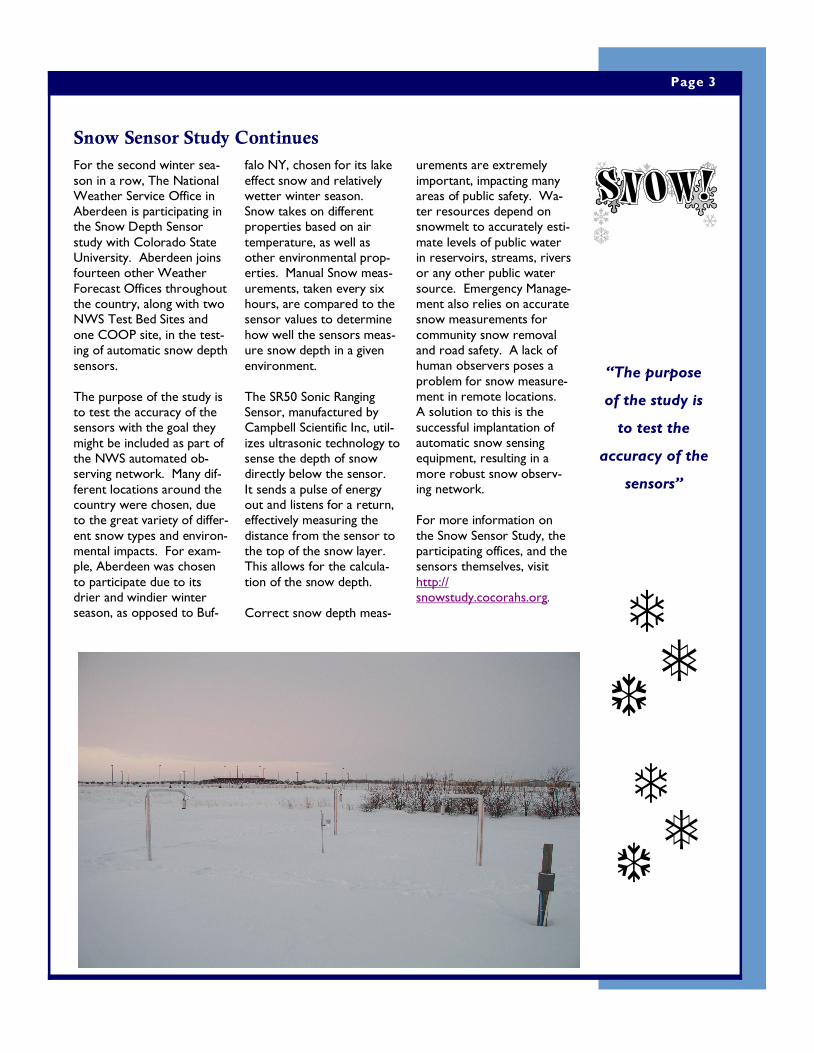
For the second winter sea-
son in a row, The National Weather Service Office in Aberdeen is participating in the Snow Depth Sensor
study with Colorado State University. Aberdeen joins fourteen other Weather
Forecast Offices throughout the country, along with two NWS Test Bed Sites and
one COOP site, in the test-ing of automatic snow depth
sensors.
The purpose of the study is to test the accuracy of the sensors with the goal they
might be included as part of the NWS automated ob-serving network. Many dif-
ferent locations around the country were chosen, due to the great variety of differ-
ent snow types and environ-mental impacts. For exam-ple, Aberdeen was chosen
to participate due to its drier and windier winter season, as opposed to Buf-
falo NY, chosen for its lake
effect snow and relatively wetter winter season. Snow takes on different properties based on air
temperature, as well as other environmental prop-erties. Manual Snow meas-
urements, taken every six hours, are compared to the sensor values to determine
how well the sensors meas-ure snow depth in a given
environment.
The SR50 Sonic Ranging Sensor, manufactured by Campbell Scientific Inc, util-
izes ultrasonic technology to sense the depth of snow directly below the sensor.
It sends a pulse of energy out and listens for a return, effectively measuring the
distance from the sensor to the top of the snow layer. This allows for the calcula-
tion of the snow depth.
Correct snow depth meas-
urements are extremely
important, impacting many areas of public safety. Wa-ter resources depend on snowmelt to accurately esti-
mate levels of public water in reservoirs, streams, rivers or any other public water
source. Emergency Manage-ment also relies on accurate snow measurements for
community snow removal and road safety. A lack of human observers poses a
problem for snow measure-ment in remote locations. A solution to this is the
successful implantation of automatic snow sensing equipment, resulting in a
more robust snow observ-ing network.
For more information on
the Snow Sensor Study, the participating offices, and the sensors themselves, visit
http://snowstudy.cocorahs.org.
Snow Sensor Study Continues
“The purpose
of the study is
to test the
accuracy of the
sensors”
Page 3
By far the biggest weather event of 2007 was the
disastrous flooding in the
James River Valley and points east on May 5th and
6th where 3 to 10 inches
of rain fell. Millions of
dollars in flood damage occurred to hundreds of
homes, businesses, roads,
along with crops. Also, the devastating snowmelt
and ice jam flooding in
Browns Valley, Minne-sota on March 14th along
with the heavy rain flood-
ing on August 17th and
18th in and around Mo-bridge.
Listed below are some of the more prominent
weather events of the
year.
-The heavy snow and
blizzard at the end of Feb-
ruary and for the first few days of March. Snowfall
amounts ranged from 2 to
22 inches with wide-spread near zero visibili-
ties as winds gusted to 50
to 60 mph.
-The heavy snow and
very cold air in early
April where 6 to 12 inches of snow fell across
northern South Dakota
and temperatures fell to 10 to 30 degrees below
normal across the entire
area.
-The late July heat and
humidity which contrib-uted to the deaths of
nearly 3000 cattle in
northeast South Dakota.
-The very wet month of
October for central and
north central South Da-kota where Pierre set its
monthly precipitation re-
cord.
-The extremely dry No-
vember across all of the area followed by heavy
snow on December 1st.
-Wheaton set a yearly precipitation record of
34.16 inches where nor-
mal is 22.54 inches. Aber-deen had its second wet-
test year with 28.22
inches where normal is 20.22 inches. Pierre had
its fifth wettest year with
25.95 inches where nor-
mal is 19.88 inches. Fi-nally, Mobridge had its
11th wettest year with
21.46 inches where nor-mal is 16.94 inches.
-The ongoing long term
drought along and west of the Missouri River finally
came to an end in early
June. According to the Weekly Drought Monitor,
not one single county
across central, north cen-tral, northeast South Da-
kota, and west central
Minnesota were dry by
early June. With a very dry period from the end
of June into early July, drought conditions began
to creep back into the
area. By the end of July, severe drought conditions
developed into central
South Dakota to the west
of the Missouri River and into northeast South Da-
kota. The drought contin-
ued through August with improvement by the end
of the month across the
area. Northeast South Da-kota and central South
Dakota dropped out of the
severe drought category
by the end of August. The drought conditions would
continue to improve
through September with the area not considered to
be dry again by the mid-
dle of October.
-The James River rose
above flood stage in late
April and early May with the snowmelt and heavy
rain in early May and
continued above flood stage throughout much
the summer. As a result,
several roads along with
agricultural land were flooded throughout the
summer. The James River
finally fello below flood stage in early September.
2007 Weather Review
“Millions of
dollars in flood
damage
occurred”
Page 4 Skyscanner
A new forecast tool has recently been added to help forecasters at the NWS in Aberdeen. The product name is “CRAS,” which stands for CIMSS Regional Assimilation System (CIMSS is the Cooperative Institute for Meteorological Satellite Studies located at the University of Wisconsin-Madison). Essentially, CRAS is a computer model which emphasizes the use of satellite infor-mation during the initiali-zation stage of the model. NWS Forecasters can view output from this model in 3 hourly inter-vals, out three days (72 hours) into the future. So, what is different about this new tool? The CRAS output can be thought of as a “simulated satellite
image.” In other words, the model gives forecast-ers a depiction of how satellite pictures will look at a given time in the fu-ture. Forecasters can then identify specific cloud features which in turn can affect:
1) temperature fore-casting (clear skies vs cloudy skies)
2) precipitation cover-age and intensity (heavy rain vs light rain vs no rain)
3) aviation impacts (when will the clouds affect a given airport)
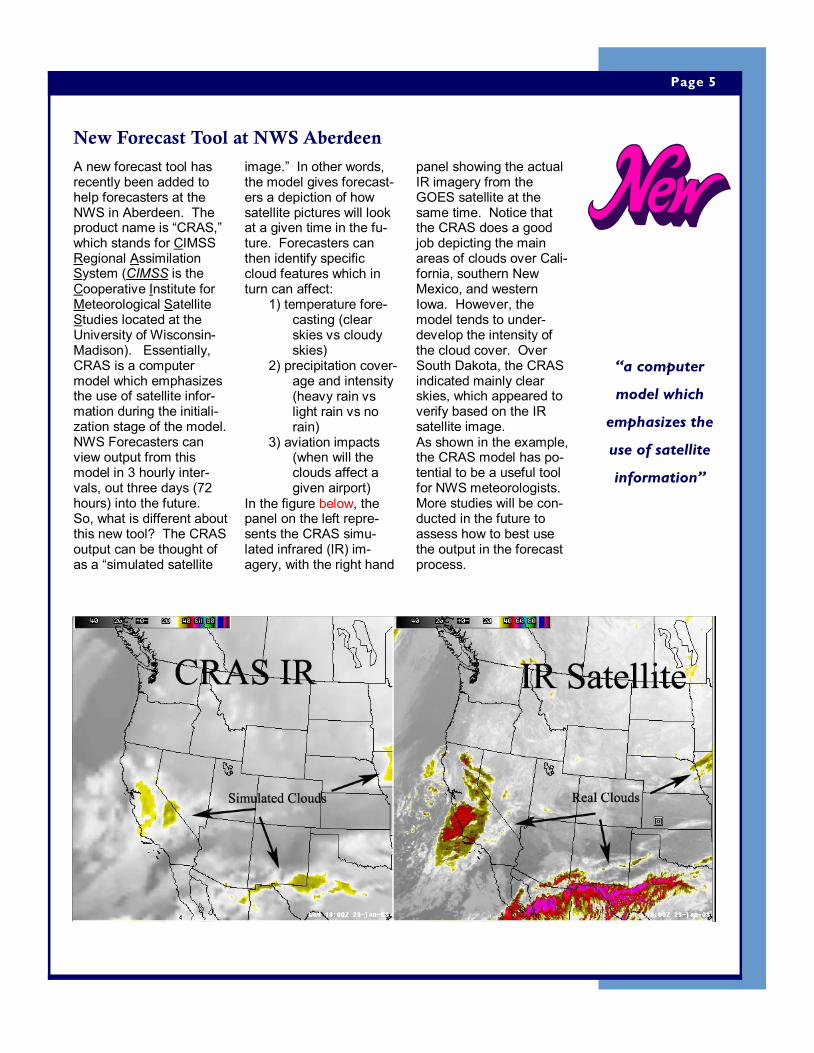
In the figure below, the panel on the left repre-sents the CRAS simu-lated infrared (IR) im-agery, with the right hand
panel showing the actual IR imagery from the GOES satellite at the same time. Notice that the CRAS does a good job depicting the main areas of clouds over Cali-fornia, southern New Mexico, and western Iowa. However, the model tends to under-develop the intensity of the cloud cover. Over South Dakota, the CRAS indicated mainly clear skies, which appeared to verify based on the IR satellite image. As shown in the example, the CRAS model has po-tential to be a useful tool for NWS meteorologists. More studies will be con-ducted in the future to assess how to best use the output in the forecast process.
New Forecast Tool at NWS Aberdeen
“a computer
model which
emphasizes the
use of satellite
information”
Page 5
Skywarn severe weather
spotter training classes
are being scheduled for
this spring. What are
Skywarn severe weather
spotters? They are a net-
work of volunteers that
provide weather informa-
tion to the National
Weather Service when
thunderstorms inevitably
strike South Dakota. In-
formation such as hail
size, wind speed, tornado
signatures, and rainfall
rates/amounts aid the
operations team at the
NWS in getting life-saving
information out to the
general public. The Na-
tional Weather Service
could not do it with out
our trained spotters!
So how does someone
become a trained spot-
ter? Beginning in March
through about mid-May,
the National Weather
Service will be coming to
a community near you to
conduct a short class that
covers the basics of se-
vere weather spotting.
You can get signed up at
that class to join the Sky-
warn network. In order
to continue to be a spot-
ter after your initial at-
tendance, we ask that you
continue to take the
training at least once
every other year to re-
main proficient. There is
no cost to take the
course!
As sessions are sched-
uled, an updated list of
communities and venues
will be available on our
website at
www.weather.gov/
aberdeen. If you have
any questions about the
Skywarn program or tak-
ing the class, please con-
tact the NWS Aberdeen
Warning Coordination
Meteorologist, Jennifer
Zeltwanger, at jenni-
or 605-225-0519.
Skywarn Spotter Training Classes Coming Soon
Page 6 Skyscanner

My name is Tracy Leber-man and I am a newly hired Electronics Techni-cian. I am married to An-nette and we have a 3 year old son, Max and a 19 month old daughter, Reagan. I graduated from Warner High School in 1986...and from North Dakota State School of Science in 1991. I moved to Glen-dive, Montana after col-lege to accept a position as a High Voltage Substa-tion Technician for Mon-tana Dakota Utilities Co. I was there 4 years before transferring to Bismarck, ND where I spent 1 year as crew foreman. In 1996, I married Annette and accepted a position as a Systems Technician at 3M in Aber-deen. I worked there from 1996 to 2002. We built a house at Richmond Lake where we still live
today. In 2002, I entered government service with the Department of En-ergy. I worked for West-ern Area Power Admini-stration as Substation Electrician in Bismarck, ND. I was there for 2 years before transferring to Watertown, SD. I enjoy spending time with my wife and kids. Some other inter-ests include football (Oakland Raiders), sky diving, auto racing, boat-ing, snowmobiles, and ATV’s. I would also like to start taking flying les-sons. Thank you for the
warm welcome. I’m look-
ing forward to being a part
of the National Weather
Service.
freezing. It forms when air below freezing with a dew point below freezing is brought to saturation by cooling. Typically, when sub-freezing saturation occurs, freezing fog de-velops in addition to the formation of frost. Here is a picture of hoar frost de-posits outside the NWS office in Aberdeen.
A deposit of interlocking crystals formed by direct sublimation on objects, usually those of small diameter freely exposed to the air, such as tree branches, plants, wires, poles, etc. The deposition of hoar frost is similar to the process by which dew is formed, except that the temperature of the frosted object must be below
New Employee
What is Hoar Frost?
Page 7
Hoar Frost
Tracy Leberman Electronics Technician

824 Brown County 14 South
Aberdeen, SD
57401
Phone: 605-225-0519
NATIONAL
WEATHER SERVICE
www.weather.gov/aberdeen
No winter lasts forever;
no spring skips its turn.
~ Hal Borland
OFFICIAL BUSINESS PENALTY FOR PRIVATE USE, $300