s.k.safiuddin thesis 0703ph1325 - revision...
TRANSCRIPT

ANNEXURE I
CONSISTENTLY LISTED ( FDI and NON-FDI) COMPANIES WITH
FOREIGN PROMOTERS QUOTA (CONSIDERED FOR THE STUDY)
1. List of FDI-based listed Companies
S.No Company Name Holding Date Foreign Promoter (%)
1. Abbott India Ltd. 2010.12.31 68.94
2. Astrazeneca Pharma India Ltd. 2010.12.31 90
3. Aventis Pharma Ltd. 2010.12.31 60.4
4. Biocon Ltd. 2010.12.31 19.77
5. Fresenius Kabi Oncology Ltd. 2010.12.31 90
6. Fulford (India) Ltd. 2010.12.31 53.93
7. Glaxosmithkline Pharmaceuticals Ltd. 2010.12.31 50.67
8. K D L Biotech Ltd. 2010.12.31 23.47
9. Kerala Ayurveda Ltd. 2010.12.31 61.52
10. Matrix Laboratories Ltd. 2009.06.30 87.68
11. Merck Ltd. 2010.12.31 51.8
12. Novartis India Ltd. 2010.12.31 76.42
13. Pfizer Ltd. 2010.12.31 70.75
14. Ranbaxy Laboratories Ltd. 2010.12.31 63.82
15. Sandu Pharmaceuticals Ltd. 2010.12.31 24.21
16. Solvay Pharma India Ltd. 2010.12.31 88.85
17. Wanbury Ltd. 2010.12.31 20.59
18. Wyeth Ltd. 2010.12.31 51.12 (Source: CMIE-Prowess)

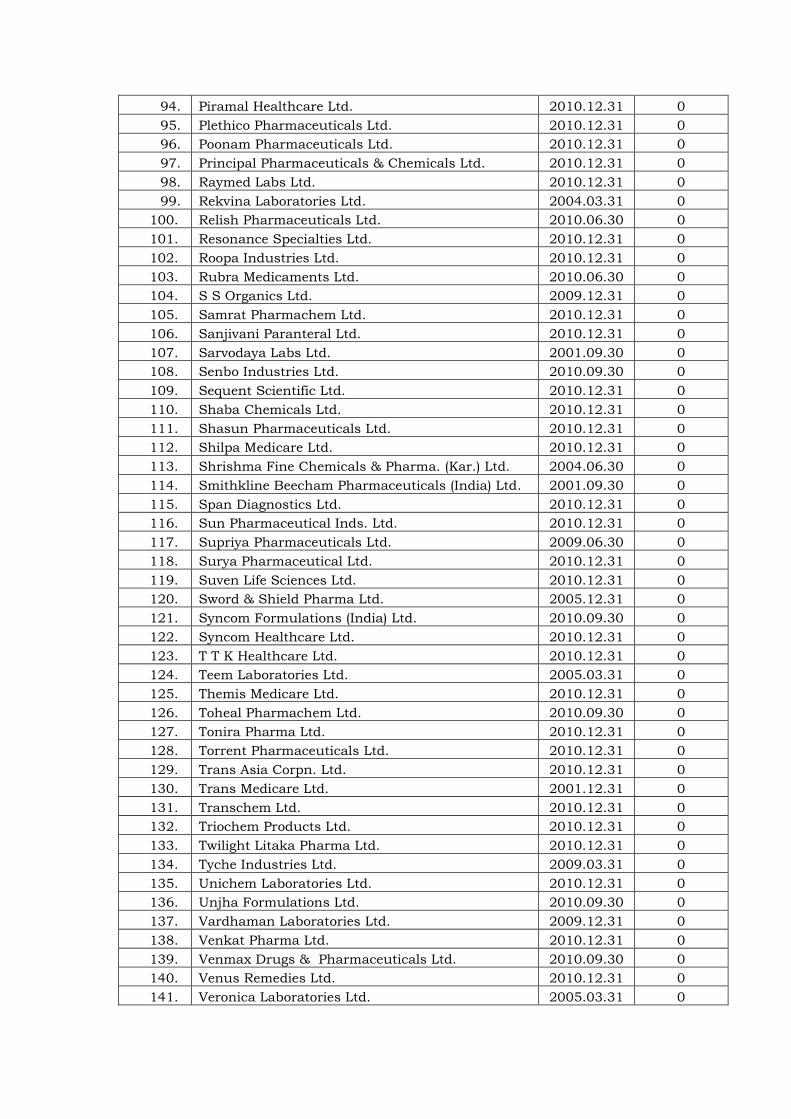
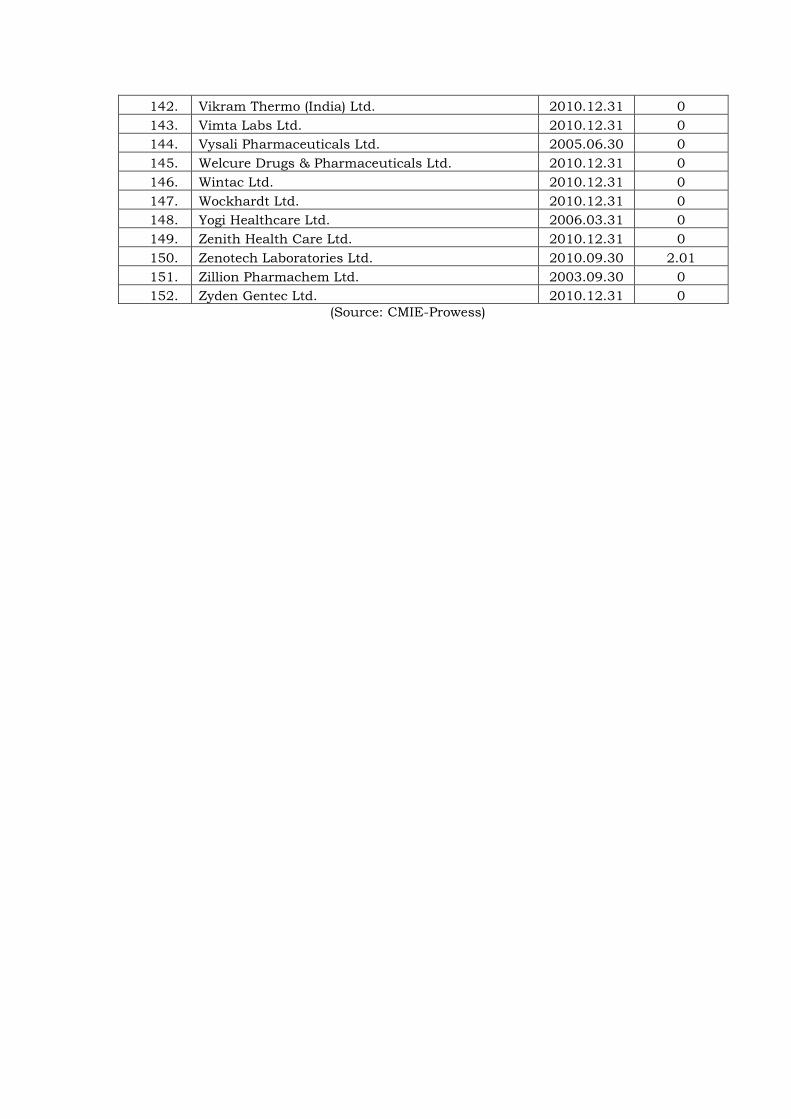
2. List of Non-FDI Companies
S.No Company Name Holding
Date Foreign
Promoter(%)
1. A B L Biotechnologies Ltd. 2010.12.31 0
2. Aarey Drugs & Pharmaceuticals Ltd. 2010.12.31 0
3. Aarti Drugs Ltd. 2010.12.31 0
4. Add-Life Pharma Ltd. 2006.03.31 0
5. Advik Laboratories Ltd. 2010.12.31 0
6. Ahlcon Parenterals (India) Ltd. 2010.12.31 0
7. Ajanta Pharma Ltd. 2010.12.31 0
8. Albert David Ltd. 2010.12.31 0
9. Alembic Ltd. 2010.12.31 0
10. Alpha Drug India Ltd. [Merged] 2005.12.31 0
11. Ambalal Sarabhai Enterprises Ltd. 2010.09.30 0
12. Amrutanjan Health Care Ltd. 2010.12.31 0
13. Ankur Drugs & Pharma Ltd. 2010.12.31 0
14. Anuh Pharma Ltd. 2010.12.31 0
15. Apte Amalgamations Ltd. 2010.12.31 0
16. Arvind Remedies Ltd. 2010.12.31 0
17. Auro Laboratories Ltd. 2010.12.31 0
18. Aurobindo Pharma Ltd. 2010.12.31 0
19. B D H Industries Ltd. 2010.12.31 0
20. Bafna Pharmaceuticals Ltd. 2010.12.31 0
21. Bal Pharma Ltd. 2010.12.31 0
22. Beryl Drugs Ltd. 2010.12.31 0
23. Bharat Immunologicals & Biologicals Corpn. Ltd. 2010.12.31 0
24. Biofil Chemicals & Pharmaceuticals Ltd. 2010.12.31 0
25. Brabourne Enterprises Ltd. [Merged] 2009.12.31 0
26. Cadila Healthcare Ltd. 2010.12.31 0
27. Caplin Point Laboratories Ltd. 2010.09.30 0
28. Chiplun Fine Chemicals Ltd. 2004.12.31 0
29. Cipla Ltd. 2010.12.31 0
30. Claris Lifesciences Ltd. 2010.12.31 0
31. Colinz Laboratories Ltd. 2010.12.31 0
32. Combat Drugs Ltd. 2010.12.31 0
33. Coral Laboratories Ltd. 2010.09.30 0
34. D I L Ltd. 2010.12.31 0
35. Desh Rakshak Aushdhalaya Ltd. 2010.12.31 0
36. Dolphin Laboratories Ltd. 2004.06.30 0
37. Dr. Reddy'S Laboratories Ltd. 2010.12.31 0
38. Dr. Sabharwal'S Manufacturing Labs Ltd. 2010.09.30 0
39. Dr. Wellmans Homoeopathic Laboratory Ltd. 2010.12.31 0
40. Dujohn Laboratories Ltd. 2010.09.30 0
41. Ebers Pharmaceuticals Ltd. 2001.09.30 0
42. Elder Health Care Ltd. 2010.12.31 0
43. Elder Pharmaceuticals Ltd. 2010.12.31 0
44. Emergy Phaarma Ltd. 2006.03.31 0
45. Eupharma Laboratories Ltd. 2004.09.30 0
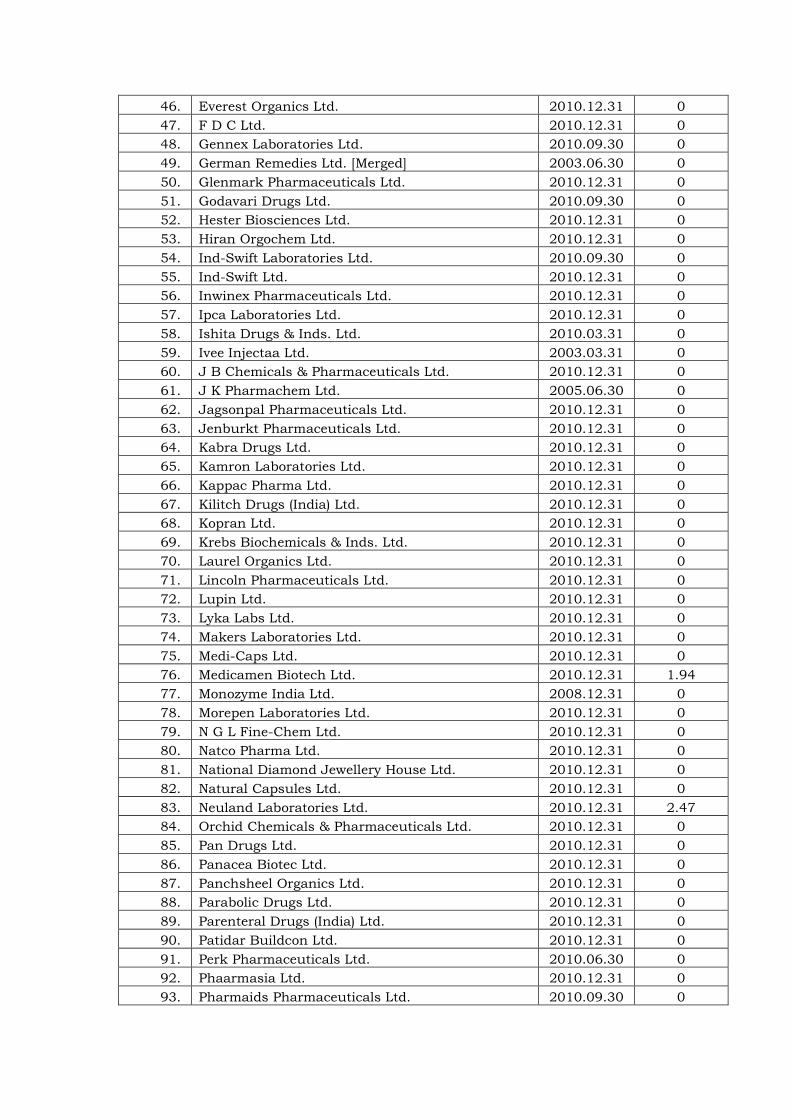
46. Everest Organics Ltd. 2010.12.31 0
47. F D C Ltd. 2010.12.31 0
48. Gennex Laboratories Ltd. 2010.09.30 0
49. German Remedies Ltd. [Merged] 2003.06.30 0
50. Glenmark Pharmaceuticals Ltd. 2010.12.31 0
51. Godavari Drugs Ltd. 2010.09.30 0
52. Hester Biosciences Ltd. 2010.12.31 0
53. Hiran Orgochem Ltd. 2010.12.31 0
54. Ind-Swift Laboratories Ltd. 2010.09.30 0
55. Ind-Swift Ltd. 2010.12.31 0
56. Inwinex Pharmaceuticals Ltd. 2010.12.31 0
57. Ipca Laboratories Ltd. 2010.12.31 0
58. Ishita Drugs & Inds. Ltd. 2010.03.31 0
59. Ivee Injectaa Ltd. 2003.03.31 0
60. J B Chemicals & Pharmaceuticals Ltd. 2010.12.31 0
61. J K Pharmachem Ltd. 2005.06.30 0
62. Jagsonpal Pharmaceuticals Ltd. 2010.12.31 0
63. Jenburkt Pharmaceuticals Ltd. 2010.12.31 0
64. Kabra Drugs Ltd. 2010.12.31 0
65. Kamron Laboratories Ltd. 2010.12.31 0
66. Kappac Pharma Ltd. 2010.12.31 0
67. Kilitch Drugs (India) Ltd. 2010.12.31 0
68. Kopran Ltd. 2010.12.31 0
69. Krebs Biochemicals & Inds. Ltd. 2010.12.31 0
70. Laurel Organics Ltd. 2010.12.31 0
71. Lincoln Pharmaceuticals Ltd. 2010.12.31 0
72. Lupin Ltd. 2010.12.31 0
73. Lyka Labs Ltd. 2010.12.31 0
74. Makers Laboratories Ltd. 2010.12.31 0
75. Medi-Caps Ltd. 2010.12.31 0
76. Medicamen Biotech Ltd. 2010.12.31 1.94
77. Monozyme India Ltd. 2008.12.31 0
78. Morepen Laboratories Ltd. 2010.12.31 0
79. N G L Fine-Chem Ltd. 2010.12.31 0
80. Natco Pharma Ltd. 2010.12.31 0
81. National Diamond Jewellery House Ltd. 2010.12.31 0
82. Natural Capsules Ltd. 2010.12.31 0
83. Neuland Laboratories Ltd. 2010.12.31 2.47
84. Orchid Chemicals & Pharmaceuticals Ltd. 2010.12.31 0
85. Pan Drugs Ltd. 2010.12.31 0
86. Panacea Biotec Ltd. 2010.12.31 0
87. Panchsheel Organics Ltd. 2010.12.31 0
88. Parabolic Drugs Ltd. 2010.12.31 0
89. Parenteral Drugs (India) Ltd. 2010.12.31 0
90. Patidar Buildcon Ltd. 2010.12.31 0
91. Perk Pharmaceuticals Ltd. 2010.06.30 0
92. Phaarmasia Ltd. 2010.12.31 0
93. Pharmaids Pharmaceuticals Ltd. 2010.09.30 0
94. Piramal Healthcare Ltd. 2010.12.31 0
95. Plethico Pharmaceuticals Ltd. 2010.12.31 0
96. Poonam Pharmaceuticals Ltd. 2010.12.31 0
97. Principal Pharmaceuticals & Chemicals Ltd. 2010.12.31 0
98. Raymed Labs Ltd. 2010.12.31 0
99. Rekvina Laboratories Ltd. 2004.03.31 0
100. Relish Pharmaceuticals Ltd. 2010.06.30 0
101. Resonance Specialties Ltd. 2010.12.31 0
102. Roopa Industries Ltd. 2010.12.31 0
103. Rubra Medicaments Ltd. 2010.06.30 0
104. S S Organics Ltd. 2009.12.31 0
105. Samrat Pharmachem Ltd. 2010.12.31 0
106. Sanjivani Paranteral Ltd. 2010.12.31 0
107. Sarvodaya Labs Ltd. 2001.09.30 0
108. Senbo Industries Ltd. 2010.09.30 0
109. Sequent Scientific Ltd. 2010.12.31 0
110. Shaba Chemicals Ltd. 2010.12.31 0
111. Shasun Pharmaceuticals Ltd. 2010.12.31 0
112. Shilpa Medicare Ltd. 2010.12.31 0
113. Shrishma Fine Chemicals & Pharma. (Kar.) Ltd. 2004.06.30 0
114. Smithkline Beecham Pharmaceuticals (India) Ltd. 2001.09.30 0
115. Span Diagnostics Ltd. 2010.12.31 0
116. Sun Pharmaceutical Inds. Ltd. 2010.12.31 0
117. Supriya Pharmaceuticals Ltd. 2009.06.30 0
118. Surya Pharmaceutical Ltd. 2010.12.31 0
119. Suven Life Sciences Ltd. 2010.12.31 0
120. Sword & Shield Pharma Ltd. 2005.12.31 0
121. Syncom Formulations (India) Ltd. 2010.09.30 0
122. Syncom Healthcare Ltd. 2010.12.31 0
123. T T K Healthcare Ltd. 2010.12.31 0
124. Teem Laboratories Ltd. 2005.03.31 0
125. Themis Medicare Ltd. 2010.12.31 0
126. Toheal Pharmachem Ltd. 2010.09.30 0
127. Tonira Pharma Ltd. 2010.12.31 0
128. Torrent Pharmaceuticals Ltd. 2010.12.31 0
129. Trans Asia Corpn. Ltd. 2010.12.31 0
130. Trans Medicare Ltd. 2001.12.31 0
131. Transchem Ltd. 2010.12.31 0
132. Triochem Products Ltd. 2010.12.31 0
133. Twilight Litaka Pharma Ltd. 2010.12.31 0
134. Tyche Industries Ltd. 2009.03.31 0
135. Unichem Laboratories Ltd. 2010.12.31 0
136. Unjha Formulations Ltd. 2010.09.30 0
137. Vardhaman Laboratories Ltd. 2009.12.31 0
138. Venkat Pharma Ltd. 2010.12.31 0
139. Venmax Drugs & Pharmaceuticals Ltd. 2010.09.30 0
140. Venus Remedies Ltd. 2010.12.31 0
141. Veronica Laboratories Ltd. 2005.03.31 0
142. Vikram Thermo (India) Ltd. 2010.12.31 0
143. Vimta Labs Ltd. 2010.12.31 0
144. Vysali Pharmaceuticals Ltd. 2005.06.30 0
145. Welcure Drugs & Pharmaceuticals Ltd. 2010.12.31 0
146. Wintac Ltd. 2010.12.31 0
147. Wockhardt Ltd. 2010.12.31 0
148. Yogi Healthcare Ltd. 2006.03.31 0
149. Zenith Health Care Ltd. 2010.12.31 0
150. Zenotech Laboratories Ltd. 2010.09.30 2.01
151. Zillion Pharmachem Ltd. 2003.09.30 0
152. Zyden Gentec Ltd. 2010.12.31 0 (Source: CMIE-Prowess)

ANNEXURE II Select Financial Indicators
(The tables given below shows the information compiled and calculated from the data collected from CMIE-Prowess database)
1. Select Financial Indicators of Abbott India Ltd.(Rs Crores)
Year Foreign Promoter
quota (%)
Rs. Crores
FDI Forex earnings Sales Total
Export R&D Exp Profit Assets
Capital employed Networth
2000-01 51 8.262 6.12 382.43 3.25 2.28 86.87 227.83 97.7 95.32
2000-02 58.2 9.4284 4.12 406.21 1.81 2 72.77 236.28 131.55 129.17
2002-03 61.7 9.9954 6.09 425.58 1.58 2.09 84.25 272.02 169.42 167.07
2003-04 61.7 9.4278 3.17 446.78 2.07 1.48 97.93 272.22 148.7 146.5
2004-05 61.7 9.4278 3.58 474.01 2.76 1.45 138.22 313.3 190.47 188.28
2005-06 61.7 9.4278 3.53 471.69 3.36 1.51 87.12 311.68 218.26 216.44
2006-07 65.14 9.9534 3.54 542.62 3.24 2.08 87.43 341.82 247.22 245.81
2007-08 65.14 9.4258 3.93 639.27 3.49 3.55 101.88 364.74 232.05 231.02
2008-09 68.94 9.431 7.33 707.28 4.37 5.02 95.38 388.53 222.01 221.25
2009-10 68.94 9.431 8.56 801.72 4.4 6.04 117.19 424.27 271.56 271.56 (Source:CMIE-Prowess)
2. Select Financial Indicators of Astrazeneca Pharma India Ltd.
Year Foreign Promoter
quota (%)
Rs. Crores
FDI Forex earnings Sales Total
Export R&D
Expenses Profit Assets Capital employed Networth
2000-01 51.5 2.575 0.19 109.15 0.18 4.61 20.15 88.27 66.08 66.71
2000-02 56.5 2.825 0.03 95.89 0 4.61 6.88 93.62 67.14 67.47
2002-03 91.61 4.5805 1.45 153.2 1.45 2.77 19.5 120.34 75.92 75.98
2003-04 91.61 4.5805 2.19 196.11 2.19 2.56 38.48 145.89 98.05 98.05
2004-05 90 4.5 3.6 210.89 3.6 2.7 44.78 167.44 95.54 95.54
2005-06 90 4.5 3.73 246.42 3.73 2.17 65.99 178.79 127.19 127.19
2006-07 90 4.5 6.24 293.68 6.24 2.58 74.95 243.06 141.72 141.72
2007-08 90 4.5 8.84 330.51 8.84 2.46 95.35 411.98 159.31 159.31
2008-09 90 4.5 24.12 374.38 22.88 2.45 119.25 291.27 178.65 116.15
2009-10 90 4.5 28.66 405.04 28.66 2.3 88.53 235.92 144.52 144.52 (Source:CMIE-Prowess)

3. Select Financial Indicators of Aventis Pharma Ltd
Year Foreign Promoter
quota(%)
Rs. Crores
FDI Forex earnings Sales Total
Export R&D
Expenses Profit Assets Capital employed Networth
2000-01 50.1 11.53803 60 559.16 60 1.52 50.76 369.15 188.41 197.23
2000-02 50.1 11.53803 104.26 598.03 102.82 2.99 96.5 416.37 246.12 246.39
2002-03 50.1 11.53803 128.91 669.14 127.96 4.59 91.09 436.96 269.67 269.15
2003-04 50.1 11.53803 153.28 709.68 149.2 3.99 146.61 487.24 317.93 321.33
2004-05 50.1 11.53803 213.26 793.56 200.98 4.02 226.3 589.87 404.03 421.84
2005-06 50.1 11.53803 242.54 868.47 222.2 3.34 225.04 710.45 506.82 523.79
2006-07 50.12 11.542636 235.94 951.81 220.82 3.26 249.89 872.28 592.07 608.21
2007-08 50.12 11.542636 184.56 961.13 166.76 4.53 221.97 930.77 691.55 706.85
2008-09 50.12 11.542636 229.09 1070.38 205.49 5.01 259.89 1078.22 814.64 829.1
2009-10 60.4 13.91012 276.97 1050.59 228.11 13.23 244.98 1220.56 918.16 931.79 (Source:CMIE-Prowess)
4. Select Financial Indicators of Biocon Ltd
Year Foreign Promoter
quota(%)
Rs. Crores
FDI Forex earnings Sales Total
Export R&D
Expenses Profit Assets Capital employed Networth
2000-01 0 0 27.37 123.57 27.37 3.87 30.65 133.76 89.84 66.99
2000-02 0 0 47.41 162.03 47.41 7.55 32.33 213.6 121.42 87.7
2002-03 0 0 108.52 276.98 108.34 11.42 52.3 276.92 165.71 126.71
2003-04 0 0 300.57 535.94 300.44 23.33 149.61 753.5 583.54 541.63
2004-05 24.9 12.45 378.04 688.43 376.23 24.09 190.36 1024.27 770.71 695.94
2005-06 20.47 10.235 358.95 725.75 358.8 40.08 162.52 1160.23 904.24 803.05
2006-07 20.47 10.235 476.34 888.77 476.16 47.87 183.54 1307.5 1001.47 941.64
2007-08 20.47 10.235 522.62 905.07 522.47 64.65 447.75 1750.4 1468.78 1328.2
2008-09 20.47 20.47 471.78 938.8 471.78 74.38 126.14 1880.57 1512.73 1374.88
2009-10 20.47 20.47 505.71 1193.36 496.48 75.38 277.41 2270.02 1694.45 1566.3 (Source:CMIE-Prowess)

5. Select Financial Indicators of Fresenius Kabi Oncology Ltd
Year Foreign Promoter
quota(%)
Rs. Crores
FDI Forex earnings Sales Total
Export R&D
Expenses Profit Assets Capital
employed Networth
2000-01 0 0 NA NA 0 NA NA NA NA NA
2000-02 0 0 NA NA 0 NA NA NA NA NA
2002-03 0 0 NA NA 0 NA NA NA NA NA
2003-04 0 0 79.34 215.45 79.1 18.16 19.06 238.86 191.52 198.6
2004-05 0 0 104.41 235.76 104.39 21.5 29.14 311.57 223.74 224.16
2005-06 0 0 118.22 270.44 116.75 26.89 24.6 409.14 302.81 309.35
2006-07 0.03 0.004701 171.65 312.7 166.66 35.71 35.76 552.34 386.31 334.89
2007-08 0.03 0.004701 184.58 250.3 175.58 26.23 162.83 803.11 543.56 499.15
2008-09 90 14.238 195.66 274.09 184.6 30.73 -56.23 782.21 563.51 411.86
2009-10 90 14.238 360.95 432.51 355.94 34.7 102.93 920.06 631.94 492.09 (Source:CMIE-Prowess)
6. Select Financial Indicators of Fulford (India) Ltd
Year Foreign Promoter
quota(%)
Rs. Crores
FDI Forex earnings Sales Total
Export R&D
Expenses Profit Assets Capital
employed Networth
2000-01 40 1.28 0 134.49 0 0 2.59 62.08 22.74 13.95
2000-02 40 1.28 0 140.41 0 0 4.18 51.12 26.5 15.49
2002-03 40 1.28 0.29 94.7 0 0 -5.49 36.14 20.01 7.88
2003-04 40 1.28 0.14 130.51 0.14 0 8.51 42.58 20.38 13.31
2004-05 40 1.28 0 131.79 0 0 20.2 41.77 25.4 24.36
2005-06 40 1.28 0.1 151.97 0.1 0 24.46 59.18 38.33 38.31
2006-07 50.77 1.98003 0.38 155.04 0.38 0 19.97 108.53 89.9 89.9
2007-08 53.93 2.10327 0.5 174.38 0.5 0 33.91 134.3 109.62 109.62
2008-09 53.93 2.10327 0.31 190.44 0.31 0 31.57 226.8 128.43 128.43
2009-10 53.93 2.10327 0 195.28 0 0 22.09 241.06 139.84 139.84 (Source:CMIE-Prowess)

7. Select Financial Indicators of Glaxosmithkline Pharmaceuticals Ltd
Year Foreign Promoter
quota(%)
Rs. Crores
FDI Forex earnings Sales Total
Export R&D
Expenses Profit Assets Capital
employed Networth
2000-01 51 30.4878 74.29 952.01 72.26 4.14 114.15 600.31 410.93 394.46
2000-02 48.83 36.368584 78.44 1120.17 75.72 3.97 104.29 786.47 569.61 560.58
2002-03 48.83 36.368584 66.78 1167.89 66.78 3.88 172.55 1441.83 581.26 579.28
2003-04 48.83 36.368584 41.06 1209.5 39.11 3.54 276.82 1646.72 670.35 667.49
2004-05 49.15 42.91778 38.62 1490.89 37.38 4.51 487.16 2330 928.1 924.26
2005-06 50.67 42.91749 46.02 1593.86 44.6 4.39 674.12 2581.26 953.45 948.6
2006-07 50.67 42.91749 59.32 1710.82 55.57 6.15 740.38 3035.84 1200.26 1194.72
2007-08 50.67 42.91749 83.73 1761.39 79.13 5.81 748.23 3516.28 1366.69 1360.92
2008-09 50.67 42.91749 96.28 1796.22 94.65 12.68 808.64 4019.45 1546.74 1541.09
2009-10 50.67 42.91749 122.19 1970.35 118.4 8.02 766.25 4441.01 1764.56 1759.14 (Source:CMIE-Prowess)
8. Select Financial Indicators of K D L Biotech Ltd.
Year Foreign Promoter
quota(%)
Rs. Crores
FDI Forex earnings Sales Total
Export R&D
Expenses Profit Assets Capital
employed Networth
2000-01 25.87 4.335812 101.38 159.45 101.38 0 14.41 188.76 107.47 79.21
2000-02 25.87 4.335812 100.79 170.95 100.79 0 15.46 213.51 123.51 89.21
2002-03 25.87 4.335812 114.12 168.94 114.12 0 11.9 226.69 116.73 91.58
2003-04 33.65 5.63974 83.55 132 83.55 0 5.5 210.28 115.63 88.58
2004-05 33.65 0 - - 0 - - - - -
2005-06 33.65 5.63974 29.82 120.48 29.82 0 -12.1 163.07 65.33 34
2006-07 0 0 - - 0 - - - - -
2007-08 33.65 5.63974 31.36 118.17 31.36 0 -0.34 168.26 22.98 7.43
2008-09 23.47 5.642188 8.99 60.04 8.99 0 -11.34 133.64 67.79 39.37
2009-10 23.47 5.642188 0.68 26.42 0.68 0 -9.35 120.4 50.78 22.37 (Source:CMIE-Prowess)

9. Select Financial Indicators of Kerala Ayurveda Ltd.
Year Foreign Promoter
quota(%)
Rs. Crores
FDI Forex earnings Sales Total
Export R&D
Expenses Profit Assets Capital
employed Networth
2000-01 2.61 0.1566 1.01 11.59 1.01 0.07 1.29 20.95 14.6 8.18
2000-02 6.49 0.419254 1.28 12.59 1.28 0.06 -0.47 21.74 15.06 6.05
2002-03 6.49 0.419254 0 13.26 0 0.08 0.46 21.72 14.42 4.42
2003-04 6.49 0.419254 0.81 11.59 0.81 0.07 1.2 16.67 9.49 4.8
2004-05 6.49 0.419254 1.28 11.29 1.28 0.12 0.89 17.95 9.65 4.81
2005-06 52.85 3.99546 1.07 10.81 1.07 0.08 0.36 29.48 19.96 8.16
2006-07 61.52 6.496512 0.84 16.41 0.84 0.14 -0.41 43.95 37.59 20.36
2007-08 61.52 6.496512 3.21 18.59 3.21 0.14 -4.36 56.66 44.06 15.73
2008-09 61.52 6.496512 1.04 19 0.99 0.1 -3.01 58.69 46.42 11.65
2009-10 61.52 6.496512 0.71 21.07 0.66 0.07 -0.81 66.09 49.03 10.01 (Source:CMIE-Prowess)
10. Select Financial Indicators of Matrix Laboratories Ltd
Year Foreign Promoter
quota(%)
Rs. Crores
FDI Forex earnings Sales Total
Export R&D
Expenses Profit Assets Capital
employed Networth
2000-01 0 0 4.56 67.89 4.56 0.31 5.99 42.41 20.44 13.8
2000-02 0 0 9.61 103.89 9.61 1.73 8.43 69.05 36.94 21.52
2002-03 0 0 281.98 416.93 281.63 5.42 122.24 327 206.18 101.58
2003-04 0 0 297.59 557.41 297.59 16.3 166.18 556.81 282.86 178.2
2004-05 39.15 11.72151 340.42 664.23 336.6 27.2 167.28 995.58 631.54 624.01
2005-06 38.14 11.716608 417.11 788.48 390.27 59.9 219.87 1409.74 873.87 869.44
2006-07 71.39 22.002398 526.27 775.43 499.43 92.1 126.41 1602.04 982.48 978.54
2007-08 71.18 22.008856 639.31 974.27 612.4 119.71 -236.71 1561.94 747.51 687.91
2008-09 76.13 23.539396 1243.07 1504.41 1224.24 221.44 312.88 2102.15 1025.55 877.59
2009-10 0 0 1539.37 1894.3 1537.25 265.87 350.73 2686.78 1354.17 1152.2 (Source:CMIE-Prowess)

11. Select Financial Indicators of Merck Ltd.
Year Foreign Promoter
quota(%)
Rs. Crores
FDI Forex earnings Sales Total
Export R&D
Expenses Profit Assets Capital
employed Networth
2000-01 51 8.5986 17.81 315.95 17.37 0.64 55.84 190.99 131.82 131.82
2000-02 51 8.5986 15.92 341.65 12.94 0.71 64.6 216.48 147.09 150.49
2002-03 51 8.5986 14.73 385.56 13.03 0.37 61.73 247.54 162.02 175.63
2003-04 51 8.5986 21.29 404.06 18.64 0.14 68.47 278.05 196.25 196.25
2004-05 51 8.5986 16.22 418.39 14.36 0.3 106.97 326.99 248.18 248.18
2005-06 51 8.5986 18.8 438.09 16.14 1.61 116.96 386.52 298.13 298.13
2006-07 51 8.5986 19.18 371.66 17.55 1.56 167.21 479.36 393.03 393.03
2007-08 51 8.5986 20.58 357.65 19.78 1.48 99.87 490.58 422.9 422.9
2008-09 51 8.5986 30.74 424.69 30.01 1.56 91.75 563.9 451.39 451.39
2009-10 51.8 8.5988 54.68 495.5 52.33 2.04 96.48 572.5 467.29 467.29 (Source:CMIE-Prowess)
12. Select Financial Indicators of Novartis India Ltd
Year Foreign Promoter
quota(%)
Rs. Crores
FDI Forex earnings Sales Total
Export R&D
Expenses Profit Assets Capital
employed Networth
2000-01 50.99 8.148202 14.77 457.74 13.77 1.64 80.71 383.12 236.1 167.29
2000-02 50.93 8.138614 5.59 481.72 5.56 0.6 98.53 350.83 211.92 208.62
2002-03 50.93 8.138614 6.52 488.29 5.42 1.01 92.4 380.24 246.8 243.58
2003-04 50.93 8.138614 8.56 523.1 7.85 0.95 144.17 377.6 259.85 255.79
2004-05 50.93 8.138614 10.3 490.09 9.31 0.69 102.69 414.08 288.29 284.38
2005-06 50.93 8.138614 6.06 543.75 3.79 1.62 153.45 479.12 341.5 337.6
2006-07 50.93 8.138614 7.06 563.9 3.8 0.84 138.99 491.46 393.28 388.58
2007-08 50.93 8.138614 9.17 578.67 4.21 0.76 152.51 584.23 448.86 448.42
2008-09 50.93 8.138614 9.1 625.09 6.78 0.31 168.98 672.02 515.04 514.74
2009-10 76.42 12.211916 7.03 667.49 4.58 0.15 177.7 766.69 593.73 593.46 (Source:CMIE-Prowess)

13. Select Financial Indicators of Pfizer Ltd.
Year Foreign Promoter
quota(%)
Rs. Crores
FDI Forex earnings Sales Total
Export R&D
Expenses Profit Assets Capital
employed Networth
2000-01 40 9.372 19.42 374.49 14.25 14.23 65.02 226.49 130.6 135.3
2000-02 40 9.376 19.74 410.33 19.7 13.21 79.06 280.03 169.89 169.89
2002-03 40 9.376 58.24 696.74 22.33 18.58 131.6 473.17 255.84 308.03
2003-04 40 11.52 27.08 588.4 27.08 21.19 44.15 448.47 254.36 308.4
2004-05 40 11.52 24.06 684.83 24.06 23.51 75.65 529.56 294.69 342.76
2005-06 41.23 12.303032 26.97 724.15 26.97 22.36 109.12 580.23 339.86 376.56
2006-07 41.23 12.303032 28.54 791.98 28.54 23.8 162.08 1134.93 392.39 405.73
2007-08 41.23 12.303032 22.07 794.27 22.07 24.58 450.14 1471.06 645.72 648.65
2008-09 41.23 12.303032 22.98 786.73 22.98 28.35 418.56 1825.88 899.56 899.56
2009-10 70.75 21.1118 25.59 870.6 25.59 29.27 210.01 2059.02 994.33 994.33 (Source:CMIE-Prowess)
14. Select Financial Indicators of Ranbaxy Laboratories Ltd.
Year Foreign Promoter
quota(%)
Rs. Crores
FDI Forex earnings Sales Total
Export R&D
Expenses Profit Assets Capital
employed Networth
2000-01 0 0 791.29 1775.71 752.94 73.39 256.18 2388.87 1501.22 1582.65
2000-02 0 0 1085.52 1959.78 1045.21 77.12 335.71 2520.94 1466.55 1606.98
2002-03 0 0 2015.62 3131.76 1901.92 192.17 589.05 2860.48 1879.7 1873.46
2003-04 0 0 2559.14 3888.98 2447.66 276.13 964.44 3659.95 2323.55 2321.78
2004-05 0 0 2513.96 3865.87 2404.83 399.66 638.37 4236.57 2509.24 2509.51
2005-06 0 0 2357.75 3284.03 2254.84 639.33 221.11 4848.3 2540.46 2377.31
2006-07 0 0 2755.86 3599.15 2622.76 483.82 549.15 7096.87 4542.28 2350.01
2007-08 0 0 2660.86 3656.2 2530.18 460.51 947.58 7956.92 4820.44 2538.41
2008-09 63.92 134.353448 2853.79 3973.41 2699.96 471.38 -1469.21 12013.5 6371.88 3541.13
2009-10 63.9 134.32419 3136.45 4653.37 2799.48 494.38 1450.47 11605 6663.62 3958.96 (Source:CMIE-Prowess)
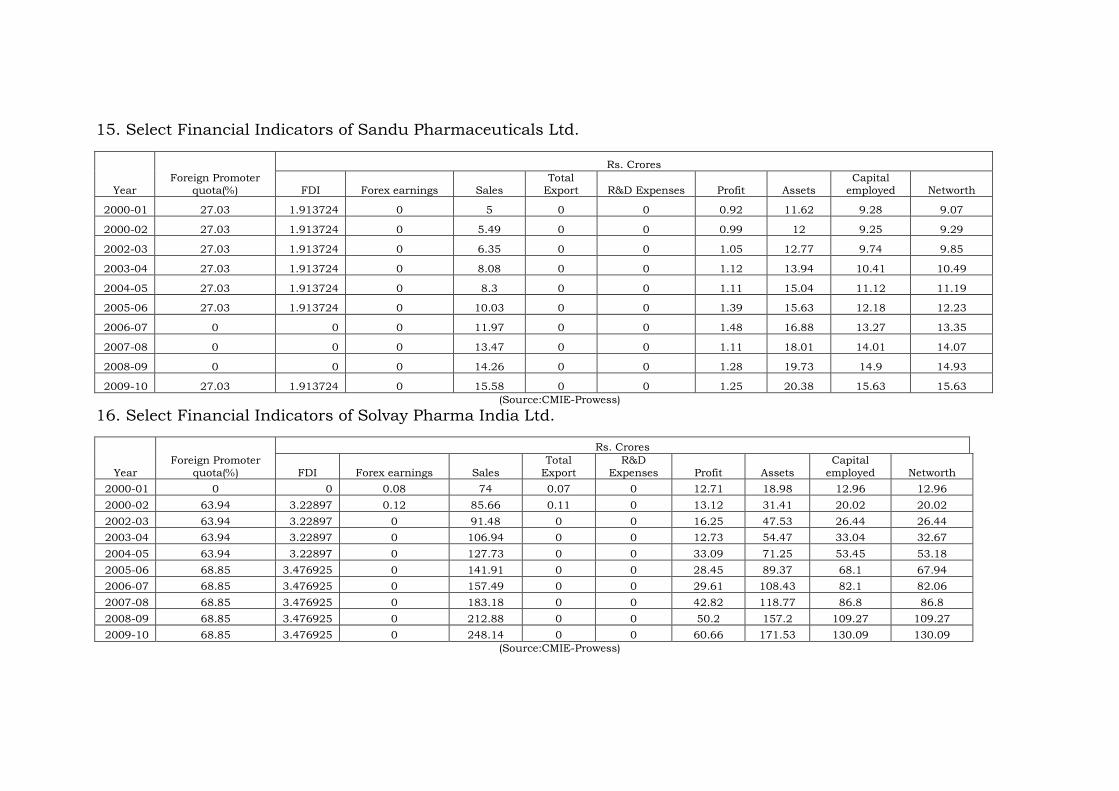
15. Select Financial Indicators of Sandu Pharmaceuticals Ltd.
Year Foreign Promoter
quota(%)
Rs. Crores
FDI Forex earnings Sales Total
Export R&D Expenses Profit Assets Capital
employed Networth
2000-01 27.03 1.913724 0 5 0 0 0.92 11.62 9.28 9.07
2000-02 27.03 1.913724 0 5.49 0 0 0.99 12 9.25 9.29
2002-03 27.03 1.913724 0 6.35 0 0 1.05 12.77 9.74 9.85
2003-04 27.03 1.913724 0 8.08 0 0 1.12 13.94 10.41 10.49
2004-05 27.03 1.913724 0 8.3 0 0 1.11 15.04 11.12 11.19
2005-06 27.03 1.913724 0 10.03 0 0 1.39 15.63 12.18 12.23
2006-07 0 0 0 11.97 0 0 1.48 16.88 13.27 13.35
2007-08 0 0 0 13.47 0 0 1.11 18.01 14.01 14.07
2008-09 0 0 0 14.26 0 0 1.28 19.73 14.9 14.93
2009-10 27.03 1.913724 0 15.58 0 0 1.25 20.38 15.63 15.63 (Source:CMIE-Prowess)
16. Select Financial Indicators of Solvay Pharma India Ltd.
Year Foreign Promoter
quota(%)
Rs. Crores
FDI Forex earnings Sales Total
Export R&D
Expenses Profit Assets Capital
employed Networth
2000-01 0 0 0.08 74 0.07 0 12.71 18.98 12.96 12.96
2000-02 63.94 3.22897 0.12 85.66 0.11 0 13.12 31.41 20.02 20.02
2002-03 63.94 3.22897 0 91.48 0 0 16.25 47.53 26.44 26.44
2003-04 63.94 3.22897 0 106.94 0 0 12.73 54.47 33.04 32.67
2004-05 63.94 3.22897 0 127.73 0 0 33.09 71.25 53.45 53.18
2005-06 68.85 3.476925 0 141.91 0 0 28.45 89.37 68.1 67.94
2006-07 68.85 3.476925 0 157.49 0 0 29.61 108.43 82.1 82.06
2007-08 68.85 3.476925 0 183.18 0 0 42.82 118.77 86.8 86.8
2008-09 68.85 3.476925 0 212.88 0 0 50.2 157.2 109.27 109.27
2009-10 68.85 3.476925 0 248.14 0 0 60.66 171.53 130.09 130.09 (Source:CMIE-Prowess)
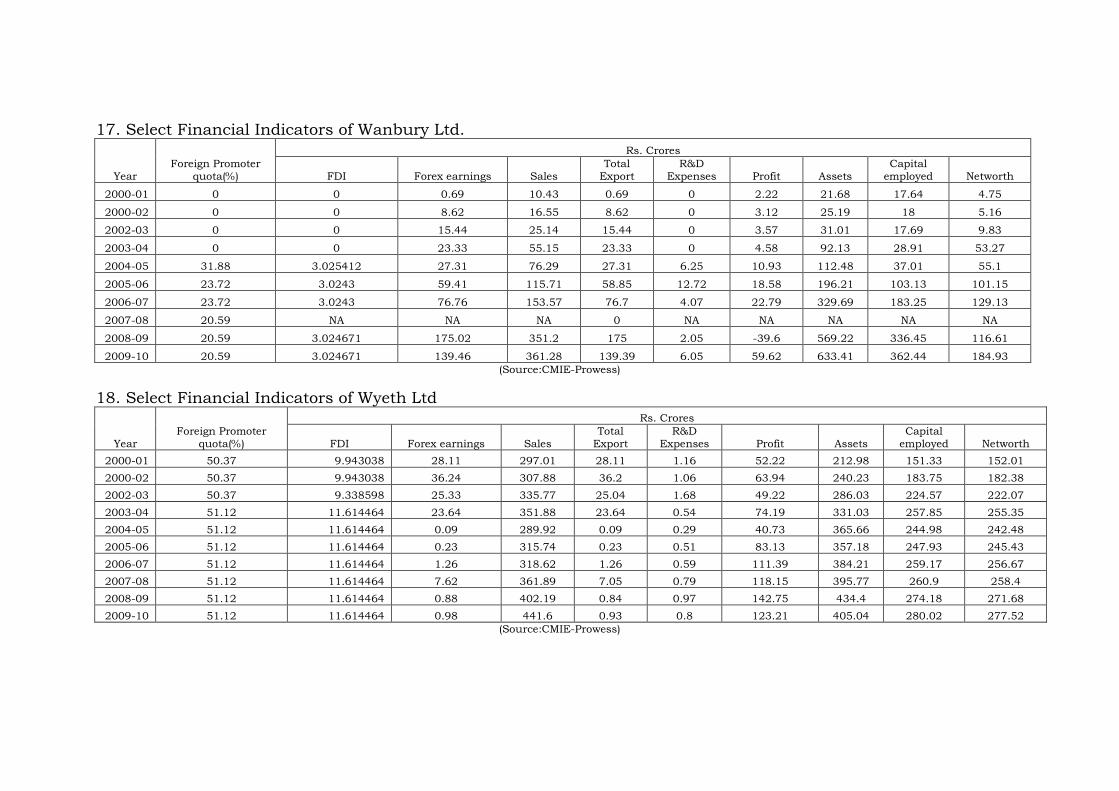
17. Select Financial Indicators of Wanbury Ltd.
Year Foreign Promoter
quota(%)
Rs. Crores
FDI Forex earnings Sales Total
Export R&D
Expenses Profit Assets Capital
employed Networth
2000-01 0 0 0.69 10.43 0.69 0 2.22 21.68 17.64 4.75
2000-02 0 0 8.62 16.55 8.62 0 3.12 25.19 18 5.16
2002-03 0 0 15.44 25.14 15.44 0 3.57 31.01 17.69 9.83
2003-04 0 0 23.33 55.15 23.33 0 4.58 92.13 28.91 53.27
2004-05 31.88 3.025412 27.31 76.29 27.31 6.25 10.93 112.48 37.01 55.1
2005-06 23.72 3.0243 59.41 115.71 58.85 12.72 18.58 196.21 103.13 101.15
2006-07 23.72 3.0243 76.76 153.57 76.7 4.07 22.79 329.69 183.25 129.13
2007-08 20.59 NA NA NA 0 NA NA NA NA NA
2008-09 20.59 3.024671 175.02 351.2 175 2.05 -39.6 569.22 336.45 116.61
2009-10 20.59 3.024671 139.46 361.28 139.39 6.05 59.62 633.41 362.44 184.93 (Source:CMIE-Prowess)
18. Select Financial Indicators of Wyeth Ltd
Year Foreign Promoter
quota(%)
Rs. Crores
FDI Forex earnings Sales Total
Export R&D
Expenses Profit Assets Capital
employed Networth
2000-01 50.37 9.943038 28.11 297.01 28.11 1.16 52.22 212.98 151.33 152.01
2000-02 50.37 9.943038 36.24 307.88 36.2 1.06 63.94 240.23 183.75 182.38
2002-03 50.37 9.338598 25.33 335.77 25.04 1.68 49.22 286.03 224.57 222.07
2003-04 51.12 11.614464 23.64 351.88 23.64 0.54 74.19 331.03 257.85 255.35
2004-05 51.12 11.614464 0.09 289.92 0.09 0.29 40.73 365.66 244.98 242.48
2005-06 51.12 11.614464 0.23 315.74 0.23 0.51 83.13 357.18 247.93 245.43
2006-07 51.12 11.614464 1.26 318.62 1.26 0.59 111.39 384.21 259.17 256.67
2007-08 51.12 11.614464 7.62 361.89 7.05 0.79 118.15 395.77 260.9 258.4
2008-09 51.12 11.614464 0.88 402.19 0.84 0.97 142.75 434.4 274.18 271.68
2009-10 51.12 11.614464 0.98 441.6 0.93 0.8 123.21 405.04 280.02 277.52 (Source:CMIE-Prowess)

19. Trends of FDI Inflows in Select Indian Pharmaceutical firms
FDI Inflows (Rs.Crores) S.No
Name of the company 2001 2002 2003 2004 2005 2006 2007 2008 2009 2010 1.
Abbott India Ltd. 8.262 9.428 9.995 9.428 9.428 9.428 9.953 9.426 9.431 9.431 2.
Astrazeneca Pharma India Ltd. 2.575 2.825 4.581 4.581 4.5 4.5 4.5 4.5 4.5 4.5 3.
Aventis Pharma Ltd. 11.538 11.538 11.538 11.538 11.538 11.538 11.543 11.543 11.543 13.910 4.
Biocon Ltd. 0 0 0 0 12.45 10.235 10.235 10.235 20.47 20.47 5.
Fresenius Kabi Oncology Ltd. 0 0 0 0 0 0 0.005 0.005 14.238 14.238 6.
Fulford (India) Ltd. 1.28 1.28 1.28 1.28 1.28 1.28 1.980 2.103 2.103 2.103 7.
Glaxosmithkline Pharmaceuticals Ltd. 30.488 36.369 36.369 36.369 42.918 42.917 42.917 42.917 42.917 42.917 8.
Kerala Ayurveda Ltd. 4.336 4.336 4.336 5.640 0.000 5.640 0.000 5.640 5.642 5.642 9.
K D L Biotech Ltd. 0.157 0.419 0.419 0.419 0.419 3.995 6.497 6.497 6.497 6.497 10.
Matrix Laboratories Ltd. 0 0 0 0 11.722 11.717 22.002 22.009 23.539 0 11.
Merck Ltd. 8.599 8.599 8.599 8.599 8.599 8.599 8.599 8.599 8.599 8.599 12.
Novartis India Ltd. 8.148 8.139 8.139 8.139 8.139 8.139 8.139 8.139 8.139 12.212 13.
Pfizer Ltd. 9.372 9.376 9.376 11.52 11.52 12.303 12.303 12.303 12.303 21.112 14.
Ranbaxy Laboratories Ltd. 0 0 0 0 0 0 0 0 134.353 134.324 15.
Sandu Pharmaceuticals Ltd. 1.914 1.914 1.914 1.914 1.914 1.914 0 0 0 1.9137 16.
Solvay Pharma India Ltd. 0 3.229 3.229 3.229 3.229 3.477 3.477 3.477 3.477 3.477 17.
Wanbury Ltd. 0 0 0 0 3.025 3.024 3.024 NA 3.0247 3.0247 18.
Wyeth Ltd 9.943 9.943 9.339 11.614 11.614 11.614 11.614 11.614 11.614 11.614 (Source:CMIE-Prowess)
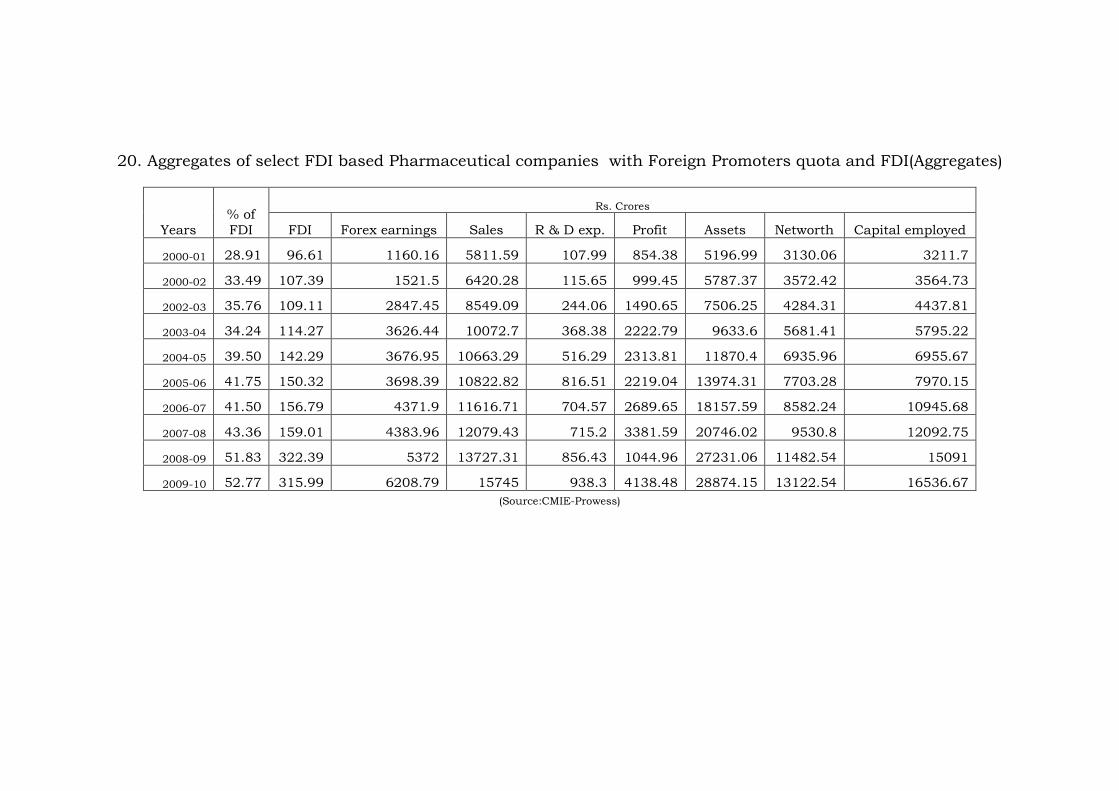
20. Aggregates of select FDI based Pharmaceutical companies with Foreign Promoters quota and FDI(Aggregates)
(Source:CMIE-Prowess)
Years % of FDI
Rs. Crores
FDI Forex earnings Sales R & D exp. Profit Assets Networth Capital employed
2000-01 28.91 96.61 1160.16 5811.59 107.99 854.38 5196.99 3130.06 3211.7
2000-02 33.49 107.39 1521.5 6420.28 115.65 999.45 5787.37 3572.42 3564.73
2002-03 35.76 109.11 2847.45 8549.09 244.06 1490.65 7506.25 4284.31 4437.81
2003-04 34.24 114.27 3626.44 10072.7 368.38 2222.79 9633.6 5681.41 5795.22
2004-05 39.50 142.29 3676.95 10663.29 516.29 2313.81 11870.4 6935.96 6955.67
2005-06 41.75 150.32 3698.39 10822.82 816.51 2219.04 13974.31 7703.28 7970.15
2006-07 41.50 156.79 4371.9 11616.71 704.57 2689.65 18157.59 8582.24 10945.68
2007-08 43.36 159.01 4383.96 12079.43 715.2 3381.59 20746.02 9530.8 12092.75
2008-09 51.83 322.39 5372 13727.31 856.43 1044.96 27231.06 11482.54 15091
2009-10 52.77 315.99 6208.79 15745 938.3 4138.48 28874.15 13122.54 16536.67

21. Select Financial Indictors of Non-FDI based Companies ( Aggregates)
(Source:CMIE-Prowess)
Year
Rs. Crores
Sales R & D expenses Profit Net worth Total assets Net fixed assets Net working capital
2000-01 21378.59 501.77 3777.46 11160.08 24328.93 8952.17 3542.14
2000-02 24333.08 642.29 4627.18 12769.05 27721.82 9879.78 4960.12
2002-03 28340.33 859.88 5474.19 14727.79 32817.53 11456.1 5920.68
2003-04 32679.87 1335.14 6566.74 17501.81 38542.88 13207.4 5888.72
2004-05 34514.51 1888.43 6922.1 20546.04 47677.59 15980.45 7815.85
2005-06 39751.15 2423.81 8316.78 25086.7 58129.42 19009.7 9337.25
2006-07 48517.02 2737.43 11906.28 34393.57 71940.06 22486.95 14764.99
2007-08 55758.68 3096.56 13699.4 42170.08 86359.88 26512.11 13726.45
2008-09 63886.51 3442.96 10949.61 48333.02 107088.4 30852.73 14464.48
2009-10 71179.84 3598.05 17332.26 59542.71 118624.1 34215.45 19565.41

22. Number of FDI-based Companies with Foreign Promoters Quota
(Source:CMIE-Prowess)
Number of FDI-based Companies with Foreign Promoters Quota
Foreign promoter (%)
2001 % of total
2002 % of total
2003 % of total
2004 % of total
2005 % of total
2006 % of total
2007 % of total
2008 % of total
2009 % of total
2010 % of total
0-20
7
38.9 6
33.3 6 33.3 6 33.3 3 16.7 2 11.1 4 22.2 3 16.7 1 5.5 1 5.5
21-40
4
22.2 4
22.2 4 22.2 4 22.2 8 44.4 6 33.3 2 11.1 3 16.7 3 16.7 4 22.2
41-60
7
38.9 7
38.9 5 27.9 5 27.9 4 22.2 7 38.9 7 38.9 7 38.9 7 38.9 4 22.2
61-80
-
- 1
5.5 2 11.1 2 11.1 2 11.1 2 11.1 4 22.2 4 22.2 5 27.8 7 38.9
81-100 - - -
- 1 5.5 1 5.5 1 5.5 1 5.5 1 5.5 1 5.5 2 11.1 2 11.1
Total no. of companies
18 100 18 100 18 100 18 100 18 100 18 100 18 100 18 100 18 100 18 100

ANNEXURE-III
FDI Policy 2006
Sector specific policy for FDI : In the following sectors/activities, FDI upto
the limit indicated below is allowed subject to other conditions as indicated:
S.No. Sector/Activity FDI Cap /
Equity
Entry
Route
Other conditions Relevant
Press Note
issued by
DIPP, GOI
1. Airports-
a. Greenfield projects 100% Automatic Subject to sectoral regulations notified by
Ministry of Civil Aviation www.civilaviation.nic. in
PN 4 / 2006
b. Existing projects 100% FIPB
Beyond 74%
Subject to sectoral regulations notified by
Ministry of Civil Aviation
www.civilaviation.nic. in
PN 4 / 2006
2. Air Transport
Services
49%- FDI;
100%for NRI
investment
Automatic Subject to no direct or indirect participation by
foreign airlines. Government of India Gazette
Notification dated 2.11.2004 issued by Ministry of
Civil Aviation www.civilaviation.nic. in
PN 4 / 2006
3. Alcohol-
Distillation &
Brewing
100%
Automatic
Subject to license by appropriate
authority
PN 4 / 2006
4. Asse t
Reconstruction
Companies
49%
(only
FDI)
FIPB Where any individual investment exceeds 10% of
the equity, provisions of Section 3(3)(f) of
Securitization and Reconstruction of Financial
Assets and Enforcement of Security Interest
Act, 2002 should be complied with.
www.finmin.nic.in
5. Atomic Minerals 74% FIPB Subject to guidelines issued by Department of
Atomic Energy vide Resolution No. 8/1(1)/97-
PSU/1422 dated 6.10.98.
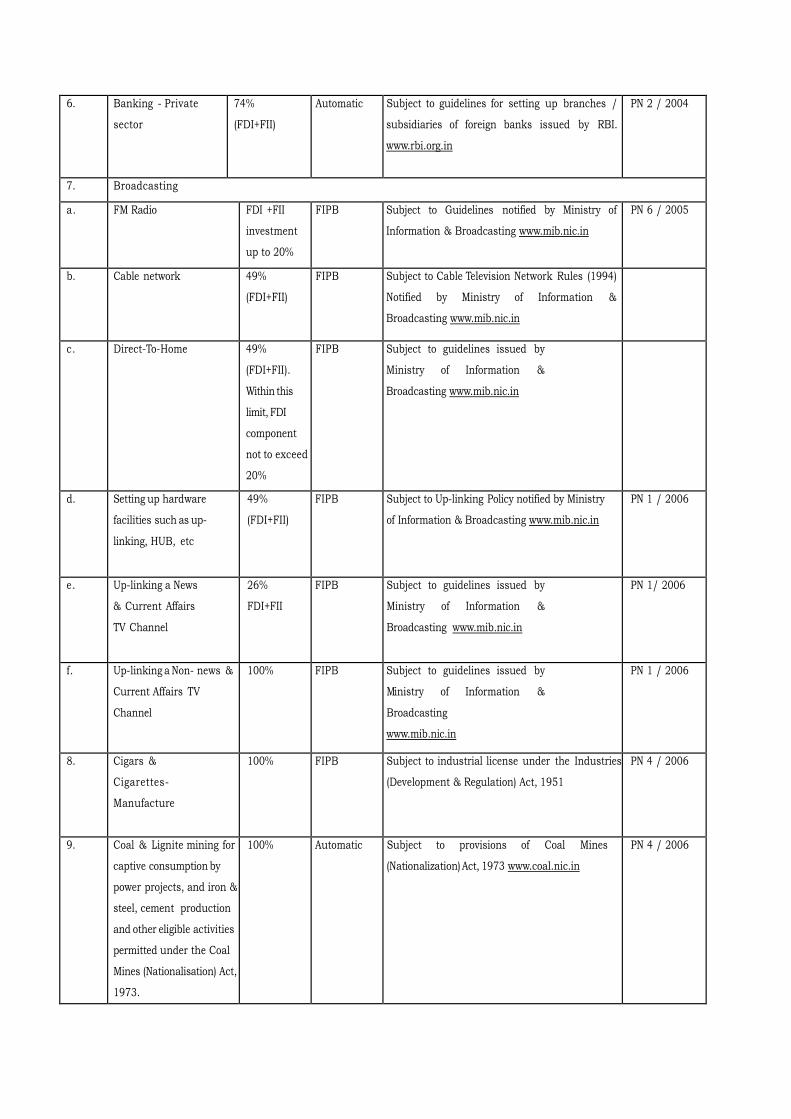
6. Banking - Private
sector
74%
(FDI+FII)
Automatic Subject to guidelines for setting up branches /
subsidiaries of foreign banks issued by RBI.
www.rbi.org.in
PN 2 / 2004
7. Broadcasting
a. FM Radio FDI +FII
investment
up to 20%
FIPB Subject to Guidelines notified by Ministry of
Information & Broadcasting www.mib.nic.in
PN 6 / 2005
b. Cable network 49%
(FDI+FII)
FIPB Subject to Cable Television Network Rules (1994)
Notified by Ministry of Information &
Broadcasting www.mib.nic.in
c. Direct-To-Home 49%
(FDI+FII).
Within this
limit, FDI
component
not to exceed
20%
FIPB Subject to guidelines issued by
Ministry of Information &
Broadcasting www.mib.nic.in
d. Setting up hardware
facilities such as up-
linking, HUB, etc
49%
(FDI+FII)
FIPB Subject to Up-linking Policy notified by Ministry
of Information & Broadcasting www.mib.nic.in
PN 1 / 2006
e. Up-linking a News
& Current Affairs
TV Channel
26%
FDI+FII
FIPB Subject to guidelines issued by
Ministry of Information &
Broadcasting www.mib.nic.in
PN 1/ 2006
f. Up-linking a Non- news &
Current Affairs TV
Channel
100% FIPB Subject to guidelines issued by
Ministry of Information &
Broadcasting
www.mib.nic.in
PN 1 / 2006
8. Cigars &
Cigarettes-
Manufacture
100% FIPB Subject to industrial license under the Industries
(Development & Regulation) Act, 1951
PN 4 / 2006
9. Coal & Lignite mining for
captive consumption by
power projects, and iron &
steel, cement production
and other eligible activities
permitted under the Coal
Mines (Nationalisation) Act,
1973.
100% Automatic Subject to provisions of Coal Mines
(Nationalization) Act, 1973 www.coal.nic.in
PN 4 / 2006
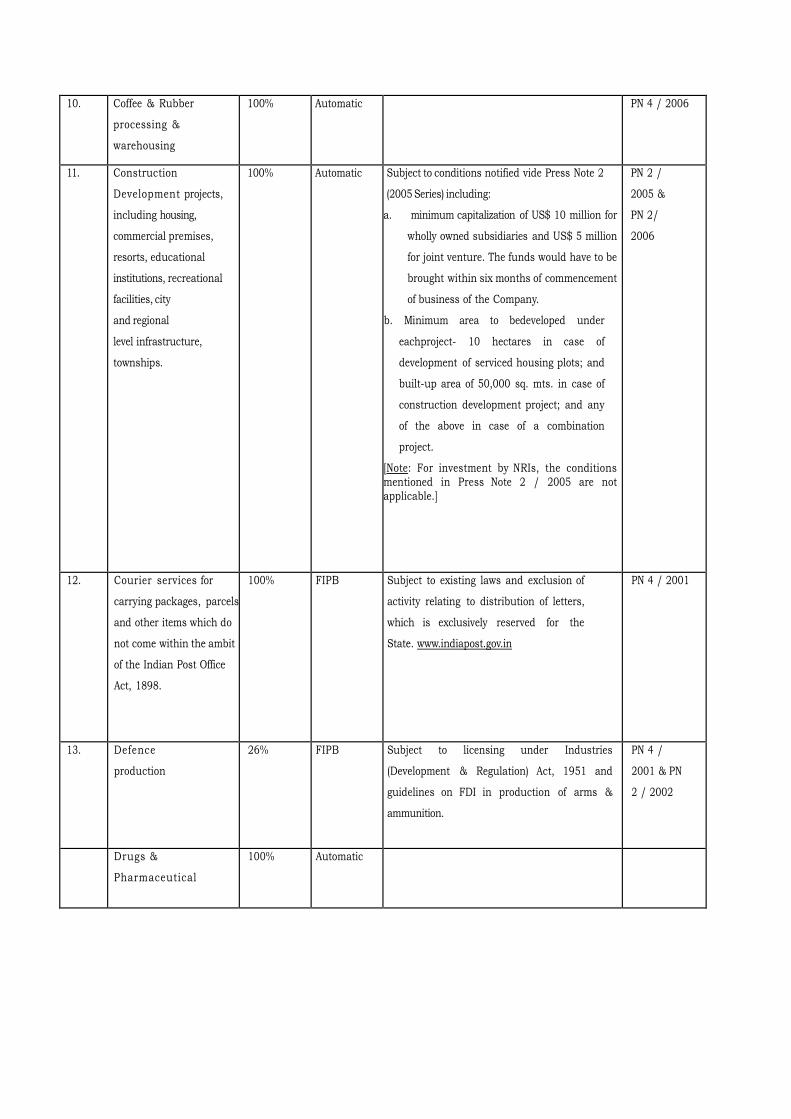
10. Coffee & Rubber
processing &
warehousing
100% Automatic PN 4 / 2006
11. Construction
Development projects,
including housing,
commercial premises,
resorts, educational
institutions, recreational
facilities, city
and regional
level infrastructure,
townships.
100% Automatic Subject to conditions notified vide Press Note 2
(2005 Series) including:
a. minimum capitalization of US$ 10 million for
wholly owned subsidiaries and US$ 5 million
for joint venture. The funds would have to be
brought within six months of commencement
of business of the Company.
b. Minimum area to bedeveloped under
eachproject- 10 hectares in case of
development of serviced housing plots; and
built-up area of 50,000 sq. mts. in case of
construction development project; and any
of the above in case of a combination
project.
[Note: For investment by NRIs, the conditions mentioned in Press Note 2 / 2005 are not applicable.]
PN 2 /
2005 &
PN 2/
2006
12. Courier services for
carrying packages, parcels
and other items which do
not come within the ambit
of the Indian Post Office
Act, 1898.
100% FIPB Subject to existing laws and exclusion of
activity relating to distribution of letters,
which is exclusively reserved for the
State. www.indiapost.gov.in
PN 4 / 2001
13. Defence
production
26% FIPB Subject to licensing under Industries
(Development & Regulation) Act, 1951 and
guidelines on FDI in production of arms &
ammunition.
PN 4 /
2001 & PN
2 / 2002
Drugs &
Pharmaceutical
100% Automatic

14. Floriculture, Horticulture,
Development of Seeds,
Animal Husbandry,
Pisciculture, aqua-
culture, cultivation of
vegetables,
mushrooms, under
controlled conditions and
services related to agro
and allied sectors.
100% Automatic PN 4 / 2006
15. Hazardous chemicals,
viz., hydrocyanic acid and
its derivatives; phosgene
and its derivatives; and
isocyanates and
diisocyantes of
hydrocarbon.
100% Automatic Subject to industrial license under
the Industries (Development & Regulation)
Act, 1951 and other sectoral regulations.
PN 4 / 2006
16. Industrial
explosives -
Manufacture
100% Automatic Subject to industrial license under Industries
(Development & Regulation) Act, 1951 and
regulations under Explosives Act, 1898
PN 4 / 2006
17. Insurance 26% Automatic Subject to licensing by the Insurance
Regulatory & Development Authority
www.irda.nic.in
PN 10 / 2000
18. Investing companies in
infrastructure/services
sector (except telecom
sector)
49% FIPB Foreign investment in an investing co. will not be
counted towards sectoral cap in
infrastructure/services sector provided the
investment is up to 49% and the management
of the company is in Indian hands
PN 2 /
2000 & PN
5 / 2005

19. Mining covering
exploration and mining of
diamonds
& precious stones; gold,
silver and minerals.
100% Automatic Subject to Mines & Minerals (Dev. &
Regulation) Act, 1957
Press Note 18 (1998) and Press Note 1 (2005)
are not applicable for setting up 100% owned
subsidiaries in so far as the mining sector is
concerned, subject to a declaration from the
applicant that he has no existing joint venture
for the same area and /or the particular
mineral.
PN 2 / 2000,
PN 3 /
2005, & PN
4 / 2006
20. Non Banking Finance Companies- approved activities
i
ii)
iii)
iv)
v)
vi)
vii)
viii)
ix)
x)
xi)
xii)
xiii)
xiv)
xv)
xvi)
xvii)
xviii)
xix)
Merchant banking
Underwriting
Portfolio Management
Services
Investment Advisory
Services
Financial Consultancy
Stock Broking
A ss e t Management
Venture Capital
Custodial Services
Factoring
Credit
referAgencies
Creditr ating
Agencies
Leasing&Finance
Housing Finance
Forex Broking
Credit card business
Money changing
business
Micro credit
Rural credit.
100% Automatic Subject to:
a. minimum capitalization norms for fund based
NBFCs - US$ 0.5 million to be brought
upfront for FDI up to 51%; US$ 5 million to
be brought upfront for FDI above 51% and
up to 75%; and US$ 50 million out of which
US$ 7.5 million to be brought upfront and
the balance in 24 months forFDI beyond 75%
and upto 100%.
b. minimum capitalization norms for non-fund
based NBFC activities-US$ 0.5 million.
c. foreign investors can set up 100% operating
subsidiaries without the condition to
disinvest a minimum of 25% of its equity to
Indianentities subject to bringing inUS$ 50
million without any restriction on number of
operating subsidiaries without bringing
additional capital.
d. joint venture operating
NBFC’s that have 75% or less than 75%
foreign investment will also be allowed to set
up subsidiaries for undertaking other NBFC
activities subject to the subsidiaries also
complying with the applicable minimum
capital inflow.
e. compliance with the
guidelines of the RBI.
PN 2 / 2000,
PN 6 /
2000, & PN
2 / 2001
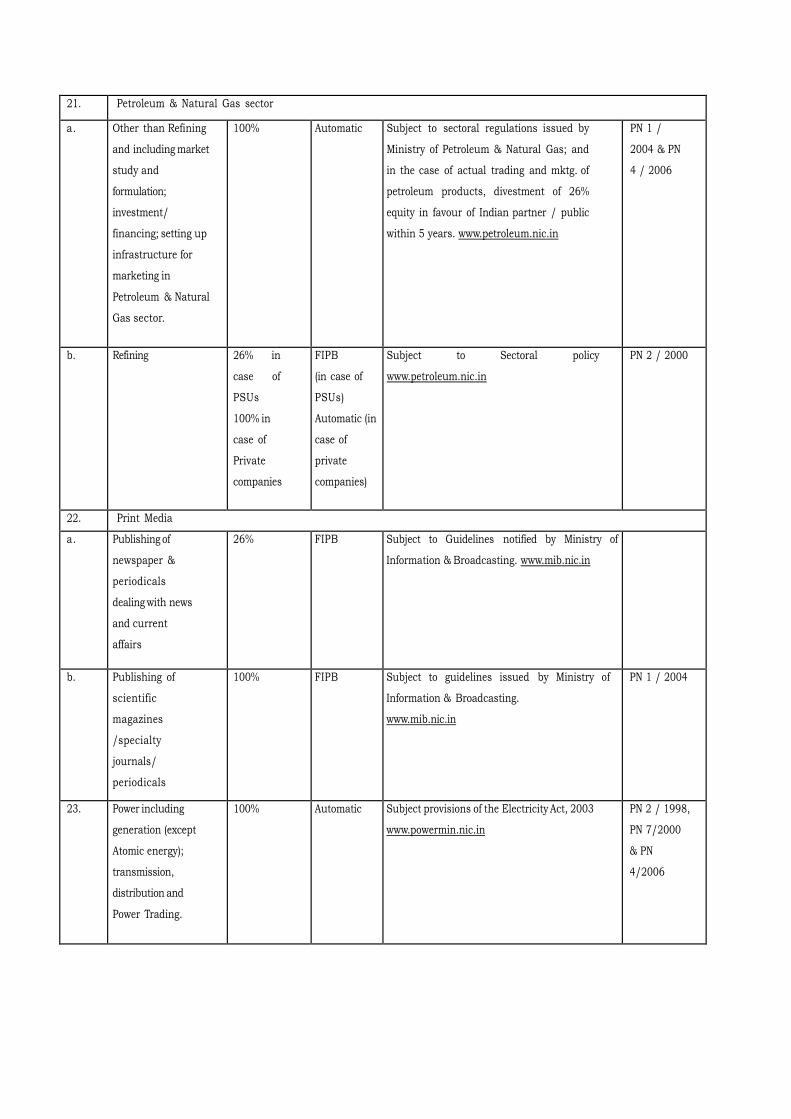
21. Petroleum & Natural Gas sector
a. Other than Refining
and including market
study and
formulation;
investment/
financing; setting up
infrastructure for
marketing in
Petroleum & Natural
Gas sector.
100% Automatic Subject to sectoral regulations issued by
Ministry of Petroleum & Natural Gas; and
in the case of actual trading and mktg. of
petroleum products, divestment of 26%
equity in favour of Indian partner / public
within 5 years. www.petroleum.nic.in
PN 1 /
2004 & PN
4 / 2006
b. Refining 26% in
case of
PSUs
100% in
case of
Private
companies
FIPB
(in case of
PSUs)
Automatic (in
case of
private
companies)
Subject to Sectoral policy
www.petroleum.nic.in
PN 2 / 2000
22. Print Media
a. Publishing of
newspaper &
periodicals
dealing with news
and current
affairs
26% FIPB Subject to Guidelines notified by Ministry of
Information & Broadcasting. www.mib.nic.in
b. Publishing of
scientific
magazines
/specialty
journals/
periodicals
100% FIPB Subject to guidelines issued by Ministry of
Information & Broadcasting.
www.mib.nic.in
PN 1 / 2004
23. Power including
generation (except
Atomic energy);
transmission,
distribution and
Power Trading.
100% Automatic Subject provisions of the Electricity Act, 2003
www.powermin.nic.in
PN 2 / 1998,
PN 7/2000
& PN
4/2006

24. Tea Sector,
including tea
plantation
100% FIPB Subject to divestment of 26% equity in favour of
Indian partner/Indian public within 5 years and
prior approval of State
Government for change in land use.
PN 6 / 2002
25. Telecommunications
a. Basic and cellular,
Unified Access
Services, National/
International
Long Distance, V-
Sat, Public Mobile
Radio Trunked
Services (PMRTS),
Global Mobile
Personal
Communications
Services (GMPCS)
and other value
added telecom
services
74% Automatic
up to 49%.
FIPB
beyond
49%.
Subject to guidelines notified in the PN 5 (2005
Series).
PN 5 / 2005
b. ISP with gateways,
radio- paging, end-to-
end bandwidth.
74% Automatic
up to 49%.
FIPB
beyond
49%.
Subject to licensing and security requirements
notified by the Department of
Telecommunications. www.dotindia.com
PN 4 / 2001
c. ISP without gateway,
infrastructure
provider providing
dark fibre, electronic
mail and voice mail
100% Automatic
up to 49%.
FIPB
beyond
49%.
Subject to the condition that such companies
shall divest 26% of their equity
in favour of Indian public in
5 years, if these companies are listed in other
parts of the world. Also subject to licensing and
security requirements, where required.
www.dotindia.com
PN 9 / 2000
d. Manufacture of
telecom equipments
100% Automatic Subject to sectoral requirements.
www.dotindia.com
PN 2 / 2000
26. Trading

a.
b.
c.
d.
e.
Wholesale/cash
& carry trading
Trading for
exports
Trading of items
sourced from small
scale sector
Test marketing of
such items for
which a co. has
approval for
Manufacture
Single Brand
product retailing
100%
100%
100%
100%
51%
Automatic
Automatic
FIPB
FIPB
FIPB
Subject to guidelines for
FDI in trading issued by Department of
Industrial Policy & Promotion vide Press Note 3
(2006 Series).
PN 4 / 2006
27. Satellites -
Establishment and
operation
74% FIPB Subject to Sectoral guidelines issued by
Department of Space/ISRO www.isro.org
28. Special Economic
Zones and Free
Trade
Warehousing
Zones covering
setting up of
these Zones and
setting up units
in the Zones
100% Automatic Subject to Special Economic Zones Act, 2005
and the Foreign Trade Policy.
www.sezindia.nic.in
PN 9 /
2000,
PN 2/2006
PN 4 /
2006

ANNEXURE IV
RESEARCH CONTRIBUTION
Name of the Scholar : Syed Khaja Safiuddin
Registration No : 0703PH1325
A. List of Papers published in Journals:
1. Safiuddin S.K. and Murthy S.S., “FDI in the Post-liberalization period – A
Study with special reference to Pharmaceutical Sector”, Advances in
Management, Vol. 4 (12) December 2011,Pp. 46-52 (ISSN No. 0974-2611)
(Published)
2. Safiuddin S.K. and Murthy S.S., “Financial Performance of FDI and Non-FDI
Companies in the Indian Pharmaceutical Sector - A Comparative Study”,
International Review of Business and Finance, Vol. 3 No. 2, July -Dec 2011,
Pp. 133-150 (ISSN No. 0976-5891) (Published)
3. Safiuddin S.K., “ Is Micro finance a Profit maximizing industry or a Social
Business- Some evidences from Recent literature survey”, Indian Journal of
Commerce & Management Studies, Vol. II Issue I, Feb-Mar 2011, Pp. 138-
145. (ISSN No. 2229-5674) (Published)
4. Safiuddin S.K., “Tourism Industry In Andhra Pradesh And Its Financial
Performance- A Study of APTDC”, Asia Pacific Business Review, Vol. VI No.
IV, Oct-Dec 2010, Pp. 154 – 166 (ISSN No. 0973-2470) (Published)
5. Safiuddin S.K. and Murthy S.S., “Foreign Direct Investment in Indian
Industry- A Study”, Indian Journal of International Business & Finance, Vol.
1 No.1-2, Jan- Dec 2011, Pp. 9-17 (ISSN No. 2249-4200) (Published)
6. Safiuddin S.K., “Foreign Direct Investment in India- Opportunities and
Benefits”, Global Journal of Finance & Management, Vol. II Issue II, July-Dec
2010, Pp. 245-259 (ISSN No. 0975 -6477) (Published)
7. Safiuddin S.K., “Hindustan mein Beruni Rast Sarmayakari”, Yojana (Urdu)
,Issue.12, Dec 2010 , Pp. 59-60 (ISSN No. 0971-8338) (Published)
8. Safiuddin S.K.,“Capital Exporting Countries and Foreign Investment in
India”, Orient Journal of Law & Social Sciences, Vol. IX Issue IV, August
2010, Pp. 72-77 (ISSN No.0973-7480) (Published)
B. List of Papers presented/accepted at conferences and
seminars:
1. Safiuddin S.K. and Murthy S.S., “Foreign Direct Investment Inflows In India:
Capital Exporting Countries Or General Public, Who Is At A Benefit?”, Seventh
International Seminar on Financial Markets: Issues and Challenges-(FIM IC-
2012), Department of Commerce and Financial Studies, Bharathidasan
University, Tiruchirappalli, 07th and 08th , Jan 2012. (Accepted)
2. Safiuddin S.K. and Murthy S.S., “ FDI in Education in India- Options and
Prospects”, National Seminar on "“Management Education in India –
Opportunities and Challenges(Focus on Rural Institutions), Telangana
University, 21st and 22nd October, 2011. (Presented)
3. Safiuddin S.K. and Murthy S.S., “ FDI in India and Indian Pharmaceutical
Industry”, International Conference on "Emergence of India as Global
Economic Superpower: Fiction or Future?, Department of Economics
(Postgraduate & Research Centre),Poona College Of Arts, Science & Commerce
Pune, 27th April, 2011. (Presented)
4. Safiuddin S.K., “ Microfinance in India- Reality or Myth”, International
Conference on "Emergence of India as Global Economic Superpower: Fiction

or Future?, Department of Economics (Postgraduate & Research
Centre),Poona College Of Arts, Science & Commerce Pune, 27th April, 2011.
(Presented)
5. Safiuddin S.K., “Foreign Direct Investment in India- A Sector-wise study”,
International Conference on International Trade and Commerce conducted,
Department of Commerce, Osmania University, 9th -11th January 2010.
(Presented)
6. Safiuddin S.K. and Murthy S.S., “FDI in India – A Study”, two-day
International Seminar on Recent Trends in Capital Markets and Financial
Innovations, Department of Commerce and Financial Studies, Bharathidasan
University, Tiruchirappalli, 9th -10th January, 2009. (Presented)