skills for growth mark farrar, chief executive, citb-constructionskills october 2012
TRANSCRIPT

Skills for GrowthMark Farrar, Chief Executive, CITB-ConstructionSkillsOctober 2012
What we do
• Labour market & other research
• Occupational standards
• Advice to companies
• National Construction College
• Assessment & testing
• Careers advice/apprentice recruitment
• Industry funded grant scheme

Who we work with - youWho we work with
Construction industry structure
2011
Private housing
Infrastructure
Public Non-Housing
Public housing
Industrial
Non-Housing R&M
Housing R&M
Commercial

Job losses
• 45,000 jobs go this year
• Public sector falls off a cliff -25% public housing -24% public non-housing
• A “lost generation” for construction?
16-19 year olds down 52% on 2008

Reductions in Apprenticeships
2006/07 2007/08 2008/09 2009/10 2010/11 2011/120
2,000
4,000
6,000
8,000
10,000
12,000
14,000
16,000
England
Scotland
Wales
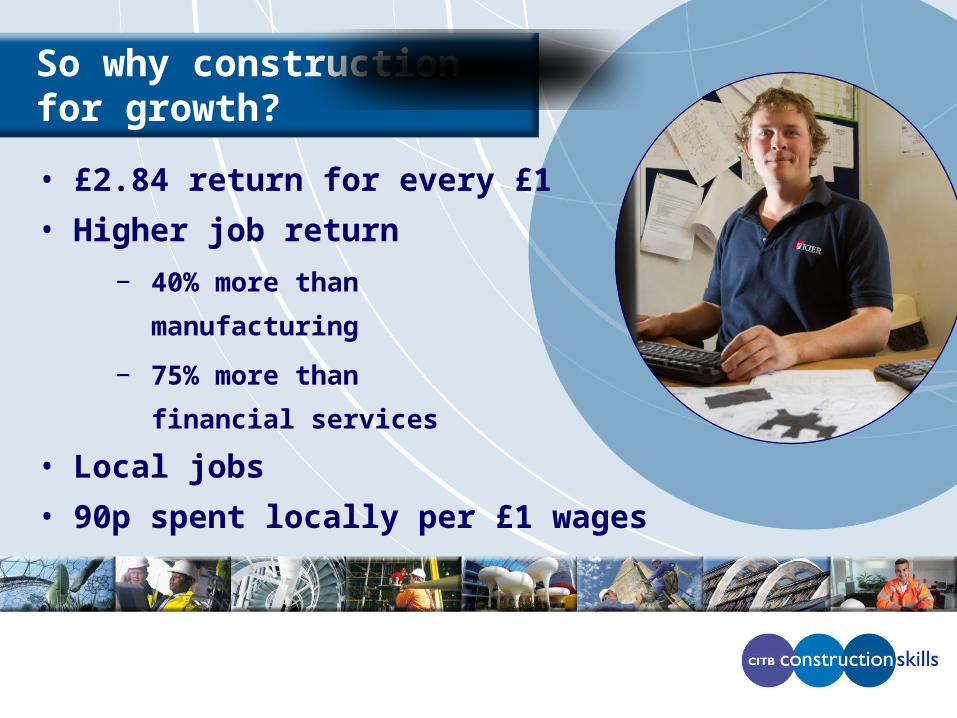
So why construction for growth?
• £2.84 return for every £1
• Higher job return
− 40% more than
manufacturing
− 75% more than
financial services
• Local jobs
• 90p spent locally per £1 wages

4,500
2,100
2,600
3,500
5,7004,300
7,200
3,700
5,000
1,200
1,8004,500
Size matters
Number of new recruits required annually

Investing in jobs – £1bn gives
• Industrial c. 11,000
• Infrastructure c. 15,000
• Public Housing c.18,000
• Housing R&M c. 32,000

• Eight sites
• £1.5bn per year output
• 17,000 FTE peak (2018)
• £100 million training
• NESA – skills alliance
New Nuclear Build
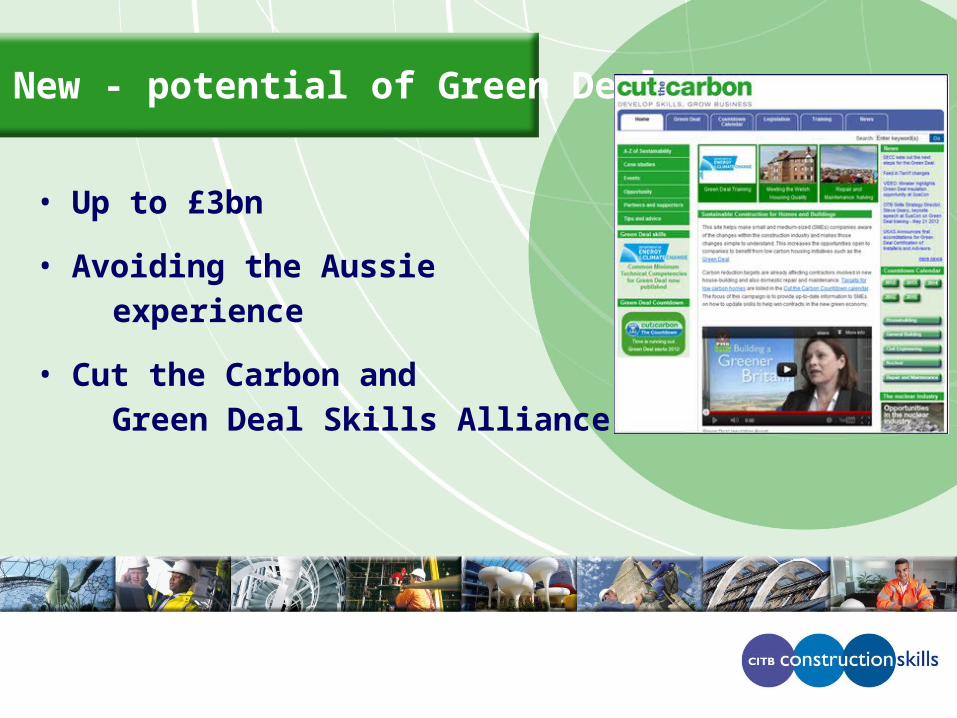
• Up to £3bn
• Avoiding the Aussie
experience
• Cut the Carbon and
Green Deal Skills Alliance
New - potential of Green Deal
• People – not just software• Training needed – supply
chains
• Industry/Government
leadership needed
Building Information Modelling
• LEP engagement
• Public procurement
• Our ‘client-based’ approach
• University Technical Colleges
Supporting local growth and jobs today

So,
• The industry can create
significant growth & jobs
• Opportunity to embed new
approaches into the national
skills system
• Government & Industry working
together can give more young people a chance