skilled migrant women and employment outcomes in australia
TRANSCRIPT

Skilled migrant women and employment outcomes in Australia
Negar Faaliyat
David Peetz
Susan Ressia

Contents
Background
Methodology
Research findings
Conclusion

Background
Over the past two decades, immigration policy in Australia emphasised attracting skilled professionals or students, family or regional sponsored applicants with the possibility to create potential skilled migrants (Akbari et al., 2014)
Adapted a points system to select primary skilled migrants based on their age, English ability, qualification, skilled occupation, outstanding talents or business skills (Home Affairs, 2020)
Shifts toward economic selection without considering migrants’ ethnicity and gender

Background
Past research…
Change to immigration policy has resulted in higher employment rates and earlier job finding for skilled migrants (To et al., 2017)
however, NESBs skilled migrants experience barriers to participate fully in the Australian labour market (Rejendran et al., 2020)
The gender gap has persisted over time despite anti-discrimination regulation, affirmative action and organisational support for employment equity for women (Peetz & Murray, 2017)
female immigrants in the receiving country’s labour market are ‘double disadvantaged’ (Rebhun, 2008)
female skilled migrants from NESB countries experienced by even greater disadvantages (Ressia et al., 2017)

Research question: To what extent labour market outcomes of skilled migrants are affected by
their ethnicity and/or gender ?

Data source
Data used for this study is from Australian Census and Migrants Integrated Dataset (ACMID) 2011 and 2016
Australian census of population and housing from the Australian Bureau of Statistics (ABS), and
permanent migrant settlement data from the Department of Social Services (DSS) (ABS, 2018)
Access to data was via TableBuilder : an online tool facilitated by the ABS to access Microdata and create tables
containing information about the variables that were considered for this research

Age
Qualification
English language ability
Skilled Occupation
EMPLOYER SPONSORED CATEGORY
BUSINESS INNOVATION AND INVESTMENT PROGRAMM
GENERAL SKILLED MIGRATION (GSM)
DISTINGUISHED TALENT
Explanatory variables

Employment outcomes of skilled primary applicants,
2011
Country of Birth of Person Employment Rate Unemployment Rate
Female Male Female Male
North-West Europe 90.1% 95.5% 1.6% 1.7%
Southern and Eastern Europe 85.2% 92.6% 3.5% 3.1%
Americas 87.1% 94.0% 3.7% 2.7%
Sub-Saharan Africa 89.8% 95.6% 2.5% 1.8%
Oceania and Antarctica 84.5% 92.9% 4.3% 2.9%
South-East Asia 83.6% 89.5% 4.4% 3.7%
Southern and Central Asia 80.5% 92.8% 5.7% 3.2%
North Africa and the Middle East 73.8% 84.6% 8.7% 7.2%
North-East Asia 72.0% 82.3% 7.3% 6.4%

Employment outcomes of skilled primary applicants,
2016
Country of Birth of Person Employment Rate Unemployment Rate
Female Male Female Male
North-West Europe 91.0% 94.1% 2.1% 2.8%
Southern and Eastern Europe 87.0% 92.6% 3.9% 3.6%
Americas 88.1% 93.3% 3.6% 3.2%
Sub-Saharan Africa 89.2% 92.6% 3.1% 3.8%
Oceania and Antarctica 81.3% 88.0% 4.3% 4.4%
South-East Asia 85.6% 90.2% 3.8% 4.0%
Southern and Central Asia 83.0% 93.5% 5.5% 3.7%
North Africa and the Middle East 77.5% 87.1% 9.6% 7.2%
North-East Asia 76.2% 86.5% 5.4% 5.5%

Age
Employment rates of Skilled Primary
Applicants aged 15-64, 2011
Country of Birth of Person
15-34 35-44 45-64
Female Male Female Male Female MaleNorth-West Europe 92.5% 96.8% 88.8% 96.5% 90.6% 93.5%
Southern and Eastern Europe
86.8% 95.5% 85.4% 93.3% 79.6% 88.8%
Americas 90.0% 94.1% 84.0% 95.1% 87.3% 92.3%Sub-Saharan Africa 90.5% 96.5% 88.3% 97.0% 91.6% 94.7%
Oceania and Antarctica
85.9% 93.8% 82.5% 93.5% 87.8% 90.8%
South-East Asia 84.6% 88.8% 84.3% 93.2% 79.0% 84.5%Southern and Central Asia
78.5% 92.8% 82.6% 93.1% 84.3% 91.5%
North Africa and the Middle East
75.0% 84.9% 72.7% 86.3% 71.7% 79.5%
North-East Asia 74.0% 80.2% 70.6% 87.3% 63.0% 79.5%

Age
Employment rates of Skilled Primary
Applicants aged 15-64, 2016
Country of Birth of Person
15-34 35-44 45-64
Female Male Female Male Female MaleNorth-West Europe 93.3% 95.8% 91.1% 96.6% 90.0% 92.4%
Southern and Eastern Europe
88.6% 94.2% 87.7% 94.2% 85.8% 89.2%
Americas 90.7% 94.7% 87.4% 95.0% 87.3% 90.4%Sub-Saharan Africa 88.6% 93.0% 89.6% 95.1% 90.1% 92.2%
Oceania and Antarctica
77.3% 85.5% 84.6% 91.0% 82.5% 86.9%
South-East Asia 89.0% 92.4% 84.4% 92.8% 81.4% 85.2%Southern and Central
Asia81.3% 93.9% 83.9% 93.9% 87.8% 90.3%
North Africa and the Middle East
80.1% 88.3% 76.0% 88.1% 78.3% 83.5%
North-East Asia 81.0% 87.2% 75.1% 89.7% 63.1% 80.0%

Age
• In both years, female migrants had lower employment rates (ER) compared to males (inall regions and for all age groups)
• In both years migrants in best group mainly have the highest ER compared to othergroups
• In both years migrants from the worst group had the lowest ER compared to othergroups
• In both years and in all age groups, mostly males from the worst group had lower ER tofemales in the best group
• In both years and in all age groups, skilled migrants from the Middle East and NorthAfrica (MENA) (the worst group) had the highest unemployment rates (unER) compared toother groups
• and female skilled migrants from MENA had the highest unER to all

Education
• Female migrants in all groups and in both years had higher proportion of degree qualifiedpeople with bachelor and above degrees compared to males from their regions
• Migrants from NW Europe (from best group), sub-Saharan Africa (from best group) and Oceania andAntarctica (from middle group) had the lowest proportion of non-school qualification holders(bachelor or higher) in both years and for both genders
• Migrants from America (from best group) and MENA (from worst group) had the highest proportionof non-school qualification holders (bachelor or higher) in both years and for both genders
In 2016, female migrants from MENA : 46.3% above bachelor44.3% bachelor9.3% below bachelor

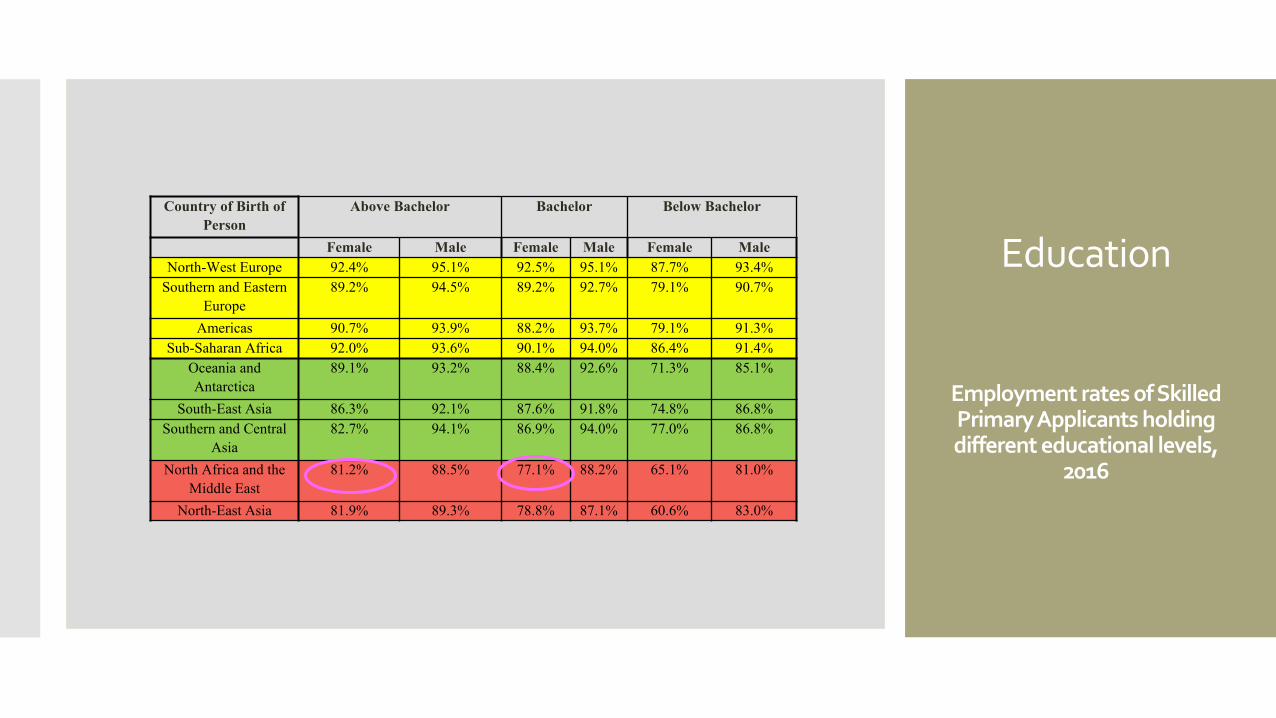
Education
Employment rates of Skilled Primary Applicants holding different educational levels,
2011
Country of Birth of Person
Above Bachelor Bachelor Below Bachelor
Female Male Female Male Female MaleNorth-West Europe 93.0% 96.9% 91.6% 96.7% 87.0% 95.0%
Southern and Eastern Europe
88.6% 93.9% 84.8% 93.4% 82.6% 91.3%
Americas 89.4% 95.3% 88.3% 94.5% 82.5% 90.1%Sub-Saharan Africa 91.3% 96.1% 90.0% 95.8% 89.0% 95.5%
Oceania and Antarctica
90.0% 94.2% 88.2% 95.3% 80.4% 91.9%
South-East Asia 85.7% 90.2% 85.9% 91.6% 71.95 85.7%Southern and Central
Asia80.2% 94.1% 83.1% 93.4% 76.9% 91.2%
North Africa and the Middle East
76.8% 86.1% 74.3% 86.9% 69.3% 79.4%
North-East Asia 80.1% 85.2% 74.2% 82.9% 56.7% 79.2%
Education
Employment rates of Skilled Primary Applicants holding different educational levels,
2016
Country of Birth of Person
Above Bachelor Bachelor Below Bachelor
Female Male Female Male Female MaleNorth-West Europe 92.4% 95.1% 92.5% 95.1% 87.7% 93.4%
Southern and Eastern Europe
89.2% 94.5% 89.2% 92.7% 79.1% 90.7%
Americas 90.7% 93.9% 88.2% 93.7% 79.1% 91.3%Sub-Saharan Africa 92.0% 93.6% 90.1% 94.0% 86.4% 91.4%
Oceania and Antarctica
89.1% 93.2% 88.4% 92.6% 71.3% 85.1%
South-East Asia 86.3% 92.1% 87.6% 91.8% 74.8% 86.8%Southern and Central
Asia82.7% 94.1% 86.9% 94.0% 77.0% 86.8%
North Africa and the Middle East
81.2% 88.5% 77.1% 88.2% 65.1% 81.0%
North-East Asia 81.9% 89.3% 78.8% 87.1% 60.6% 83.0%
Education
• In both years, female migrants had lower ER compared to males (in all groups and forall educational levels)
• However, in both years and in all educational levels, most males from the worst grouphad lower ER to females in the best group
• In both years migrants in best group mainly have the highest ER compared to othergroups
• Migrants from worst group had the lowest ER and the highest unER compared to othergroups in both years
• and the worst outcomes were for MENA migrants and specially females,regardless of their higher educational achievements
In both years and in every region, skilled migrants with education level below bachelor,experienced lowest ER compared to those with degree of bachelor and above

English language proficiency
• Regardless of migrants’ place of birth, most primary skilled migrants (above 97%) had avery good level of proficiency in speaking English (either being English speaker or proficientin speaking English) in 2011 and 2016 and for both genders (except for migrant from NEAsia)

English language proficiency
Employment rates of Skilled Primary Applicants with
different English language proficiency, 2011
Country of Birth of Person Speaks English only Proficient in spoken English
Female Male Female MaleNorth-West Europe 90.1% 95.7% 89.6% 94.9%
Southern and Eastern Europe
86.5% 95.4% 85.4% 92.9%
Americas 88.3% 93.0% 86.9% 95.2%Sub-Saharan Africa 88.0% 95.0% 91.6% 96.4%
Oceania and Antarctica 85.0% 94.1% 84.5% 93.0%
South-East Asia 83.6% 88.0% 84.2% 90.5%Southern and Central Asia 83.5% 90.8% 80.5% 93.2%
North Africa and the Middle East
81.1% 87.3% 74.0% 85.8%
North-East Asia 82.6% 81.5% 75.4% 83.6%

English language proficiency
Employment rates of Skilled Primary Applicants with
different English language proficiency, 2016
Country of Birth of Person
Speaks English only Proficient in spoken English
Female Male Female MaleNorth-West Europe 91.2% 94.1% 89.3% 94.3%
Southern and Eastern Europe
90.5% 91.1% 87.0% 93.2%
Americas 89.4% 91.8% 86.8% 94.5%Sub-Saharan Africa 87.7% 91.9% 90.6% 93.5%
Oceania and Antarctica 80.8% 87.8% 81.6% 88.9%South-East Asia 84.9% 88.8% 86.2% 90.9%
Southern and Central Asia
84.7% 90.6% 83.1% 93.7%
North Africa and the Middle East
85.4% 88.3% 77.3% 87.9%
North-East Asia 85.9% 86.2% 79.5% 88.5%

English language proficiency
• In both years, female migrants had lower ER compared to males (in all groups and forall educational levels)
• In both years, males from the worst group had lower ER to females in the best group
• In 2011, female migrants from the best group who speaks English only or proficient inspoken English had the highest ER to other groups, while migrants in the worst grouphad the lowest ER
• In 2016, female migrants from the best group who speaks English only or proficient inspoken English had the highest ER and those in middle group who speaks English onlyand in the worst group who are proficient in spoken English had the lowest ER

Conclusion/Discussion
Hierarchical order in skilled migrants’ LMO1. Best group2. Middle group3. Worst group
skilled migrants in worst group, with similar HC characteristics to other groups, experienced lower LMO
Female skilled migrants had lower ER compared to males from their regions
Improvement for female LMO in 2016 compared to 2011
In both years, males from the worst group mostly had lower ER to females in the best group for migrants in the worst group, the impact of their ethnicity/race is more than
their gender

Thank [email protected]