skilled for life: key findings from the survey of adult skills
TRANSCRIPT

MARCO PACCAGNELLA
Analyst, Directorate for Education and Skills
Skilled for Life? KEY FINDINGS FROM THE SURVEY OF ADULT SKILLS
1
London, 14th January 2015

Survey of Adult Skills in brief
in literacy, numeracy and problem solving in technology-rich environments.
166 thousand adults… Representing 724 million 16-65 year-olds in 24* countries/economies
Took an internationally agreed assessment…
The assessment was administered either in computer-based or paper-based versions.
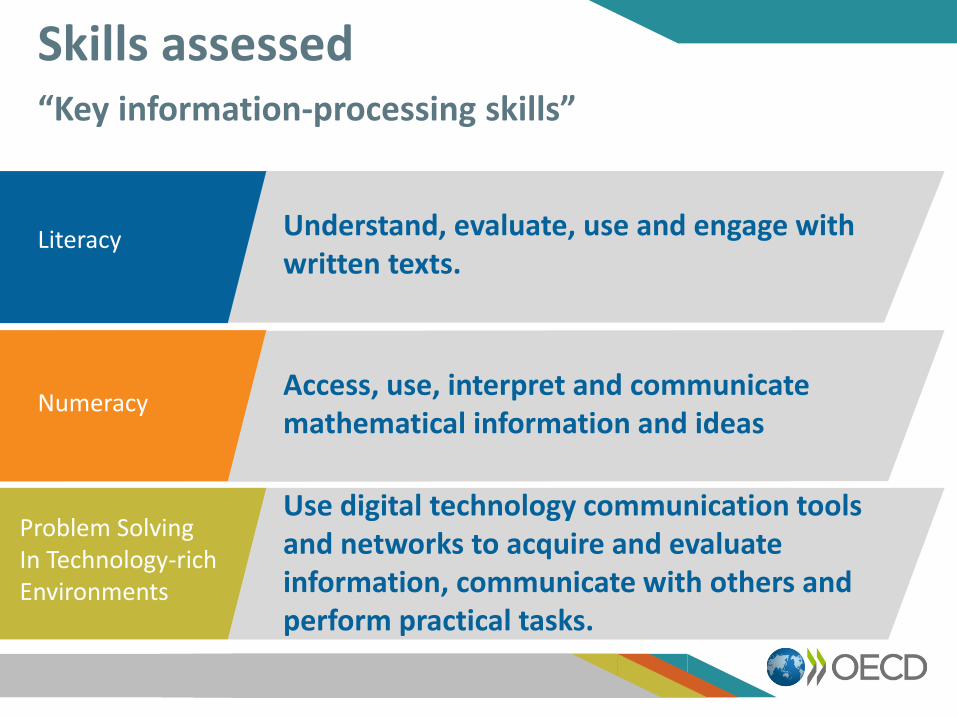
Literacy Understand, evaluate, use and engage with written texts.
Numeracy Access, use, interpret and communicate mathematical information and ideas
Problem Solving In Technology-rich Environments
Use digital technology communication tools and networks to acquire and evaluate information, communicate with others and perform practical tasks.
“Key information-processing skills”
Skills assessed

Overview of main findings
• (Measured) skills matter! • Big impact on a number of economic and social outcomes
• Not only at the individual, but also at the macro-level
• Level and distribution of skills differs markedly across countries
• Adults at lowest levels of proficiency make up between 5 and 30 per cent of the sample
• Proficiency is only partially related to formal education • Success is increasingly about building skills beyond school
• Immigrants and older adults have particularly low proficiency
• Higher risk of marginalization

Skills matter 0
51
01
52
02
53
0
Years of education Proficiency (literacy)

Skills matter
1.0
1.2
1.4
1.6
1.8
2.0
2.2
2.4
2.6
2.8
3.0
High wages High levels ofpolitical efficacy
Participation involunteeractivities
High levels of trust Being employed Good to excellenthealth
Odds ratio

Skills matter
• Impact on individual’s life chances • In terms of wages and employment probability
• Demand for skills shifting towards more sophisticated tasks (analysis and communication of information)
• Crucial for countries’ competitiveness • Per capita incomes higher in countries with large proportion
of high achievers/small proportion of low achievers
• It’s not just the economy • Poor health (self-reported)
• Low political efficacy
• Low participation in volunteering activities
• Low levels of trust
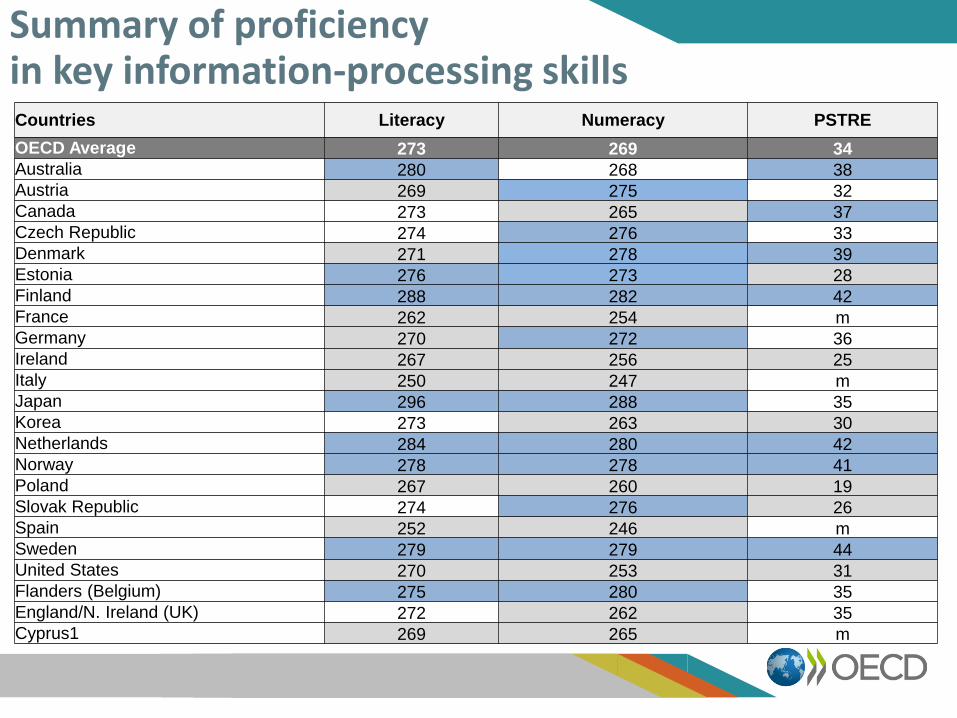
Summary of proficiency in key information-processing skills Countries Literacy Numeracy PSTRE
OECD Average 273 269 34 Australia 280 268 38 Austria 269 275 32 Canada 273 265 37 Czech Republic 274 276 33 Denmark 271 278 39 Estonia 276 273 28 Finland 288 282 42 France 262 254 m Germany 270 272 36 Ireland 267 256 25 Italy 250 247 m Japan 296 288 35 Korea 273 263 30 Netherlands 284 280 42 Norway 278 278 41 Poland 267 260 19 Slovak Republic 274 276 26 Spain 252 246 m Sweden 279 279 44 United States 270 253 31 Flanders (Belgium) 275 280 35 England/N. Ireland (UK) 272 262 35 Cyprus1 269 265 m

What adults can do Literacy
100 80 60 40 20 0 20 40 60 80 100
ItalySpain
Cyprus1France
IrelandPoland
AustriaUnited States
GermanyEngland/N. Ireland (UK)
KoreaDenmark
AverageCzech Republic
CanadaFlanders (Belgium)
Slovak RepublicEstonia
NorwayAustralia
SwedenNetherlands
FinlandJapan
Percent
Below Level 1 Level 1 Level 2 Level 3 Level 4/5

What adults can do • Literacy level 2:
• “…can integrate two or more pieces of information based on criteria, compare and contrast or reason about information, make low-level inferences. Can navigate within digital texts to access and identify information from various parts of a document”
• Example: simulated webpage of an event, with several
links, including “Contact us” and “FAQs”. Must identify the link providing phone number of event organizer
• On average, 15% of adults are below level 2 • 27% in Italy and Spain, 21% in France, 9% in Finland, 4%
in Japan

What adults can do • Numeracy level 2:
• “…tasks that require identifying and acting upon mathematical information embedded in a range of common contexts where mathematical content is explicit”
• Example: a salesman gets paid €0.35 per km, plus €40
per day. Knowing distance travelled in a one-day trip, calculate how much he will be paid for the trip (calculator allowed!)
• On average, 19% of adults are below level 2 • 30% in Italy and Spain, 28% in the U.S., 12% in
Netherlands and Finland, 8% in Japan

Proficiency and Education The advantage of tertiary educated individuals
02
04
06
08
0
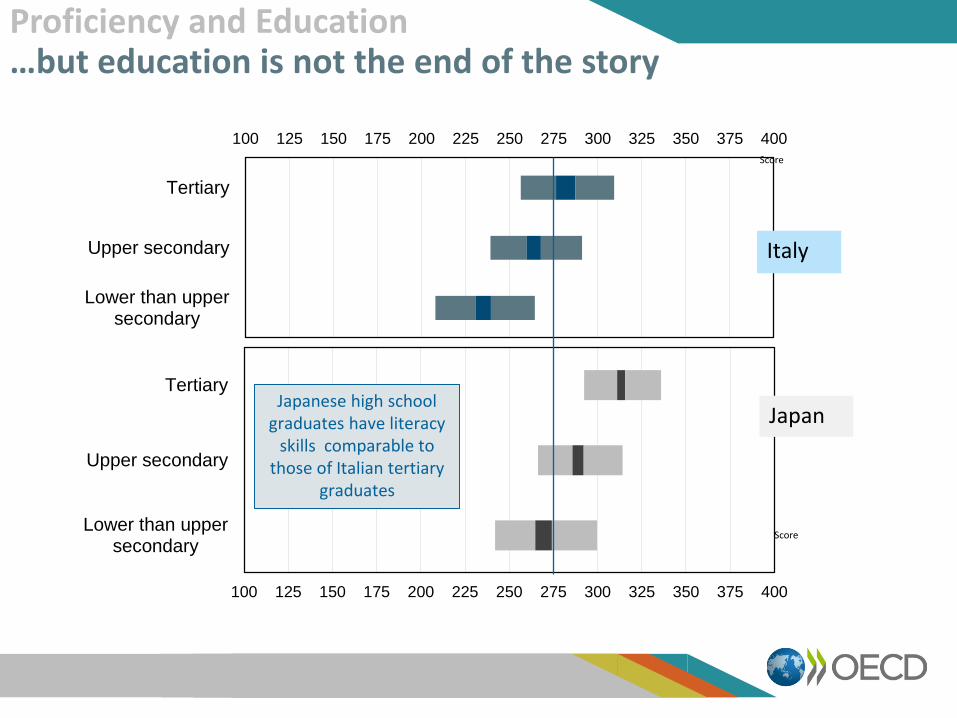
Proficiency and Education …but education is not the end of the story
100 125 150 175 200 225 250 275 300 325 350 375 400
Lower than uppersecondary
Upper secondary
Tertiary
Score
Italy
100 125 150 175 200 225 250 275 300 325 350 375 400
Lower than uppersecondary
Upper secondary
Tertiary
Score
Japan Japanese high school
graduates have literacy skills comparable to
those of Italian tertiary graduates

Proficiency and education
• Link between proficiency and education declines over time
• Still, results raise questions about quality of formal education
• Learning takes place everywhere, most notably on the workplace
• Large differences in participation rates in adult education: 60% in Nordic countries, below 30% in Italy
• Strong positive relationship between proficiency and participation in adult education
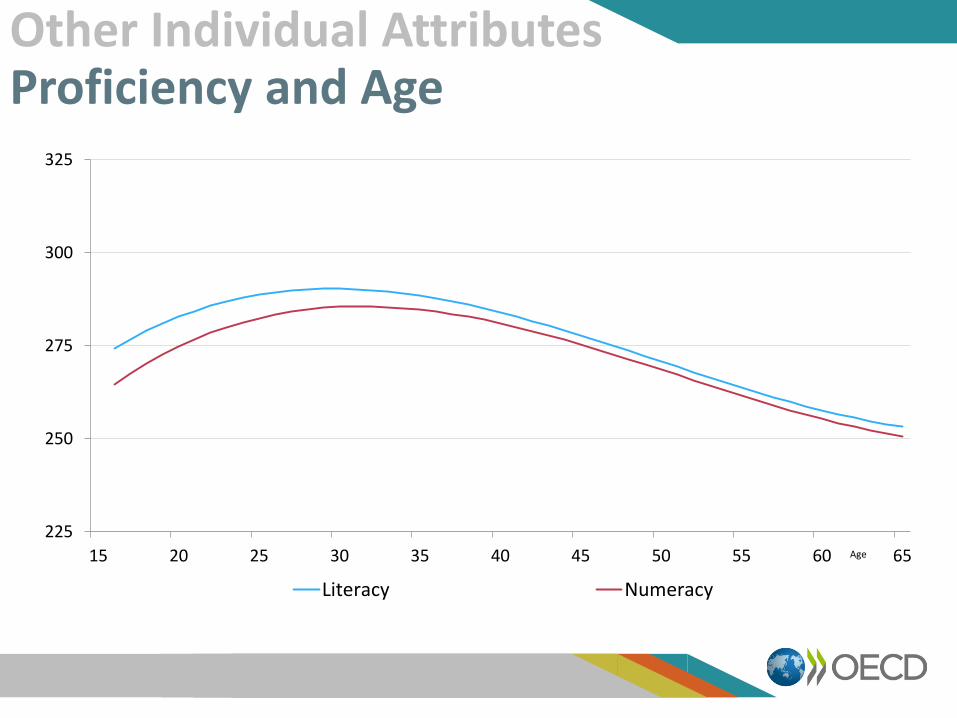
Other Individual Attributes Proficiency and Age
225
250
275
300
325
15 20 25 30 35 40 45 50 55 60 65
Literacy Numeracy
Age

Other Individual Attributes The disadvantage of foreign-born adults
-10
01
02
03
04
05
06
07
08
0
Conclusions
• Investing in skills is costly, but vital in the medium to long run
• Cutting public investment in skills is a short-sighted strategy
• Rather, work on making it more effective!
• Increased emphasis should be put on life-long learning, as opposed to (formal) initial education
• Effective skills policies require the involvement of many different actors – sharing costs and benefits
• Employers, Individuals, Governments…
• Which role for Governments? • Set standards, provide incentives, create safety nets

Data products
Data Explorer
Public Use File (some countries have suppressed or coarsened data)
Background Questionnaire
Codebook
SAS and STATA tools
IEA Data Analyser
Technical Report
Education and Skills On-line Assessment
Find Out More About PIAAC at:
www.oecd.org/site/piaac
All national and international publications The complete micro-level database
Email [email protected]