skill premia and immigrant-native wage gaps · skill premia and immigrant-native wage gaps ... in a...
TRANSCRIPT

Skill Premia and Immigrant-Native Wage Gaps Anna Rosso
LLAKES Research Paper 45

Centre for Learning and Life Chances in Knowledge Economies and Societies LLAKES is an ESRC-funded Research Centre - grant reference ES/J019135/1. To request printed copies of this paper or other LLAKES Research Papers, please contact the LLAKES Centre - [email protected]. To view this and other LLAKES Research Papers online, please visit www.llakes.org.
LLAKES Research Papers – Copyright This paper may be cited or briefly quoted in line with the usual academic conventions, and for personal use. However, this paper must not be published elsewhere (such as mailing lists, bulletin boards etc.) without the author’s explicit permission. If you copy this paper, you must: • include this copyright note.• not use the paper for commercial purposes or gain in any way.• observe the conventions of academic citation in a version of the following: Rosso, A. (2013) Skill Premia and Immigrant-Native Wage Gaps, published by the Centre for Learning and Life Chances in Knowledge Economies and Societies at: http://www.llakes.org

Skill Premia And Immigrant-nativeWage Gaps⇤
Anna Rosso
†
University College London and NIESR
Abstract
This study examines the developments in the skill distribution of EU8 immigrants andUK natives between 1998 and 2008 in the UK, exploring to what extent wage differ-entials between these two groups are explained by the changing attributes of migrantsand natives or by differences in returns to skill. After 2004, the number of immigrantsfrom the new accession countries increased significantly. Using the UK Labour ForceSurvey, I compare the evolution of the immigrant-native wage gaps over two periods(before and after 2004) and compare them with those of other immigrant groups. Usingthe new unconditional quantile regression, I show that a large part of the decrease inthe wage levels for EU8 is due to an increase in the wage gap at the top of the distri-bution. Yet, also a the bottom a wider wage penalty is observed. At all points of thedistribution occupational downgrading plays an important role. In order to rule outthe possibility that the increase in the gap is simply due to the lack of labour marketassimilation, as the majority of EU8 immigrants only arrived after 2004, I comparerecent immigrants after 2004. Results suggest that the decrease in the wage levels atthe top of the distribution is mainly due to the lack of transferability of skills acquiredin the source country. Also at the bottom EU8 immigrant wages have declined andworsened with respect to the period before the enlargement. It is likely that the natureof migration (temporary vs permanent) has a substantial role.
⇤I gratefully acknowledge the financial support of LLAKES. I thank Jonathan Portes and Rebecca Rileyfor their constructive comments. I also would like to thank the anonymous referee for the helpful comments.I use microdata from the UK Labour Force Survey from the ONS. The findings are those of the author, notthose of the funders or data providers. This work uses research datasets which may not exactly reproducethe National Statistics aggregates.
†Contact details: [email protected].
1

Contents
1 Introduction 3
2 Background and Data 9
2.1 Immigrants from EU8 countries in the UK . . . . . . . . . . . . . . . . . . . 92.2 Data and samples . . . . . . . . . . . . . . . . . . . . . . . . . . . . . . . . . 10
2.2.1 UK LFS: variables and sample selection . . . . . . . . . . . . . . . . 102.2.2 Descriptive Statistics . . . . . . . . . . . . . . . . . . . . . . . . . . . 122.2.3 Changes in the distribution of wages . . . . . . . . . . . . . . . . . . 17
3 Decomposition Methods 18
3.1 Mean decomposition . . . . . . . . . . . . . . . . . . . . . . . . . . . . . . . 193.2 Unconditional quantile decomposition . . . . . . . . . . . . . . . . . . . . . . 20
4 Estimation Results 22
4.1 Results from the mean wage gap . . . . . . . . . . . . . . . . . . . . . . . . . 224.2 Results from the quantile gaps . . . . . . . . . . . . . . . . . . . . . . . . . . 29
5 Recent immigrants from European countries 34
6 Robustness checks 36
7 Summary and conclusions 38
References 41
A Appendix Tables 46
2

1 Introduction
In a very short period of time Eastern European immigrants have become one of the largestimmigrant groups in the UK labour market. Recent estimates from the Office of NationalStatistics (2011) show that immigrants from the EU8 countries1 represented 0.2% of all theemployed population in quarter 1 2002 increasing up to 2.2% in quarter 1 2011 (the shareof workers from other EU countries has been relatively stable over the period, around 2%).The rise in the number of Eastern European born (Figure 1) is linked to the accession ofthese countries to the European Union and in particular, to the UK labour market, in May2004. Most other European countries (EU15) imposed transitional restrictions to the freemovement of workers from Eastern Europe, only the UK, Ireland and Sweden allowed themto work in their labour markets without any particular requirement2.
Changes in migration policies can affect the composition and quality of immigrants. Asshown in Antecol, Cobb-Clark and Trejo (2004) selective immigration policy could have aneffect on the labour market outcomes of immigrants by altering the skill composition. Asnoted in Pollard, Latorre and Sriskandarajah (2008), EU8 migration, and in particular Polishimmigration has changed the scale, composition of immigration in the UK. The Europeanenlargement can therefore be considered an interesting case for studying the effect of theelimination of administrative barriers to the selection of immigrants. In particular, I willstudy, using different econometric techniques, how this change has impacted on the skillsof immigrants and how this change in skills is then transferred to the wage distribution.My main research question will focus on the analysis and decomposition of the wage gapsbetween natives and immigrants. Recent literature on immigration to the UK has extensivelyfocused on the studying of EU8 immigrants in the UK labour market. The consensus viewis that EU8 immigrants are better educated than natives but suffer from a very high wagepenalty. Clark and Drinkwater (2008) show that, after the enlargement, the great influx ofEU8 workers has shifted the wage distribution of recent immigrants, such that at the thirdquartile immigrants have suffered a real reduction in wages of over £3 per hour, despitehigher employment rates. Drinkwater, Eade and Garapich (2009) show that immigrantsfrom Eastern European countries that arrived after 2004 found employment in low payingjobs, despite their high level of education, translating into lower returns to education thanother immigrant groups. Moreover, they also show that immigrants from these countries
1Poland, Czech Republic, Estonia, Hungary, Latvia, Lithuania, Slovakia and Slovenia2As explained in Boeri and Brücker (2005), only Sweden allowed labour to move freely in the country, the
UK required workers to register with the Working Registration Scheme (WRS) up to May 2011. A similarregistration scheme also applied to Ireland.
3

arriving after the enlargement have similar characteristics to those who arrived before. Yet,their analysis ends in 2006, including only few years after the accession. Blanchflower andShadforth (2009) show the effects of EU8 immigrants on the UK economy. They use datafrom 2004-2007 and confirm the results from other studies. They show that new immigrantworkers from EU8 countries are young, male in higher proportions, have high employmentrates, low unemployment rates, lower wages, they are more likely to be self-employed butalso more likely to be in temporary jobs. This research is also related to the literature onthe effect of immigration on unemployment and wages, as the change in the composition ofnew immigrants can have different effects on different parts of the labour market. Gilpin etal (2006) showed that EU8 immigration did not have any statistically significant effect onthe number of workers claiming unemployment, between 2004 and 2006. Dustmann, Frattiniand Halls (2010) show that EU8 immigrants in the UK are less likely than natives to receivestate benefits and live in social housing even after controlling for characteristics. The alsofind that EU8 immigrants have positively contributed to the public finances since 2004.
Figure 1: Total number of immigrants in the UK (in thousands)
2500
3000
3500
4000
4500
Oth
er im
mig
rant
s
020
040
060
080
0EU
8/EU
14
1998 2000 2002 2004 2006 2008Year
EU8 immigrants EU14 immigrantsOther immigrants
Source: UK LFS, years 1998-2008
Note: Totals include employed, unemployed and inactive, aged 16-65.
If we consider EU8 immigrants as a white ethnic group, the findings mentioned above are
4

in contrast with what previous immigration literature has shown. Chiswick (1980) was thefirst to show that wages of recent white immigrants in the UK were in line with those ofnative born. Later studies also confirmed these results. Particularly, Bell (1997), lookingat the period 1973-1992, finds that recent white immigrants experience a wage premiumwith respect to UK born, which is not seen for non-whites. Dustmann and Fabbri (2005)examine the economic performance of immigrants using the British Labour Force Surveyfrom 1979 to 2004 (just before the enlargement) showing that white immigrants earn similarwages to comparable British-born and some groups even higher conditional wages. Theyalso considered males immigrants from future “new accession” countries and concluded thatthey did not perform too differently from natives.
I use the British Labour Force Survey (hereafter UKLFS) for years 1998-2008 to compareEU8 immigrants’ performance in the the UK labour market before and after the enlargement.In terms of contribution, firstly, my analysis adds to the literature and debate on the effectof EU enlargement on the UK labour market providing evidence not only by describing thedifference (if any) in the human capital and socio-economic characteristics of those immi-grants that arrived after 2004 compared to the ones arriving before, but also by contributingwith a more precise explanation of why immigrants’ earnings have deteriorated after 2004.This paper has the aim to review the results found in the previous literature by decom-posing the mean wage gaps into composition and wage structure effects, but also adding tothe literature on this topic by analysing wage gaps in different at different percentile. Thedecomposition of percentile will allow me to understand whether changes at the bottom orat the top can be explained by similar factors. By simply looking at average wages, theprevious literature could not assess which characteristics (observable or unobservable) had astronger impact on the deterioration of the gap and. My goal is to empirically show whichcould be the causes of the decrease of the gap for different types of immigrant workers. Inaddition to previous literature and with the scope of precisely identifying skills acquired inthe home country and those developed in the destination country, I divide experience intoforeign and British experience.
In relation to the first contribution, the second contribution of this paper is in terms ofthe techniques used. I look at different features of the wage distribution, not only at meanwage gaps but also at the gap at different quantiles. The EU8 immigrants-native gap hasworsened differently at each point of the distribution (Table 2). As shown in Hunt (2012),immigrants’ performance varies widely at the bottom and at the top of the distribution,and mean wage differences mask important differences: while immigrants at the bottom
5

earn less than natives, those at the top end sometimes have higher wages than their nativeequivalents. What she finds, though, is that in 2009 immigrant wages have become lowerthan natives’ at all deciles with the exception of the 90th, and this is strongly linked topost-accession migration. When looking at the mean wage gap I use a standard Oaxaca-Blinder decomposition, while, when looking at the gap at different quantiles, I use theunconditional quantile regression method introduced by Firpo, Fortin and Lemieux (2009)which allows me to recover the unconditional parameter that would not be recovered ifusing the standard conditional quantile regression3. This method has been applied to theimmigration literature by Bourdarbat and Lemieux (2010) to show the factors that triggeredthe decline in the immigrant-Canadian born wage gap between 1980 and 2000. They findthat the decline is much larger at the low end of the wage distribution, while it is much lowerat the top quantiles. Heywood and Parent (2012) use the same approach to decompose thewhite-black earning differentials for workers in performance pay jobs at different points ofthe distribution in the USA, showing how the gap grows over the earnings distribution forthose in performance pay jobs and the opposite is true for workers not in performance payjobs.
The combination of different migration theories may help understand these results. Firstly,the lack of some country-specific characteristics (in most case unobservable in the surveys)can play an important role, most of immigrants from the EU8 countries have come hererecently, they may not have the destination country’s skills that allow them to integrate. Ifthat was the case, then EU8 recent immigrants when compared to other recent immigrantsfrom other European countries, they would perform in a similar way. However, the trans-ferability of the skills immigrants are endowed with when they enter the country are also afunction of the country of origin and how the quality of the education system is perceivedby the UK employers (see for example Friedberg, 2000). This would explain why two obser-vationally equivalent immigrants (that only differ in the country of origin) may not have thesame earnings, once they enter the country. As it is shown later, not only education, butalso foreign experience (variable used to proxy the labour market experience in the homecountry), have different values in the UK labour market depending on the immigrant group.Moreover, these differences in the return to skills, often caused by occupational downgrading,were already found evidence of in the immigration literature in the US: Mattoo et al (2008)argue that the reason why Eastern European immigrants accept low-paid jobs should be
3The reason for this is that with the standard Oaxaca decomposition one can average out the wages gapsconditioned on the covariates, thanks to the law of iterated expectations which does not hold for the case ofquantiles.
6

interpreted as an under-placement due to the lower quality of education in the home country(poor transferability) rather than skill under-utilization. Adsera and Chiswick (2007) showthat Eastern European men and women have the lowest earnings among all in immigrantgroups in all European countries they consider even after controlling for length of stay in thecountry, between 1999 and 2004. A question would still remain unsolved, as much little ev-idence of poor skill transferability was found before the enlargement. Clark and Drinkwater(2008) argue that the reason for this lies in the fact that migration from these countries wasmuch lower before 2004, so UK employer were unfamiliar with the quality of the educationalsystem in these countries. However, the magnitude of immigration from EU8 countries wasstill quite large but in most cases it was illegal, especially for Polish immigrants (Duvell, 2004and Trevena, 2009). Moreover, before the enlargement immigrants from Eastern countriescould enter the UK as self-employed, so there may have been some positive selection at workas those who could not find a job or were not performing well in the labour market wouldhave decided to become self-employed. However it is hard to identify from the UK LFS, asthe survey only does not ask the question on wages if the individual is self-employed. An-other possible hypothesis considers migrant selection from sending countries. There is a largeliterature that shows that by lowering the cost of migration also individuals coming from thepoorest regions decided to migrate. As shown in Dustmann et al (2012) and Rosso (2013) forthe case of Poland, the accession has changed the regional distribution of emigrants. Beforethe enlargement a large fraction of (legal) emigrants lived in richer regions (like the regionof Warsaw), after the enlargement a larger portion come from more agricultural regions.Differences in the quality of institutions within source countries could justify differences inthe labour market performance of immigrants before and after the enlargement. Finally, andalso partly related to the previous explanation, several studies have shown that the enlarge-ment has made migration of EU8 individuals more temporary as immigrants can move backand forth without restrictions (Blanchflower and Shadforth, 2009; Blanchflower and Lawton,2009). As shown by Dustmann (2000), temporary immigrants have lower reservation wages,therefore are more likely to accept lower wages and they invest less in host-country specifichuman capital. This theory seems to be particularly compelling when trying to explain whythe immigrant-native wage gap has become larger also at the bottom.
My results show that, compared to British natives, EU8 immigrants are better educated butafter 2004 the relative level of education has decreased, also because the level of natives’education has increased. Together with this, results also show that their education is valuedless. Most of the decrease is ascribed to occupational downgrading, indeed when controllingfor occupation in the wage regression the gap between the two periods in return to education
7

disappears. The return to foreign experience decrease substantially (on average and atdifferent percentile) over the two periods and are much lower compared to other immigrantgroups. As it was for other immigrants, before the enlargement EU8 immigrants the topearned higher wages than natives while at the bottom they earned less than natives. After2004, the raw wage penalty between natives and EU8 immigrants are higher at the top.Moreover, at the top a higher proportion of this gap cannot be explained by the differencesin the composition between immigrants and natives, even after controlling for occupation andindustry dummies, but it is ascribed to differences in wage structure (how characteristics arerewarded). The analysis on recent immigrants is performed in order to rule out the possibilitythat the results are just determined by the fact that EU8 immigrants are new arrivals.Results suggest that EU8 immigrants are more likely to compete with other immigrants andnot with EU14 immigrants4. Yet, the occupational downgrading is much larger for EU8immigrants than for other immigrants. These results and the fact that return on foreignexperience are much lower than return to foreign experience would be more compellinglyexplained by the theories on the lack of skill transferability and on the temporary nature ofmigration. While skill transferability tend to explain in particular the decrease at the top,the fact that also the bottom of the distribution has worsened may be justified by the factthat EU8 immigrants can choose to temporary live in the UK. Indeed, there would not be anyreason to observe a decline also at the bottom of the distribution, in particular if comparedto the period before, as the jobs performed at the bottom of the native distribution involvemore routine and manual tasks. These jobs usually require less cognitive and communicationskills, that may be missing in some immigrants (i.e. they can’t speak the language). It hasbeen found in the literature that immigrants have a relative advantage in jobs with highmanual-intensive tasks (Peri and Sparber, 2009; Peri et al, 2013; D’Amuri and Peri, 2013).The temporary nature of migration then can partly explain why EU8 immigrants acceptlower wages5. As pointed out in Clark and Drinkwater (2008) EU8 immigrants tend to worklonger hours in order to compensate for lower wages, which could be another signal of theirtemporary nature and the unwillingness to invest in host country human capital. Usinginformation only asked in the summer quarter in 2003 and 2006, they show that around30% of those who did not speak English at home as a main language, 95%, had language
4Brenke et al find that EU8 immigrants are more likely to compete with non-EU immigrants for low-skilledjobs and not with German natives
5Parutis (2011) also shows that some groups of Eastern European immigrants are largely highly qualifiedbut often work in low-skilled jobs. She finds that Polish and Lithuanian immigrants find it acceptable to workbelow their skills as it allows them either to maximise their income and then return back home (temporarymigrants) or to improve other skills required by the British labour market in order to have access to a widerlabour market (e.g. learn English).
8

difficulties in finding or keeping a job6.
The remainder of this paper is the following. In Section 2, I describe the situation of EU8immigrants in the UK, also referring to the data. In Section 3, I describe the decompositiontechniques used and the following sections present the the results and conclusions.
2 Background and Data
2.1 Immigrants from EU8 countries in the UK
In May 2004, nationals from the eight accession countries were allowed free access to the UKlabour market and they were only required to register with the Worker Registration scheme(WRS) if they wished to work for at least one month in the UK.
Between 1989 until the accession, immigration of EU8 workers to the UK was regulated bythe Immigration Act of 1971: they were subject to work permits issued for non EuropeanCommunity nationals to work for a particular employer in a particular job for a limitedperiod7. Yet, before the big change in 2004, since the 90’s, through the Europe Agreement8,EU8 citizens were allowed to come and stay in the UK for the purpose of establishinga business (self-employed or owners of companies or in partnership). Nevertheless, before2004, labour mobility within the EU was limited9 and in particular immigration from EasternEuropean countries was mainly to Western countries situated closer to their borders (Longhiand Rokicka, 2012). The Home Office (2009) using application from the WRS, showed thatin 2004, the number of applications approved were more than 120,000 and this numberincreased until 2008, when the number of applications started to decline.
In Table A2 in Appendix A, I show the change in the country composition (and the log of themean real hourly wages) in the periods before and after 2004. Immigrants from Poland arethe largest group in both periods. Before the enlargement, Hungarian immigrants were the
6It is important to notice that knowledge of English can be both a proxy for knowledge of country specificskills, but also it could be a good indicator of the quality of education in the source country.
7Only after four years in the country these restrictions could be lifted and individuals obtain a residentstatus to freely choose their occupation. There was no need of work permit for season agricultural work-ers on scheme, teachers on exchange programmes, migrants with British grandparents, business men andCommonwealth working holiday-makers.
8Ratified in different years for each country.9Only 4% of EU citizens have ever lived in another EU country and in 2002 only 1.5% of EU workers
lived in a different member state (see Dobson (2009) for a discussion on this and references)
9

second largest group representing 20% of all immigrants from EU8 countries but, after 2004their share decrease drastically to 3%. Also immigrants from Czech Republic experienced adecrease in their share from 12% to 6%. After the enlargement, Poles represented almost 70%of immigrants from EU8 and the other major groups were immigrants from Lithuania andfrom Slovakia. There is a decline in wages for all groups, with the exception of immigrantsfrom Czech and Slovak Republic, whose wages have increased by more than 10% over thetwo periods, but are still below the average wages of British born, as reported in Table 1.
2.2 Data and samples
2.2.1 UK LFS: variables and sample selection
The main dataset used is the UK Labour Force Survey (LFS) for years 1998 to 200810. TheLFS is a sample of private households in the United Kingdom which contains information ondemographic and labour market characteristics of the sampled individuals, since the mid-70s.From the spring quarter in 1992 it became a rotating panel, where individuals are sampledfor 5 consecutive waves (in Northern Ireland this design was only introduced in 1994). TheLFS is a large sample with on average 80,000 observations in each quarter. Data on wagesare available after 1993 in the last wave the person in interviewed. Since 1997 questions onwages are also asked in the first interview. In particular, among other variables this datasetcontains information on country of birth, arrival year in the UK, educational attainment,monthly gross wages, hours worked per week, occupation11 and industry sector. The LFS isa nationally representative sample which does not focus on immigrants and, as pointed outby Saleheen and Shadforth (2006) immigrants are less likely to respond to the survey andso more likely to be underrepresented in the LFS data. Moreover, I am looking at a veryspecific group of the immigrant population. As pointed out by Gilpin et al (2006) the LFS islikely to underestimate the number of EU8 immigrants in the country in particular those whohave been in the UK for less than 6 months and those living in communal establishments,
10I could use data up to 2011, but according to the official statistics from the ONS on long-term immi-grants (available at: http://www.ons.gov.uk/ons/rel/migration1/long-term-international-migration/2011/2-03-ltim-country-of-birth–1991-2011.xls, accessed 28 August 2013), there is large decrease in the inflow andincrease in the outflow of immigrants from EU8 countries. This is likely to be due to the financial crisisthat hit the UK at the end of 2008. As pointed out by the OECD (2012) the economic crisis has severelyaffected the outcomes of diverse cohorts differently. In order to avoid any sample selection due to fact thatalso long-term migrants are more likely to return to their home country during an economic crisis, I use dataup to 2008.
11ONS uses the Standard Occupational Classification (SOC) to classify occupations. There is a changein the occupational classification after 2001, from SOC1990 to SOC2000. I have recoded the occupationvariable into the International Standard Classification of Occupations (ISCO-88) codes in both periods usingtables provided by the Classification and Harmonisation Unit in the ONS, in order to be able to comparethe distribution of occupation over years.
10

as it is more difficult to include them in the sample. The small and selected sample size canbe a problem in particular before 2004, but as the number of EU8 nationals in the countryincreases12, the probability of being included in the survey increases and population weightswhich are provided in the survey can correct for the non-response rates between immigrantsand natives (Longhi and Rokicka, 2012). Further, this dataset has already been used to studythe immigration of A8 citizens in the UK (Blanchflower and Shadforth, 2009; Drinkwater,Eade and Garapich, 2009; Longhi and Rokicka, 2012) and to analyse labour market outcomesof immigrants in the UK in many other studies (for example, Dustmann and Fabbri, 2005;Dustmann, Frattini and Preston, 2013; Manacorda, Manning and Wadsworth, 2012). Giventhe nature of the survey, the LFS is more likely to give a better picture of longer-term EU8immigrants who are still living in the UK. Finally, the LFS allows the comparison withnatives and other immigrant groups, for both the periods I am looking at (before and after2004).
A further concern is the possibility that attrition is not random and affects natives andimmigrants in a different way. To avoid sample selection issues resulting from non-randomattrition, as a robustness check on the results, I run the same analysis including only in-dividuals who respond to their first interview (Drinkwater, Eade and Garapich, 2009 andLonghi and Rokicka, 2012). Results are confirmed.
Following the existing literature on immigration, I define immigrants based on the countryof birth. I define EU8 immigrants as those who were born in one of the countries that gainedaccess to the EU in 2004 with the exclusion of Malta and Cyprus. As comparison groups, Ialso report statistics for immigrants from the other countries that were already part of theEuropean Union (EU14 as I exclude the UK) and for all other immigrants. I use EU14 andother immigrants to compare the results in order to rule out the possibility that results weredriven by changes in UK labour market conditions for all immigrants and not by a changein the composition of EU8 immigrants coming to the UK.
12The statistics from the Worker Registration Scheme show that more than 800 thousands applicationswere registered and approved between May 2004 and September 2008 (Home Office. UK Border Agency,2009). From May 2004 until April 2011, all immigrants from EU8 countries who wanted to work in the UKhad to register with the scheme. The collection of these data only started after 2004, so they would be uselessin the context of this paper. Moreover, as pointed out by Blanchflower and Lawton (2008), the major caveatof these data comes from the fact that individuals do not need to de-register if they leave the country, forthis reason the WRS may overestimate the number of immigrants from those countries in the UK. This canbe even more severe in the case of EU8 migrants who should more appropriately be considered temporaryworkers. Looking at the Census statistics from 2001 and 2012, the share of EU8 immigrants has increased:in 2001 they only represented 0.13% of the working age population (and 0.21% of the total population), butin the latest 2012 Census they represent almost 2% of the population in England and Wales.
11

I restrict the analysis to individuals of working age (16-65) at the time of the interview whoreport to be employed or in government schemes. The earnings measure I use is real hourlywages, deflated using the CPI. Hourly wages are defined as gross weekly wages divided bythe total usual hours worked in a week, including the usual hours of paid overtime. Usinghourly wages will allow me to have a measure of wages which is less contaminated by thedecision on how much to participate in the labour market13. Finally, for each year I trim allthe wage observations below the 1st and above 99th percentile to eliminate outliers. I focuson employees, excluding self-employed as no wage information is reported for them.
The variable education is defined using “age left full-time education”. In the context ofimmigration the variable on the highest qualification achieved cannot be used as the ONS’spolicy is to recode any foreign qualification which is not on their list as “other”. While fornatives those who are classified in this category are likely to have low level of education, forimmigrants this is not the case (see Manacorda, Manning and Wadsworth (2012); Saleheenand Shadforth (2006) for a more detailed discussion). Using “age left full time education”represents a good proxy for the level of education, in absence of precise information onqualifications, so it also allows me to better compare different groups that are likely to haveacquired education abroad. I define workers with tertiary education as those who have leftfull-time education at age 21 or later, workers with secondary education as those who leftfull-time education between the ages of 17 and 20 and workers with less than secondary thosewho left full-time education before 16 years old (included) or never had full-time education.Using the same variable from the LFS, I also define the years of education for each worker,and this variable is used in the estimation as it easier to interpret in the context of wagedecompositions, as explained below.
2.2.2 Descriptive Statistics
Table 1 shows a set of labour market variables for natives, for EU8 immigrants, for all theother immigrants (excluding EU8) and for immigrants from the EU14 for years before 2004(1998-2003) and after 2004 (2004-2008)14.
12

Table 1: Descriptive statistics
Before 2004 After 2004
UK natives EU8 Otherimmigrants
EU14 UK natives EU8 Otherimmigrants
EU14
log hourly gross real wage 2.25 2.17 2.32 2.32 2.34 1.99 2.38 2.42British labour market experience 22 14 15 13 23 3 14 13Foreign labour market experience 4 4 3 6 5 4males (%) 50% 37% 51% 46% 50% 55% 52% 49%Education
Primary 57% 12% 26% 30% 51% 8% 21% 25%Secondary 27% 47% 36% 33% 29% 51% 36% 33%Tertiary 16% 41% 37% 37% 20% 41% 43% 42%
Years of education 11 14 13 13 12 14 14 14Cohort of arrival
before 1998 73% 84% 81% 7% 59% 64%arrival 1998-2003 27% 16% 16% 15% 28% 23%arrival 2004-2008 78% 13% 12%
Age 39 38 38 36 40 30 39 37Marital status
Single 30% 29% 28% 42% 32% 55% 28% 43%Married 58% 58% 61% 47% 55% 36% 61% 46%Other 12% 13% 11% 10% 13% 9% 11% 10%
Regiontyne & wear 2% 1% 1% 1% 2% 1% 1% 1%
rest of northern region 3% 2% 1% 2% 3% 1% 1% 2%south yorkshire 2% 0% 1% 1% 2% 2% 1% 1%west yorkshire 4% 2% 3% 2% 4% 6% 3% 2%
rest of yorks & humberside 3% 1% 1% 2% 3% 3% 1% 2%east midlands 8% 4% 5% 5% 8% 10% 5% 5%east anglia 4% 5% 3% 4% 4% 5% 3% 5%
inner london 3% 14% 19% 18% 3% 8% 16% 17%outer london 6% 30% 23% 14% 5% 13% 21% 13%
rest of south east 20% 22% 20% 24% 20% 18% 21% 23%south west 9% 6% 6% 8% 9% 5% 6% 8%
west midlands (met county) 4% 1% 5% 2% 4% 4% 4% 2%rest of west midlands 5% 1% 2% 3% 5% 3% 2% 3%greater manchester 5% 3% 2% 2% 4% 4% 3% 2%
merseyside 2% 0% 0% 0% 2% 1% 1% 1%rest of north west 4% 1% 2% 2% 4% 3% 2% 2%
wales 5% 2% 2% 2% 5% 3% 2% 3%strathclyde 4% 1% 1% 1% 4% 2% 1% 2%
rest of scotland 6% 3% 3% 4% 6% 4% 3% 5%northern ireland 2% 1% 1% 3% 2% 3% 1% 3%
OccupationLegislators and managers 14% 0% 14% 15% 15% 3% 13% 17%
Professionals 15% 6% 21% 21% 14% 5% 20% 21%Technicians 11% 3% 11% 10% 13% 4% 15% 15%
Clerks 18% 9% 16% 16% 16% 8% 12% 12%Service and sales workers 15% 38% 16% 18% 16% 17% 17% 16%
Agricultural and fishery workers 1% 0% 0% 0% 1% 1% 0% 0%Crafts and related trades workers 9% 0% 5% 5% 7% 9% 4% 4%
Plant and machine operators 8% 13% 7% 5% 7% 20% 6% 4%Elementary occupations 9% 31% 9% 9% 10% 34% 12% 11%
Industrya-b: agriculture & fishing 1% 1% 0% 0% 1% 2% 0% 1%
c,e: energy & water 1% 0% 1% 1% 1% 0% 1% 1%d: manufacturing 19% 14% 15% 15% 14% 27% 12% 12%f: construction 5% 6% 2% 3% 6% 6% 3% 3%
g-h: distribution, hotels & restaurants 18% 23% 20% 21% 17% 25% 19% 20%i: transport & communication 7% 3% 7% 7% 7% 11% 7% 7%
j-k: banking, finance & insurance etc 15% 15% 19% 20% 15% 11% 20% 21%l-n: public admin, educ & health 30% 24% 30% 27% 34% 11% 34% 30%
o-q: other services 5% 13% 5% 6% 5% 5% 4% 5%workplace outside uk 0% 0% 0% 0% 0% 0% 0% 0%
Observations 346,509 348 22,092 4,723 240,038 2,245 20,315 3,903Source: UK LFS, years 1998 to 2008Note: Employees aged 16-65. Self employed are excluded as there is no wage information. Real wages at constant 2008 prices. EU8 immigrantsinclude Poland, Czech Republic, Estonia, Hungary, Latvia, Lithuania, Slovakia and Slovenia. EU14 immigrants includeAustria, Belgium,Denmark, Finland, France, Germany, Greece, Ireland, Italy, Luxembourg, Netherlands, Portugal, Spain, Sweden. Other immigrants include allforeign born in the UK with the exclusion of EU8 born. Tertiary education: left full-time education at age 21 or later; secondary education: leftfull-time education between the ages of 17 and 20; less than secondary: left full-time education before 16 years old (included) or never had full-time education. Other in the marital status include separated, divorced or widowed.
13

In the first row of the table, I report the natural logarithm of hourly gross wages in realterms. Overall, EU8 immigrants are the lowest paid group in both periods. EU8 immigrantsmean log wages are 8 log points below that of natives, 15 points below the other immigrantgroups in the period before the accession15. The gap between EU8 immigrants and all othergroups has widened after 2004. EU8 immigrants earned 35 log points (30%) less than Britishborn-workers and even less if compared to other immigrants16.
Following Green and Worswick (2004) and Boudarbat and Lemieux (2012), I divide expe-rience into British experience and foreign experience, as the latter is probably not valuedas much as British experience in the UK labour market17. There is enough evidence in theliterature to support the idea that immigrants find it hard to transfer both formal educationand labour market experience from their country of origin to the destination country. In par-ticular as shown in Chiswick and Miller (2009), there is a strong inverse relationship betweensource country labour market experience and the likelihood of being correctly matched tothe skill requirements of the job.
For natives and for immigrants who studied in the UK- those who left full-time educationafter their arrival, British experience is defined as age minus age at which the individual leftfull time education, assuming that it is also the age of entry in the labour market. For all
13I report results for men and women together as in terms of the final results there is not much difference.Moreover, using hourly wages may not completely solve the problem of selection, as part-time jobs for exampleare systematically paid less than full-time jobs and part-time jobs are more popular among female workers(Manning and Petrongolo, 2008). For this reason, as a robustness check I present descriptive statistics andestimation results for men only.
14In Table A1 in Appendix A I report the employment rates for all the groups over the same two periods.The UK LFS allows for a distinction between inactive and employed and among employed self-employedare included. Self-employed only remain in the sample used to compute employment rates, but are thenexcluded from the sample mainly because of sample selection issues (see for example Dawson, Henley andLatreille, 2009) but also because there is not information on earnings for this group.
15We could transform this gap into percentage using the following transformation: let �t
represent thedifference in mean log wages between EU8 immigrant and native in period t (before or after 2004). Thepercentage wage difference is then given by e
�t � 1. For small values of �t
the difference in log wages is agood approximation of the percentage change in wages. For large values of �
t
it is better to use the formula.16This results is confirmed by previous studies on EU8 immigrants. Longhi and Rokicka (2012) find that
those who arrived after the enlargement suffered a wage penalty of almost 19% after controlling for individualcharacteristics, job characteristics, time and location dummies. Moreover, Drinkwater, Eade and Garapich(2009) documented a decline in average wages for Poles and other EU8 immigrants entering the countryafter the enlargement compared to other EU immigrants entering the country over the same period. Seealso Blanchflower and Shadforth (2009) for a discussion on immigrant wages from A10 countries. Clarkand Drinkwater (2008) show that EU8 immigrants have the lowest earnings of any other immigrant group,especially after 2004.
17As pointed out by Green and Worswick (2004) we should be cautious in interpreting the value of foreignexperience as returns to foreign experience as individuals arriving with different numbers of years of experi-ence in the source country labour market may also face different selection processes in different dimensions.
14

other immigrants who arrived at the end of their studies, British experience is simply definedas the years since migration, which is also assumed to be years since entering the Britishlabour market. Foreign experience is calculated as age at arrival minus school leaving ageand it is assumed to be zero for natives. Table 1 shows that before the enlargement nativeshad on average 22 years of experience in the British labour market, which increase to 23 afterthe enlargement. British experience for EU8 immigrants decreased by 11 years between thetwo periods of analysis, from 14 to 3 years, this is expected given the large cohort of EU8immigrants who arrived after 2004. This short UK experience seems to be strongly related tothe widening of the gap between EU8 immigrants and natives. This has not happened in theother immigrant groups. British experience has decreased by 1 year for all other immigrantsand remained stable for other EU immigrants. Overall, the labour market experience of EU8immigrants has decreased by 50%. This is also confirmed by the fact that immigrants areyounger (in general) and EU8 immigrants are younger than other immigrant groups after theenlargement. Before 2004, the labour market experience of EU8 immigrants was much morecomparable to that of other immigrants, still they suffered a wage penalty. Interestingly,after 2004, there is a larger increase in foreign experience for EU8 immigrants (from 4 yearsto 6) while for other immigrants it has only increased by 1 year.
As explained above, I group workers into three education categories on the basis of the agethey left full time education. In all groups I observe an increase in the level of education.Most noticeably, while the increase in the level of education has happened through an increasein the share of tertiary education for natives, other and EU14 immigrants, for immigrantsfrom EU8 countries there is no change in the share of tertiary educated over the two periods,but there is an increase in the share of secondary educated that it is barely seen in theother groups. Moreover, the share of primary educated has decreased more in other groupsthan amongst EU8 immigrants. Comparing the groups within each period, it is easy tonotice that, firstly immigrants are in general better educated than natives: before 2004,there are only 16% of natives at the top end of the distribution of education, for othergroups the fraction is around 40%, even higher after 2004. Secondly, in both periods thegroup of immigrants from EU8 countries has the lowest fraction of primary educated (12 and8% respectively in the two periods, while for natives it is above 50% in both periods) andbefore 2004 the highest fraction of tertiary educated (41%). Lastly, the fraction of secondaryeducated individuals among the EU8 immigrants is above 50% after 2004, again the highestamong all groups. Because of the strong relation between wages and education, I shouldobserve higher wages for immigrants, in particular for EU8 immigrants. So, while I observethis for all other immigrants in both periods immigrants from Eastern European countries
15

have always had on average lower wages than natives, the wage penalty for this group hasbecome even higher.
The next figures show the marital status for each group. I report the percentage of single,married (including those in civil partnership) and other which include those who are sep-arated, divorced or widowed. Before 2004, EU14 immigrants were more likely to be single(42%), while other groups were more likely to be married. After 2004, the distribution onlychanged for EU8 immigrants, who became more likely to be single (partly because they areyounger). Before 2004, all immigrants were disproportionately concentrated in London (in-ner and outer). The distribution across UK regions has only changed for EU8 immigrants.They have moved out of London (the share based in London fell from 44% to 21% after 2004)and the percentage of EU8 immigrants living in lower-wage regions has increased (after 2004,10% live in the East Midlands, 10% in the Yorkshire)18. I expect this relocation to havesome effect on relative wages.
I also report the distribution of occupation and industry for each group. Occupationaland industry differences may just represent an outcome of the poor job matches, mainlydue to the little international transferability of skills (education and foreign experience)19.Before 2004, the distribution of natives’ occupations was fairly similar to that of immigrants,but not for EU8 immigrants. Overall, immigrants are over-represented among professionalsand slightly under-represented among crafts and related trade workers. Before 2004, morethan 80% of immigrants from East-European countries were working in low-wage jobs (inparticular service and sales and elementary occupations) and after 2004 even if we observean increase in the percentage of immigrants in high-wage jobs, the percentage of those inlow-paid jobs is still very high. In terms of industry distribution there is not much changeover the two periods. EU8 immigrants are more likely to work in distribution, hotel andrestaurants in both periods (even more than other immigrants). This is a low-paid sector.After 2004, they are also over-represented in the manufacturing sector in comparison to allother groups.
18See for example, Rincón-Aznar and Stokes (2011) for a discussion on migrants’ choice of location withinthe UK.
19See for example Altonji and Blank (1999) for a discussion on this issue in the case of labour marketdiscrimination. Applied to this case occupational and industry differences can represent either a preferentialchoice or an outcome of, for example, the lack of skill transferability (or some other unobservable factors).Therefore, not controlling for these variables may underestimate the importance that these characteristicshave on labour market outcomes but on the other side, controlling for these variables may just underestimatethe existence of some sort of occupational segregation for this group of immigrants and thus the constraintsthat this group is facing.
16

2.2.3 Changes in the distribution of wages
In order to understand what is happening to the distribution of wages of EU8 immigrantsand natives, I compute the wage gap between the two groups at each percentile in the twoperiods. Also in this case, I report the results for both males and females together as thetrends are very similar. Figure 2 shows the wage gap between natives and EU8, EU14 andall other immigrants by each percentile in the period before and after 2004. Consistent withwhat I have said above, before 2004 EU8 immigrants earned less than British born, and thisis almost true at each percentile of the distribution (with the exception of the 80th percentilewhere the gap is positive). When I look at the period after the enlargement, again the gap isalways negative but it is larger at the top of the wage distribution. In particular, at the 90thpercentile EU8 immigrants earn (almost) 60% less than British born at the same percentile.When I consider the other groups, there is not much difference in the wage gap at eachpercentile over the two periods. After 2004 the gap of EU14 born has increased at the top infavour of EU14 but became more negative at the bottom (the wage distribution has becomewider), while it has shrunk for all other immigrants, still being positive.
Table 2 shows the log real wages for each percentile, for UK natives, EU8, EU14 and otherimmigrants before and after the enlargement. Wages for natives have increased similarlyat each percentile. Wages have decreased at each percentile after the enlargement for EU8immigrants, and the decrease has been higher (around 40%) at the percentiles at the top ofthe distribution. Wages for EU14 immigrants have increased by 9% at the 20th percentile butmore than 10% for the other percentiles. Two things come out of this table. EU8 immigrants’wage distribution moved to the left , disproportionally at each point of the distribution(moreat the top). EU8 immigrants are the only group that experienced a decrease in wages overthe two periods considered.
In this paper I will try to account for the changes in the distribution of wages not onlyby decomposing the mean wages, but also decomposing the changes in relative wages ofEU8 immigrants at different percentiles of the distribution, using the Firpo, Fortin andLemieux (2009) unconditional quantile regression method. As we have seen in the previ-ous paragraphs, EU8 immigrants have always had lower wages than natives even before theenlargement, but this gap has worsened becoming larger at the top percentiles of the distri-bution. Moreover, I will try to see whether this increase of the gap is explained solely by thelack of British labour market experience or if compared to another group of recent immigrantfrom other European countries, I still observe the same pattern. Skills of immigrants from
17

Figure 2: Immigrant-Native wage gap by percentile
-.6-.4
-.20
log
diff
20 40 60 80 100perc
before after
A8 immigrants
0.0
5.1
.15
log
diff
20 40 60 80 100perc
before after
All other immigrants0
.05
.1.1
5lo
g di
ff
20 40 60 80 100perc
before after
EU14
by percentile in the two periods
Source: UK LFS, years 1998-2008
Note: Real wages in 2008 prices.
EU14 countries seem to have a better transferability in the UK labour market compared tothose of EU8 immigrants.
3 Decomposition Methods
The standard Oaxaca-Blinder method (Oaxaca,1973; Blinder, 1973) decomposes the differ-ence in mean wages into two parts: the explained and unexplained components. The firstpart is the part that can simply be attributed to the differences in the characteristics betweenthe two groups (valued at the reference group coefficients). The way it could be interpretedis: if the wage structure of the reference group was held constant how much of the gap couldbe explained by the differences in characteristics? The unexplained component is simplypart of the gap that cannot be explained by characteristics and it is usually attributed todifferences in the return to skill function of the two groups.
Decomposing the mean is a rather easy exercise because of the statistical properties of the
18

Table 2: Log hourly gross real wage by quantile, before and after 2004
UK Natives EU8 Other immigrants EU14Before 2004 After 2004 Before 2004 After 2004 Before 2004 After 2004 Before 2004 After 2004
20th 1.79 1.89 1.75 1.69 1.82 1.88 1.83 1.9240th 2.08 2.16 2.03 1.83 2.15 2.20 2.14 2.2650th 2.21 2.30 2.16 1.91 2.30 2.35 2.29 2.4160th 2.36 2.44 2.32 1.99 2.46 2.50 2.45 2.5680th 2.71 2.79 2.72 2.22 2.81 2.86 2.81 2.9090th 2.95 3.04 2.94 2.45 3.07 3.13 3.06 3.16Source: UK LFS, years 1998 to 2008Note: Real wages at constant 2008 prices.
expected values. Thanks to the law of iterated expectations, the estimated coefficient of asimple OLS regression can be interpreted as the effect of a change on the mean value ofthe covariate on the unconditional mean value of the dependent variable20. Decomposingquantiles is harder because this property does not hold. The coefficient in the conditionalquantile regression can only be interpreted as the effect of a change in the mean value of thecovariates on the ⌧ th conditional quantile of the dependent variable, as the law of iteratedexpectation does not hold. For this reason, an alternative regression method was introducedby Firpo, Fortin and Lemieux (2009), where instead of estimating the usual conditionalquantile regression, a recentered influence function (RIF) is estimated and the standardOaxaca-Blinder decomposition is then performed on the results21.
Just a note should be made about the interpretation of the coefficients in both mean andquantile decompositions: it is assumed that there are no general equilibrium effects of immi-gration on skill prices. This implies that the wage structure of the natives is taken as givenand their wage structure acts as the wage structure of reference. Nothing can be said aboutwhat would happen to the natives’ wage structure in the absence of immigrants, which wouldprobably act as a better counterfactual for decomposition.
3.1 Mean decomposition
Starting from the mean decomposition, I consider a simple log wage equation for immigrants(I) and for natives (N).
WIit
= XIit
�It
+ ✏Iit
(1)
and20E[Y ] = E
X
[E(Y |X)] = E(X)�21An extensive description of the methods, with advantages and disadvantages can be found in Fortin,
Lemieux and Firpo (2011).
19

WNit
= XNit
�Nt
+ ✏Nit
(2)
where t is either before or after 2004. I estimate a log wage regression separately for immi-grants and natives22. The main assumptions in this setting is the linearity and separabilityof wage as a function of observable and unobservable characteristics. In addition to this Ialso need to assume the conditional mean independence of the error term (E[✏
it
|Xit
] = 0)which allows me to estimate unbiased and consistent estimators with OLS. These assump-tions are used to re-write the difference in the mean wages (�
t
= WIt
�WNt
) into the twocomponents.
�t
= WIt
�WNt
= (XIt
�XNt
)�Nt| {z }
explained
+ (�It
� �Nt
)XIt| {z }
unexplained
(3)
where Wgt
and Xgt
represent the mean wages and characteristics for all individuals in groupg in period t. Following Boudarbat and Lemieux (2010), given that some variables are immi-grant specific (i.e. foreign experience), I set the values for these variables and the correspond-ing parameters for natives to zero. As explained above, the first part of the decomposition isthe explained component which is given by differences in the average composition betweenthe two groups, while the second part is the unexplained component which is the differencein the estimated returns to similar characteristics between immigrants and natives.
3.2 Unconditional quantile decomposition
The quantile wage gap is the difference between immigrant and native quantiles�
t
(⌧) = qIt
(⌧)� qNt
(⌧) (4)
As pointed out in the introduction to this paragraph, because the unconditional quantile isnot equal to the mean of the conditional quantile, a new procedure has been introduced. Theunconditional quantile regression provides estimates of the coefficient of each single charac-teristics at different points of the distribution, where the dependent variable is substitutedby the recentered influence function (RIF). The first step to be taken is to construct the RIFof the wage W
it
for the quantile q(⌧). It is defined as:
22The alternative would be to estimate a pooled (immigrants and natives) wage regression, just by addingan immigrant dummy control. In this case I would need to assume that the prices for skills are the samein both groups. This is not credible in this context as the coefficients on separate regressions are verydifferent. The risk in this case is that when looking at the change of the gap over 2 periods, some of thechange could be attributed to a change in the wage structure of the reference group, making the resultsharder to interpret. As I show in the OLS results, the wage function for natives has barely changed over thetwo periods, therefore most of the decomposition results are imputable to changes in the immigrant group(composition and prices).
20

RIFit
(Wit
, q) = q(⌧) +1{W
it
� q(⌧)}� (1� ⌧)
fW
(q(⌧))(5)
where fw
(.) is the wage density function and 1(.) is the indicator function which is 1 when thewage observation is above the quantile q(⌧). The second part of the function is the influencefunction. The main advantage of using this transformation is that the expected value of theinfluence function is zero, therefore the expected value of the RIF is just q(⌧). The firstmethod suggested for the estimation is a simple OLS which provides consistent estimates ofthe parameters, as long as the Pr(W
it
� q(⌧)|X) is linear in the covariates (Firpo, Fortin,Lemieux, 2009):
E[RIFit
(Wit
, q)|X] = �t
Xit
(6)
The intuition behind it is that running a RIF regression is similar to running a linear modelon the probability of the wage observation being above the quantile, the only difference with asimple linear probability model is that in the RIF case, the coefficients are normalized by thedensity function evaluated at the quantile. Instead of decomposing the quantile gap (�
t
(⌧)),Firpo, Fortin and Lemieux (2009) show that it is easier to decompose the correspondinggap in the probability, which is given by the difference between the fraction of natives andthe fraction of immigrants earning below the value of the quantile for natives q
Nt
(⌧), whichis 1{W
it
� qNt
(⌧)}. The probability decomposition and the quantile decomposition arethen reconciled by dividing the probability gap by the probability density function23 TheOaxaca-Blinder decomposition is then performed on this probability gap.Firstly, I will run a RIF regression for each group
RIFIit
= XIit
�It
+ ✏Iit
(7)
andRIF
Nit
= XNit
�Nt
+ ✏Nit
(8)
The coefficients are interpreted as partial effect on the probability estimation (similar to anylinear probability model)24
I can re-write the quantile wage gap as a difference of the conditional expected value of theRIF25 between the two groups
23In a cumulative density function, being P
I
the cumulative probability for immigrants at a quantileq
Nt
(⌧) and P
N
the cumulative probability for native at the same quantile q
Nt
(⌧), the slope of the cumulativedistribution function is given just by the probability function: PN�PI
qIt(⌧)�qNt(⌧)= f
W
where f
W
is the wage pdf.So q
It
(⌧)� q
Nt
(⌧) = PN�PIfW
.24In the case of the conditional quantile regression the parameter is an estimate of the shift in the location
of the quantile in the conditional wage distribution.25Available at: http://faculty.arts.ubc.ca/nfortin/datahead.html (accessed 28 August 2013) for the RIF-
Regression STATA ado file from Firpo, Fortin and Lemieux (2009)
21
�t
(⌧) = (XIt
�XNt
)�Nt| {z }
explained
+ (�It
� �Nt
)XIt| {z }
unexplained
4 Estimation Results
4.1 Results from the mean wage gap
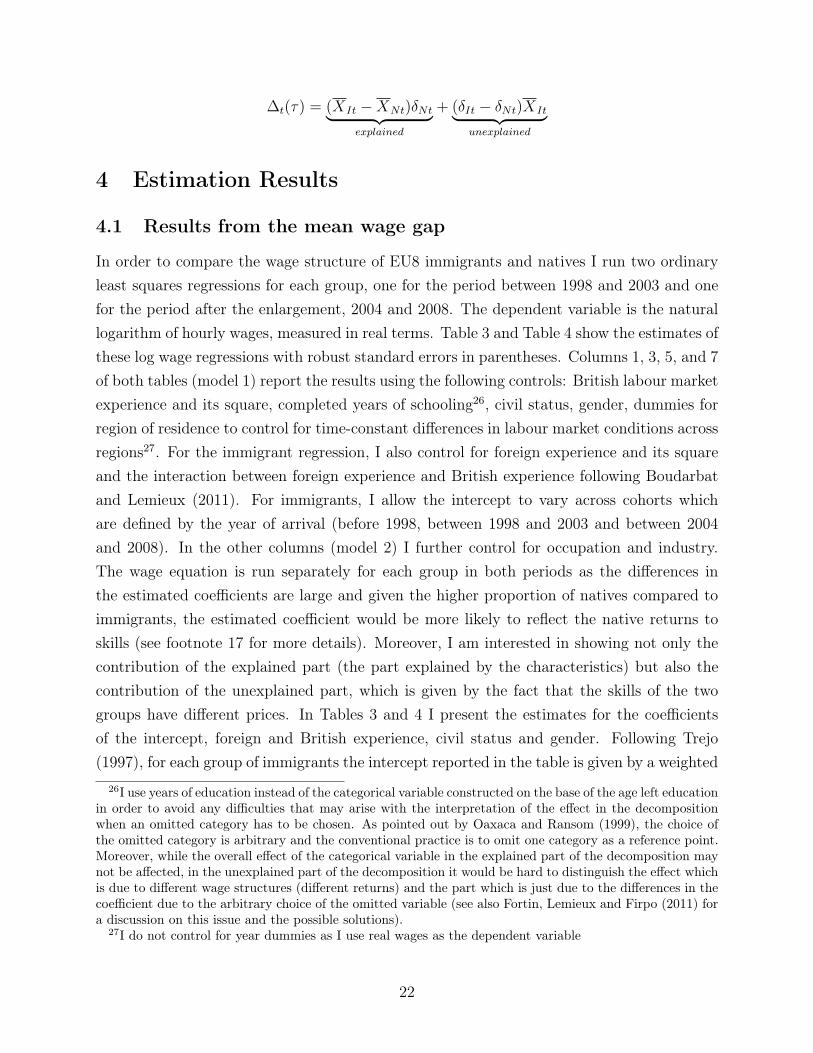
In order to compare the wage structure of EU8 immigrants and natives I run two ordinaryleast squares regressions for each group, one for the period between 1998 and 2003 and onefor the period after the enlargement, 2004 and 2008. The dependent variable is the naturallogarithm of hourly wages, measured in real terms. Table 3 and Table 4 show the estimates ofthese log wage regressions with robust standard errors in parentheses. Columns 1, 3, 5, and 7of both tables (model 1) report the results using the following controls: British labour marketexperience and its square, completed years of schooling26, civil status, gender, dummies forregion of residence to control for time-constant differences in labour market conditions acrossregions27. For the immigrant regression, I also control for foreign experience and its squareand the interaction between foreign experience and British experience following Boudarbatand Lemieux (2011). For immigrants, I allow the intercept to vary across cohorts whichare defined by the year of arrival (before 1998, between 1998 and 2003 and between 2004and 2008). In the other columns (model 2) I further control for occupation and industry.The wage equation is run separately for each group in both periods as the differences inthe estimated coefficients are large and given the higher proportion of natives compared toimmigrants, the estimated coefficient would be more likely to reflect the native returns toskills (see footnote 17 for more details). Moreover, I am interested in showing not only thecontribution of the explained part (the part explained by the characteristics) but also thecontribution of the unexplained part, which is given by the fact that the skills of the twogroups have different prices. In Tables 3 and 4 I present the estimates for the coefficientsof the intercept, foreign and British experience, civil status and gender. Following Trejo(1997), for each group of immigrants the intercept reported in the table is given by a weighted
26I use years of education instead of the categorical variable constructed on the base of the age left educationin order to avoid any difficulties that may arise with the interpretation of the effect in the decompositionwhen an omitted category has to be chosen. As pointed out by Oaxaca and Ransom (1999), the choice ofthe omitted category is arbitrary and the conventional practice is to omit one category as a reference point.Moreover, while the overall effect of the categorical variable in the explained part of the decomposition maynot be affected, in the unexplained part of the decomposition it would be hard to distinguish the effect whichis due to different wage structures (different returns) and the part which is just due to the differences in thecoefficient due to the arbitrary choice of the omitted variable (see also Fortin, Lemieux and Firpo (2011) fora discussion on this issue and the possible solutions).
27I do not control for year dummies as I use real wages as the dependent variable
22

average of each separate intercept estimated for each cohort of arrival, where the weights justrepresent the share of each cohort in that group of immigrant in each period as reported inTable 128. I do not report the coefficients on regional, occupation and industry dummies29.
Starting from Table 3, in the period before 2004, there is not a big difference in the returnsto British experience for natives and EU8 immigrants even after controlling for occupationand industry. After 2004, while these returns remain constant for natives, they increasefor immigrants: each additional year of experience in the British labour market increaseswages by 5% (controlling for occupation decrease the returns to the levels we observe before2004)30. The coefficient on foreign experience declines substantially from 0.045 to 0.015:after 2004 each year of work in the source country is valued 3 times less in the British labourmarket. This result is quite surprising. Before 2004, experience in the host country labourmarket was valued similarly to British experience. After the enlargement, this is not true anymore and the returns to foreign experience for these immigrants are lower than those of anyother immigrant group. The estimates of the coefficient on the interaction between Britishexperience and foreign experience are small, negative but significant and they are also in linewith the coefficients of all other immigrant groups considered. The negative sign means thatworkers with high foreign experience should have lower returns to British experience31.
The education measure used is years of education. The education premium declined sub-stantially between the two periods for EU8 immigrants, even after controlling for occupationand industry dummies, though the two coefficients are not statistically different from eachother in the second model. For every extra year of education, immigrants from East Euro-pean countries earned 7.1% higher wages and after the enlargement only 4%. Similar resultshave been found by Clark and Drinkwater (2008) who show that recent immigrants from
28For example, the intercept for EU8 immigrants in the period before 2004:interceptA8,before2004 =
share
before1998,before2004 ⇤ intercept
before1998,before2004 + share1998�2003,before2004 ⇤intercept1998�2003,before2004. The standard errors are then computed using the variance-covariance matrix
of the estimated coefficients and the fact that the se(interceptA8,before2004) =
qV ar(intercept
A8,before2004)
and the following formula for the variance: var(Pi
↵
i
x
i
)=Pi
↵
2i
var(xi
) +Pi
Pj 6=i
↵
i
↵
j
cov(xi
, x
j
)
29I run the models on immigrants without constant. That explains why the R-squared of the OLS regres-sions are inflated. If run with constant R-squared would be in line with those of natives.
30The increase in the returns to labour market experience is likely to be related to the fact that East-ern European immigrants are younger in the period after the enlargement and therefore these returns arecalculated on a steeper part of the wage-experience profile.
31In Green and Worswick (2004), they find that the decrease in return of foreign experience plays asignificant role in the declines in entry earnings across immigrants cohorts. Given that A8 immigrants, after2004, are mainly recent immigrants, also in this case the decline in return to foreign education can partlyexplain the increase in the wage penalty we observe for this group.
23

EU8 countries have the lowest returns to education. Returns have decreased for all groups,but on average by only 1 percentage point. Moreover, before 2004, skills of immigrants fromEU8 countries were valued similarly to skills of immigrants from other EU14 countries (Table4)32.
Interestingly, before 2004 those who are married earned about 21% more than single indi-viduals (the omitted category). The difference is only about 7% for natives and other EU14immigrants, but it is negative for other immigrants. The estimates decrease substantiallyafter 2004 but also become statistically insignificant. The coefficient also decrease for EU14immigrants and did not change much for other immigrants. The high effect I observe formarried EU8 immigrants may also be related to the type of immigration: being marriedin the host country may also increase the investment in human capital in the host countrywhich is related to the intentions to stay in the country.
There is evidence to say that female workers are paid lower wages, ceteris paribus. In allregressions the estimated coefficient on the female variable is negative and high, even aftercontrolling for occupation and industry. Before 2004, Eastern European female workersearned 42% (33% in model 2) less than males and this estimates went down to 15% in thepost-enlargement period. The gender penalty is above 20% for natives, which is much higherthan the penalty I observe for the other groups I consider.
In order to provide some additional evidence of differences in the wage structure of the nativesand EU8 immigrants, I jointly test whether the coefficients for natives and EU8 immigrantson education, experience, gender and marital status are different. Very high F-statisticsconfirm the the fact that the wage structure of the two groups are remarkably different, inparticular in the second period (the F-statistic for the pre-enlargement regression is 4 whileit is 37 in the post-enlargement period).
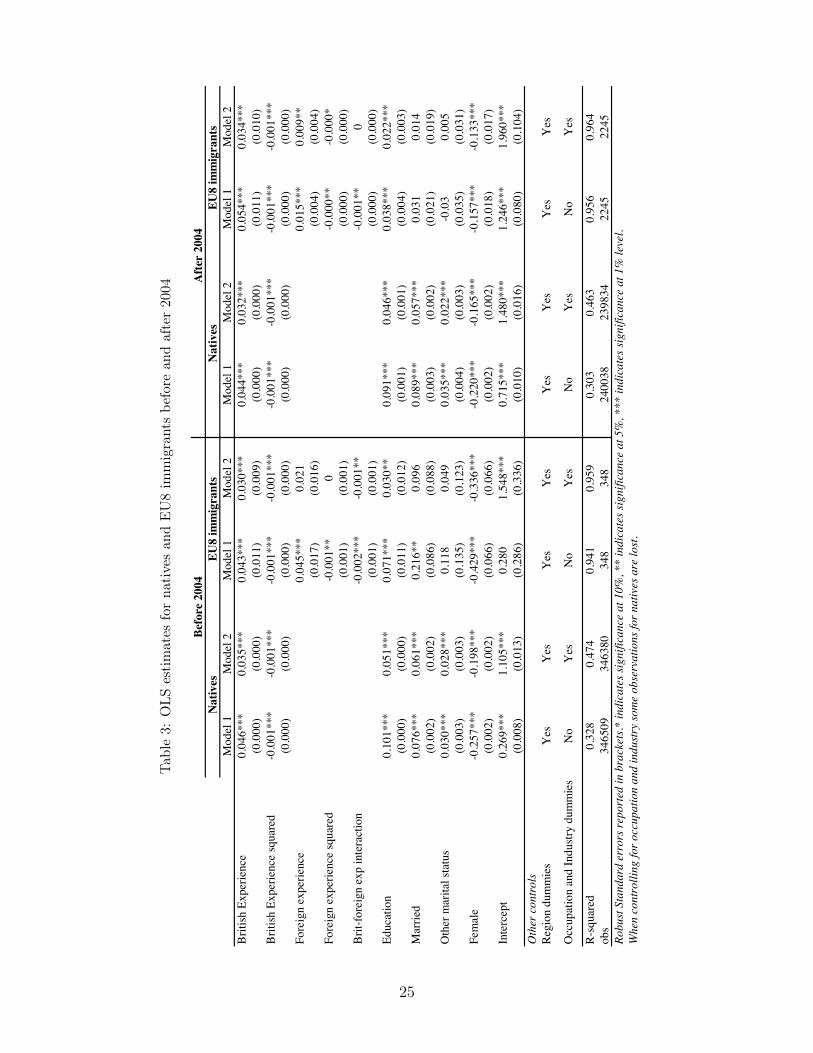
In Table 5, I use the decomposition techniques illustrated in section 3 in order to understandwhich portion of the wage differences can be attributed to characteristics and which portion
32There is also an issue of country composition and the fact that skills from some countries are lesstransferable than others. The relative distribution of countries within this groups has slightly changes.There is a decrease in the percentage of individuals from Hungary (from 20% to 3% of all immigrants fromEast European countries). Immigrants from Poland were 42% before and are about 70% after. Those fromCzech Republic represented 12% before and they are 6% after. The shares of immigrants from other countrieshad minor adjustments. I also investigate further by running regressions controlling for country dummiesand results do not change. In Table A2 I report the country distribution and mean wages for each group inthe two periods.
24
Tab
le3:
OLS
esti
mat
esfo
rna
tive
san
dE
U8
imm
igra
nts
befo
rean
daf
ter
2004
Before2004
After2004
Natives
EU8immigrants
Natives
EU8immigrants
Model1
Model2
Model1
Model2
Model1
Model2
Model1
Model2
BritishExperience
0.046***
0.035***
0.043***
0.030***
0.044***
0.032***
0.054***
0.034***
(0.000)
(0.000)
(0.011)
(0.009)
(0.000)
(0.000)
(0.011)
(0.010)
BritishExperiencesquared
-0.001***
-0.001***
-0.001***
-0.001***
-0.001***
-0.001***
-0.001***
-0.001***
(0.000)
(0.000)
(0.000)
(0.000)
(0.000)
(0.000)
(0.000)
(0.000)
Foreignexperience
0.045***
0.021
0.015***
0.009**
(0.017)
(0.016)
(0.004)
(0.004)
Foreignexperiencesquared
-0.001**
0-0.000**
-0.000*
(0.001)
(0.001)
(0.000)
(0.000)
Brit-foreignexpinteraction
-0.002***
-0.001**
-0.001**
0(0.001)
(0.001)
(0.000)
(0.000)
Education
0.101***
0.051***
0.071***
0.030**
0.091***
0.046***
0.038***
0.022***
(0.000)
(0.000)
(0.011)
(0.012)
(0.001)
(0.001)
(0.004)
(0.003)
Married
0.076***
0.061***
0.216**
0.096
0.089***
0.057***
0.031
0.014
(0.002)
(0.002)
(0.086)
(0.088)
(0.003)
(0.002)
(0.021)
(0.019)
Othermaritalstatus
0.030***
0.028***
0.118
0.049
0.035***
0.022***
-0.03
0.005
(0.003)
(0.003)
(0.135)
(0.123)
(0.004)
(0.003)
(0.035)
(0.031)
Female
-0.257***
-0.198***
-0.429***
-0.336***
-0.220***
-0.165***
-0.157***
-0.133***
(0.002)
(0.002)
(0.066)
(0.066)
(0.002)
(0.002)
(0.018)
(0.017)
Intercept
0.269***
1.105***
0.280
1.548***
0.715***
1.480***
1.246***
1.960***
(0.008)
(0.013)
(0.286)
(0.336)
(0.010)
(0.016)
(0.080)
(0.104)
Othercontrols
Regiondummies
Yes
Yes
Yes
Yes
Yes
Yes
Yes
Yes
OccupationandIndustrydummies
No
Yes
No
Yes
No
Yes
No
Yes
R-squared
0.328
0.474
0.941
0.959
0.303
0.463
0.956
0.964
obs
346509
346380
348
348
240038
239834
2245
2245
RobustStandarderrorsreportedinbrackets.*indicatessignificanceat10%,**indicatessignificanceat5%
,***
indicatessignificanceat1%
level.
Whencontrolling
foroccupationandindustrysomeobservationsfornativesarelost.
25

Tab
le4:
OLS
esti
mat
esfo
rna
tive
san
dE
U14
and
othe
rim
mig
rant
s,be
fore
and
afte
r20
04
Before2004
After2004
Otherimmigrants
EU14immigrants
Otherimmigrants
EU14immigrants
Model1
Model2
Model1
Model2
Model1
Model2
Model1
Model2
BritishExperience
0.039***
0.026***
0.042***
0.031***
0.041***
0.026***
0.047***
0.032***
(0.001)
(0.001)
(0.003)
(0.003)
(0.002)
(0.002)
(0.004)
(0.003)
BritishExperiencesquared
-0.001***
-0.000***
-0.001***
-0.000***
-0.001***
-0.000***
-0.001***
-0.001***
(0.000)
(0.000)
(0.000)
(0.000)
(0.000)
(0.000)
(0.000)
(0.000)
Foreignexperience
0.026***
0.022***
0.040***
0.033***
0.021***
0.018***
0.045***
0.037***
(0.002)
(0.002)
(0.005)
(0.004)
(0.002)
(0.002)
(0.005)
(0.004)
Foreignexperiencesquared
-0.000***
-0.000***
-0.001***
-0.000***
-0.000***
-0.000***
-0.001***
-0.001***
(0.000)
(0.000)
(0.000)
(0.000)
(0.000)
(0.000)
(0.000)
(0.000)
Brit-foreignexpinteraction
-0.001***
-0.001***
-0.002***
-0.001***
-0.001***
-0.001***
-0.002***
-0.001***
(0.000)
(0.000)
(0.000)
(0.000)
(0.000)
(0.000)
(0.000)
(0.000)
Education
0.071***
0.027***
0.083***
0.045***
0.059***
0.021***
0.074***
0.034***
(0.001)
(0.001)
(0.002)
(0.002)
(0.001)
(0.001)
(0.003)
(0.003)
Married
-0.048***
-0.013
0.072***
0.049***
-0.034***
-0.002
0.043*
0.044**
(0.010)
(0.008)
(0.021)
(0.019)
(0.010)
(0.009)
(0.023)
(0.020)
Othercivilstatus
-0.060***
-0.012
0.027
0.006
-0.081***
-0.029**
-0.019
0.015
(0.015)
(0.012)
(0.030)
(0.026)
(0.015)
(0.012)
(0.031)
(0.025)
Female
-0.163***
-0.126***
-0.213***
-0.150***
-0.110***
-0.102***
-0.186***
-0.135***
(0.008)
(0.007)
(0.016)
(0.015)
(0.008)
(0.007)
(0.017)
(0.017)
Intercept
0.622***
1.682***
0.029***
0.136***
1.106***
2.052***
1.605***
1.601***
(0.046)
(0.072)
(0.042)
(0.049)
(0.040)
(0.056)
(0.071)
(0.119)
Othercontrols
Regiondummies
Yes
Yes
Yes
Yes
Yes
Yes
Yes
Yes
OccupationandIndustry
dummies
No
Yes
No
Yes
No
Yes
No
Yes
R-squared
0.936
0.956
0.946
0.958
0.946
0.964
0.956
0.968
obs
22,092
22,083
4,723
4,723
20,315
20,288
3,903
3,900
Note:R
obustStandarderrorsreportedinbrackets.*indicatessignificanceat10%,**indicatessignificanceat5%
,***
indicatessignificanceat1%
level.Whencontrolling
for
occupationandindustrysomeobservationsforbothgroupsarelost.
26

to the change in skill prices. The table shows the decomposition for three groups: EU8 vsnatives, EU14 vs natives and all other immigrants vs natives. For each group I report thetwo models. As before, “Model 1” controls on British and foreign experience, education,marital status, gender, regional, year and cohort dummies; “Model 2” additionally controlsfor occupation and industry. The top rows of the table show the raw difference of log hourlywages in real terms between each immigrant group and natives before and after 2004. Thefollowing rows show shares due to characteristics and the bottom of the table the share of thegap due to differences in the coefficients. As briefly explained before (in footnote 26) , whenlooking at the decomposition for subgroups of variables, it is important to bear in mind thatthe unexplained part of the decomposition attributed at these subgroups is affected by thechoice of the omitted category, though the total unexplained part remains the same.
Between the two periods, the explained part decreased substantially. Looking at model 1, thefactor that drives this change is British experience: the gap has decreased by 29 log pointsand two thirds of the change is due to British experience. Also education plays an importantrole: immigrants are more educated than natives but relative to the period before there is aslight decrease in the contribution of education. The contribution of marital status was zerobefore 2004, because the distribution of this variable was identical in the two groups, while itslightly contributes to the decline by 0.016 because of the increase in the share of not marriedindividuals among EU8 immigrants, who have relatively lower wages than married workers.The increase in the share of males is the only positive contribution to the change. After2004, the contribution of location to the wage gap is still positive but lower if compared tothe period before: immigrants are still located in places with higher wages (i.e. London) butthere is a higher fraction of EU8 immigrants that locate in regions with lower wages (e.g.East Midlands, Yorkshire). To sum up, differences in average characteristics ((X
It
�XNt
))between immigrants and natives tend to suggest that immigrant wages are higher than nativewages before 2004, while they suggest the opposite after 2004. Moving the attention to thetotal unexplained component of the decomposition, there is not much change over the twoperiods, but they are in both periods very high. Before 2004, the background characteristicsof EU8 immigrants were already valued less relatively to those of natives but the differenceswere offset by the average characteristics that were better than those of natives. This doesnot happen after 2004. Looking in more details at the contribution of each variable, a largeshare of the coefficient effect comes from the lower returns to education, which decreasedeven more after 2004. The other factors which are easily interpretable are British and foreignexperience and female. As we have already reported before, there is an increase in the returnsto British experience, but decrease in the returns to foreign experience.
27
Tab
le5:
Dec
ompo
siti
onof
nati
ves
and
imm
igra
nts
mea
nw
age
gaps
EU8immigrantsvsnatives
Otherimmigrantsvsnatives
EU14immigrantsvsnatives
Model1
Model2
Model1
Model2
Model1
Model2
Before2004
After2004
Before2004
After2004Before2004
After2004
Before2004
After2004
Before2004After2004
Before2004After2004
Raw(unadjusted)gap
-0.079
-0.369
-0.079
-0.369
0.073
0.042
0.073
0.042
0.072
0.087
0.072
0.087
BritishExperience
-0.146
-0.339
-0.107
-0.248
-0.094
-0.12
-0.068
-0.088
-0.126
-0.123
-0.092
-0.090
Education
0.267
0.223
0.131
0.107
0.189
0.187
0.093
0.09
0.190
0.185
0.093
0.089
MaritalStatus
0-0.016
0-0.01
0.002
0.004
0.001
0.003
-0.007
-0.008
-0.006
-0.005
Female
-0.033
0.012
-0.026
0.009
0.002
0.006
0.001
0.005
-0.010
-0.001
-0.007
-0.001
Location
0.089
0.028
0.076
0.024
0.085
0.078
0.072
0.064
0.062
0.061
0.053
0.051
Occupation
--
-0.017
-0.168
--
0.026
0.016
--
0.033
0.040
Industry
--
-0.018
-0.019
--
0.001
-0.002
--
-0.004
-0.003
TotalExplained
0.18
-0.093
0.039
-0.306
0.187
0.155
0.126
0.088
0.111
0.114
0.070
0.080
BritishExperience
0.007
0.023
-0.041
-0.001
-0.04
-0.034
-0.057
-0.05
-0.019
-0.003
-0.028
-0.017
ForeignExperience
0.089
0.071
0.042
0.042
0.069
0.07
0.052
0.056
0.082
0.094
0.065
0.077
Brit-foreignexpinteraction
-0.064
-0.019
-0.05
-0.005
-0.046
-0.051
-0.028
-0.031
-0.048
-0.053
-0.032
-0.038
Education
-0.498
-0.713
-0.401
-0.332
-0.39
-0.432
-0.3
-0.318
-0.268
-0.245
-0.163
-0.161
MaritalStatus
0.006
-0.029
-0.046
-0.019
-0.086
-0.085
-0.051
-0.041
-0.011
-0.026
-0.014
-0.007
Female
-0.052
0.035
-0.023
0.018
0.055
0.056
0.04
0.033
0.031
0.024
0.031
0.020
Location
-0.143
0.028
-0.093
0.031
-0.015
0.009
0.018
0.009
0.083
-0.004
0.054
0.078
Occupation
--
-0.058
0.177
--
-0.061
-0.029
--
-0.032
-0.004
Industry
--
-0.221
-0.047
--
-0.135
-0.12
--
-0.071
0.047
Interceptandothervariables
0.395
0.327
0.773
0.073
0.34
0.353
0.47
0.445
0.108
0.185
0.192
0.012
Totalunexplained
-0.259
-0.276
-0.118
-0.063
-0.114
-0.113
-0.053
-0.046
-0.040
-0.027
0.001
0.007
Source:Author's
OLS
regressionsusingtheUKLFS,1998-2008
Note:O
thervariablesdummiesforcohorts
ofarrival.
28

Adding occupation and industry controls helps explain more of the gap in both period, buttheir contribution is higher after 2004. In fact in the latter period, the addition of occupationand industry dummies can explain 80% of the gap and the rest is simply attributed to theunexplained component. After the EU enlargement, the difference in the distribution acrossoccupation in the two groups plays an important role in explaining the decline of the gapand confirms the fact that EU8 immigrants have a higher probability to end up in low-paidjobs. Additionally, controlling for occupation and industry also improves the difference inthe returns to education between the two groups. These findings are a clear evidence ofoccupational downgrading
To sum up firstly, before the enlargement EU8 immigrants had slightly better characteristicscompared to the group of immigrants after 2004. Secondly, occupational downgrading be-comes more evident and severe after the accession. I also look at the other immigrant groups(EU14 and other immigrants). The contribution of each decomposed part to the gap hasremained stable over the period, in particular for EU14 immigrants. The gap for this grouphas slightly improved, but no significant changes happened to the composition of immigrantsor their wage structure. For the other group of immigrants the decline in the gap from 0.073to 0.042 can entirely be explained by a change in their characteristics. Moreover, on average,both groups work in better paid occupations than natives.
4.2 Results from the quantile gaps
Table 6 show the results from the Firpo, Fortin and Lemieux (2009) decomposition forthe native-immigrant wage gap explained above. In order to save space I report only theresults from the Oaxaca-Blinder decomposition and no regression results (which can beprovided upon request). The results shown in the table are based on the coefficients of theRIF regression which I run separately. As reported above, I firstly run a RIF regressionfor quantiles for each group and then I perform an Oaxaca-Blinder decomposition of thequantile wage gaps and look at the changes in the two periods.
Table 6 shows the results from the decomposition for the 20th, 50th (median) and 90thquantile for model 1 and model 2 (as reported above). The first line of the table indicatesthe unadjusted gaps for real wages, as reported in Table 2. The following rows show theexplained and unexplained gaps. As pointed out before, the gap has increased more in theupper part of the distribution. If I consider the composition effect (Total explained) givenby the top part of the table, it is clear that British experience plays an important role inthe gaps at each quantile analysed, but this role is less substantial at the bottom end. This
29

Tab
le6:
Dec
ompo
siti
onof
nati
ves
and
imm
igra
nts
quan
tile
wag
ega
ps
EU8immigrantsvsNatives
EU8immigrantsvsNatives
Model1
Model2
20th
50th
90th
20th
50th
90th
Before2004
After2004Before2004
After2004Before2004
After2004
Before2004After2004Before2004After2004Before2004After2004
Raw(unadjusted)gap
-0.047
-0.192
-0.050
-0.393
-0.017
-0.590
-0.047
-0.192
-0.050
-0.393
-0.017
-0.589
BritishExperience
-0.120
-0.282
-0.150
-0.357
-0.160
-0.358
-0.083
-0.193
-0.101
-0.240
-0.132
-0.295
Education
0.165
0.142
0.284
0.250
0.371
0.285
0.060
0.052
0.111
0.099
0.248
0.187
MaritalStatus
0.000
-0.010
0.001
-0.021
0.000
-0.023
0.000
-0.006
0.001
-0.013
0.000
-0.016
Female
-0.032
0.011
-0.039
0.013
-0.034
0.013
-0.026
0.009
-0.028
0.009
-0.026
0.009
Location
0.071
0.019
0.100
0.032
0.101
0.038
0.060
0.015
0.087
0.028
0.083
0.032
Occupation
-0.043
-0.150
-0.021
-0.223
-0.010
-0.141
Industry
-0.027
-0.034
-0.026
-0.028
0.002
0.003
TotalExplained
0.087
-0.122
0.198
-0.081
0.279
-0.045
-0.055
-0.307
0.025
-0.368
0.173
-0.222
BritishExperience
-0.154
-0.029
0.024
-0.007
0.192
0.098
-0.174
-0.015
-0.070
-0.007
0.166
-0.001
ForeignExperience
0.005
0.022
0.076
0.022
0.069
0.180
-0.033
0.012
0.021
0.003
0.051
0.115
Brit-foreignexpinteraction
-0.030
-0.002
-0.035
-0.003
-0.067
-0.057
-0.006
0.000
-0.022
0.005
-0.070
-0.023
Education
-0.572
-0.570
-0.549
-1.079
-0.493
-0.448
-0.286
-0.117
-0.585
-0.393
-0.559
-0.587
MaritalStatus
0.155
-0.014
-0.062
-0.026
-0.196
-0.062
0.062
-0.005
-0.062
-0.009
-0.141
-0.059
Female
-0.043
0.056
-0.039
0.057
-0.029
0.017
-0.024
0.048
-0.058
0.027
-0.067
-0.001
Location
-0.187
-0.038
-0.130
0.105
0.065
-0.053
-0.074
-0.035
-0.113
0.102
0.152
-0.059
Occupation
-0.058
-0.032
0.040
0.010
0.373
0.056
Industry
-0.035
0.171
-1.573
0.523
0.233
0.477
Interceptandothervariables
0.692
0.505
0.467
0.618
0.163
-0.218
0.636
0.088
2.348
-0.286
-0.329
-0.286
Totalunexplained
-0.134
-0.070
-0.247
-0.312
-0.297
-0.545
0.008
0.115
-0.074
-0.025
-0.191
-0.367
Source:Author's
RIFregressionsusingtheUKLFS,1998-2008
Note:O
thervariablesdummiesforcohorts
ofarrival.
30
happens in both periods. Before 2004, the part of the gap due to lower levels of experiencewas compensated by higher level of education. This does not happen after 2004, firstlybecause, especially at the top, there is a relative (to natives) decrease in the level of educationand secondly because the effect of British experience has become even more negative. Theother factors change similarly over the period in all the quantiles. As noted before, thecontribution of location is positive as immigrants are more present in high-pay regions, butthis contribution decreases after 2004 and more at the top. Before 2004, the total explainedgap was positive at every quantile and higher towards the top of the distribution, implyingthat if the same price function as natives was applied to them, the immigrant-native wagedifference would have been positive. After 2004, the explained component is larger at thebottom compared to the top. Once I control for occupations and industries (Model 2), theunexplained gap at the 20th and at the median are a bit closer in the two periods, but verydistant at the 90th quantile: the effect of the wage structure is more evident at the top end ofthe distribution and most of the gap cannot be explained by background characteristics. Thecontribution to the wage gap of a change in the coefficient of the variables is different at eachquantile. In both periods, the return to British experience is lower for EU8 immigrants atthe bottom of the distribution but higher when moving to the top. Interestingly, this returnplays an important and opposite role in explaining the gap at the 20th and at the 90thquantile, especially before 2004. However, this role largely decreases in the second periodas the contribution of the return to British experience becomes smaller due to an increasein the return for immigrants, especially at the bottom. British experience, especially forimmigrants, is much more valued, everything else equal, at the top of the distribution whereindividuals work in occupations where the knowledge of the local culture and norms, gainedwith time spent in the country are more important. The return to foreign experience play amuch larger and positive role at the top of the distribution, where differently from the resultsfor mean wage and the median, an increase is reported. Before the enlargement, the priceof education were higher at the top of the distribution, but, as the negative sign implies,much higher for natives. In the period after the enlargement, there is not much of a changein the coefficients for education at the bottom and at the top of the distribution, yet EU8workers in the middle of the distribution are the ones who experienced the most remarkabledecrease in the return to education. This decline is likely to be associated with a mismatchbetween workers education and the jobs they perform which is translated into lower wagesand lower returns to education, ceteris paribus. As reported in the panel on the right handside of the table (Model 2), the industry dummies play an important role. This mis-matchis more severe in the middle of the distribution. According to the data, after 2004 there aremore workers with tertiary education that have wages below the median compared to the
31

period before.
To sum up, while before 2004 in all parts of the distribution, because of the greater set ofendowments immigrants would earn more than natives, if their characteristics were rewardedin the same way, after 2004, estimation results suggest the opposite. As shown by the highand negative contribution of occupation along the whole distribution, EU8 are suffering froma very large occupational downgrading (see Table A3 in the Appendix). In addition, whilethe gap was more negative for the bottom percentile in the period before the enlargement,the opposite is true for the period after, where data show much higher gaps for workers atthe top and a large part of it still remain unexplained even after controlling for industry andoccupation.
Table 7 shows the same decomposition just explained for EU8 immigrants, for immigrantsfrom EU14 countries and all other immigrants using Model 2. EU14 immigrants are per-forming better than natives in all quantiles of the distribution, especially at the top. WhileI do not observe any change in the gap at the bottom over time, the gap above the medianslightly improves in favour of EU14 immigrant. Most of this is attributed to a change intotal unexplained part, therefore to a change in wage structure in particular at the 90thquantile. Specifically, there is a decrease in the difference in the return to education betweenimmigrants and natives, mainly due to both an increase in the level of education of EU14at the top and a slight decrease in the return to education for natives. The median behavessimilarly to the mean, and after 2004 I observe an increase in the wage gap in favour ofimmigrants, mainly ascribed to an increase in the relative level of education, which is likelyto have determined the improvement in the distribution of immigrants across occupationstowards better paid jobs, despite the relative decrease in the return to education. It is in-teresting to notice the sign on the contribution to British experience: it goes in the oppositedirection at each percentile if compared to EU8 immigrants (positive at the bottom andnegative at the top).
Moving the attention to other immigrants, the picture is reversed. Immigrants at the bottomstarted to suffer from a wage penalty which did not exist before 2004. Note that wages forall immigrant at each quantile have decreased and therefore the gap has worsened. Thisis mostly explained by the characteristics which are still better relative to natives in mostdimensions, in spite of the fact that they have worsened (mainly because of British experienceand occupations). By contrast, the unexplained component has improved at the 20th and90th deciles. For example, the difference in return to education has improved for workers atthe 90th percentile, yet most of this effect is offset by other factors, while below the median
32

Tab
le7:
Dec
ompo
siti
onof
nati
ves
and
imm
igra
nts
quan
tile
wag
ega
ps
EU14immigrantsvsnatives
Otherimmigrantsvsnatives
20th
50th
90th
20th
50th
90th
Before2004
After2004Before2004
After2004Before2004
After2004
Before2004After2004Before2004After2004Before2004After2004
Raw(unadjusted)gap
0.038
0.031
0.082
0.116
0.103
0.130
0.032
-0.003
0.086
0.048
0.117
0.091
BritishExperience
-0.068
-0.068
-0.083
-0.085
-0.118
-0.113
-0.050
-0.066
-0.061
-0.083
-0.091
-0.110
Education
0.042
0.043
0.078
0.082
0.175
0.155
0.042
0.043
0.078
0.083
0.174
0.156
MaritalStatus
-0.004
-0.003
-0.007
-0.006
-0.008
-0.007
0.001
0.001
0.001
0.003
0.002
0.004
Female
-0.007
-0.001
-0.008
-0.001
-0.007
-0.001
0.001
0.005
0.001
0.005
0.001
0.005
Location
0.040
0.030
0.059
0.056
0.061
0.071
0.056
0.038
0.081
0.074
0.079
0.087
Occupation
0.006
0.014
0.042
0.053
0.049
0.049
0.008
-0.003
0.034
0.023
0.034
0.022
Industry
-0.009
-0.009
-0.008
-0.008
0.007
0.009
-0.001
-0.004
-0.002
-0.005
0.006
0.004
TotalExplained
0.001
0.007
0.073
0.091
0.158
0.162
0.057
0.015
0.133
0.100
0.207
0.169
BritishExperience
-0.031
0.051
-0.010
0.034
-0.077
-0.121
-0.050
-0.066
-0.047
-0.027
-0.058
-0.016
ForeignExperience
0.031
0.043
0.039
0.037
0.139
0.171
0.022
0.028
0.040
0.040
0.115
0.127
Brit-foreignexpinteraction
-0.011
-0.017
-0.029
-0.016
-0.056
-0.082
-0.016
-0.013
-0.031
-0.028
-0.046
-0.057
Education
-0.001
0.016
-0.043
-0.122
-0.538
-0.390
-0.064
-0.136
-0.210
-0.284
-0.659
-0.521
MaritalStatus
-0.033
-0.028
-0.024
-0.033
-0.007
0.017
-0.072
-0.048
-0.059
-0.058
-0.032
-0.021
Female
0.040
0.024
0.040
0.039
0.014
0.003
0.051
0.041
0.047
0.043
0.021
0.026
Location
0.037
0.124
0.088
0.162
-0.055
-0.040
0.112
0.057
0.019
0.013
-0.246
-0.032
Occupation
-0.133
-0.244
-0.055
-0.044
0.084
0.553
-0.208
-0.100
-0.127
0.095
-0.118
0.169
Industry
-0.253
0.012
0.145
0.060
0.643
0.150
-0.195
0.250
0.088
0.253
0.471
0.155
Industry
-0.253
0.012
0.145
0.060
0.643
0.150
-0.195
0.250
0.088
0.253
0.471
0.155
Interceptandothervariables
0.391
0.043
-0.143
-0.091
-0.202
-0.293
0.394
-0.033
0.234
-0.098
0.461
0.093
Totalunexplained
0.037
0.023
0.009
0.025
-0.055
-0.032
-0.026
-0.018
-0.046
-0.052
-0.090
-0.078
Source:Author's
RIFregressionsusing
theUKLFS,1998-2008
Note:Othervariablesdum
miesforcohortsofarrival.
33

results suggest a decrease in the return to education for immigrants33.
5 Recent immigrants from European countries
In this section I look at recent immigrants. The aim of this section is to understand whetherthe large downgrading and wage deterioration reported for EU8 immigrants are simply dueto the lack of economic assimilation or by some other factors. In the former hypothesis,the wage structure across different immigrant groups should be very similar. I define recentimmigrants as those who arrived between 2004 and 2008, so anyone who has been in thecountry for a maximum of 4 years. I commence by describing their characteristics (Table8). Recent immigrants from EU14 have higher wages, almost 40% higher, they have lessexperience in the British labour market and they have more experience in the home countrylabour market than recent immigrants from the EU8. On average they are better educated asthey have stayed in school two years longer. There is a higher percentage of individuals withtertiary education, but EU8 immigrants are over-represented among those with secondaryeducation. EU14 are slightly older and more likely to be single. More than 60% of recentEU14 immigrants live in London or in the rest of the South East, which are among thewealthiest are in the UK. Only 13% of recent Eastern European immigrants live in London,a high portion lives in the South East as well, and the East Midlands. Other immigrantsare more similar in some of their characteristics to EU14: they ave a similar educationattainment and age. Yet they have more foreign experience, in higher percentage male andmore likely to be married. Alike EU14 they are more likely to live in London (mainly outer)and the South East.
Table 9 shows the decomposition of mean and quantiles for the two groups, where thereference group is British natives. Recent EU8 immigrants have in all cases lower wagesthan natives. The gaps are bigger than the ones observed in tables 5 and 6 and in particularare bigger at the top, while the mean and median gaps are similar. The decompositionresults lead to similar conclusions as before, with an increasing unexplained gap in theupper end. Other immigrants a slightly more similar to EU8 immigrants, as they sufferfrom wage penalties at the bottom quantiles, but they do have a wage advantage at the top.
33A negative contribution of the intercept is usually interpreted as discrimination in the race and genderliterature (see for example Altonji and Blank, 1999), as if there were not differences in composition and inthe wage structure a wage gap could only be interpreted as discrimination. I am not reporting results withthe intercept only as in the table, together with the intercept I also include dummies for cohort of arrival. Inall cases, the contribution of the intercept is negative, with the exception of the decomposition of the wagegap between EU8 immigrants and natives at the 90th quantile after 2004 and of the wage gap between EU14immigrants and natives in the 20th quantile.
34
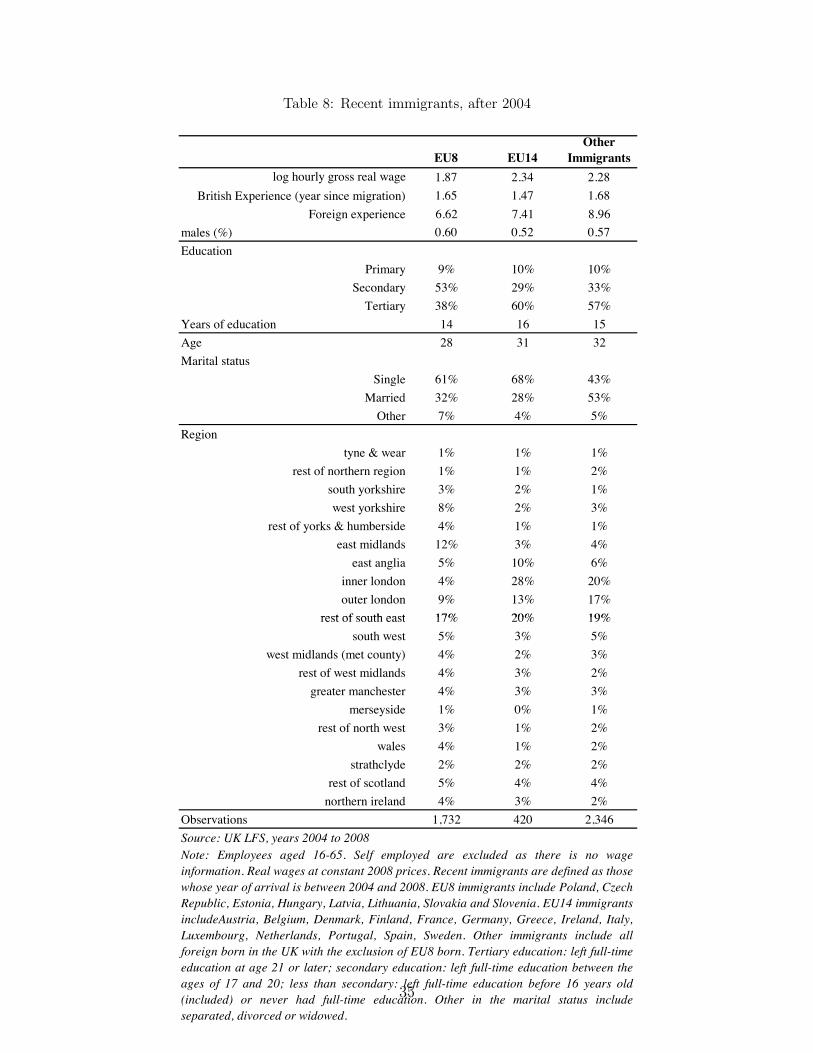
Table 8: Recent immigrants, after 2004
EU8 EU14Other
Immigrantslog hourly gross real wage 1.87 2.34 2.28
British Experience (year since migration) 1.65 1.47 1.68Foreign experience 6.62 7.41 8.96
males (%) 0.60 0.52 0.57Education
Primary 9% 10% 10%Secondary 53% 29% 33%Tertiary 38% 60% 57%
Years of education 14 16 15Age 28 31 32Marital status
Single 61% 68% 43%Married 32% 28% 53%Other 7% 4% 5%
Regiontyne & wear 1% 1% 1%
rest of northern region 1% 1% 2%south yorkshire 3% 2% 1%west yorkshire 8% 2% 3%
rest of yorks & humberside 4% 1% 1%east midlands 12% 3% 4%east anglia 5% 10% 6%
inner london 4% 28% 20%outer london 9% 13% 17%
rest of south east 17% 20% 19%rest of south east 17% 20% 19%south west 5% 3% 5%
west midlands (met county) 4% 2% 3%rest of west midlands 4% 3% 2%greater manchester 4% 3% 3%
merseyside 1% 0% 1%rest of north west 3% 1% 2%
wales 4% 1% 2%strathclyde 2% 2% 2%
rest of scotland 5% 4% 4%northern ireland 4% 3% 2%
Observations 1,732 420 2,346Source: UK LFS, years 2004 to 2008Note: Employees aged 16-65. Self employed are excluded as there is no wageinformation. Real wages at constant 2008 prices. Recent immigrants are defined as thosewhose year of arrival is between 2004 and 2008. EU8 immigrants include Poland, CzechRepublic, Estonia, Hungary, Latvia, Lithuania, Slovakia and Slovenia. EU14 immigrantsincludeAustria, Belgium, Denmark, Finland, France, Germany, Greece, Ireland, Italy,Luxembourg, Netherlands, Portugal, Spain, Sweden. Other immigrants include allforeign born in the UK with the exclusion of EU8 born. Tertiary education: left full-timeeducation at age 21 or later; secondary education: left full-time education between theages of 17 and 20; less than secondary: left full-time education before 16 years old(included) or never had full-time education. Other in the marital status includeseparated, divorced or widowed.
35

Results from EU14 are different and EU14 immigrants have lower wages than natives onlyat the 20th percentile. Specifically, immigrants at the bottom earn around 5% less thannatives, while those at the top earn almost 20% more than natives, even upon their arrival.Starting from the explained component, the main difference of EU8 from the other groupsis the very negative contribution of occupations and industry at all percentile which is notobserved in other groups (only at the bottom for other immigrants, but with a much smallereffect). As shown in Table A3 in the Appendix, almost 50% of EU8 recent immigrants workin elementary occupations and 20% as plant and machine operators. These percentagesare much higher if compared to natives but also with other immigrants, whose occupationaldistribution overall is more similar to that of native born. Also interesting it is the fact that atthe 90th percentile there is still 25% of EU8 immigrants that work in elementary occupations.Location is another difference with respect to other groups, as all other immigrants residein regions with higher wages, especially at the top. Moving the attention to the wagestructure, the total unexplained component is always positive, with the exception of theone of EU8 immigrants at the 90th,which is very negative, and a very large proportionof it is just explained by the very low return to education, which are observed for otherimmigrants at the same percentile but which are to a larger extent compensated by the verypositive contribution of foreign experience. Note that the return to foreign experience hasa very important a positive role in all groups and percentile, in particular at the top of thedistribution (as probably expected), but despite similar levels of foreign experience (in therange of 6-8 years on average), the value for this experience is values much less among EU8,ceteris paribus. This is an interesting result as it suggests that the hypothesis of that humancapital is not easily portable from Eastern European countries.
6 Robustness checks
Sample selectionTo reduce any selection problem due to individuals dropping out of the survey after wave 1,I run some robustness checks including only those workers who report their wage in the firstinterview as the information on wages is asked in wave 1 and and 5 (Longhi and Rokicka(2012); Drinkwater, Eade and Garapich (2009)). All the results are confirmed for EU8immigrants. The right panel of Table 10, reports these results. The only major differenceis the wage gap for the 50th and 90th percentile before 2004, but this only affects theunexplained component confirming the fact that there may be some selection bias in thecoefficients that can be ascribed to non-random attrition.
36
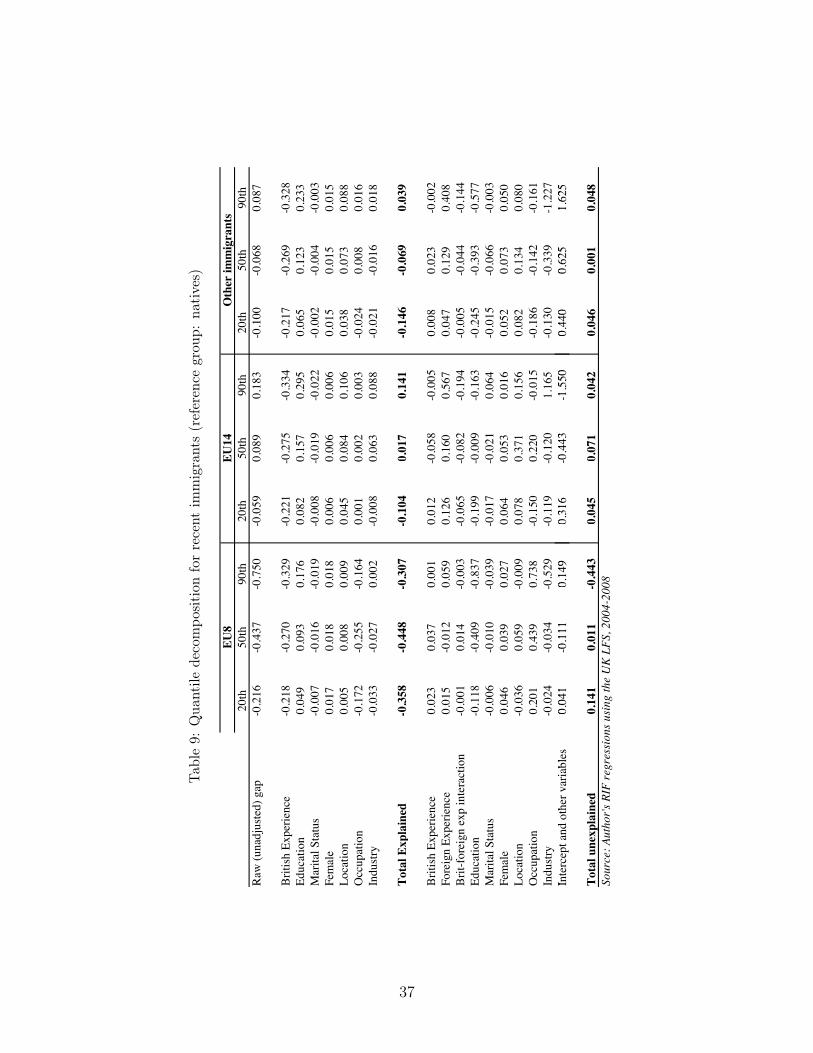
Tab
le9:
Qua
ntile
deco
mpo
siti
onfo
rre
cent
imm
igra
nts
(ref
eren
cegr
oup:
nati
ves)
EU8
EU14
Otherimmigrants
20th
50th
90th
20th
50th
90th
20th
50th
90th
Raw(unadjusted)gap
-0.216
-0.437
-0.750
-0.059
0.089
0.183
-0.100
-0.068
0.087
BritishExperience
-0.218
-0.270
-0.329
-0.221
-0.275
-0.334
-0.217
-0.269
-0.328
Education
0.049
0.093
0.176
0.082
0.157
0.295
0.065
0.123
0.233
MaritalStatus
-0.007
-0.016
-0.019
-0.008
-0.019
-0.022
-0.002
-0.004
-0.003
Female
0.017
0.018
0.018
0.006
0.006
0.006
0.015
0.015
0.015
Location
0.005
0.008
0.009
0.045
0.084
0.106
0.038
0.073
0.088
Occupation
-0.172
-0.255
-0.164
0.001
0.002
0.003
-0.024
0.008
0.016
Industry
-0.033
-0.027
0.002
-0.008
0.063
0.088
-0.021
-0.016
0.018
TotalExplained
-0.358
-0.448
-0.307
-0.104
0.017
0.141
-0.146
-0.069
0.039
BritishExperience
0.023
0.037
0.001
0.012
-0.058
-0.005
0.008
0.023
-0.002
ForeignExperience
0.015
-0.012
0.059
0.126
0.160
0.567
0.047
0.129
0.408
Brit-foreignexpinteraction
-0.001
0.014
-0.003
-0.065
-0.082
-0.194
-0.005
-0.044
-0.144
Education
-0.118
-0.409
-0.837
-0.199
-0.009
-0.163
-0.245
-0.393
-0.577
MaritalStatus
-0.006
-0.010
-0.039
-0.017
-0.021
0.064
-0.015
-0.066
-0.003
Female
0.046
0.039
0.027
0.064
0.053
0.016
0.052
0.073
0.050
Location
-0.036
0.059
-0.009
0.078
0.371
0.156
0.082
0.134
0.080
Occupation
0.201
0.439
0.738
-0.150
0.220
-0.015
-0.186
-0.142
-0.161
Industry
-0.024
-0.034
-0.529
-0.119
-0.120
1.165
-0.130
-0.339
-1.227
Interceptandothervariables
0.041
-0.111
0.149
0.316
-0.443
-1.550
0.440
0.625
1.625
Interceptandothervariables
0.041
-0.111
0.149
0.316
-0.443
-1.550
0.440
0.625
1.625
Totalunexplained
0.141
0.011
-0.443
0.045
0.071
0.042
0.046
0.001
0.048
Source:Author's
RIFregressionsusing
theUKLFS,2004-2008
37

Estimating the gap for men and women separatelyThe second check is to look at only men, because of participation issues that may drive theresults, as women decide to participate differently in the labour market. I observe a positivegap in all parts of the distribution for white male before the enlargement. This result wasalso confirmed in previous studies (Dustmann and Fabbri, 2005). Interestingly, deteriorationof the wage gap is even worse than in the pooled case, with EU8 immigrants earning morethan 30% less than British males on average and almost 50% less than British males at thetop. In terms of the decomposition, results are confirmed with immigrants at the top havinga larger unexplained component.
7 Summary and conclusions
In this paper I show that the wage gap between immigrants from Eastern European countriesand British natives has increased between the period before the enlargement and the periodafter because of a decrease in immigrant average wages, despite higher education levels. Idescribe how this gap has changed not only at the mean but also along the wage distribution.I show that distance between immigrant and native wages has increased more at the toppercentile. Looking at the simple mean would not allow me to identify how different factorsinfluenced the increase in the wage gap and relate it to the literature on migration. Moreover,in order to better understand how skills acquired in the EU8 countries before migrating aretransferable in the UK labour market, I divide labour market experience into foreign (toproxy experience in the home country) and British labour market. Foreign labour marketexperience has a much higher value for other immigrants. This result would point to thetheoretical explanation that skills acquired in the home country are not perfectly transferablein the destination country. In addition to this, in order to rule out the possibility that resultsare just a product of the fact that EU8 immigrants are recent arrival, I compare wage gapsalong the distribution with other recent immigrant groups. For EU8 immigrants a muchlarger proportion of the gap is explained by occupational downgrading in all parts of thedistribution, while for other immigrants this is not true. This results are in line with previousresults found in the literature on Eastern European immigrants. In particular, Mattoo et al,2008) argue that the low wage levels observed for immigrants from East Europe should not beconsidered a brain-waste, but, simply the consequence of the poor quality of education in thecountries of origin. As confirmed by Friedberg (2000), human capital is not portable acrosscountries and the degree of transferability also depends on how the quality of institutions inthe source country is perceived by employers in the destination country. This would explain
38

Tab
le10
:R
obus
tnes
sch
ecks
onm
ean
and
quan
tile
deco
mpo
siti
onfo
rE
U8
imm
igra
nts
EU8,onlywave1
EU8,onlymales
Mean
20th
50th
90th
Mean
20th
50th
90th
Before2004
After2004Before2004
After2004Before2004
After2004Before2004
After2004Before2004
After2004Before2004
After2004Before2004
After2004Before2004
After2004
Raw(unadjusted)gap
-0.091
-0.371
-0.039
-0.186
-0.103
-0.395
-0.048
-0.604
0.043
-0.435
0.022
-0.288
0.028
-0.467
0.096
-0.643
BritishExperience
-0.148
-0.334
-0.118
-0.275
-0.153
-0.350
-0.164
-0.357
-0.135
-0.388
-0.144
-0.401
-0.135
-0.400
-0.113
-0.320
Education
0.279
0.220
0.172
0.140
0.298
0.246
0.384
0.282
0.258
0.184
0.172
0.122
0.279
0.207
0.345
0.229
MaritalStatus
0.001
-0.017
0.001
-0.011
0.002
-0.022
0.001
-0.023
0.002
-0.034
0.002
-0.031
0.003
-0.045
0.002
-0.037
Female
-0.030
0.011
-0.029
0.010
-0.036
0.013
-0.031
0.012
Industry
0.084
0.032
0.068
0.021
0.094
0.036
0.097
0.044
0.066
0.016
0.058
0.013
0.068
0.015
0.079
0.019
TotalExplained
0.186
-0.087
0.094
-0.116
0.205
-0.076
0.288
-0.040
0.194
-0.223
0.090
-0.296
0.217
-0.224
0.315
-0.109
BritishExperience
-0.029
0.030
-0.164
-0.013
-0.152
0.004
0.540
0.040
0.066
0.003
0.063
-0.038
-0.034
0.005
0.497
0.138
ForeignExperience
0.059
0.068
-0.002
0.013
0.008
0.018
-0.003
0.191
0.085
0.096
0.067
0.035
0.106
0.029
0.121
0.248
Brit-foreignexpinteraction
-0.026
-0.024
-0.010
-0.005
0.043
-0.002
-0.052
-0.067
-0.078
-0.009
-0.049
0.001
-0.102
0.007
-0.173
-0.063
Education
-0.469
-0.718
-0.497
-0.566
-0.512
-1.069
-0.174
-0.378
-0.293
-0.533
-0.406
-0.515
-0.367
-0.902
-0.369
-0.020
MaritalStatus
0.003
-0.033
0.063
-0.015
-0.132
-0.027
-0.489
-0.085
-0.182
-0.069
-0.248
-0.067
-0.138
-0.073
-0.216
-0.085
Female
-0.030
0.039
0.012
0.062
0.097
0.063
-0.048
-0.011
Location
-0.241
-0.064
-0.192
-0.064
-0.324
0.070
-0.344
-0.177
0.019
-0.039
-0.146
-0.143
-0.236
0.044
1.058
0.198
Interceptandothervariables
0.455
0.417
0.658
0.517
0.663
0.625
0.234
-0.078
0.232
0.339
0.651
0.734
0.582
0.648
-1.137
-0.952
Totalunexplained
-0.278
-0.284
-0.132
-0.070
-0.308
-0.319
-0.336
-0.565
-0.151
-0.212
-0.068
0.008
-0.189
-0.243
-0.219
-0.535
Source:Author's
OLS
andRIFregressionsusingtheUKLFS,1998-2008
Note:O
thervariablesdummiesforcohorts
ofarrival.
39
the skill downgrading is larger for EU8 immigrants.The results that look at different points of the distribution also shed some light on why wealso observe a decrease in the wage level at the bottom of the distribution, in particularif compared to the period before. On one side, poor skill transferability can explain whysecondary and tertiary educated are observed in low paid jobs, thus why the wage levels atthe top of the distribution have decrease, but it would not explain the increase in the wagepenalty at the bottom. At the bottom of the distribution, immigrants should be more likelyto compete with natives for more similar jobs (mainly performing manual and routine tasks).This is because communication and cognitive skills, skills that may lack in immigrants whocannot speak the language or do not know the local culture, are not as much valued as atthe top of the distribution.
The nature of migration (EU8 immigrants are more likely to be temporary) can be an im-portant determinant of why also at the bottom wages have decreased. If compared to apermanent equivalent immigrant, temporary migrant are more likely to accept lower wages(i.e. they have lower reservation wages) and invest much less in human capital of the desti-nation country (Dustmann, 2000). Cam (2007) shows that EU8 workers are more likely towork under temporary contracts with respect to the rest of the UK. However whether thiscondition is decided by the immigrants with a strong desire to go back home or is simplydue to discrimination (or entry barriers in some occupations) is hard to identify.The changein the regional distribution of emigrants in the source country, which has been documentedfor Poland (Dustmann et al, 2012 and Rosso, 2013) could also explain why labour marketperformance of EU8 immigrants has become poorer over time, as explained in the introduc-tion. However, it is very hard to show just by using data from the destination country as noinformation on the region (and country) of previous residence is reported.
These findings have implications for policies for both the source and the destination country.Given that most of the occupational downgrading is a consequence of poor skill transfer-ability, the two countries could collaborate in order to improve the quality of education,in particular by, for example, making qualifications more transferable across countries, sothat education can be more easily exported in other destinations. On the other side, braindrain can be seen as an issue from the point of view of the source country, as increasing thestandard of education in the source country may simply induce an increase in emigrationwithout really benefiting the domestic labour market, at least in the short run (Mattoo etal (2008)). However, it is important to notice that there are indirect positive effects drivenby the increase in the probability of immigrants to enter high skilled occupations could also
40

benefit the source countries, through for example higher remittances or skill and technol-ogy acquisition. Further, a more direct intervention of the destination country governmentthat could enhance labour market integration and opportunities of immigrants from EasternEuropean countries would be to provide language classes to improve their communicationabilities (see Clark and Drinkwater, 2008).
References
Adsera, Alicia and BarryR. Chiswick. 2007. “Are there Gender and Country of OriginDifferences in Immigrant Labor Market Outcomes across European Destinations?” Journalof Population Economics 20 (3):495–526.
Altonji, Joseph G. and Rebecca M. Blank. 1999. “Race and Gender in the Labor Market.” InHandbook of Labor Economics, vol. 3, Part C, edited by Orley C. Ashenfelter and DavidCard. Elsevier, 3143–3259.
Antecol, Heather, Deborah A. Cobb-Clark, and Stephen J. Trejo. 2004. “Selective Immi-gration Policy in Australia, Canada, and the United States.” Brussels Economic Review47 (1):57–76.
Bell, Brian D. 1997. “The Performance of Immigrants in the United Kingdom: Evidencefrom the GHS.” The Economic Journal 107 (441):333–344.
Blanchflower, David G. and Helen Lawton. 2008. “The Impact of the Recent Expansion ofthe EU on the UK Labour Market.” IZA Discussion Paper No. 3695 .
Blanchflower, David G. and Chris Shadforth. 2009. “Fear, Unemployment and Migration.”The Economic Journal 119 (535):F136–F182.
Blinder, Alan S. 1973. “Wage Discrimination: Reduced Form and Structural Estimates.”The Journal of Human Resources 8 (4):436–455.
Boeri, Tito and Herbert Brücker. 2005. “Why are Europeans so Tough on Migrants?” Eco-nomic Policy 20 (44):629–703.
Boudarbat, Brahim and Thomas Lemieux. 2010. “Why are the Relative Wages of ImmigrantsDeclining? A Distributional Approach.” CLSRN, Working Paper No. 65 .
Brenke, Karl, Mutlu Yuksel, and Klaus F. Zimmermann. 2009. “EU Enlargement underContinued Mobility Restrictions: Consequences for the German Labor Market.” IZADiscussion Paper No. 4055 .
41

Cam, Surhan. 2007. “Temporary employment among the EU migrants (’Eastern Europeans’)in Britain.” Tech. Rep. Working Paper 86, School of Social Sciences, Cardiff University,Cardiff. 00000.
Chiswick, Barry R. 1980. “The Earnings of White and Coloured Male Immigrants in Britain.”Economica 47 (185):81–87.
———. 1991. “Speaking, Reading, and Earnings among Low-Skilled Immigrants.” Journalof Labor Economics 9 (2):149–170.
Chiswick, Barry R., Yinon Cohen, and Tzippi Zach. 1997. “The Labor Market Status ofImmigrants: Effects of the Unemployment Rate at Arrival and Duration of Residence.”Industrial and Labor Relations Review 50 (2):289–303.
Chiswick, Barry R. and Paul W. Miller. 1995. “The Endogeneity between Language andEarnings: International Analyses.” Journal of Labor Economics 13 (2):246–288.
———. 2009. “The International Transferability of Immigrants’ Human Capital Skills.”Economics of Education Review 28 (2):162–169.
Clark, Ken and Stephen Drinkwater. 2008. “The Labour Market Performance of RecentMigrants.” Oxford Review of Economic Policy 24 (3):495–516.
D’Amuri, Francesco and Giovanni Peri. 2013. “Immigration, Jobs and Labor Market Insti-tutions: Evidence from Europe.” Journal of European Economic Association, forthcoming00005.
Dawson, Christopher, Andrew Henley, and Paul L. Latreille. 2009. “Why Do IndividualsChoose Self-Employment?” IZA Discussion Papers No. 3974 .
Dobson, John R. 2009. “Labour Mobility and Migration within the EU following the 2004Central and East European Enlargement.” Employee Relations 31 (2):121 – 138.
Drinkwater, Stephen, John Eade, and Michal Garapich. 2009. “Poles Apart? EU Enlarge-ment and the Labour Market Outcomes of Immigrants in the United Kingdom.” Interna-tional Migration 47 (1):161–190.
Dustmann, Christian. 1993. “Earnings Adjustment of Temporary Migrants.” Journal ofPopulation Economics 6 (2):153–168.
———. 1994. “Speaking Fluency, Writing Fluency and Earnings of Migrants.” Journal ofPopulation Economics 7:133–156.
42
———. 1999. “Temporary Migration, Human Capital, and Language Fluency of Migrants.”Scandinavian Journal of Economics 101 (2):297–314.
———. 2000. “Temporary Migration and Economic Assimilation.” IZA Discussion PaperNo. 186 Cited by 0000.
Dustmann, Christian and Francesca Fabbri. 2003. “Language Proficiency and Labour MarketPerformance of Immigrants in the UK.” The Economic Journal 113 (489):695–717.
———. 2005. “Immigrants in the British Labour Market.” Fiscal Studies 26 (4):423–470.
Dustmann, Christian, Tommaso Frattini, and Caroline Halls. 2010. “Assessing the FiscalCosts and Benefits of A8 Migration to the UK.” Fiscal Studies 31 (1):1–41.
Dustmann, Christian, Tommaso Frattini, and Ian Preston. 2013. “The Effect of Immigrationalong the Distribution of Wages.” The Review of Economic Studies 80 (1):145–173.
Dustmann, Christian, Tommaso Frattini, and Anna Rosso. 2012. “The Effect of Emigrationfrom Poland on Polish Wages.” CReAM DP 29/12 .
Duvell, Franck. 2004. “Polish Undocumented Immigrants, Regular High-Skilled Workers andEntrepreneurs in the UK. A Comparative Analysis of Migration Patterns, Strategies andIdentity Process.” Prace Migracyjne, nr 54, Institute for Social Studies, Warsaw Universtiy.
Firpo, Sergio, Nicole M. Fortin, and Thomas Lemieux. 2009. “Unconditional Quantile Re-gressions.” Econometrica 77 (3):953–973.
Fortin, Nicole, Thomas Lemieux, and Sergio Firpo. 2011. “Decomposition Methods in Eco-nomics.” In Handbook of Labor Economics, vol. Volume 4, Part A, edited by Orley Ashen-felter and David Card. Elsevier, 1–102.
Friedberg, Rachel M. 2000. “You Can’t Take It with You? Immigrant Assimilation and thePortability of Human Capital.” Journal of Labor Economics 18 (2):221–251.
Gilpin, Nicola, Matthew Henty, Sara Lemos, Jonathan Portes, and Chris Bullen. 2006. “TheImpact of Free Movement of Workers from Central and Eastern Europe on the UK LabourMarket.” Working Paper 29, Department of Work and Pensions, London.
Green, David A. and Christopher Worswick. 2004. “Entry Earnings of Immigrants Men inCanada: The Roles of Labour Market Entry Effects and Returns to Foreign Experience.”Manuscript, University of British Columbia.
43
Heywood, John S. and Daniel Parent. 2012. “Performance Pay and the White-Black WageGap.” Journal of Labor Economics 30 (2):249–290.
Home-Office. 2009. “Accession Monitoring Report, May 2004-December2008, A8 Countries.” Tech. rep., UK Border Agency, available athttp://www.ukba.homeoffice.gov.uk/sitecontent/documents/aboutus/reports/accession_monitoring_report/report18/may04-dec08?view=Binary.
Hunt, Priscilla. 2012. “From the Bottom to the Top: a more Complete Picture of theImmigrant-Native Wage Gap in Britain.” IZA Journal of Migration 1 (9).
Longhi, Simonetta and Magdalena Rokicka. 2012. “European Immigrants in the UK beforeand after the 2004 Enlargement: Is there a Change in Immigrant Self-Selection?” ISERWorking Paper Series No.2012-22 .
Manacorda, Marco, Alan Manning, and Jonathan Wadsworth. 2012. “The Impact of Immi-gration on the Structure of Wages: Theory and Evidence from Britain.” Journal of theEuropean Economic Association 10 (1):120–151.
Manning, Alan and Barbara Petrongolo. 2008. “The Part-Time Pay Penalty for Women inBritain.” The Economic Journal 118 (526):F28–F51.
Mattoo, Aaditya, Ileana Cristina Neagu, and Caglar Ozden. 2008. “Brain Waste? EducatedImmigrants in the US Labor Market.” Journal of Development Economics 87 (2):255–269.
Oaxaca, Ronald. 1973. “Male-Female Wage Differentials in Urban Labor Markets.” Interna-tional Economic Review 14 (3):693–709.
Oaxaca, Ronald L. and Michael R. Ransom. 1999. “Identification in Detailed Wage Decom-positions.” The Review of Economics and Statistics 81 (1):154–157.
OECD. 2012. “Settling In: OECD Indicators of Immigrant Integration 2012.” Tech. rep.
ONS. 2011. “Non-UK born workers -2011.” available athttp://www.ons.gov.uk/ons/dcp171776_234559.pdf.
Parutis, Violetta. 2011. “Economic Migrants or Middling Transnationals? East EuropeanMigrants Experiences of Work in the UK.” International Migration .
Peri, Giovanni, Gianmarco IP Ottaviano, and Greg C. Wright. 2013. “Immigration, Off-shoring and American Jobs.” American Economic Review, forthcoming .
44

Peri, Giovanni and Chad Sparber. 2009. “Task Specialization, Immigration, and Wages.”American Economic Journal: Applied Economics 1 (3):135–169.
Pollard, Naomi, Maria Latorre, and Dhananjayan Sriskandarajah. 2008. “Floodgates orTurnstiles: Post-EU Enlargement Migration Flows to (and from) the UK.” Tech. rep.,Institute for Public Policy Research, London.
Rincón-Aznar, Ana and Lucy Stokes. 2011. “Local Geography of International Migration tothe UK.” Tech. rep., Department for Communities and Local Government, London.
Rivera-Batiz, Francisco L. 1990. “English Language Proficiency and the Economic Progressof Immigrants.” Economics Letters 34 (3):295–300.
Rosso, Anna. 2013. “Understanding migrant selection: the case of Poland.” Mimeo, Univer-sity College of London.
Saleheen, Jumana and Chris Shadforth. 2006. “The Economic Characteristics of Immigrantsand their Impact on Supply.” Bank of England Quarterly Bulletin Q4:375–385.
Trejo, Stephen J. 1997. “Why Do Mexican Americans Earn Low Wages?” Journal of PoliticalEconomy 105 (6):1235–1268.
Trevena, Paulina. 2009. “’New’ Polish migration to the UK: A synthesis of existing evidence.”ESRC Centre for Population Change Working Paper 3/2009 :35.
45

A Appendix Tables
Table A.1: Participation, employment and unemployment rates, before and after 2004
Before 2004 After 2004
UK natives EU8 Otherimmigrants EU14 UK natives EU8 Other
immigrants EU14
Participation rate 78% 67% 71% 79% 79% 87% 73% 81%Employment rate 74% 62% 65% 75% 75% 81% 68% 77%
Unemployment rate 5% 7% 8% 6% 5% 6% 7% 5%Source: UK LFS 1998 to 2008Note: Participation rate is defined as the ratio between the labour force and the working age population; employment rate isdefined as the ratio between the number of employed (including self-employed) and the working age population; theunemployment rate is defined as the ratio between the number of unemployed and the labour force. The labour force is given bythe number of employed plus the number of unemployed. The working age population includes those who are inactive.
Table A.2: Share of EU8 immigrants by country of birth and average wages, before and after 2004
Before 2004 After 2004% mean wages % mean wages
Hungary 20% 2.07 3% 2.05Poland 43% 2.31 67% 1.98Czech Republic 12% 1.96 6% 2.10Estonia 2% 2.30 1% 2.08Lithuania 9% 2.19 9% 1.88Latvia 3% 2.22 3% 1.90Slovak Republic 10% 1.73 10% 1.89Slovenia 1% 2.60 0% 2.30Source: UK LFS, years 1998 to 2008Note: mean of log hourly wages in real terms. Only employed are included tocompute the shares
46

Tab
leA
.3:
Occ
upat
iona
ldis
trib
utio
nat
the
20th
and
90th
perc
enti
leaf
ter
2004
Natives
Recent
All
Recent
All
Recent
All
Natives
Recent
All
Recent
All
Recent
All
Legislatorsandmanagers
5.57
0.51
0.85
5.19
6.29
3.01
4.59
33.33
3.56
9.82
32.52
34.7
27.71
28.75
Professionals
2.89
0.26
0.66
3.46
5.06
3.02
3.4
37.52
11.88
21.19
47.97
44.8
46.68
47.24
Technicians
6.19
1.4
1.69
8.23
7.33
3.92
5.47
14.8
6.41
9.17
13.82
12.3
17.84
14.08
Clerks
22.13
3.06
4.41
12.12
18.85
9.05
15.03
4.63
5.94
11.76
4.07
4.16
3.61
4.95
Serviceandsalesworkers
27.34
17.73
21.69
30.74
30.81
37.19
31.12
3.18
9.5
8.27
0.81
1.59
1.33
1.76
Agriculturalandfisheryworkers
0.88
0.13
0.28
0.36
0.1
0.31
0.03
0.26
Craftsandrelatedtradesworkers
7.66
8.04
7.51
5.19
5.27
2.61
5.29
3.99
12.35
10.47
0.81
1.65
1.71
1.82
Plantandmachineoperators
10.27
20.92
19.53
9.09
7.43
9.75
11.63
1.63
25.18
13.57
0.43
0.19
0.75
Elementaryoccupations
17.06
47.96
43.38
25.97
18.6
31.36
23.16
0.9
25.18
15.5
0.37
0.95
0.65
Source:U
KLFS,years1998to2008
EU14
OtherImmigrants
90th
Note:Em
ployeesaged16-65.Selfemployedareexcludedasthereisno
wageinformation.Realwagesatconstant2008
prices.EU8immigrantsincludePoland,CzechRepublic,Estonia,Hungary,Latvia,
Lithuania,SlovakiaandSlovenia.E
U14
immigrantsincludeAustria,Belgium,D
enmark,Finland,France,G
ermany,Greece,Ireland,Italy,Luxembourg,Netherlands,Portugal,Spain,Sweden.O
ther
immigrantsincludeallforeign
bornintheUKwith
theexclusionofEU
8born.Recentimmigrantsaredefinedasthosewhoseyearofarrivalisbetween2004
and2008.
20th
EU8
EU14
OtherImmigrants
EU8
47

For more information, please contact [email protected]
LLAKES CentreInstitute of Education
20 Bedford WayWC1H 0AL
London UK
