ski*hi home-based
TRANSCRIPT

DOCUMENT Ktbunt
ED 349'750 EC 301 496
AUTHOR Strong, Carol J.; And OthersTITLE SKI*HI Home-Based Programming for Children with
Hearing Impairments: Demographics, ChildIdentification, and Program Effectiveness,1979-1991.
INSTITUTION Utah State Univ., Logan. Dept. of CommunicativeDisorders.
SPONS AGENCY Office of Special Education and RehabilitativeServices (ED), Washington, DC.
PUB DATE Aug 92CONTRACT H023C90117NOTE 370p.AVAILABLE FROM SKI*HI Institute, Department of Communicative
Disorders, Utah State University, Logan, UT84322-1900.
PUB TYPE Reports Descriptive (141) ReportsResearch /Technical (143)
EDRS PRICE MFO1 /PC15 Plus Postage.DESCRIPTORS Auditory Perception; *Cognitive Development;
Communication Skills; *Early Intervention; ExpressiveLanguage; *Handicap Identification; Hearing Aids;*Hearing Impairments; *Home Programs;Interdisciplinary Approach; *Language Acquisition;Parent Child Relationship; Parent Education; ParentParticipation; Preschool Education; ProgramEffectiveness; Receptive Language; Screening Tests;Vocabulary Development
IDENTIFIERS Early Identification; *SKI HI Program
ABSTRACT
SKI*HI is a program designed to identify childrenwith hearing impairments as early as possible and to provide them andtheir families with complete home programming that will facilitatedevelopment. The delivery model includes identification/screeningservices, home visit services, support services, and programmanagement. A parent advisor makes weekly home visits to families andworks closely with parents and other members of a multidisciplinaryteam to assess, plan, and provide appropriate home-based services forall family members. Data concerning demographic characteristics,testing, identification procedures, and program placement weregathered for 5,178 hearing-impaired preschool children and theirfamilies in the SKI*HI program and entered into the SKI*HI NationalData Bank. Analysis and synthesis of these data were then conductedto study the relationship of child achievement and home-basedintervention, the effectiveness of identification procedures forhearing loss, and impact of home-based intervention on languagedevelopment. The study concluded that the major accomplishments ofSKI*HI were: (1) SKI*HI children showed higher rates of developmentduring intervention than prior to intervention and greater gains inreceptive and expressive language development than would be expecteddue to maLuration aione; (2) SKI'al chilaren showed increasedauditory, communication/language, and vocabulary developmental levelsand increased full-time hearing aid use; (3) SKI*HI parents showedincreased ability to manage their child's hearing handicap,communicate meaningfully with their child, and promote their child'scognitive development; and (4) SKI*HI children were identified at anearly age and began to receive home programming services promptlyafter identification. Appendixes contain data sheets, data codingconventions, a questionnaire, and other project administrationmaterials. (Contains approximately 85 references, and 150 tables.)(JDD)

U.S. DEPARTMENT OF EDUCATIONOffice of Educatronat Research and Improvrne
EDUCATIONAL RESOURCES INFORMATICCENTER (ERIC)
0101:rs document has been reproducedrecorsed born the person or organizationginating it
O Minor changes have been made to =pmrepro Suction Quality
Pori rts of view or opinions stated in this dome it do not necessarily represent ONOE 1t positron or policy
SKI*HI HOME-BASED PROGRAMMING FOR CHILDREN WITH HEARING IMPAIRMENTS:
DEMOGRAPHICS, CHILD IDENTIFICATION, AND PROGRAM EFFECTIVENESS,
1979-1991
A Three-Year Study Conducted by the SKI*HI Institute
August, 1992
Carol J. Strong, EdD
Thomas C. Clark, PhD
Donald G. Barringer, PhD
Beth E. Walden, BS
Sue A. Williams, BS
Available from:SKI*HI Institute
Department of Communicative DiscrdersUtah State University
Logan, Utah 84322-1900
Funded by
U. S. DEPARTMENT OF EDUCATION
OFFICE OF SPECIAL EDUCATION AND REHABILITATIVE SERVICES
RESEARCH IN EDUCATION OF THE HANDICIAPPED
FIELD-INITIATED RESEARCH
Project No. H023C90117
The findings, conclusions, opinions, and recommendationsin this report are those of the authors and do notnecessarily reflect the views of the funding agency.
0ti

ABSTRACT
SKI*HI Home-Based Programming for Children with Hearing Impairments:Demographics, Child Identification, and Program Effectiveness,
1979-1991
Carol J. Strong, Thomas C. Clark,Donald G. Barringer, Beth E. Walden, and Sue A. Williams
SKI*HI is a home-based program for infants and young children with
hearing impairments and for their families. The major goals of the program
are to identify hearing-impaired children as close to birth as possible and to
provide them and their families with complete home programming that will
facilitate development. The delivery model for the program includes
identification/screening services, home-visit services, support services, and
program management. The "heart" of the service is provided by a parent
advisor, who makes weekly home visits to families. The parent advisor works
closely with parents and with other members of a multi-disciplinary team to
assess, plan, and provide appropriate home-based services for all family
members.
The SKI*HI National Data Bank was initiated in 1979 and by the
completion of this investigation contained information on more than 5,000
hearing - impaired children (ages 0 through 5 years of age) and their families.
The problem addressed by this research project was the lack of a complete
analysis and synthesis of the information in the National Data Bank for
educators of children with hearing impairments and for researchers. The
specific objectives were (a) to describe the demographic characteristics of
the children who received home-based intervention and to study the
relationship of these characteristics with child achievement; (b) to study the
effectiveness of identification procedures for hearing loss; and (c) to
investigate aspects of home-based intervention, including amount, intensity,
and time of program start, on the language development of infants and young
children with hearing impairments.
A pretest/posttest, single-group design was used rather than a
comparison-group design. To control for maturation, the pre/post gains of the
children were studied using predictive models. From July 1979 through June
3

1991, personnel from 143 different agencies, representing 30 states and one
Canadian province, submitted data on 5,178 hearing-impaired children (ages 0
through 5 years) and on their families. All data submitted to the National
Data Bank were included in the analyses. For the identification-procedure
data and for the follow-up data related to placement after SKI*HI, personnel
from 45 different agencies, representing 15 states, submitted data fv.: 1,404
children. These data were collected for the July 1986 through June 1989
program years.
Demographic, test, and parent/child data were collected using the SKI*HI
Data Sheet. Identification-procedure and program-placement data were
collected using a questionnaire specifically developed for the study. The
standardized language-assessment instrument was the Language Development
scale. Demographic, test, and parent/child data were collected by trailed
parent advisors and were submitted to the site coordinators, who then
submitted the data to the National Data Bank. Identification-procedure and
program-placement data were collected by the site coordinators and then were
submitted to the National Data Bank. All data coding and entry was checked
for accuracy.
The major accomplishments of SKI*HI were (a) that SKI*HI children showed
higher rates of development during intervention than prior to intervention and
greater gains in receptive and expressive language development than would be
expected due to maturation alone (in addition to which they showed pre- to
posttest developmental gains that were statistically significant and that
yielded effect sizes indicating important practical effects); (b) that SKI*HI
children showed increased auditory, communication-language, and vocabulary
developmental levels and increased full-time hearing aid use; (c) that SKI*HI
parents showed increased ability to manage their child's hearing handicap,
communicate meaningfully with their child, and promote their child's cognitive
development; and (d) that SKI*HI children were identified at an early age and
began to receive home programming services promptly after identification.
(331 pages)
ii
4

DEDICATION
To the children in the SKI*HI network

ACKNOWLEDGEMENTS
The authors wish to acknowledge the contributiono ofDorothy Johnson, James P. Shaver, and Sue Watkins fortheir advice and consultation throughout the durationof this research project; Skip Reese and the UtahParent/Infant Program for participating in the pilotstudy of the identification-procedure questionnaire;David Walden for donating computer-consultationexpertise and time; and Will Pitkin for his helpfulcomments on a draft of the manuscript.
iv
6

TABLE OF CONTENTS
Pace
ABSTRACT i
DEDICATION iii
ACKNOWLEDGEMENTS iv
LIST OF TABLES ix
LIST OF FIGURES xvii
CHAPTER 1: INTRODUCTION 1
Background, the Problem, and Description of the Data Bank . 2
CHAPTER 2: REVIEW OF THE LITERATURE 5
Demographics 5Identification Procedures 7
Hearing Screening Techniques 9Summary 14
Program Effectiveness 14
Summary 15
CHAPTER 3: GENERAL PURPOSES, RESEARCH QUESTIONS, AND RESEARCHVARIABLES 16
Demographics 18
Child-Status Variables 18Family-Status Variables 20
Identification Procedures 20
Identification Variables 21
Program Effectiveness 24
Treatment Variations 24Additional Services 25Child Outcomes 25Parent Outcomes 27Community Outcomes 28
CHAPTER 4: PROCEDURES 29
Design 29Subjects 29
Target and Accessible Populations 29Sample 30
Instrumentation 30
Language-Developmeni. S:ale 30SKI*HI Data Sheet 32
ry

REAP Questionnaire 33
Data Collection 35
SKI*HI Data Sheet 35
REAP Questionnaire 36
Data Analysis 36
Summary 39
CHAPTER 5: DEMOGRAPHIC CHARACTERISTICS OF THE SUBJECTS 40
Child-Status Variables 41
Gender 41Ethnicity 43Other Handicapping Conditions 46Type of Hearing Loss 50Severity of Hearing Loss 54Cause of Hearing Loss 60Age at Onset of Hearing Loss 69
Family-Status Variables 73
Language Spoken in the Home 73
Hearing-Impaired Parent(s) 77
Relationship Between Demographic Variables and PretestReceptive and Expressive Language Quotients 84
Gender 87Ethnicity 87Other Handicap 88Type of Hearing Loss 88Severity of Hearing Loss 89Cause of Hearing Loss 89Age at Onset of Hearing Loss 89Language Spoken in the Home 90Presence of Hearing-Impaired Parent 90Summary of Relationships Between DemographicVariables and Language Quotients 90
Summary
CHAPTER 6: EARLY IDENTIFICATION: THE RESULTS
91
93
Age and Time-Interval Variables--SKI*HI Overall 97
Age of Identification 97Identification-Age Summary 108Age at Program Start 109Program-Start-Age Summary 117Age Hearing Aid Fit 117Hearing-Aid-Fit-Age Summary 125Suspicion-to-Identification Time Interval 125Suspicion-to-Program-Start-Interval Summary 132Identification-to-Program-Start Time Interval 132Identification-to-Program-Start-Time-Interval Summary 139Suspicion-to-Program-Start Interval 139Suspicion -to- Program- Start -Time- Interval Summary. . 145
Who Suspected the Hearing Loss and Cause of Suspicion . . . . 146
vi

Who Suspected the Hearing Loss 146What Caused the Suspicion 150Who Suspected and Cause-of-Suspicion Summary 152
Identification Procedures 153
High-Risk Register 153NICU 154Relative Frequencies for Each Identification Procedure 156Ages and Time Intervals 157Summary 161
Relationships Among the Age and Time-Interval Variables . . 162
Correlation Coefficients 162
Predicting Pretest Language Quotients 163
Descriptive Statistics for Expressive and ReceptiveLanguage Quotients 164Multiple Regression 164Summary 166
Summary 167
CHAPTER 7: PROGRAM EFFECTIVENESS: THE RESULTS 171
Mediator Variables 172
Treatment Amount 172Treatment Density 178Communication Methodology 185Summary of Relationships Between Treatment Variablesand Demographic Variables 192Additional Services 193
Pre-, Post-, and Predicted Language Scores 1S'.4
Proportional Change Indices (PCIs) 196
Gender 197Ethnicity 198Other Handicaps 200Type of Hearing Loss 201Severity of Hearing Loss 203Cause of Hearing Loss 205Age at Onset 207Language Spoken in the Home 209Parental Hearing Loss 211Treatment Amount 212Treatment Density 214Communication Methodology 216Summary for Pre-, Post-, and Predicted Language Gainsand PCIs 217
Value-Added Analysis 219Predicting Posttest Scores 220Child Outcomes 223
Level of Hearing-Aid Use 223Threshold Improvement 226Auditory Development 227Communication-Language Development 230
vii

Vocabulary Development
Parent Outcomes
232
233
Hearing-Aid Skills 234Auditory Skills 234Communication Skills 234Aural/Oral Skills 234Total Communication Skills 236Cognition Skills 236
Follow-up Data 236
Placement Immediately After Home-Based Programming. 237Current Placement 239
Internal and External Validity 239Summary 242Chapter Concluding Statement 244
CHAPTER 8: SUMMARY, CONCLUSIONS, AND DISSEMINATION OF FINDINGS . 245
Study Overview 245
Purpose 245Design 246Sample 246Instruments and Procedures 246Data Collection 246Data Analysis 247
Results and Conclusions 247
Demographic 247Identification Procedures 252Program Effectiveness 254
Dissemination of Findings 257
Dissemination Activities Accomplished 257Dissemination Activities Planned 258
Concluding Statement 258
REFERENCES 260
APPENDICES 266
A. SKI*HI Data Sheet 267B. Step-By-Step Guide to Completion and Submission of
SKI*HI Data Sheet 269C. SKI*HI Data Coding Instrument 278D. SKI*HI Data Coding Conventions 280E. SKI*HI Institute: REAP Questionnaire 288F. Questionnaire Data Coding Conventions 290G. Personnel Description: Utah Parent/Infant Program
Parent Advisors-1990-1991 297H. SKI*HI Data Research, 1989-92: Participation Response
Form 298I. Example of Letter to Sites 299J. Site Report Example 302
viii

Table
1
2
LIST OF TABLES
Paae
Demographic Information Provided by the Center For Assessmentand Demographic Studies at Gallaudet University for the Year1990-91 6
Location, Number of Sites, and Number of Children in theNational Data Bank Between 1979 and 1991, Ages Birth ThroAgh72 Months at Program Start
3 Frequencies and Percentages of Children by Gender, 197
4 Frequencies and Percentages of Gender, Overall and byProgram-Start Year 42
5 Frequencies and Percentages of Children by Ethnicity, 1979-1991 43
6 Frequencies and Percentages of Children by Ethnicity, Overalland by Program-Start Year 44
31
9-1991 . . 41
7 Frequencies and Percentages of Males and Females byEthnicity, 1979-1991
8
9
10
11
12
13
14
15
16
17
18
19
Frequencies and Percentages of Children by Presence ofOther Handicaps, 1979-1991
Frequencies and Percentages of ChildrenOverall and by Program-Start Year
With other Handicaps,
Frequencies and Percentages of Childrenby Child's Gender, 1979-1991
with Other Handicaps
Frequencies and Percentages of Children with Other Handicapsby Child's Ethnicity, 1979-1991
Frequencies and Percentages of Children by Type of HearingLoss, 1979-1991
Frequencies and Percentages of Children by Type of HearingLoss, Overall and by Program-Start Year
Frequencies and Percentages of Children With and WithoutOther Handicaps by Type of Hearing Loss, 1979-1991
Frequencies and Percentages of Children by Ethnicity andType of Hearing Loss, 1979-1991
Frequencies and Percentages of Children by Severity of UnaidedHearing Loss, 1979-1991
Frequencies and Percentages of Children by Severity ofUnaided Hearing Loss, Overall and by Program-Start Year
FrequenciesSeverity of
FrequenciesSeverity of
and Percentages of Male and Female Children byUnaided Hearing Loss, 1979-1991
and Percentages of Children by Ethnicity andUnaided Hearing Loss, 1979-1991
ix
it
45
46
47
48
49
50
51
52
53
55
56
57
58

20 Frequencies and Percentages of Children with the Presenceof Another Handicap by Severity of Unaided Hearing Loss,1979-1991 59
21
22
23
24
25
26
27
28
Frequencies and Percentages of Children by Type of HearingLoss and Severity of Hearing Loss, 1979-1991 60
Frequencies and Percentages of Children by Cause of HearingLoss, 1979-1991 61
Frequencies and Percentages of Children by Cause of HearingLoss, Overall and by Program-Start Year 62
Frequencies and Percentages of Children by Gender and Causeof Hearing Loss, 1979-1991 64
Frequencies and Percentages of Children by Ethnicity andCause of Hearing Loss, 1979-1991 65
Frequencies and Percentages of Children by Presence of AnotherHandicap and Cause of Hearing Loss, 1979-1991 66
Frequencies and Percentages of Children by Type of HearingLoss and Cause of Child's Hearing Loss, 1979-1991 67
Frequencies and Percentages of Children by Severity and Causeof Hearing Loss, 1979-1991 68
29 Age at Onset of Hearing Loss, 1979-1991 69
30 Frequencies and Percentages of Children by Age at Onset ofHearing Loss, Overall and by Program-Start Year 71
31
32
33
34
35
36
37
38
39
40
Frequencies and Percentages of Children by Severity ofHearing Loss and Age at Onset of Hearing Loss, 1979-1991 . . . . 72
Frequencies and Percentages or Children by Language Spokenin the Home, 1979-1991 73
Frequencies and Percentages of Children by Language Spokenin the Home, Overall and by Program-Start Year 74
Frequencies and Percentages of Children by Language andSeverity of Unaided Hearing Loss, 1979-1991 75
Frequencies and Percentages of Childrenand Cause of Hearing Loss, 1979-1991
by Home Language
Frequencies and Percentages of Children by Presence ofHearing-Impaired Parent, 1979-1991 78
76
Frequencies and Percentages of Children with At Least OneHearing-Impaired Parent, Overall and by Program-Start Year . . . 79
Frequencies and Percentages of Children with At Least OneHearing-Impaired Parent by Child's Gender, 1979-1991 80
Frequencies and Percentages of Children with At Least OneHearing-Impaired Parent by Child's Ethnicity, 1979-1991 80
Frequencies and Percentages of Children with At Least One Hearing-Impaired Parent by Presence of Other Handicaps, 1979-1991. . . . 81

41 Frequencies and Percentages of Children with At Least One Hearing-Impaired Parent by Type of Hearing Loss, 1979-1991 81
42 Frequencies and Percentages of Children with a Hearing-Impaired Parent by Severity of Unaided Hearing Loss, 1979-1991 . 82
43 Frequencies and Percentages of Children With at Least OneHearing-Impaired Parent by Cause of Hearing Loss, 1979-1991. . . 83
44 Frequencies and Percentages of Children with At Least OneHearing-Impaired Parent by Language Spoken in the Home 84
45 Relationship Between Demographic Variables and PretestReceptive and Expressive l'nguage Quotients 86
46 Frequencies and Percentages of Children by State for Those SitesVolunteering to Participate in Identification-Procedure Study,1986-1989 94
47 Mean, Standard Deviation, and Median Age (inChildren Were Identified as Having a HearingProgram-Start Year
48
49
50
51
52
53
54
55
56
57
58
59
60
Months) at Which theLoss, Overall and by
98
Mean, Standard Deviation,Sex, 1979-1991
and Median Ages of Identification by
Mean, Standard Deviation,Ethnicity, 1979-1991
and Median Ages of Identification by
Mean, Standard Deviation, and Median Ages of Identificationby Presence of Other Handicaps, 1979-1991
Mean, Standard Deviation, and Median Ages of Identification byType of Hearing Loss, 1979-1991
Mean, Standard Deviation, and Median Ages of Identification bySeverity of Hearing Loss, 1979-1991
Mean, Standard Deviation, and Median Ages of Identificationfor Cause of Hearing Loss, 1979-1991
Mean, Standard Deviation, and Median Ages of Identification byAge at Onset of Unaided Hearing Loss, 1979-1991
Mean, Standard Deviation, and Median Ages of Identification byLanguage Spoken in the Home, 1979-1991
Mean, Standard Deviation, and Median Ages of Identificationby One or More Hearing Impaired Parent, 1979-1991
Mean, Standard Deviation, and Median Age (in Months) atProgram Start, Overall and By Program-Start Year
Mean, Standard Deviation, and Median Program-Start Ages byPresence of Other Handicaps, 1979-1991
Mean, Standard Deviation, and MedianSeverity of Hearing Loss, 1979-1951
Mean, Standard Deviation, and Median
Program-Start Ages by
Program Start Ages forCause of Hearing Loss, 1979-1991
xi
I 5
100
101
102
103
104
105
106
107
108
111
112
113
114

61 Mean, Standard Deviation, and Median Program-Start Ages byAge at Onset of Hearing Loss, 1979-1991 115
62 Mean, Standard Deviation, and Median Program-Start Ages byLanguage Spoken in the Home, 1979-1991 116
63 Mean, Standard Deviation, and Median Program -Start Ages byOne or More Hearing-Impaired Parent, 1979-1991 117
64 Mean, Standard Deviation, and Median Age (ia Months) at whicha Hearing Aid was Fit, Overall and by Program-Start Year . . . . 119
65 Mean, Standard Deviation, and Median Hearing-Aid-Fit Agesby Presence of Other Handicaps, 1979-1991 120
66 Mean, Standard Deviation, and Median Hearing-Aid-Fit Agesby Severity of Hearing Loss, 1979-1991 121
67 Mean, Standard Deviation, and Median Hearing-Aid-Fit Agesby Cause of Hearing Loss, 1979-1991 122
68 Mean, Standard Deviation, and Median Hearing-Aid-Fit Agesby Age at Onset of Hearing Loss, 1979-1991 123
69 Mean, Standard Deviation, and Median Hearing-Aid-Fit Agesby Language Spoken in the Home, 1979-1991 124
70 Mean, Standard Deviation, and Median Hearing-Aid-Fit Agesby One or More Hearing Impaired Parent, 1979-1991 124
71 Mean, Standard Deviation, and Median Time Interval (in Months)Between Age of Suspicion and Age of Identification ofHearing Loss, Overall and by Program-Start Year 126
72 Mean, Standard Deviation, and Median Interval Between Suapicionand Identification by Presence of Other Handicaps, 1979-1991 . . 127
73 Mean, Standard Deviation, and Median Interval Between Suspicionand Identification by Severity of Hearing Loss, 1979-1991. . . . 128
74 Mean, Standard Deviation, and Median Intervals Between Suspicionand Identification by Cause of Hearing Loss, 1979-1991 129
75 Mean, Standard Deviation, and Median Intervals Between Suspicionand Identification by Age at Onset of Hearing Loss, 1979-1991. . 130
76 Mean, Standard Deviation, and Median Intervals Between Suspicionand Identification by Language Spoken in the Home, 1979-1991 . . 131
77 Mean, Standard Deviation, and Median Intervals Between Suspicionand Identification by One or More Hearing-Impaired Parent,1979-1991 131
78 Mean, Standard Deviation, and Median Intervals BetweenIdentification Age and Program-Start Age, Overall andBy Program-Start Year 133
79 Mean, Standard Deviation, and Median Intervals BetweenIdentification and Program Start by Presence of OtherHandicaps, 1979-1991 134
xii

80 Mean, Standard Deviation, and Median Interval BetweenIdentification and Program Start by Severity of HearingLoss, 1979-1991 135
81 Mean, Standard Deviation, and Median Intervals BetweenIdentification and Program Start by Cause of Hearing Loss,1979-1991 136
82 Mean, Standard Deviation, and Median Intervals BetweenIdentification and Program Start by Age at Onset ofHearing Loss, 1979-1991 137
83 Mean, Standard Deviation, and Median Intervals BetweenIdentification and Program Start by Language Spoken in theHome, 1979-1991 138
84 Mean, Standard Deviation, and Median Intervals BetweenIdentification and Program Start by One or More Hearing-Impaired Parent, 1979-1991 138
85 Mean, Standard Deviation, and Median Intervals Between Ageof Suspicion and Age at Program Start, Overall and byProgram-Start Year 140
86 Mean, Standard Deviation, and Median Intervals BetweenSuspicion and Program Start by Presence of Other Handicaps,1979-1991 141
87 Mean, Standard Deviation, and Median Intervals BetweenSuspicion to Program Start by Severity of Hearing Loss,1979-1S91 141
88 Mean, Standard Deviation, and Median Intervals Between Suspicionand Program Start by Cause of Hearing Loss, 1979-1991 143
89 Mean, Standard Deviation, and Median Intervals Between Suspicionto Program Start by Age at Onset of Hearing Loss, 1979-1991. . . 144
90 Mean, Standard Deviation, and Median Intervals Between Suspicionand Program Start by Language Spoken in the Home, 1979-1991. . . 145
91 Mean, Standard Deviation, and Median Intervals Between Suspicionand Program Start by One or More Hearing-Impaired Parent,1979-1991 145
92 Frequencies and Percentages of Children by Who Suspected theHearing Loss, 1986-1989 147
93 Means, Medians, Standard Deviations, and ANOVA Results for Agesand Time Intervals by Who Suspected the Hearing Loss, 1986-1989. 148
94 Frequencies and Percentages of Children for Each Cause ofSuspicion, 1986-1989 151
95 Frequencies and Percentages of Children and Mean, StandardDeviation, and Median Age of Identification for Each Causeof Suspicion 152
96 Frequencies and Percentages of Children by IdentificationProcedure, 1986-1989 156

97 Frequencies and Percentages of Children Referred toHome-Programming by Formal Infant Screening Program andType of Referring Agency 157
98 Means, Medians, Standard Deviations, and ANOVA Results forAges and Time Intervals by Identification Procedures, 1986-1989. 158
99 Correlation Coefficients for Identification-Procedure Study,1986-1989 163
100 Correlation Coefficients for SKI*HI Overall, 1979-1991 163
101 Means, Medians, Standard Deviations, and ANOVA Results forExpressive and Receptive Pretest Developmental Quotients byIdentification Procedure, 1986-1989
102
103
104
105
106
107
108
109
110
111
112
113
114
115
116
Means, Standard Deviations, Medians, and Ranges for TreatmentAmount, Treatment Density, and Gain Time (in Months)
Frequencies and Percentages of Children by Treatment Amount,1987-1991
Frequencies and Percentages of Children With/Without AdditionalHandicaps by Treatment Amount, 1979-1991
Frequencies and Percentages of Children byTreatment Amount, 1987-1991
Severity and
Frequencies and Percentages of Children byand Age at Onset, 1979-19.91
Treatment Amount
Frequencies and Percentages of Children by Language Spokenin the Home and Treatment Amount, 1979-1991
Frequencies and Percentages of Children with a Hearing-Impaired Parent by Treatment Amount, 1979-1991
Frequencies and Percentages of Children by ScheduledFrequency of Home Visits, 1987-1991
Frequencies and Percentages of Children by Actual TreatmentDensity, 1987-1991
Frequencies and Percentages of Children by Presence of AnotherHandicap and Treatment Density, 1987-1991
Frequencies and Percentages of Childre.1 by Severity andTreatment Density, 1987-1991
Frequencies and Percentages of Children by Treatment Densityand Age at Onset, 1987-1991
Frequencies and Percentages of Children by Treatment Density andLanguage Spoken in the Home, 1987-1991
Frequencies and Percentages of Children by Parental HearingLoss and Treatment Density, 1987-1991
Mean, Standard Deviation and Median Ages or Intervals(in Months), 1979-1991
xiv
165
172
173
173
175
176
177
178
179
180
180
182
183
184
185
186

117 Frequencies and Percentages of Children by CommunicationMethodology, 1979-1991 187
118 Frequencies and Percentages of Children with the Presence ofAnother Handicap by Communication Methodology, 1979-1991 . . . . 187
119 Frequencies and Percentages of Children by Severity ofHearing Loss and Communication Methodology, 1979-1991 189
120 Frequencies and Percentages of Children by Age at Onset andCommunication Methodology, 1979-1991 190
121 Frequencies and Percentages of Children by Language andCommunication Methodology, 1979-1991 191
122 Frequencies and Percentages of Children with a Hearing-Impaired Parent by Communication Methodology, 1979-1991 192
123 Frequencies and Percentages of Children by Other ServicesReceived 193
124 Mean, Standard Deviation, and Median Pre-, Post-, andPredicted LDS Scores, 1979-1991 195
125 Mean, Standard Deviation, and Median PCIs, 1979-1991 197
126 Means, Standard Deviations, Medians, and ANOVA andChi-Square Results for Expressive and Receptive PCIs by Gender . 198
127 Means, Standard Deviations, Medians and ANOVA and Chi-SquareResults for Expressive and Receptive PCIs by Ethnicity 199
128 Means, Standard Deviations, Medians, and ANOVA andChi-Square Results for Expressive and Receptive PCIs byPresence of Other Handicaps 200
129 Means, Standard Deviations, Medians, and ANOVA andChi-Square Results for Expressive and Receptive PCIs byType of Hearing Loss 202
130 Means, Standard Deviations, Medians and ANOVA andChi-Square Results for Expressive and Receptive PCIs byLevel of Unaided Hearing Loss, 1979-1991 204
131 Means, Standard Deviations, Medians, and ANOVA and Chi-Square Results for Expressive and Receptive PCIs byCause of Hearing Loss, 1979-1991 206
132 Means, Standard Deviations, Medians and ANOVA andChi-Square Results for Expressive and ReceptivePCIs by Age at Onset, 1979-1991 208
133 Means, Standard Deviations, Medians and ANOVA and Chi-SquareResults for Expressive and Receptive PCIs by LanguageSpoken in the Home, 1979-1991 210
134 Means, Standard Deviations, Medians, and ANOVA and Chi-Square Results for Expressive and Receptive PCIs byPresence of Hearing Impaired Parent, 1979-1991 211
xv
if;
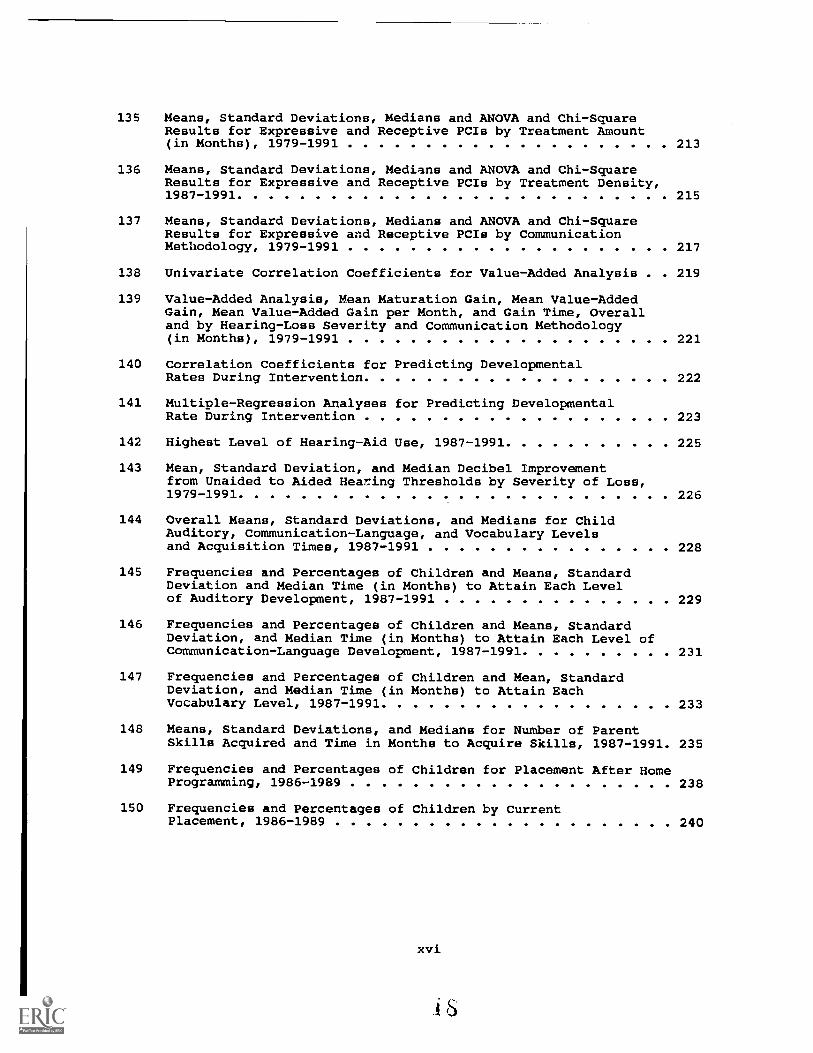
135 Means, Standard Deviations, Medians and ANOVA and Chi-SquareResults for Expressive and Receptive PCIs by Treatment Amount(in Months), 1979-1991 213
136 Means, Standard Deviations, Medians and ANOVA and Chi-SquareResults for Expressive and Receptive PCIs by Treatment Density,1987-1991 215
137 Means, Standard Deviations, Medians and ANOVA and Chi-SquareResults for Expressive and Receptive PCIs by CommunicationMethodology, 1979-1991 217
138 Univariate Correlation Coefficients for Value-Added Analysis . 219
139 Value-Added Analysis, Mean Maturation Gain, Mean Value-AddedGain, Mean Value-Added Gain per Month, and Gain Time, Overalland by Hearing-Loss Severity and Communication Methodology(in Months), 1979-1991 221
140 Correlation Coefficients for Predicting DevelopmentalRates During Intervention 222
141 Multiple-Regression Analyses for Predicting DevelopmentalRate During Intervention 223
142 Highest Level of Hearing-Aid Use, 1987-1991 225
143 Mean, Standard Deviation, and Median Decibel Improvementfrom Unaided to Aided Hearing Thresholds by Severity of Loss,1979-1991 226
144 Overall Means, Standard Deviations, and Medians for ChildAuditory, Communication-Language, and Vocabulary Levelsand Acquisition Times, 1987-1991 228
145 Frequencies and Percentages of Children and Means, StandardDeviation and Median Time (in Months) to Attain Each Levelof Auditory Development, 1987-1991 229
146 Frequencies and Percentages of Children and Means, StandardDeviation, and Median Time (in Months) to Attain Each Level ofCommunication-Language Development, 1987-1991 231
147 Frequencies and Percentages of Children and Mean, StandardDeviation, and Median Time (in Months) to Attain EachVocabulary Level, 1987-1991 233
148 Means, Standard Deviations, and Medians for Number of ParentSkills Acquired and Time in Months to Acquire Skills, 1987-1991. 235
149 Frequencies and Percentages of Children for Placement After HomeProgramming, 1986-1989 238
150 Frequencies and Percentages of Children by CurrentPlacement, 1986-1989 240
xvi

LIST OF FIGURES
Figure Page
1. Program design for Project SKI*HI 3
2. Research paradigm 17
3. Mean and median ages of identification by program-start year forSKI*HI overall 99
4. Median ages of identification by four-month age blocks for Utahand SKI*HI overall, 1979-1991 155
xvii

CHAPTER 1
INTRODUCTION
The devastating impacts of hearing impairments on children and their
families are well documented (Bailey & Simeonsson, 1988; Blair, 1981; Clark,
1989; Featherstone, 1980; Luterman, 1979; Stoneman & Brody, 1984; Turnbull &
Turnbull, 1986). Not only does the child with a hearing impairment need early
intervention to stimulate communication and cognitive development, but the
parents need support and guidance in adjusting to having a child with a
hearing impairment and in promoting the child's development.
The SKI*HI Model was conceived and developed in Utah as a comprehensive
model for the early identification of children with hearing impairments and
for providing home-based intervention for such children, birth through five
years of age. Administered by the Utah School for the Deaf, SKI*HI was funded
as a Demonstration Model by the U.S. Department of Education, Handicapped
Children's Early Education Program (HCEEP) from 1972 to 1975. In 1975, SKI*HI
received HCEEP Outreach funding. The SKI*HI Model was first validated by the
Joint Dissemination Review Panel as an exemplary educational program in 1978
and was revalidated in 1984 and 1990. The SKI*HI Model has been adopted by
approximately 260 agencies in the United States, Canada, and Britain and is
used with more than 4,000 children and their families annually.
The SKI*HI Model is based on a theoretical framework which assumes that
early identification and provision of family-focused, home-based programming
will ameliorate the negative effects of hearing impairment on the child.
Further, it is assumed that such programming will enable family members to
adjust to the impairment, support and enjoy the child, and promote the child's
development. This theoretical framework is strongly supported in the
literature (Bailey & Simeonsson, 1988; Grant, 1987; Luterman, 1987; Simmons-
Martin, 1983; Stein, Clark, & Kraus, 1983; Tingey, 1988). The language input
a child receives during the early years of life is crucial to his or her
acquisition of communicative/linguistic competence and later academic skills.
A child who suffers early language deprivation experiences profound negative
effects on all areas of language and literacy development (Allen, 1986; Clark,

1988; Jensema, Karchmer, & Trybus, 1978; McAnnally, Rose, & Quigley, 1987;
oiler, 1985; Quigley, 1978; Quigley & Paul, 1986). Language deprivation can
affect other areas of development as well, such as socialization and cognitive
performance (Meadow, 1980; Moores, 1987; Sanders, 1988). The child with a
hearing impairment and the child's family need early, family-focused, cost-
efficient intervention. The SKI*HI Model addresses these needs.
The major goals of SKI*HI are to identify such children early and to
provide complete, home-based programming that will facilitate their
communicative, auditory, cognitive, and linguistic development. Specific
goals for the child are that he or she will (a) communicate meaningfully with
significant persons in the home; (b) use residual hearing; (c) develop a
communication method (aural/oral, total communication, or other); (d) develop
optimal receptive and expressive language levels; (e) be provided with maximum
amplification; and (f) be prepared to enter school ready to learn. Specific
goals for the parents are that they will (a) have a warm, positive
relationship with the child; (b) provide a stimulating, interactive home
environment; (c) be able to manage the child's hearing aids; (d) help the
child use his or her residual hearing; and (e) provide communication-language
and cognitive stimulation.
The SKI*HI home-based delivery model consists of the following
components: (a) identification/screening; (b) direct services in the home for
children with hearing impairments and their families; (c) support services
(e.g., physical and occupational therapy, audiological services, medical and
psychological support services) for the child; and (d) a program management
system (see Figure 1).
Background, the Problem, Description of the Data Bank
In 1973, Project SKI*HI began collecting demographic and test data on
children with hearing impairments who were being served by personnel using the
SKI*HI model. In 1979, a national data bank for children being served by
personnel in the SKI*HI network was started. Initially, this data bank
contained information collected annually on 40 children. Data contributions
2

OPEMMEPIMMECTWTM
IDENTIFY CHILDREN PROVIDE SERVICES IN HOME
Satan
1.1
TeemMuuOtAd&Fentlyftwede
1.2
TeemPlardPreporeFan* Weds
2.1
TMdyModatCornenunkedon& LoniPleoUde
2.2
HIM
1.3
AM 2.0
Component.
Tend% Aud.Dessiopraeral &Hewing AidMenagarnentadds 2.4
PrcrAdeAssistenoe toFeatly
2.3
1.0
MANAGE PROGRAM
MWThrPersonnel&SaWDesetopomM
4.1
Conductelmtlings&'miasmaFlaw.mulimm 4.4
ConductBudgetActhides
42
Evaluate Programwrie Reports
4.3
4.0
All Components
PROVIDE SUPPORT SERVICES
NolmftricW1.0Thar opyWOW Simko,
3.1
Moak%Psychological &Emotional Support
3.4
Prcalde Matedde& ChidDeveiopnwitSuPPott
3.2
DelverAudiological/beret AidSanto's
3.3
3.0
Pirate 1. Program design for Project SKIIII
increased steadily; by 1987 the data bank contained information on over 2200
children with hearing impairments. These children were from 81 different
agencies, representing 27 states and one Canadian province. It was
anticipated that by 1991 the number of children would increase to
approximately 5000. This rich source of information on demographics, early
identification, and effectiveness of home-based programming had not yet been
analyzed, synthesized, and disseminated.
It is not that there had been no previous reports on the demographics of
children with hearing impairments, identification procedures, and
effectiveness of home-based programming. We have identified several reports
3

that provide such information. However, the reports are typically limited to
findings for small numbers of children being served in specific regions over a
brief time span. The SKI*HI National Data Bank provides longitudinal
information for children served throughout the United States that has never
been available before and is available in no other place. The data have been
used for the validation and revalidation of Project SKI*HI by the National
Diffusion Network and for Annual Reports from the SKI*HI Institute to adoption
agencies and other relevant recipients. The absence of a complete analysis
and synthesis of the information in the SKI*HI National Data Bank for
educators of children with hearing impairments and for researchers was the
problem addressed by the research project presented on the following pages.
The purpose of the project was to provide research findings on critical areas
of home-based programming for children with hearing impairments and their
families.
4

CHAPTER 2
REVIEW OF THE LITERATURE
Primary research studies are designed and conducted within the context
of a review of prior research. A brief review of the literature for each of
the three major research emphases (i.e., demographics, identification
procedures, and effectiveness of home-based programming for children with
hearing impairments) of this project follows.
Demographics
The most current demographic information on children with hearing
impairments is provided by the Center for Assessment and Demographic Studies
(1991) at Gallaudet University in Washington, D.C. As a part of the 1990-91
Annual Survey of Hearing Impaired Children and Youth, Gallaudet University
published a regional and national summary of demographic information for
47,973 individuals with hearing impairments. Because the Gallaudet Center
collects information on children and youth of all ages and only 13.5% of the
reported data pertain to children who are birth through 5 years of age, their
values must be interpreted with caution when comparisons are made with the
SKI*HI data.
Data will be summarized from the Gallaudet report for only those
variables that are consistent with the variables in the SKI*HI National Data
Bank (i.e., gender, ethnicity, severity of hearing loss, cause of hearing
loss, presence/absence of other handicapping conditions, age at onset of
hearing loss, primary method of teaching, and classroom integration with
hearing students). These data will be used later in this report to support
our contention that the findings reported hereinafter for SKI*HI children are
representative of hearing-impaired children nationally. Comparison data were
not available for the following variables that are included in the SKI*HI
National Data Bank: (a) type of hearing loss; (b) language spoken in the
home; and (c) whether one or both parents had a hearing loss.
5

Table 1
Demographic Information Provided by the Center For Assessment and Demographic
Studies at Gallaudet University for the Year 1990-91
Variable Frequency Percentage
GenderMaleFemaleUnknown or Blank
25,83421,986
153
53.945.8
.3
EthnicityCaucasian 29,466 61.4African American 8,112 16.9Spanish American 6,628 13.8Native American 340 .7Asian American 1,683 3.5Other 602 1.3Multi-ethnic background 280 .6Information Not Reported 862 1.8
Severity of Hearing LossNormal 4,103 8.6Mild 4,448 9.3Moderate 5,683 11.8Mod. Severe 5,728 11.9Severe 8,637 18.0Profound 18,141 37.8Information Not Reported 1,233 2.6
Cause of Hearing LossUnknown and Not Reported 24,859 51.8Meningitis 4,160 8.7Heredity 6,265 13.1Otitis Media 1,746 3.6Prematurity 2,212 4.6Other Cause at Birth 2,338 4.9Maternal Rubella 1,349 2.8Cytomegalovirus 500 1.0Other Complications of Pregnancy 1,251 2.6Trauma at Birth 1,120 2.3High Fever 1,202 2.5Infection 1,021 2.1Measles 133 .3Mumps 27 < 1RH Incompatibility 218 .4Trauma After Birth 346 .7Other Cause After Birth 894 1.9
Presence/Absence of Other HandicapsNo Additional Handicaps 33,005 68.8One or More Additional Handicaps 13,799 28.8Not Reported 1,169 2.4
6

Table 1 (Continued)
Variable Frequency Percentage
Age at Onset of Hearing LossAt BirthUnder 3 years3 years or olderNot Reported
22,8707,2911,927
15,885
47.715.24.033.1
Primary Method of TeachingAuditory/Oral Only 18,640 38.9Sign and Speech (Total comm.) 27,554 57.4Sign Only 613 1.3Cued Speech 214 .4Other 343 .7Not Reported 609 1.3
Classroom Integration with Hearing StudentsIntegrated 25,388 52.9Not Integrated 22,047 46.0Not Reported 538 1.1
Identification Procedures
Because hearing loss is not readily observable, when such a handicapping
condition is present at birth, the loss may go undetected for months or even
years (Bess & McConnell, 1981). A hearing impairment can affect language
acquisition, which in turn can lead to social, emotional, academic, and
vocational difficulties (Moores, 1987). Identifying children with hearing
impairments at or near birth allows early intervention, thus minimizing the
cumulative effects of delayed 1angtage development (Mahoney & Eichwald, 1986).
Further, late identification, after one year of age, results in stimulus
deprivation, which can lead to central nervous system processing problems
(Young, 1976). Support for these contentions is provided by Clark (1979), who
reported that children with hearing impairments who receive intervention prior
to 2 1/2 years of age have significantly better communication skills than
children who receive comparable intervention beginning after 2 1/2 years of
age. In fact, the Joint Committee on Infant Hearing (1982), which consists of
professionals from the American Academy of Pediatrics, the American Academy of
Otolaryngology--Head and Neck Surgery, the American Nurses Association, and
7
t)

the American Speech-Language-Hearing Association, recommended that the hearing
of infants at-risk for hearing loss be screened not later than six months of
age and that intervention for children with congenital hearing impairment be
initiated soon after the child is six months of age. In 1990, the federal
government established a goal to "reduce the average age at which children
with significant hearing impairment are identified to no more than 12 months"
by the year 2000 (U. S. Department of Health and Human Services, p. 460).
The World Health Organization (WHO) reported in 1967 that the incidence
of severe hearing loss in neonates and infants was about 1:1000 and that the
incidence of all degrees of hearing loss is approximately 5:1000 (cited in
Abramovich, Hyde, Riko, & Alberti, 1987). Ideally, every neonate would be
screened for hearing loss; however, in practice, neonatal hearing screening is
not routinely done, primarily because of cost considerations (Northern &
Gerkin, 1989).
Although infant hearing screening has been recommended for over 20
years, there continues to exist the underlying problem of not identifying the
hearing impaired infant until 2 1/2 to 3 years of age (Mahoney, 1984). From a
national perspective, according to a report released in 1988 by the Commission
on Education of the Deaf to the President and the Congress of the United
States, "the average age of identification for profoundly deaf children in the
United States is reported as 2 1/2 years" (p. 3). In a survey conducted in
Oregon, prior to the implementation of hearing screening via a statewide birth
certificate high-risk registry, Moore, Josephson, and Mauk (1991) reported an
average age at confirmation of loss of 30.6 months.
Earlier average ages of identification have been reported, however.
Elssmann, Matkin, and Sabo (1987) conducted a survey in Arizona of 300 parents
of children with hearing impairments. With 64% (n = 159) of th^ parents
responding to the questionnaire, the average age of identification for those
children was approximately 19 months. Elssmann et al. also reported that
there was an inverse relationship between age of identification and severity
of hearing loss. That is, those children with profound hearing losses were
8

identified earliest (15 to 16 months), as compared with 18 to 22 months for
children with severe losses, and 22 to 42 months for children moderate losses.
This finding is consistent with the findings of other investigators (e.g.,
Coplan, 1987; Malkin, Freeman, & Hastings, 1976; Mauk, White, Mortensen, &
Behrens, 1991; Shah, Chandler, & Dale, 1978).
The findings from the Elssmann at al. (1987) questionnaire also
indicated that 79% of the children had been bora with hearing losses and that
only for those infants born with microtia/atresia was intervention begun at
the age recommended by the Joint Committee on Infant Hearing. Further,
Elssmann et al. stated that children with acquired losses from illness (e.g.,
meningitis) had experienced delays of approximately 8.5 months between the
illness and hearing-aid fitting. Finally, they suggested that audiologists
had contributed, on average, a delay of as much as six additional months
between identification of the hearing loss and initial hearing-aid fitting.
Hearing Screening Techniques
Because hearing impairment cannot be observed in the neonate when
examined by the pediatrician, techniques other than physical examination must
be employed to detect the presence of a hearing loss. Screening techniques
currently available are discussed below, as well as problems specific to each
screening technique.
Behavioral observation audiometry. Traditionally, neonatal or infant
hearing screening has been depandent on behavioral observation audiometry
(BOA) (Mahoney & Eichwald, 1986). BOA screening of neonates and infants has
evolved from use of clackers, bells, whistles, and various toys as sound
stimuli to the use of more sophisticated narrow- or wide-band noise generators
(Garrity & Mengle, 1983). Observers note the arousal from sleep or the
auropalpebral response (APR) as responses to sound stimuli, as well as changes
in respiration, heart, and sucking rates (Garrity & Mengle, 1983; Parving,
1985).
BOA infant hearing screening programs have been fraught with
difficulties and have produced significant false-positive and false-negative
9

results (Jacobson & Jacobson, 1987). Furthermore, BOA infant hearing
screening programs are not cost effective (Mahoney & Eichwald, 1986). In
1973, the American Speech-Language-Hearing Association formed a
multidisciplinary Joint Committee on Infant Hearing to evaluate the status of
neonatal and infant screening procedures. The Committee recommended that the
use of mass BOA screening of neonates and infants be discontinued in favor of
testing only those neonates and infants determined to be at risk according to
accepted high-risk criteria (cited in Mahoney & Eichwald, 1986).
High-risk register. In 1976, the Joint Committee on Infant Hearing
recommended that infants at risk for hearing impairment be identified by means
of both high-risk criteria and physical examination (cited in Gerber &
Mencher, 1983). A five-item high-risk register was developed and recommended
for use as a screening procedure. By 1981, two additional risk criteria had
been added to the original five. Consequently, the recommended high-risk
register currently comprises seven risk criteria:
1. Family history of childhood hearing impairment.
2. Congenital perinatal infection (e.g., cytomegalovirus, rubella,herpes, toxoplasmosis, syphilis).
3. Anatomic malformations involving the head or neck (e.g.,dysmorphic appearance including syndromal and nonsyndromalabnormalities, overt or submucous cleft palate, morphologicabnormalities of the pinna).
4. Birth weight less than 1,500 grams.
5. Hyperbilirubinemia at level exceeding indications for exchangetransfusion.
6. Bacterial meningitis, especially Hemophilus influenza.
7. Severe asphyxia, which may include infants with Apgar scores of 0to 3 or those who fail to institute spontaneous respiration by tenminutes and those with hypotonia persisting to 2 hours of age.
Although the high-risk register is not a hearing test per se, it is
recognized as an infant hearing screening method. Several methods are used to
collect the information related to the seven risk criteria. One successful
method is used in Utah, where parents complete the high-risk register as a
part of the legally required birth certificate application process (Mahoney &
Eichwald, 1986). Other states in which a high-risk register has been mandated
10

or in which requirements for a high-risk register are in the planning stages
include Colorado, Kentucky, Oklahoma, Massachusetts, New Jersey, Tennessee,
and Virginia.
Although the high-risk register is a logical procedure for selecting
children for hearing testing, disagreement exists as to its usefulness,
principally because only half of the children with a hearing loss will
manifest a known risk factor (Abramovich et al., 1987). To address this
problem, authors have proposed screening procedures in addition to the high-
risk register. For example, Jaffe (1977) has reported that greater rates of
identification of infants with hearing loss resulted when combinations of
behavioral audiometry and a high-risk register were used. Abramovich et al.
(1987) found that better detection rates were obtained if brainstem electrical
response audiometry (SERA) was delayed until 3 or 4 months of age and if the
high-risk register was used to select the children for testing. And Mencher
(cited in Ramey & Trohanis, 1982) found that while 56% of the congenitally
deaf children could be identified by behavioral testing, 80% could be
identified if behavioral testing was combined with the high-risk register.
Immittance/impedance audiometry. Immittance/impedance audiometry
provides an effective screening procedure for middle-ear pathology or
conductive hearing loss by providing a measure of eardrum mobility (Garrity &
Mengle, 1983). A typanogram (a graph of tympanic membrane movement) is
printed out, and the examiner can evaluate middle-ear pressure and the
mobility of the eardrum, which helps in determining the presence/absence of
middle-ear pathology. The examiner can also use immittance/impedance
audiometry to help detect sensorineural hearing loss by observing the
presence/absence of an acoustic reflex. However, Parving (1985) reported that
the use of immittance/impedance audiometry for screening the hearing of
neonates and infants before approximately six months of age may not be
effective.
Crib-O-Gram. The Crib-O-Gram screening procedure involves the use of a
motion-sensitive transducer under the crib mattress which detects any motor
11
:7 (j
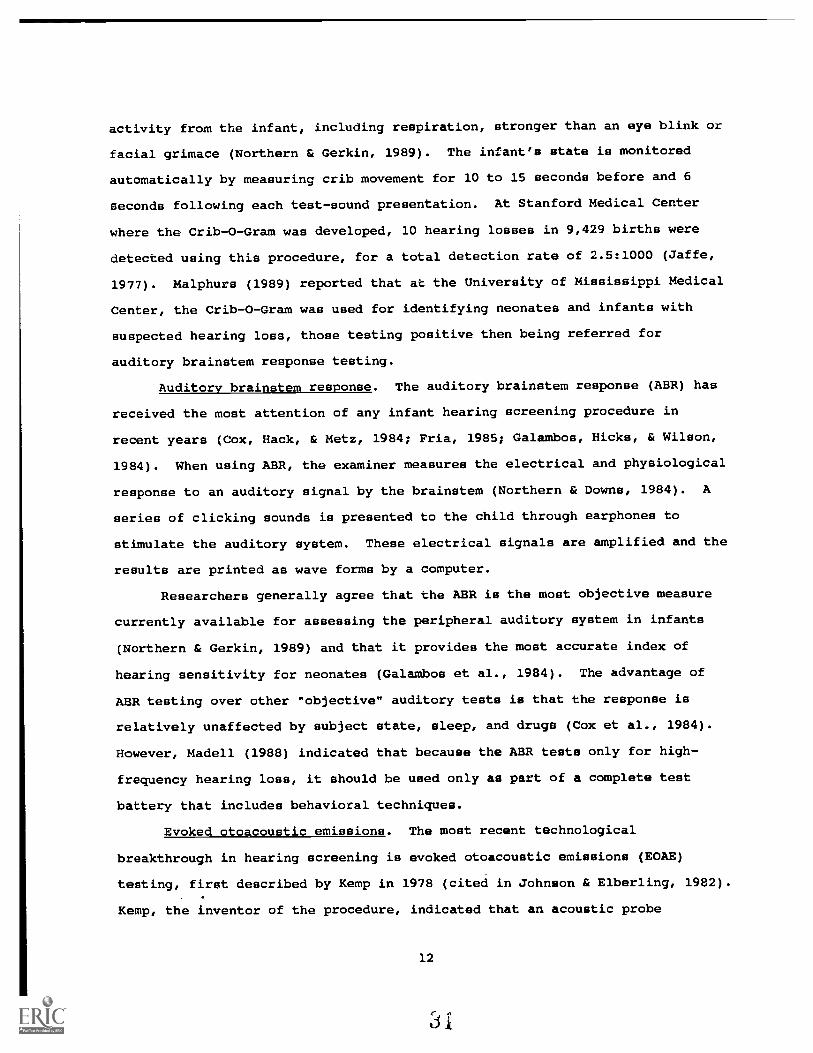
activity from the infant, including respiration, stronger than an eye blink or
facial grimace (Northern & Gerkin, 1989). The infant's state is monitored
automatically by measuring crib movement for 10 to 15 seconds before and 6
seconds following each test-sound presentation. At Stanford Medical Center
where the Crib-O-Gram was developed, 10 hearing losses in 9,429 births were
detected using this procedure, for a total detection rate of 2.5:1000 (Jaffe,
1977). Malphurs (1989) reported that at the University of Mississippi Medical
Center, the Crib-O-Gram was used for identifying neonates and infants with
suspected hearing loss, those testing positive then being referred for
auditory brainstem response testing.
Auditory brainstem response. The auditory brainstem response (ABR) has
received the most attention of any infant hearing screening procedure in
recent years (Cox, Hack, & Metz, 1984; Fria, 1985; Galambos, Hicks, & Wilson,
1984). When using ABR, the examiner measures the electrical and physiological
response to an auditory signal by the brainstem (Northern & Downs, 1984). A
series of clicking sounds is presented to the child through earphones to
stimulate the auditory system. These electrical signals are amplified and the
results are printed as wave forms by a computer.
Researchers generally agree that the ABR is the most objective measure
currently available for assessing the peripheral auditory system in infants
(Northern & Gerkin, 1989) and that it provides the most accurate index of
hearing sensitivity for neonates (Galambos et al., 1984). The advantage of
ABR testing over other "objective" auditory tests is that the response is
relatively unaffected by subject state, sleep, and drugs (Cox et al., 1984).
However, Madell (1988) indicated that because the ABR tests only for high-
frequency hearing loss, it should be used only as part of a complete test
battery that includes behavioral techniques.
Evoked otoacoustic emissions. The most recent technological
breakthrough in hearing screening is evoked otoacoustic emissions (EOAE)
testing, first described by Kemp in 1978 (cited in Johnson & Elberling, 1982).
Kemp, the inventor of the procedure, indicated that an acoustic probe
12
3!

consisting of a miniature microphone and a sound source is sealed in the
external ear canal. Acoustic energy is released into the ear canal by the
cochlea, reflecting the existence of an active mechanism within the cochlea.
It has been demonstrated that the evoked emission is not present in adults
when hearing loss exceeds 15 dB (Stevens, Webb, Smith, & Buffin, 1990).
Currently, studies are being conducted to determine the efficacy of this
procedure with the neonatal population (Mauk, 1990). Recent research ha,
demonstrated that the procedure is accurate, simple, fast, noninvasive,
objective, and sensitive (Bonfils, Uziel, & Pujol, 1988).
Parental suspicion. Although recent advances in technology are
promising, identification of hearing loss in neonates, infante, and toddlers
is primarily the result of parental suspicion (Simmons, 1978). In fact,
Simmons stated that the best instrument for detecting hearing loss in early
childhood is a grandmother living nearby. A number of authors have supported
Simmons's contentions: (a) Becker (1976) stated that parents detect 70% of
the cases of hearing impairment; (b) Gustason (1989) reported that parents and
grandparents are the most common source of early suspicion of hearing loss;
and (c) Garrity and Mengle (1983) described the family as most often
suspecting hearing problems.
Although parental suspicion generally occurs at around 9 to 10 months of
age (Mahoney & Eichwald, 1986), such suspicion does not necessarily result in
referral, confirmation of hearing loss, and intervention at an early age.
Confirmation and remedial action are generally delayed until the child is 2
1/2 to 3 years of age (Mahoney & Eichwald, 1986). Shah et al. (1978) stated
that the
chief obstacles to diagnosis were the referring physicians'
unwillingness to accept the parents' opinions, their failure to perform
simple screening tests and their reluctance to arrange referrals.
Det,:tion was found to depend on the astuteness and insistence of
parents, and on the alertness of their physicians. (p. 206)
Several authors have suggested that the only way to change the pattern of late
13

confirmation and remedial action is to educate the pediatricians and general
practitioners as to the importance of both early detection and heeding
parents' opinions regarding their children (e.g., Bess & McConnell, 1981;
Coplan, 1987; Shah et al., 1978).
Summary
In summary, although various neonatal or infant screening procedures are
available, suspicion of hearing loss by parents is still the primary means by
which most hearing-impaired children are identified. Evoked otoacoustic
emission testing holds great promise for neonatal or infant hearing screening,
but the research to support the validity and reliability of the technology as
a neonatal or infant hearing screening procedure is still lacking. The data
gathered for this investigation from the participating SKI*HI sites will add
to the body of literature available in this critical area of investigation.
Program Effectiveness
Relatively few data exist on the effectiveness of home-based programming
for infants, toddlers, and young children. In an early study, Clark (1979)
described his investigation of children from the SKI*HI network who received
early (prior to 30 months of age) versus late (after 30 months of age) home-
based programming. Comparisons of the two groups' mean scores indicated that
the children with early intervention obtained statistically significantly
higher mean scores Eor measures of auditory development, receptive and
expressive language, and parental involvement.
In a review of the literature, Meadow-Orlans (1987) identified eight
reports, not including the Clark (1979) study, in which researchers had
compared outcome measures for children with hearing impairments who had begun
intervention "early" versus "late". All of the authors except one (Watkins,
1987) conducted their research with children from center-based or residential
programs. Watkins's subjects were participating in programs using the SKI*HI
home-based programming model. Meadow-Orlans noted conflicting findings for
the eight reports. That is, while no statistically significant difference
between the two groups' mean scores was reported for one of the studies
14

(Craig, 1964), for six of the studies (Balow & Brill, 1975; Brasel & Quigley,
1977; Greenstein, Greenstein, McConville, & Stellini, 1975; Levitt, McGarr, &
Geffner, 1986; Liff, 1973; White & White, 1986), authors reported
statistically significant differences, favoring the early intervention groups.
Watkins (1987) also reported statistically significant differences favoring
early as compared to late home-based intervention, but for only a few of the
23 dependent measures that she used in her study.
In addition to the review of findings from early versus late
investigations, Meadow-Orlans (1987) also identified five reports in which
researchers investigated the effects of some type of oral-plus-visual
communication as compared to oral/aural communication in early intervention
programs. Consistent findings favoring the oral-plus-visual communication
methodology were reported for the five investigations (Greenberg, Calderon, &
Kusche (1984); Moores, Weiss, & Goodwin, 1978; Musselman, Lindsay, & Wilson,
1985; Quigley, 1969 [2 reports]). Home-based programming was used in only one
of these investigations (Greenberg et al., 1984) and an important
characteristic of the experimental condition was that the early and intensive
use of sign language was taught through family visits by a deaf adult.
Summary
Preliminary findings from the accessible research literature indicate
that early intervention, as compared to late intervention, results in greater
communication and educational gains. Additionally, oral-plus-visual
communication methodology has resulted in greater gains than oral-only
methodologies. There have been few investigations of the effectiveness of
home-based programming for children with hearing impairments--that is, only
the studies by Clark (1979), Greenberg et al. (1984) and Watkins (1987) were
located. And only the investigation by Greenberg at al. was conducted
independently from the SKI*HI network.
15

CHAPTER 3
GENERAL PURPOSES, RESEARCH QUESTIONS, AND RESEARCH VARIABLES
The major goal of this investigation was to provide research data on the
effects of home-based programming on children with hearing impairments and
their families. To accomplish the major goal, three primary objectives were
specified: (a) To describe the demographic characteristics of children
receiving home-based intervention and to study the relationship of these
characteristics with child achievement; (b) To study the effectiveness of
identification procedures for hearing loss; and (c) to investigate aspects of
home-based intervention, including amount, intensity, and time of program
start on the language development of infants and young children with hearing
impairments.
In Figure 2 the research paradigm for this investigation is presented.
Pre-treatment influences included (a) child-status variables (i.e., gender,
ethnicity, presence of other handicapping conditions, type of hearing loss,
severity of hearing loss, cause of hearing loss, and age at onset of hearing
loss); (b) family-status variables (i.e., language spoken in the home, and
whether one or both parents had a hearing loss); and (c) identification
variables (i.e., identification age, program-start acre, hearing-aid-fit age,
suspicion-to-identification interval, identification-to-program-start
interval, suspicion-to-program-start interval, who suspected hearing loss,
cause of suspicion, and identification procedure). The intervention component
was the SRI*HI home-based programming model. Mediator variables included (a)
treatment variations (i.e., treatment amount, planned treatment density,
actual treatment density, communication methodology, and diagnosis-to-
communication-methodology interval) and (b) additional services (i.e., other
non-Parent/infant-Program services). Short-term and long-term outcomes
included (a) child outcomes (i.e., receptive and expressive language scores,
auditory-development level, communication-language-development level,
vocabulary level, amount of time per day wearing a hearing aid, and threshold
improvement with amplification); (b) parent/caregiver outcomes (i.e., number
16

Pro
ject
RE
AP
**R
ES
EA
RC
H O
N T
HE
EF
FE
CT
IVE
NE
SS
OF
AT
-HO
ME
PR
OG
RA
MM
ING
Pre
-tre
atm
ent
Influ
ence
sIn
terv
entio
nM
edia
tor
Var
iabl
esS
hort
-ter
mLo
ng-t
erm
Out
com
esO
utco
mes
rE
thni
city
Pre
senc
e of
Oth
er H
andi
caps
Typ
e of
Hea
ring
Loss
Sev
erity
of H
omin
g Lo
ssC
ause
of H
earin
g Lo
ssA
ge a
t Ons
et
Iden
tiflo
adon
Age
Tre
etne
enta
mt A
geA
ge H
earin
g A
id F
itS
uspi
cior
pto-
ID io
vni
ID-t
o-T
teat
rnen
tata
rt in
terv
alS
uspi
cion
-to-
TH
.-S
tart
inte
rval
Who
Sus
pect
edC
ause
of S
uspi
cion
iden
tific
atio
n P
roce
dure
tt
04.
'4 .
sAa.
.
Lang
uage
Spo
t= to
Hom
eP
aren
ts H
ave
a H
earin
g Lo
ss
Son
2. R
esea
rch
para
digm
.
......
.....
tj'"'
(
Citi
gher
*
Oth
er N
on-P
aren
t/Inf
ant
# A
udito
ry S
kills
Pro
gram
Sw
ims
# C
omm
. Ski
llsA
urey
Ora
l Ski
lls#
Tot
al C
omm
. Ski
llsC
ogni
tion
Sidl
eV
isits
to H
A C
ompe
l
SIM
I Ins
titut
e, D
epar
tmen
t of C
omm
unar
the
Dis
orde
rs, U
tah
Sta
te U
nive
rsity
Cur
rant
Pro
gram
Pie
cem
ent

of auditory, communication, aural/oral, total communication, and/or cognition
skills that the parents/caregivers acquired and number of visits needed to
attain hearing-aid-competency skills); and (c) community outcomes (i.e.,
program placement immediately after home-based programming and currant-program
placement).
Demographics
The general purposes of the demographic portion of the study were (a) to
describe the demographic characteristics of the hearing-impaired children
receiving home intervention; and (b) to describe the demographic
characteristics of specific subgroups of hearing-impaired children and their
families (i.e., subgroups defined by gender, race, presence/absence of other
handicapping conditions, type of hearing loss, severity of hearing loss, cause
of hearing loss, age at onset of hearing loss, language spoken in the home,
presence/absence of parent with a hearing loss).
Child-Status Variables
Gender.
1. What percentage of the children were male and what percentage was
female, overall and by program year?
Ethnicity.
1. What percentage of the children were Caucasian, African American,
Asian American, Spanish American, Native American, and other
nationalities, overall and by program year?
2. What was the magnitude of the relationship between ethnicity and
gender?
Other handicapping conditions.
1. What percentage of the children had other handicapping conditions,
overall and by program year?
2. What was the magnitude of the relationship between presence/absence of
other handicapping conditions and gender? and ethnicity?
Type of hearing loss.
1. What percentage of the children had a conductive, sensorineural, or
18

mixed loss (i.e., type of hearing loss)?
2. What was the magnitude of the relationship between type of hearing
loss and gender? and ethnicity? and presence/absence of other
handicaps?
Severity of hearing loss.
1. What percentage of the children had a mild (25 - 40 dB), moderate
(45 - 60 dB), severe (65 - 90 dB), or profound (>90 dB) unaided
hearing loss (i.e., unaided-hearing-loss severity) overall and by
program-start year?
2. What was the relationship between unaided-hearing-loss severity and
gender? and ethnicity? and presence/absence of other handicaps? and
type of hearing loss?
Cause of hearing loss.
1. What percentage of the children had hearing losses caused by each of
the following: (a) cause unknown/not reported, (b) hereditary, (c)
maternal rubella, CMV, or other infections during pregnancy, (d)
meningitis, (e) defects at birth, (f) fever or infections in child,
(g) RH incompatibility or kernicterus, (h) drugs during pregnancy, (i)
other pregnancy conditions--e.g., prematurity, (j) middle-ear problems
or ENT anomalies, (k) drugs administered to child, (1) birth trauma,
(m) child syndrome, and (o) other.
2. What was the magnitude of the relationship between cause olf hearing
loss and gender? and ethnicity? and presence/absence of other
handicaps? and type of hearing loss? and severity of hearing loss?
Age at onset of hearing loss.
1. For what percentage of the children was the age at onset of hearing
loss at birth, birth to one year of age, one year to two years of age,
two years to three years of age, or three years to six years, overall
and by program-start year?
2. What was the magnitude of the relationship between age at onset of
hearing loss and gender? and ethnicity? and presence /absence of
19

other handicaps? and type of hearing loss? and severity of hearing
loss? and cause of hearing loss?
Family-Status Variables
Lanquaae spoken in the home.
1. For what percentage of the children was each of the following
languages the primary language spoken in the home: (a) English, (b)
American Sign Language (ASL, (c) Spanish, (d) Signed English System,
or (e) other language?
2. What was the magnitude of the relationship between language spoken in
the home and gender? and ethnicity? and presence/absence of other
handicaps? and type of hearing loss? severity of hearing loss? and
cause of hearing loss? and age at onset of hearing loss?
Parent(s) with hearing loss.
1. For what percentage of the children did one or both parents have a
hearing loss, overall and by project year?
2. What was the magnitude of the relationship between presence/absence of
parent with a hearing loss and gender? and ethnicity? and
presence/absence of other handicapping conditions? and type of
hearing loss? and severity of hearing loss? and cause of hearing
loss? and age at onset of hearing loss? and language spoken in the
home?
Finally, we will ask the question "what was the relationship between each
of the demographic variables and pretest receptive and expressive language
quotients?"
Identification Procedures
The general purposes for the identification-procedure portion of the study
were to: (a) determine the magnitude of the relationship between
identification procedure (e.g., crib-o-gram, high -risk register, audiological
testing, parental suspicion and referral) and the following three
identification variables: identification age, time interval between
suspected-hearing-loss age and identification age, and time interval between
20

identification age and program-placement age; (b) determine the optimal linear
relationship between the identification variables and pretest receptive and
expressive language scores.
Identification Variables
Identification age.
1. What were the mean and median ages at which the hearing loss was
identified (i.e., identification age in months), overall and by
program year?
2. What was the magnitude of the relationship between identification age
and the following demographic variables: gender, ethnicity, presence
of other handicaps, type of hearing loss, ueverity of hearing loss,
cause of hearing loss, age at onset of hearing loss, language spoken
in the home, and parental hearing loss?
Program-start age.
1. What were the mean and median ages at which the program was started
(i.e., program-start age in months), overall and by program year?
2. What was the magnitude of the relationship between program-start age
and the following demographic variables: presence of other handicaps,
severity of hearing loss, cause of hearing loss, age at onset of
hearing loss, language spoken in the home, and parental hearing loss?
Hearing-aid-fit ace.
1. What were the mean and median ages at which the hearing aid was fit
(i.e., hearing-aid-fit age in months), overall and by program year?
2. What was the magnitude of the relationship between hearing-aid-fit age
and the following demographic variables: presence of other handicaps,
severity of hearing loss, cause of hearing loss, age at onset of
hearing loss, language spoken in the home, and parental hearing loss?
Time interval between suspicion of a hearing loss and identification.
1. What were the mean and median time intervals, in months, between
suspected-loss age and identification age, overall and by program
year?
21

2. What was the magnitude of the relationship between suspicion-to-
identification interval and the following demographic variables:
presence of other handicaps, severity of hearing loss, cause of
hearing loss, age at onset of hearing loss, language spoken in the
home, and parental hearing loss?
Time interval between identification and program- start.
1. What were the mean and median time intervals, in months, between
identification age and program-placement age, overall and by project
year?
2. What was the magnitude of the relationship between identification-to-
program-start interval and the following demographic variables:
presence of other handicaps, severity of hearing loss, cause of
hearing loss, age at onset of hearing loss, language spoken in the
home, and parental hearing loss?
Time interval between suspicion and program-start.
1. What were the mean and median time intervals, in months, between
suspicion age and program-start age, overall and by project year?
2. What was the magnitude of the relationship between suspicion-to-
program-start interval and the following demographic variables:
presence of other handicaps, severity of hearing loss, cause of
hearing loss, age at onset of hearing loss, language spoken in the
home, and parental hearing loss?
Who suspected?
1. What percentage of the children were suspected to have a hearing loss
by caregivers, medical personnel, educators, other specialists, and
health/human services personnel?
2. What were the mean and median identification ages, program-start ages,
hearing-aid-fit ages, suspicion-to-identification time intervals,
identification-to-program-start time intervals, and suspicion-to-
program-start time intervals for each of the categories of individuals
who suspected a hearing loss?
22

3. Was there a statistically significant difference among the mean ages
and time intervals for the categories of individuals who suspected a
hearing loss? What was the magnitude of the differences (i.e.,
standardized mean differences, SMDs)?
Cause of suspicion.
I. What was the relative incidence of each factor that caused an
individual to suspect a hearing loss?
2. What were the mean and median identification ages for each of the
causes of suspicion of a hearing loss?
3. Was there a statistically significant difference among the mean ages
for the cause-of-suspicion categories? What were the magnitudes of
the differences (i.e., standardized mean differences, SMDs)?
Identification procedures.
I. What percentage of the children were identified by each of the
identification procedures?
2. What were the mean and median identification ages, program-start ages,
hearing-aid-fit ages, suspicion-to-identification time intervals,
identification-to-program-start time intervals, and suspicion-to-
program-start time intervals for each of the identification
procedures?
3. Was there a statistically significant difference among the mean ages
and intervals for the identification procedures? What were the
magnitudes of the differences (i.e., standardized mean differences,
SMDs)?
All variables.
1. What was the magnitude of the relationship among the following
variables: identification age, program-start age, hearing-aid-fit
age, suspicion-to-identification time interval, identification-to-
program-start time interval, suspicion-to-program-start time interval,
pretest LDS receptive language quotients, and pretest LDS expressive
language quotients?
23

2. Which linear combination of identification variables best predicted
pretest receptive and expressive language quotients?
Proctram Effectiveness
The general purposes of the program-effectiveness portion of the study
were to: (a) determine the effect of treatment variations (i.e., treatment
amount, planned and actual treatment density, communication methodology,
communication-methodology age, and diagnosis-to-communication-methodology
interval), of additional services(i.e., other non-parent/infant-program
services), and of program-start age on receptive and expressive language
gains; (b) determine the effectiveness of SKI*HI home-based intervention as
evidenced by expressive and receptive language developmental rates, gains in
auditory, communication-language, and vocabulary levels, time wearing hearing
aid and threshold improvement, parent-skill acquisition, program-placement
immediately after SKI*HI, and current placement in the community.
Treatment Variations
Treatment amount.
1. What, for all children pooled, was the mean amount of time spent in
the program?
2. What was the magnitude of the relationship between treatment amount
and the following demographic variables: presence of other handicaps,
severity of hearing loss, age at onset of hearing loss, language
spoken in the home, and parental hearing loss?
Planned treatment density.
1. For what percentage of the children were home visits scheduled to be
conducted twice a week, weekly, every other week (or bi-monthly),
monthly, and irregularly?
2. For what percentage of the children did the planned frequency of home
visits change?
Actual treatment density.
1. What were the mean and median actual numbers of visits per month,
overall?
24
4

2. What was U.: magnitude of the relationship between actual treatment
density and the following demographic variables: presence of other
handicaps, severity of hearing loss, age at onset of hearing loss,
language spoken in the home, and parental hearing loss?
Communication methodology.
1. What percentage of the children used an auditory (aural/oral), total
communication, or other communication methodology, overall?
2. What was the magnitude of the relationship between communication
methodology and the following demographic variables: presence of
other handicaps, severity of hearing loss, age at onset of hearing
loss, language spoken in the home, and parental hearing loss?
3. What were the mean and median ages at which a communication
methodology was selected?
4. What were the mean and median time intervals between program start and
choice of a communication methodology?
5. For what percentage of the children did the communication methodology
change?
Additional Services
Other Non-Parent/Infant-Program services.
1. What percentage of the children received the following services (other
than the home-programming services): (a) educational, (b) mental
health, (c) health, (d) social, (e) mental retardation, (f) speech and
hearing therapy, (g) combination (educational + speech and hearing
therapy), and (h) other services or combination of services?
Child Outcomes
Receptive and expressive langu?qe.
1. Was there a statistically significant difference between the mean pre-
and posttest LDS scores? between the mean actual and predicted
posttest scores? What was the magnitude of the difference (i.e.,
028?)
2. What were the mean and median PCIs, overall and by program year?
25

3. Was there a statistically significant difference among the mean and
median PCIa by gender? by ethnicity? by presence/absence of other
handicapping condition? by type of hearing loss? by severity of
hearing loss? by cause of hearing loss? by age at onset of hearing
loss? by language spoken in the home? by presence/absence of
hearing-impaired parent? by treatment amount? by actual treatment
density? by communication methodology?
4. Using value-added analysis, what was the mean growth experienced by
children above and beyond what would have been expected from
maturation alone, overall and by program year?
5. Did the added-program value differ by severity of hearing loss? by
communication methodology?
6. What was the magnitude of the relationship among the following
variables: treatment amount in months, actual treatment density,
program-start age in months, posttest receptive language scores, and
posttest expressive language scores?
7. What optimal linear combination of treatment variables best predicts
LDS receptive and expressive language posttest scores?
Child-competence outcomes.
1. For what percentage of the children was the hearing aid worn less than
1/4 time, 1/4 to 1/2 time, 1/2 to 3/4 time, over 3/4 time, and all of
the time? What were the mean and median amounts of time (in months)
that it took to attain each of the levels?
2. What were the mean and median threshold improvements for the unaided
hearing -loss- severity levels.
3. For what percentage of the children was Auditory-Development Level 1
the highest level attained and what were the mean and median amounts
of time (in months) that it took to attain that level? (The same
questions will be asked for Auditory-Development Levels 2 through 11.)
4. For what percentage of the children was Communication-Language
Development Level 1 the highest level attained and what were the mean
26

and median amounts of time (in months) that it took to attain that
level? (The same questions will be asked for Communication-Language
Development Levels 2 through 12.)
5. For what percentage of the children was Vocabulary-Interval Level 1
the highest level attained and what were the mean and median amounts
of time (in months) that it took to attain that level? (The same
questions will be asked for Vocabulary-Interval Levels 2 through 8.)
Parent Outcomes
Parent/caregiver-competence outcomes.
1. What were the mean and median numbers of auditory skills acquired by
the parent? The standard deviation?
2. What was the average time (in months) that it took to attain the
auditory skills?
3. What were the mean and median numbers of communication skills acquired
by the parent? The standard deviation?
4. What was the average time (in months) that it took to attain the
communication skills?
5. What were the mean and median numbers of aural/oral language
stimulation skills acquired by the parent? The standard deviation?
6. What was the average time (in months) that it took to attain the
aural/oral language stimulation skills?
7. Wnat were the mean and median numbers of total communication skills
acquired by the parent? The standard deviation?
8. What was the average time (in months) that it took to attain the total
communication skills?
9. What were the mean and median numbers of cognition skills acquired by
the parent? The standard deviation?
10. What was the average time (in months) that it took to attain the
cognition skills?
11. What were the mean and median numbers of visits needed for the parent
to achieve 80 to 100% accuracy on the hearing-aid competency test?
27
4

The standard deviation?
Community Outcomes
Program placement after SKI*HI.
1. What percentage of the children, upon completion of home intervention
programming, were placed in the following settings: (a) residential
program, (b) day school for the deaf, (c) self-contained classroom in
a public school, (d) mainstreamed classroom in a public school, (e)
other?
Current program placement.
1. What percentage of the children are currently placed in the following
settings: (a) residential program, (b) day school for the deaf, (c)
self-contained classroom in a public school, (d) mainstreamed
classroom in a public school, (e) other?
28

CHAPTER 4
PROCEDURES
The description of procedures for this investigation of the demographics,
identification procedures, and program effectiveness for children served by
the SKI*HI model from 1979 through 1991 follows the traditional format. With
the problem statement, literature review, and research questions presented in
earlier chapters, the rest of this chapter addresses the design, subjects,
instrumentation, data collection, and analyses.
Design
Because services to identified children could not ethically be denied in
light of earlier evidence of program effectiveness (JDRP certification of
SKI*HI, 1978, 1984), and after a careful consideration of the alternatives
(White & Pezzino, 1986), a pretest-posttest, single-group design was used
rather than a comparison-group design. Without a comparison group, options
for analysis are few. However, predictive models are common in the literature
(e.g., Bryk & Weisberg, 1976; Bryk & Woods, 1980; Shonkoff & Hauser-Cram,
1989; Weisberg, 1974). To control for maturation, the pre-post gains of
SKI*HI children were studied in four ways, using predictive models: (a) mean
posttest scores were compared with mean predicted posttest scores--the
predicted mean scores indicated what the children would have scored as a
result of maturation alone (Sheehan, 1979); (b) intervention developmental
rate was compared with pretest developmental rate using Proportional Changes
Indices (PCIs) (Wolery & Bailey, 1984); (c) growth associated with maturation
was compared with growth over and above maturation using value-added analysis
(Bryk & Weisberg (1976); Bryk & Woods (1980); Hebbeler, 1985; Markowitz,
Hebbeler, Larson, Cooper, & Edmister, 1991); and (d) multiple-regression
analysis was used to determine the optimal linear combination of treatment
variables for predicting posttest language scores.
Subjects
Target and Accessible Populations
The purpose of this study was to analyze and synthesize the information
29

in the national data bank on children with hearing impairments who had been
served by the SKI*HI model. Therefore, the target population was all children
who have been served by the SKI*HI model. In recent years, approximately 250
agencies have used the SEI*HI model, serving approximately 5000 children
annually. However, participation in the national data bank by adoption-site
personnel is completely voluntary and done without monetary compensation. For
example, during 1989-90, personnel from 28% (n=69) of the sites participated
in the national data bank, representing approximately 20% of the children
being served for that year. The accessible population was, then, all children
who received SKI*HI intervention since 1979 and for whom data were submitted
to the SKI*HI National Data Bank.
Sample
Because all data submitted to the national data bank were included in the
analyses for this study, the accessible population and the sample are
identical. Between July 1979 and June 1991, personnel from 143 different
agencies, representing 30 states and one Canadian province, had submitted data
for 5,178 children (Table 2). However, because complete records were not
available for every child, sample sizes for specific variables vary throughout
this report. Because demographic summaries for the children are reported in
Chapter 5 of this report, further characteristics of the children will not be
elaborated here.
Instrumentation
Language-Development Scale
When Project SKI*HI was first validated in 1979, the primary measure of
both expressive and receptive language (up to the language age of 36 months)
was the Receptive-Expressive Emergent Language Scale (REEL). The REEL was
standardized on normal hearing children. By the time of SKI*HI revalidation
in 1984, this instrument had been replaced by the SKI*HI Language Development
Scale (LDS) (Tonelson & Watkins, 1979), which was developed by Project SKI*HI
personnel and validated specifically for young hearing-impaired children.
The SKI*HI Language Development Scale (LDS) lists the expressive and
30

Table 2
Location, Number of Sites, and Number of Children in the National Data Bank Between
1979 and 1991, Ages Birth Throuah 72 Months at Program Start
States and OneForeign Country Number of Sites Number of Children % Of Children
Alaska 1 20 0.4
Arkansas 12 371 7.2
Connecticut 1 12 0.2
Florida 3 12 0.2
Georgia 1 564 10.9
Iowa 2 31 0.6
Indiana 1 81 1.6
Kansas 3 15 0.3
Louisiana 1 27 0.5
Maine 4 8 0.2
Michigan 12 79 1.5
Minnesota 6 43 0.8
Mississippi 2 56 1.1
Missouri 1 171 3.3
North Dakota 1 25 0.5
Nebraska 4 11 0.2
New Mexico 1 144 2.8
New York 3 68 1.3
Ohio 10 131 2.5
Oklahoma 2 195 3.8
Oregon 1 19 0.4
Pennsylvania 4 65 1.2
South Carolina 1 125 2.4
Tennessee 2 447 8.6
Texas 55 1552 30.0
Utah 1 715 13.8
Virginia 1 20 0.4
West Virginia 1 3 0.1
Wisconsin 1 1 <.1
Wyoming 1 1 <.1
Unidentified Sites 6 8 0.2
Canada 3 158 3.1
Total 146 5178 100
31

receptive language skills that a child of a particular age would normally
demonstrate. Unlike other scales, the LDS does not emphasize auditory items.
In addition, children who use total communication are not penalized on this
scale as they are on many other language-development scales. The child is
given credit for understanding and use of signs. Credit is also given for
misarticulated verbal responses. Therefore, hearing-impaired children are not
penalized for their disability.
The data gathered for the reliability and validity study were obtained
from children in SKI*HI programs across the country. Three different
procedures were used to estimate the reliability of the LDS: (a) The
percentage of agreement among 23 examiners was calculated by having the
examiners observe, via videotape, children manifesting language behaviors.
Inter-examiner agreement was 80% and 78% for the receptive and expressive
scales, respectively. (b) Intra-examiner agreement (or test-retest
reliability) was estimated by correlating examiners' responses from
observation one and observation two. Intra-examiner agreement was .86 and .92
for the receptive and expressive scales, respectively. (c) Finally, internal
consistency coefficients, calculated from the completed scales of 115 hearing-
impaired children, were .93 and .94 for the receptive and expressive scales,
respectively.
Two different procedures were used to estimate the validity of the LDS:
(a) The concurrent validity of the LDS was estimated by correlating scores on
the LDS with scores on the REEL. Coefficients of .78 and .79 were obtained
for the receptive and expressive scales, respectively. (b) With respect to
construct validity, the coefficients of reproducibility as determined by the
Guttman scaling technique were uniformly high for both units and individual
items within units. A .99 coefficient of reproducibility was obtained for
both the receptive and expressive scales.
SKI*HI Data Sheet
The SKI*HI Data Sheets (Appendix A) were developed by SKI*HI Institute
personnel. A copy of the Data Sheet and detailed instructions for its
32

completion (Appendix B) are provided in all SKI*HI manuals. The most recent
version of the SKI*HI manual, entitled Programming for Hearing Impaired
Infants Through Home Intervention: SKI*HI Home Visit Curriculum (4th ed.)
(Clark & Watkins, 1985), provides the instructions on pages 70 through 87.
A formal study of the reliability and validity of the entries on the data
sheets was conducted in 1990 in conjunction with a study of the reliability
and validity of a questionnaire that was developed to investigate
identification procedures. For 8% (n = 116) of the 1,404 children whose
demographic data was included in the identification-procedure study (to be
described later in this section), inter-examiner agreement data were sought
for their SKI*HI Data Sheets. The children were randomly selected from each
of the sites participating in the identification-procedure study. Inter-coder
agreement responses were returned for 65% of the children. (n = 99). For 21
of those children, the agency no longer had the children's records, so the
duplicate data sheets could not be completed. For the remaining 78 children
for whom the responses could be used, average inter-coder agreement for the
data sheet was 87%, with a standard deviation of 10%, and a median of 88%.
Prior to 1985, the Data Bank was located at the University of Virginia
Evaluation Research Center, and data were entered there for all but the 1982-
83 year. The computer database for 1979-82 and 1983-85 was then moved to
Utah, along with the data sheets that had been submitted for the 1982-83 year.
For the 1982-83 year and for all years beginning with 1985-86, the following
data-entry procedures were used. When the data sheets were received at the
SKI*HI Institute, carefully trained data coders encoded the data onto a Data
Coding Instrument (Appendix C), using coding conventions developed by the
Research Director (Appendix D). To control for the consistency and accuracy
of data coding, intercoder-agreement checks for every 20 data sheets were
conducted prior to computer entry (intercoder agreement was consistently above
90%) and disagreements were resolved. Furthermore, all computer entries were
checked for accuracy.
REAP Questionnaire
A questionnaire (Appendix E) was developed for the purposes of learning
33

(a) which method of screening for hearing loss in infants was dominant among
children served by the SKI*HI model; (b) which hearing-screening method
resulted in the earliest mean age of identification for infants; (c) which
hearing-screening method resulted in the earliest program placement; and (d)
where children were placed after receiving services from a program using the
SKI*HI model. The one-page questionnaire included both closed and open
questions. Structurally, the questions were clear and as brief as possible.
Few technical words were used. Closed questions were asked first, followed by
open questions.
A pilot study was undertaken at the Utah Parent/Infant Program to
determine if (a) the questions could be answered using information in
children's files; (b) the questions were understandable; and (c) office
personnel could complete the questionnaire or if it was necessary for the
supervisor to complete the questionnaire. During January, 1990, a first
draft of the questionnaire was piloted, using 10 children randomly selected
from children enrolled in the Utah Parent/Infant Program between 1987 and
1989. The instructions and the 10 questionnaires were first given to the
secretary of the Utah program. After the secretary had completed the 10
questionnaires, the supervisor of the Utah program and the researcher reviewed
the files for the same 10 children to determine if the supervisor responded
differently to the questions. Based on this pilot data, the questionnaire was
modified and it was determined that the supervisor had access to more
background information and could better interpret the information in the
children's files than the secretary.
Again, when the questionnaires were received at the SKI*HI Institute,
carefully trained data coders encoded the data directly into a computer file,
using coding conventions developed by the Research Director (Appendix F). All
entries were verified for accuracy.
Inter-coder agreement estimates for 7% (1q, = 99) of the questionnaires
were obtained in 1990. Thr?, avIxage parcentale of agreement was 82% (sd= 12%,
median = 83%).
34

Data Collection
SKI*HI Data Sheet
As general SKI*HI procedure, at each project site demographic, LDS test,
child development, and parent-skill data were collected by the parent advisor
(PA) on the SKI*HI Data Sheets, designed specifically for submission to the
SKI*HI Data Bank (Appendix A). (See Appendix G for a summary of the Utah PAs'
experience, education, and certification for the 1990-1991 program year.) The
PAs received thorough training in the completion and submission of the data
sheets. The careful training included a description of and orientation to the
data-collection system and the data sheets; practica, spaced throughout
training, on making entries on the data sheets; and feedback from trainers on
the practicum experiences. Detailed printed instructions were provided to
each new PA and to each program supervisor (Appendix B). Parent advisors and
their supervisors were encouraged to contact the SKI*HI Institute whenever a
question arose as to data collection and reporting. All testing was done by
the parent in conjunction with the SKI*HI PA, who made weekly visits to the
home. Replication site personnel submitted the data to the SKI*HI Data Bank
annually for analysis.
Because the PA administered all annual pre- and posttests in conjunction
with the parent and records weekly parent- and child-progress data, the PA
knew the child's pretest scores (i.e., examiners without knowledge of pretest
scores cannot be used). The SKI*HI model is an educational model for delivery
of services to the families of children with hearing impairments 4n their
homes, many of which were in rural areas. Nearly all services were provided
in the home, including the testing of the children and the advisement of
parents. As a working, replicable educational model for delivery of services
in the home, the SKI*HI model required that the PA do both the '-eating and
providing of services to the family and child. Consequently, financial
resources for hiring someone other than the PA to travel to the home to do the
testing were not available, leaving instrumentation as a potential threat to
the internal validity of the study's findings.
35

REAP Questionnaire
In the July 1989, site coordinators for all SKI*HI adoption sites
submitting data to the National Data Bank were contacted by letter requesting
their participation in additional data collection (Appendix H). Coordinators
from 57 sites agreed to participate in additional data collection; however,
for 11 of those sites, there were no data in the National Data Bank on any of
their children. Consequently, ccordinators from 46 sites actually
participated in the additional data collection. For these 46 sites,
demographic and test data for a total of 1,467 children had been submitted to
the National Data Bank.
Before sending the questionnaires to the coordinators, the child
identification nu,-,hers were recorded on the questionnaires for every child
enrolled during any of three years (i.e., 1986-87, 1987-88, or 1988-89).
Instructions for completing the questionnaires were photocopied onto the back
of each form (Appendix E). Along with a copy of the signed participation
agreement (Appendix H) and a letter describing the importance of the
additional data, the questionnaires were mailed to each coordinator, for
completion within 30 days. In addition, as a reward for participating, each
site was sent a check at the following rates: (a) one to twenty-four
children--$20; (b) 25 to 49 children--between $25 and $50; (c) 50 to 99
children--between $60 and $85; (d) 100 to 149 children--up to $150; and (e)
150 children or more--$200. As a reminder, coordinators who did not return
the questionnaires within the specified timeline were telephoned. All site
coordinators returned the questionnaires, except one, for a 96% response rate.
Data Analysis
For all interval- and ratio-scale variables, basic descriptive statistics
were computed--means, modes, medians, standard deviations, and ranges. For
nominal- and ordinal-scale variables, frequencies and percentages were
computed, as well as two-way frequency tables, with Cramer's V calculated to
estimate the magnitude of the relationship between the variables. Two-way
frequency tables were used to illustrate possible interactions between
variables, especially demographic characteristics and treatment variations.
36
.`) t

The approach was designed to demonstrate how the characteristics of the
children in our accessible population, especially pre-treatment influences
(e.g., severity of hearing loss or presence of other handicapping conditions)
and treatment variations (e.g., communication methodology or treatment
density), were related.
For the analysis of child progress, first LDS teat scores were
transformed to Intervention 1:fficiency Indices (IEI) (Bagnato & Neisworth,
1980) by dividing the developmental gain between the pre- and posttest by the
time between the pre- and posttest. The IEI was then divided by the pretest
developmental rate (PDR) (i.e., PDR = pretest developmental age divided by
the pretest chronological age [CA)). These transformations yielded
Proportional Change Indices (PCIs).
IEI/PDR = PCI
Children whose rates of development were slower during intervention than at
pretest received a PCI of less than 1.0, and those whose rates of development
accelerated during intervention received a PCI greater than 1.0 (Wolery,
1983).
An inherent problem in the analysis of progress for infants and young
children is maturation. Sheehan (1979) suggested using initial testing
information for predicting a child's performance in the future and for
comparing pretest developmental rates with developmental rates during
intervention. The procedure has been criticized because it is based on the
assumption that development occurs at a consistent rate and, therefore, it
does not address the problem of growth spurts. It should be remembered that
chances of growth spurts are equally distributed at pre- and posttest times.
In the case of pretest scores, the growth spurt would be reflected in the
developmental rate, which would then be reflected in the predicted posttest
score. Strong correlations, ranging from .90 to .93, between pre- and
posttest scores were obtained, further supporting this argument.
Second, observed LDS receptive and expressive posttest scores were
compared to predicted posttest scores. As for the first data analysis, each
child's pretest developmental rate (PDR) was determined by dividing his or her
37

pretest developmental age by the pretest CA. The posttest CA of the child, in
months, was then multiplied by the PDR to determine a predicted posttest
score. The predicted posttest score was used as a standard against which to
compare the observed posttest score.
PDR x Posttest CA = Predicted Posttest Score
In conjunction with the other analyses, the comparison of predicted with
observed posttest scores provides an indication of program effectiveness as
compared to what would be expected due to maturation alone.
Third, dependent t-tests were used to determine if the differences
between the pre- and posttest LDS receptive mean scores and the pre- and
posttest LDS expressive mean scores were statistically significant. Dependent
t-tests were also used to determine if the differences between the observed
posttest mean scores and the predicted posttest mean scores were statistically
significant.
Fourth, value-added analysis (Bryk & Weisberg, 1976; Hebbeler, 1985;
Markowitz et al., 1991) was used to estimate the "value-added by the program
above and beyond that which would have been without the program" (Hebbeler,
1985, p. 2). Using the total distribution of scores for the pretest "to
approximate the longitudinal growth rate that children would display in the
absence of intervention as they grow older" (Markowitz et al., 1991, p. 378),
pretest scores were regressed on pretest CA to obtain a coefficient that
indicates the growth rate prior to the pretest. For each child, the
regression coefficient was then multiplied by the amount of time the child was
in the program to estimate the amount of growth due to maturation alone. To
determine the child's total growth, the pretest score was subtracted from the
posttest score. Finally, the growth due to maturation was subtracted from the
total growth to estimate the growth due to program participation (i.e., the
value added). Hebbeler (1985) stated that
The value-added method is not as prone to error due to developmental
spurts because the growth rates are computed for the entire group or
subgroups of children through a regression equation rather than for each
child individually through the use of a ratio. (p. 3)
38

Value-added analysis also allows for other variables to be included in the
equation in addition to pretest CA. For example, if hearing-loss severity
interacts with pretest age, then hearing-loss severity could be included in
the equation. Regression coefficients not only were computed for the children
overall but also for subgroups of children (e.g., aural/oral vs. total
communication).
Fifth, one-way analyses of variance were conducted to determine the
statistical significance of differences between/among mean PCIs. If a
significant F was obtained, the Tukey multiple-comparison technique was used
to determine which differences between means were statistically significant.
In addition, because the median more validly reflects average performance when
a distribution of scores is skewed, nonparametric statistics (i.e., the two-
sample median test or the k-sample median test) were used to determine the
statistical significance of differences between/among median PCIs.
Sixth, multiple regression was used to determine the optimal linear
combination of treatment variables that best predicted expressive and
receptive language developmental rates during intervention.
Finally, SMDs were calculated by dividing the difference between the pre-
and posttest means by the pretest standard deviation to determine the
magnitude of the difference between the mean scores. Cohen's (1988) standards
of .2 as a small effect size, .5 as a medium effect size, and .8 as a large
effect size were used as arbitrary, though reasonable, criteria to judge the
magnitude of SMDs.
Summary
In this chapter, the procedures followed in conducting this investigation
have been spelled out, with considerable detail regarding instrumentation and
data collection. The outline of our approach to data analysis has been
sketched. The details will be filled in as some information about our
accessible population is presented in the next chapter, followed by the
results of our analyses of the data.
39

CHAPTER 5
DEMOGRAPHIC CHARACTERISTICS OF THE SUBJECTS
The major concern in conducting this investigation of home-based
programming for children with hearing impairments was to analyze and
synthe#ize the information in the SKI*HI National Data Bank for educators of
children with hearing impairments and for researchers. To set the context for
characterizing the relevant findings from the data collected from 1979-1991
and to address the first general purpose of the investigation, which was to
describe the demographic characteristics of the children, we present in this
chapter some general information about the population of children and their
families for whom data were submitted to the Data Bank. We will first present
the information related to the children's status prior to the program,
followed by information related to the families' status. (The pronoun "we" in
this chapter and in those that follow refers to the Project staff.)
Lastly, we asked the question "Were the demographic variables associated
with child expressive or receptive language status at the time program
services began?" To address that question, we will present the findings from
analyses of variance that were conducted for each of the demographic
variables, using pretest expressive and receptive language quotients as
dependent variables. A quotient is a ratio of language age to chronological
age times 100. It should be emphasized that only pretest scores were used for
these analyses. The findings related to program effectiveness using posttest
language scores as dependent variables will be reserved for Chapter 7.
As noted in Chapter 4, data for 5,178 children were submitted to the
SKI*HI National Data Bank between July 1979, and June 1991. In some
instances, parent advisors failed to submit complete data for each child.
Consequently, total sample sizes will vary for the demographic variables
discussed below, which include gender, ethnicity, presence of other handicaps,
type of hearing loss, severity of hearing loss, cause of hearing loss, age at
onset, language spoken in the home, and presence of parent with a hearing
impairment. For every demographic variable, we will present two-way frequency
tables describing the relationships between the variables.
40

Child-Status Variables
Gender
One question of interest was whether the percentages of male and female
children were relatively equal, overall and for each of the program years
since 1979. Inspection of Tables 3 and 4 indicates that overall and for all
program-start years, except 1987-88, the percentage of males was slightly
greater than the percentage of females (i.e., 55% and 45%, respectively).
These data were consistent with those provided by Gallaudet (Table 1). Gender
information was not reported for 2 1/2% of the total population of children.
Table 3
Frequencies and Percentages of Children by Gender, 1979-1991
Male 2772 55
Female 2276 45
Total 5048 100
Note: Total children possible = 5,178.
For Table 4, and for all tables in which a relationship between two
nominal-scale variables is depicted, Cramer's V will be reported. Cramer's V
is a coefficient which describes the strength of a relationship between two
nominal variables. The coefficient always varies between 0 and 1, regardless
of the si e of the table (Welkowitz, Ewen, & Cohen, 1982). For 2 x 2 tables,
Cramer's V equals the Phi coefficient. For Table 4, Cramer's V equaled .05,
which indicated that there was practically no relationship between program-
start year and gender. That is, the percentages within the cells were what
would be expected, based on the marginal (i.e., row and column) values. For
coefficients that were small, moderate, and large in magnitude, we will
identify those cell values that were larger or smaller than expected based on
the marginal values.
41
61

Table 4
Frequencies and Percentages of Gender, Overall and by Program-Start Year
Program Year Male FemaleTotal N
7-1-79 thru 24 64.9 13 35.1 37
6-30-80
7-1-80 thru 79 59.0 55 41.0 134
6-30-81
7-1-81 thru 212 53.3 186 46.7 398
6-30-82
7-1-82 thru 323 55.8 256 44.2 579
6-30-83
7-1-83 thru 215 52.7 193 47.3 408
6-30-84
7-1-84 thru 237 57.5 175 42.5 412
6-30-85
7-1-85 thru 207 55.9 163 44.1 370
6-30-86
7-1-86 thru 294 55.0 241 45.0 535
6-30-87
7-1-87 thru 266 49.4 272 50.6 538
6-30-88
7-1-88 thru 308 55.8 244 44.2 552
6-30-89
7-1-89 thru 322 55.8 255 44.2 577
6-30-90
7-1-90 thru 285 56.1 223 43.9 508
6-30-91
Overall 2772 54.9 2276 45.1 5048
Note: Total children possible = 5,178.Cramer's V = .05.
42

Ethnicity
Of interest, too, was what percentage of the children served by the
participating sites had been minority children and whether the relative
percentages for each ethnic group had differed by program-start year. The
data in Tables 5 and 6 indicate that 72% of the children were Caucasian. This
percentage was somewhat higher than that reported by Gallaudet (see Table 1).
The remaining 28% of the children were primarily of African-, Spanish-,
Native-, or Asian-American descent. The low Cramer's V (.07) reflects little
change in the relative percentages of children from each ethnic group across
the program-start years (Table 6). Information regarding the children's
ethnic background was not reported for 3% of the total population.
The relationship between ethnicity and gender was practically nil
(Cramer's V = .04). As Table 7 indicates, the percentages for male children
were consistently greater than or similar to the percentages for female
children for each of the ethnic groups.
Table 5
Frequencies and Percentages of Children by Ethnicity, 1979-1991
Ethnicity
Caucasian 3616 72.0
African American 726 14.4
Spanish American 470 9.4
Native American 109 2.2
Asian American 46 .9
Other 58 1.2
Total 5025 100.0
Note: Total children possible = 5,178.
43

Tab
le 6
freq
uenc
ies
and
Perc
enta
ges
of C
hild
ren
by E
thni
city
, Ove
rall
and
by P
rogr
am -
Star
t Yea
r
Prog
ram
Yea
rC
auca
sian
Afr
ican
Am
eric
anSp
anis
h A
mer
ican
Nat
ive
Am
eric
anA
sian
Am
eric
anO
ther
Tot
al N
7-1-
79 th
ru29
82.9
411
.42
5.7
356-
10-8
0
7-1-
80 th
ru10
983
.29
6.9
53.
85
3.8
1.8
21.
513
16-
30-8
1
7-1-
81 th
ru29
673
.463
15.6
194.
713
3.2
71.
75
1.2
403
6-30
-82
7-1-
82 th
ru41
571
.488
15.1
396.
724
4.1
61.
09
1.5
581
6-30
-83
7-1-
83 th
ru31
576
.142
10.1
4210
.13
.76
1.4
61.
441
46-
30-8
4
7-1-
84 th
ru30
173
.652
12.7
4210
.31
.2
2.5
112.
740
96-
30-8
5
7-1-
85 th
ru27
373
.845
12.2
4010
.85
1.4
2.5
51.
437
06-
30-8
6
7-1-
86 th
ru39
173
.981
15.3
387.
29
1.7
61.
14
.852
96-
30-8
7
7-1-
87 th
ru38
973
.786
16.3
428.
07
1.3
3.6
1.2
528
6-30
-88
7-1-
88 d
m37
368
.292
16.8
5810
.610
1.8
5.9
91.
654
76-
30-8
9
7-1-
89 th
ru38
767
.387
15.1
8214
.313
2.3
3.5
3.5
575
6-30
-90
7-1-
90 th
ru33
867
.277
15.3
6112
.119
3.8
51.
03
.650
36-
30-9
1
Ove
rall
3616
72.0
126
14.4
470
9.4
109
2.2
46.9
581.
250
25
Note:
Total children possible =
5,178.
Cramer's V =
.07.
44
64J
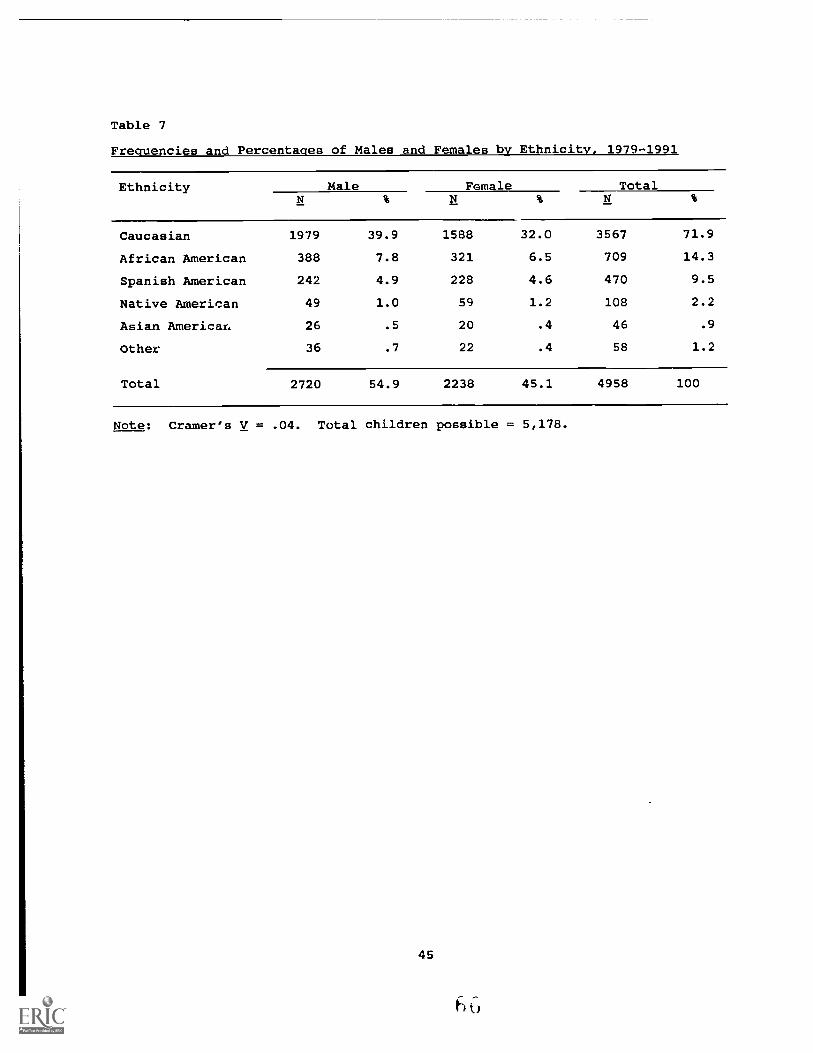
Table 7
Frequencies and Percentages of Males and Females by Ethnicity, 1979-1991
Ethnicity Male Female Total
Caucasian 1979 39.9 1588 32.0 3567 71.9
African American 388 7.8 321 6.5 709 14.3
Spanish American 242 4.9 228 4.6 470 9.5
Native American 49 1.0 59 1.2 108 2.2
Asian Americar. 26 .5 20 .4 46 .9
Other 36 .7 22 .4 58 1.2
Total 2720 54.9 2238 45.1 4958 100
Note: Cramer's V = .04. Total children possible = 5,178.
45

Other Handicapping Conditions
Because program effectiveness may be related to the presence of
additional handicapping conditions, the parent advisors reported "yes" if the
children had a professionally confirmed handicap, other than hearing loss. No
data were collected regarding the types or the severity of the other
handicapping conditions. Approximately 25% of the children served had a
handicapping condition in addition to hearing loss (Table 8). This percentage
was slightly lower than that reported by Gallaudet (see Table 1). A low
Cramer's V (.08) reflects a small increase in the percentage of children with
additional handicaps for the 1980-81 program-start year (Table 9).
Information regarding the presence of another handicapping condition was not
reported for 4% of the total population of children.
Table 8
Frequencies and Percentages of Children by Presence of Other Handicaps, 1979-
1991
Type
Other Handicap Present 1227 24.7
Other Handicap Not Present 3747 75.3
Total 4974 100.0
Note: Total children possible = 5,178.
46
6 T
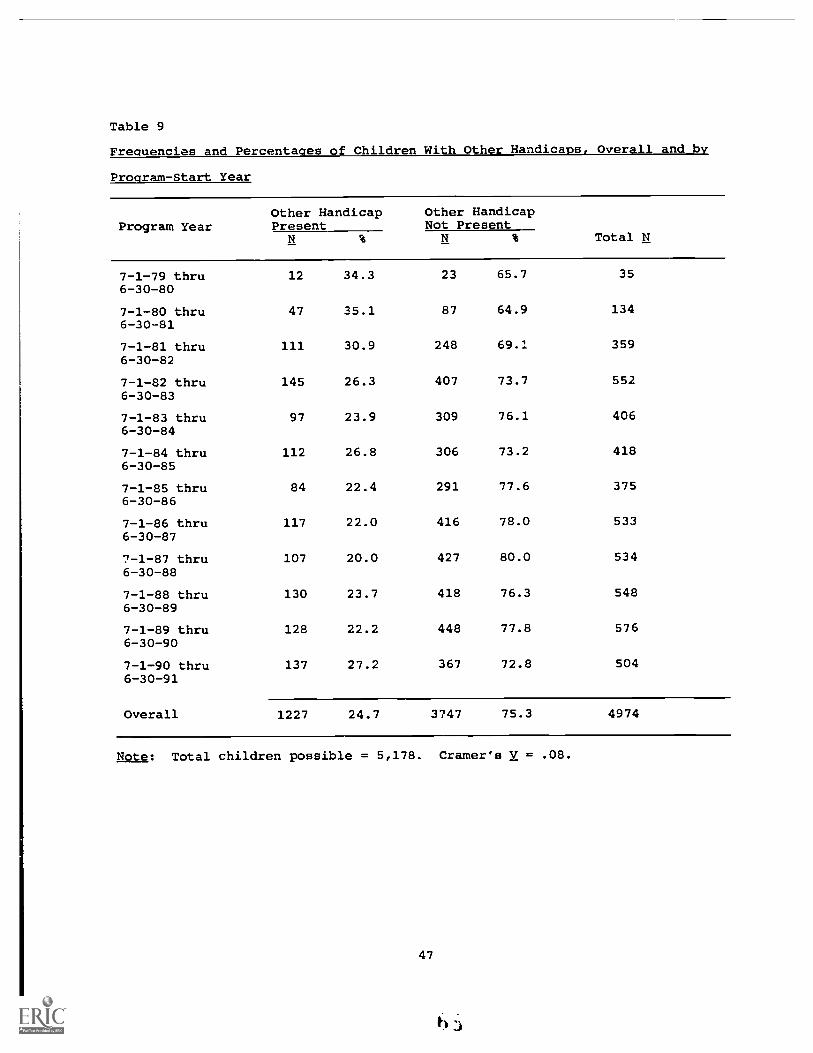
Table 9
Frequencies and Percentages of Children With Other Handicaps, Overall and by
Program-Start Year
Other Handicap Other HandicapProgram Year Present Not Present
Total N
7-1-79 thru 12 34.3 23 65.7 356-30-80
7-1-80 thru 47 35.1 87 64.9 1346-30-81
7-1-81 thru 111 30.9 248 69.1 3596-30-82
7-1-82 thru 145 26.3 407 73.7 5526-30-83
7-1-83 thru 97 23.9 309 76.1 4066-30-84
7-1-84 thru 112 26.8 306 73.2 4186-30-85
7-1-85 thru 84 22.4 291 77.6 3756-30-86
7-1-86 thru 117 22.0 416 78.0 5336-30-87
7 -1-87 thru 107 20.0 427 80.0 5346-30-88
7-1-88 thru 130 23.7 418 76.3 5486-30-89
7-1-89 thru 128 22.2 448 77.8 5766-30-90
7-1-90 thru 137 27.2 367 72.8 5046-30-91
Overall 1227 24.7 3747 75.3 4974
Note: Total children possible = 5,178. Cramer's V = .08.
47
63-

Tables 10 and 11 indicate little relationship between the presence of
other handicapping conditions and gender and between the presence of other
handicapping conditions and ethnic background for the children in this study
(Cramer's V = .03 and .06, respectively). Males were reported to have an
additional handicapping condition more frequently than females, but not more
frequently than expected given the marginal frequencies. Likewise, Caucasian
children were reported to have an additional handicapping condition more
frequently than minority children, but not more frequently than expected based
on the marginal frequencies.
Table 10
Frequencies and Percentages of Children with Other Handicaps by Child's
Gender, 1979-1991
GenderOther HandicapPresent
Other HandicapNot Present Total
Male
Female
Total
697 14.2
516 10.5
1998 40.7
1702 34.6
2695 54.9
2218 45.1
1213 24.7 3700 75.3 4913 100.0
Note: Cramer's V = Phi = .03. Total children possible = 5,178.
48
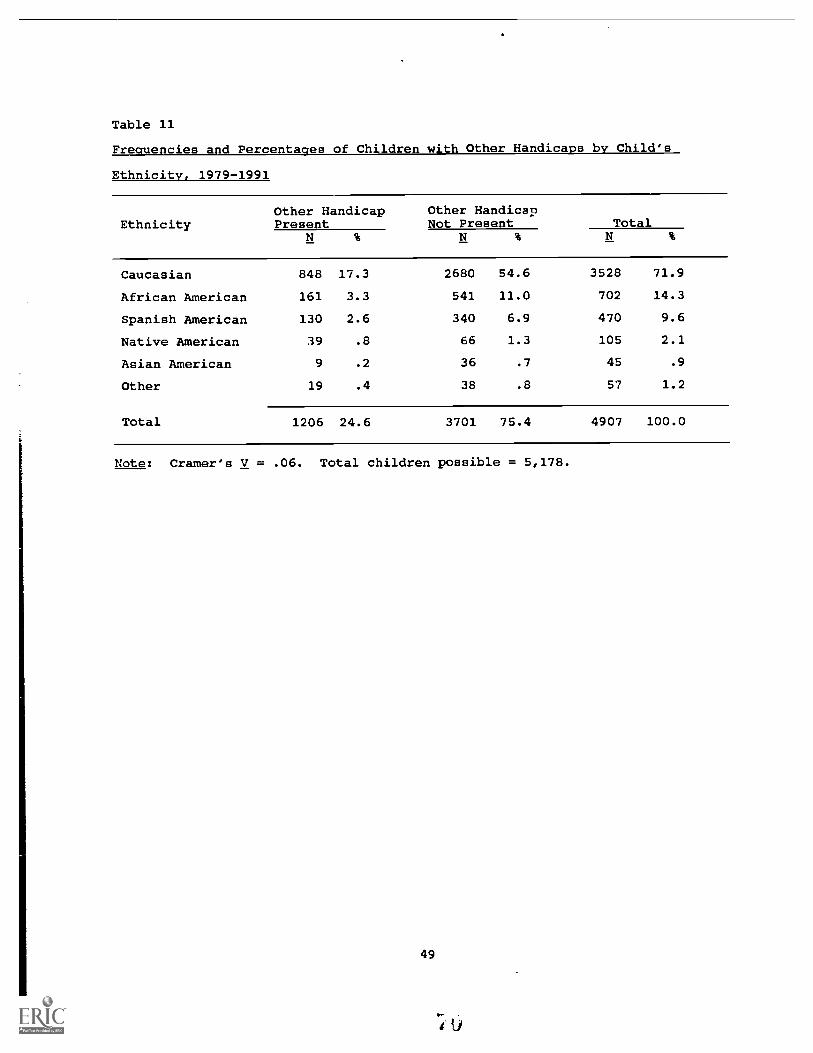
Table 11
Frequencies and Percentages of Children with Other Handicaps by Child's
Ethnicity, 1979-1991
EthnicityOther HandicapPresent
Other HandicapNot Present Total
Caucasian 848 17.3 2680 54.6 3528 71.9
African American 161 3.3 541 11.0 702 14.3
Spanish American 130 2.6 340 6.9 470 9.6
Native American 39 .8 66 1.3 105 2.1
Asian American 9 .2 36 .7 45 .9
Other 19 .4 38 .8 57 1.2
Total 1206 24.6 3701 75.4 4907 100.0
Note: Cramer's V = .06. Total children possible = 5,178.
49

Type of Hearing Loss
The vast majority (82%) of the children had sensorineural hearing losses
(Table 12). No comparison data were available from Gallaudet for this
variable. A small Cramer's V (.18) reflects some changes in the relative
percentages across the program-start years (Table 13). For the 1990-91 year,
the percentage of children with a conductive hearing loss was twice as large
as it had been the prior two years. Additionally, for the 1982-83 and 1983-84
program-start years, the percentages of children with undetermined losses were
three to four times the percentages of the preceding and succeeding years.
Information regarding the type of hearing loss was not reported for 4% of the
children.
Table 12
Frequencies and Percentages of Children by Type of Hearing Loss, 1979-1991
Type
Sensorineural 4081 82.1
Mixed 393 7.9
Conductive 333 6.7
Not Yet Determined 161 3.2
Total 4968 100.0
Note: Total children possible = 5,178.
50

Table 13
Frequencies and Percentages of Children by Type of Hearing Loss, Overall and by Program-Start Year
Program Year Sensorineural Conductive Mixed UndeterminedTotal N
7-1-79 thru 32 94.1 2 5.9 34
6-30-80
7-1-80 thru 123 91.8 2 1.5 6 4.5 3 2.2 134
6-30-81
7-1-81 thru 339 85.4 19 4.8 20 5.0 19 4.8 397
6-30-82
7-1-82 thru 452 78.7 19 3.3 45 7.8 58 10.1 574
6-30-83
7-1-83 thru 310 73.8 30 7.1 24 5.7 56 13.3 420
6-30-84
7-1-84 thru 337 82.0 16 3.9 45 10.9 13 3.2 411
6-30-85
7-1-85 thru 306 84.3 17 4.7 38 10.5 2 .6 363
6-30-86
7-1-86 thru 447 87.0 23 4.5 43 8.4 1 .2 514
6-30-87
7-1-87 thru 457 86.9 21 4.0 44 8.4 4 .8 526
6-30-88
7-1-88 thru 442 81.5 46 8.5 50 9.2 4 .7 542
6-30-89
7-1-89 thru 469 82.1 51 8.9 50 8.8 1 .2 571
6-30-90
7-1-90 dust 367 76.1 87 18.0 28 5.8 482
6-30-91
Overall 4081 82.1 333 6.7 393 7.9 161 3.2 4968
Note: Total children possible = 5,178. Cramer's V = .18.
51

A low Cramer's V (.17) indicates a small relationship between type of
hearing loss and presence of an additional handicapping condition (Table 14).
(Note: Children whose type of hearing loss had been reported as
"undetermined" were removed from this analysis.) Larger percentages of mixed
and conductive losses were reported for children with additional handicapping
conditions than would be expected based on the marginal proportions.
Table 14
Frequencies and Percentages of Children With and Without Other Handicaps by
Type of Hearing Loss, 1979-1991
Type of HearingLoss
Other HandicapPresent
Other HandicapNot Present Total
Conductive 121 2.6 205 4.4 326 6.9
Sensorineural 845 18.0 3135 66.8 3980 84.8
Mixed 171 3.6 217 4.6 388 8.3
Total 1137 24.2 3557 75.8 4694 100.0
Note: Cramer's V = .17. Total children possible = 5,178.
An even lower Cramer's V (.09) was obtained for the relationship between
type of hearing loss and race (Table 15). That is only slight differences in
the cell values were observed as compared to those that would be expected
based on the marginal proportions.
52

Table 15
Frequencies and Percentages of Children by Ethnicity and Type of Hearing Loss, 1979-1991
Typ
e of
Hea
ring
Cau
casi
anA
fric
an A
mer
ican
Asi
an A
mer
ican
Span
ish
Am
eric
anN
ativ
e A
mer
ican
Oth
erT
otal
Los
sN
%N
%N
%
Con
duct
ive
226
4.8
21.4
5.1
521.
123
.53
.133
07.
0
Sens
orin
eura
l29
1461
.560
212
.733
.735
87.
667
1.4
481.
040
2284
.9
Mix
ed27
75.
949
1.0
2.0
37.8
13.3
5.1
383
8.1
Ove
rall
3417
72,2
672
14.2
40.8
447
9.4
103
2.2
561.
247
3510
0.0
Note:
Cramers V = .09.
Total children possible = 5,178.
53
t `Y

Severity of Hearing Loss
Because program effectiveness may be related to the severity of the
children's hearing loss, the children's unaided hearing thresholds were
reported by participating site personnel. The parent advisors were instructed
to report the hearing sensitivity of the child in numerical dB values, using
the child's best ear. These values were then converted to severity levels:
no loss ( < 25 dB); mild (25 - 40 dB); moderate (45 - 60 dB); severe (65 - 90
dB); and profound ( > 90 dB). Generally, those children categorized as having
"No Loss" were those with fluctuating, conductive hearing losses. Hearing-
threshold data were not reported for 14% of the children.
The mean unaided severity level was 74 dB (sd = 25.4). The median
severity level was 75 dB, which indicates that 50% of the children had hearing
losses in the severe-to-profound range. Inspection of Table 16 indicates that
65% of the children had hearing losses in the moderate-through-severe range,
as compared to the 42% reported by Gallaudet (see Table 1). While 23% of the
children were reported as having profound hearing losse3--compared to 38%
reported by Gallaudet--only 12% were reported as having no loss or a mild
loss, compared to the 18% reported by Gallaudet.
Across the program-start years, only small changes in the relative
proportions were obtained (Table 17). The low Cramer's V (.11) reflects small
increases in the percentages of children with no loss for the 1989-90 and
1990-91 program years. This increase likely reflects the additional
enrollment of children with conductive hearing losses, especially for the
1990-91 year, which was noted previously in this chapter.
54
fU

Table 16
Frequencies and Percentages of Children by Severity of Unaided
Hearing Loss, 1979-1991
Severity N %
No 166 3.7
Mild 388 8.7
Moderate 884 19.8
Severe 2005 45.0
Profound 1015 23.0
Total 4458 100.2
Note: Mean severity overall= 75 dB (sd = 25.4, median = 75, mode = 90).Total children possible = 5,178.
55
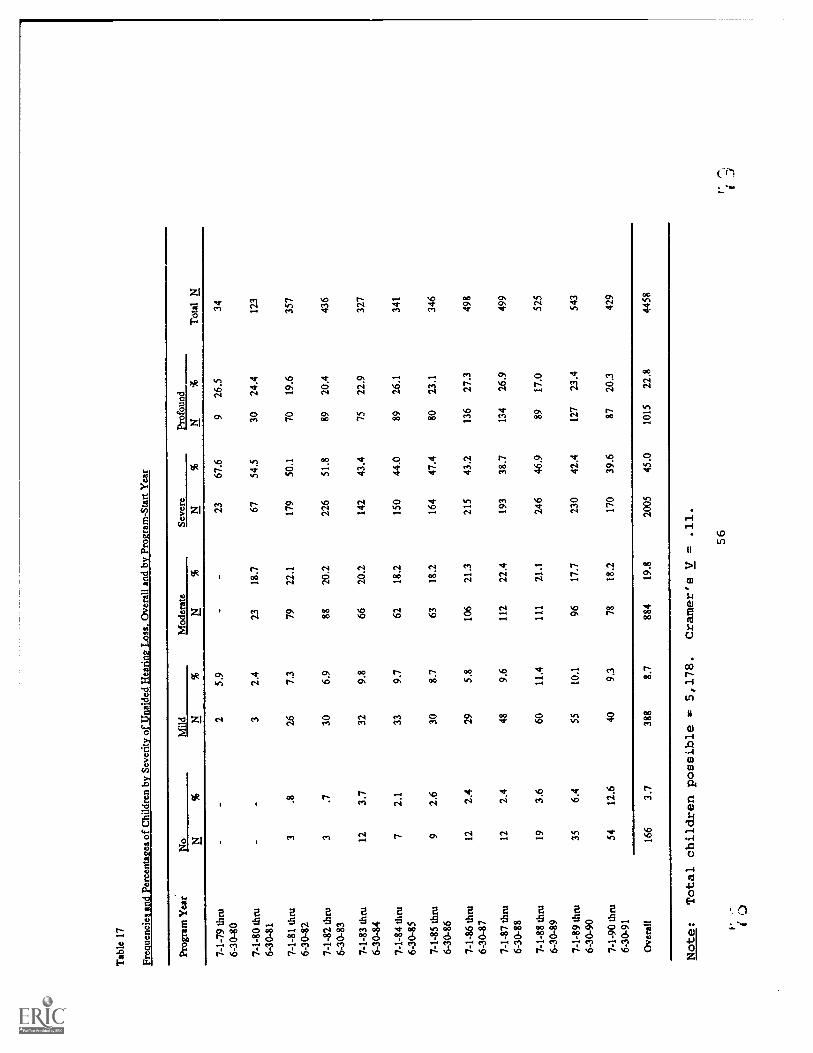
Tab
le 1
7
Fre
quen
cies
and
Per
cent
ages
of C
hild
ren
by S
ever
ity o
f Una
ided
Hea
ring
Loss
,Ove
rall
and
by P
rogr
am-S
tart
Yea
r
Pro
gram
Yea
rN
oM
ildM
oder
ate
Sev
ere
Pro
foun
dT
otal
N
7-1-
79 th
ru2
5.9
2367
.69
26.5
34
6-30
-80
7-1-
80 th
ru3
2.4
2318
.767
54.5
3024
.412
3
6-30
-81
7-1-
81 th
ru3
.826
7.3
7922
.117
950
.170
19.6
357
6-30
-82
7-1-
82 th
ru3
.730
6.9
8820
.222
651
.889
20.4
436
6-30
-83
7-1-
83 th
ru12
3.7
329.
866
20.2
142
43.4
7522
.932
7
6-30
-84
7-1-
84 th
ru7
2.1
339.
762
18.2
150
44.0
8926
.134
1
6-30
-85
7-1-
85 th
ru9
2.6
308.
763
18.2
164
47.4
8023
.134
6
6-30
-86
7-1-
86 th
ru12
2.4
295.
810
621
.321
543
.213
627
.349
8
6-30
-87
7-1-
87 th
ru12
2.4
489.
611
222
.419
338
.713
426
.949
9
6-30
-88
7-1-
88 th
ru19
3.6
6011
.411
121
.124
646
.989
17.0
525
6-30
-89
7- 1
- 89
thru
356.
455
10.1
9617
.723
042
.412
723
.454
3
6-30
-90
7-1-
90 th
ru54
12.6
409.
378
18.2
170
39.6
8720
.342
9
6-30
-91
Ove
rall
166
3.7
388
8.7
884
19.8
2005
45.0
1015
22.8
4458
Note:
Total children possible = 5,178.
Cramer's V = .11.
56
I C.)
t

The relationship between severity of hearing loss and gender was
practically nil (Cramer's V =.05), as was the relationship between severity of
hearing loss and race (Cramer's V = .06), indicating that the proportions
within the cells were similar to expected proportions based on the marginal
totals (Tables 18 and 19).
Table 18
Frequencies and Percentages of Male and Female Children by Severity of Unaided
Hearinq Loss, 1979-1991
Category Male Female Overall
No 104 2.4 60 1.4 164 3.7
Mild 226 5.2 154 3.5 380 8.7
Moderate 480 11.0 392 9.0 872 19.9
Severe 1063 24.3 902 20.6 1965 44.9
Profound 531 12.1 467 10.7 998 22.8
Overall 2404 54.9 1975 45.1 4379 100.0
Note: Cramer's V = .05. Total children possible = 5,178.
A low Cramer's V (.11) was obtained for the relationship between
severity of hearing loss and presence of additional handicapping conditions
(Table 20). A slightly smaller percentage of children with other handicapping
conditions was obtained for the profound-hearing-loss category than would be
expected based on the marginal pro,ortions.
Finally, a small to moderate Cramer's V (.38) was obtained for the
relationship between severity of hearing loss and type of hearing loss (Table
21). That value reflects primarily greater frequencies of children with
conductive hearing loss that were greater than expected based on the marginal
totals for the No Loss and Mild severity levels and fewer children with
conductive hearing loss than expected for the Severe and Profound levels based
on the marginal totals. The finding was anticipated.
57

Table 19
Frequencies and Percentages of Children by Ethnicity and Severity of Unaided
Hearing Loss, 1979-1991
Seve
rity
Cau
casi
anA
fric
an A
mer
ican
Asi
an A
mer
ican
Span
ish
Am
eric
anN
ativ
e A
mer
ican
Oth
erT
otal
N%
N%
N%
No
124
2.8
12.3
2.0
17.4
7.2
2.0
164
3.7
Mild
313
7.1
37.8
0.0
27.6
6.1
2.0
385
8.8
Mod
erat
e66
315
.110
72.
48
.269
1.6
15.3
8.2
870
19.8
Seve
re13
9531
.829
26.
720
.520
24.
636
.822
.519
6744
.9
Prof
ound
666
15.2
174
4.0
10.2
119
2.7
14.3
14.3
997
22.7
Ove
rall
3161
72.1
622
14.2
40.9
434
9.9
781.
848
1.1
4383
100.
0
Note:
Cramer's V = .06.
Total children possible =
5,178.
Ff,
58

Table 20
Frequencies and Percentages of Children with the Presence of Another Handicap
by Severity of Unaided Hearing Loss, 1979-1991
Category Other Handicap No Other Handicap Overall
No SO 1.2 115 2.6 165 3.8
Mild 134 3.1 245 5.6 379 8.7
Moderate 223 5.1 631 14.5 854 19.7
Severe 439 10.1 1514 34.8 1953 44.9
Profound 188 4.3 807 18.6 995 22.9
Overall 1034 23.8 3312 76.2 4346 100.0
Note: Cramer's V = .11. Total children possible = 5,178.
Table 21
Frequencies and Percentages of Children by Type of Hearing Loss and Severity
of Hearing Loss, 1979-1991
Severity Conductive Sensorineural Mixed TotalN % N % N % N %
No 97 2.3 41 1.0 17 .4 155 3.7
Mild 75 1.8 222 5.3 63 1.5 360 8.5
Moderate 60 1.4 673 15.9 103 2.4 836 193
Severe 32 .8 1746 41.3 133 3.1 1911 45.2
Profound 6 .1 928 22.0 31 .7 965 22.8
Overall 270 6.4 3610 85.4 347 8.2 4227 100.0
Note: Cramer's V = .38. Total children possible = 5,178.
59

Cause of Hearing Loss
For 46.9% (N = 2431) of the children, the cause of hearing loss was
reported as unknown, and for an additional 2.8% (N = 144) of the children, the
cause of loss was not reported at all (Table 22). The combined percentage
(49.7%) is consistent with the value reported by Gallaudet for unknown and not
reported causes of hearing loss (51.8%, see Table 1).
Of the known causes of hearing loss, meningitis was reported most
frequently (12.2%), with heredity accounting for 10% of the hearing losses.
For the total population of children (including the children whose cause of
loss was reported as unknown or was not reported at all), approximately 20% of
the hearing losses occurred after birth from such causes as meningitis,
middle-ear problems, fever or infection in the child, drugs administered to
the child, or other causes such as accidents. Comparison data from Gallaudet
are provided in Table 1. However, comparisons should be made with caution,
given that Gallaudet's report includes data for children and youth beginning
at birth through 18 years of age.
A low Cramer's V (.10) reflects consistency in the relative proportions
for each cause of hearing loss across the program years based on the marginal
totals (Table 23). A few exceptions should be noted: (a) For the 1980-81
and 1981-82 program years, the frequency of children with hearing loss due to
rubella or cytomegalovirus was more than twice the expectation based on the
marginal totals; (b) for 1983-84 program year, the frequency of children with
hearing loss due to fever or infection was nearly triple the expectation; (c)
for the 1981-82 program year, the frequency of children with hearing loss due
to drugs during pregnancy was nearly four times the expectation; (d) for the
1990-91 program year, the frequency of children with hearing loss due to
middle-ear problems was two to three times the expectation; and (e) for the
1981-82 program year, the frequency of children with hearing loss due to birth
trauma was twice the expectation.
60

Table 22
Frequencies and Percentages of Children by Cause of Hearing Loss, 1979-1991
Cause
Unknown 2431 46.9
Meningitis 631 12.2
Heredity 516 10.0
Middle-Ear Problems 251 4.8
Defects at Birth 234 4.5
Rubella/CMV 164 3.2
Conditions During Pregnancy 149 2.9
Birth Trauma 138 2.7
Child Syndrome 138 2.7
Fever or Infection in Child 130 2.5
Drugs Given to Child 44 .8
RH Incompatibility or Kernicterus 32 .6
Drugs During Pregnancy 26 .5
Other 150 2.9
Not Reported 144 2.8
Total 5178 100.0
Note: Total children possible = 5,178.
61

Tab
le 2
3Fr
eque
ncie
s an
d Pe
rcen
tage
s of
Chi
ldre
n by
Cau
se o
f H
eari
ng L
oss,
Ove
rall
and
by P
rogr
am-S
tart
Yea
r
Prog
ram
Yea
r
Feve
r or
Rub
ella
Def
ects
Infe
ctio
nsU
nkno
wn
Her
edity
CM
VM
enin
gitis
at B
irth
in C
hild
RH
Inco
mpa
tibili
tyor
Kem
icte
rus
Dru
gsD
urin
gPr
eena
ncy
Prem
atur
eM
iddl
eE
ar
Dru
gsG
iven
toC
hild
Bir
thT
raum
aC
hild
Synd
rom
eO
ther
Tot
al N
N%
N%
N%
N%
N%
N%
N%
N%
N%
N%
N%
N%
N%
N%
7-1-
79th
ru17
44.
76
15.8
2 5.
33
7.9
12.
61
2.6
25.
31
2.6
12.
64
10.5
38
6-30
-80
7-1-
80th
ru68
49.
611
8.0
10 7
.320
14.6
6 4.
43
2.2
1.7
1.7
64.
42
1.5
21.
57
5.1
137
6-30
-81
7-1-
81th
ru14
6 35
.546
11.
229
7.1
5713
.922
5.4
81.
94
1.0
81.
912
2.9
102.
43
.727
6.6
102.
429
7.1
411
6-30
-82
7-1-
82th
ru30
5 51
.157
9.4
16 2
.688
14.4
20 3
.314
2.3
3.5
3.5
172.
815
2.5
5.8
193.
111
1.8
365.
960
9
6-30
-83
7-1-
83th
ru23
3 52
.045
10.
04
.948
10.7
20 4
.531
7.1
2.4
112.
514
3.1
2.4
102.
29
2.0
184.
044
8
6-30
-84
7-1-
84th
ru20
7 48
.442
9.8
9 2.
157
13.3
33 7
.714
3.3
51.
21
.28
1.9
153.
52
.518
4.2
102.
37
1.6
428
6-30
-85
7-1-
85th
ru20
7 53
.929
7.6
13 3
.457
14.8
1S 3
.99
2.3
2.5
112.
911
2.9
1.3
61.
620
5.2
3.8
384
6-30
-86
7-1-
86th
ru27
9 51
.256
10.
322
4.0
6912
.720
3.7
183.
37
1.3
3.6
203.
717
3.1
2.4
91.
721
3.9
2.4
545
6-30
-87
7-1-
87th
ru26
3 48
.971
13.
211
2.0
7113
.222
4.1
132.
47
1.3
2.4
122.
223
4.3
5.9
173.
220
3.7
1.2
538
6-30
-88
7-1-
88th
ru30
3 54
.951
9.2
15 2
.764
11.6
27 4
.910
1.8
2.4
3.5
162.
933
6.0
81.
47
1.3
112.
02
.455
2
6-30
-89
7-1-
89th
ru29
4 50
.962
10.
718
3.1
5910
.230
5.2
3.5
3.5
3.5
172.
943
7.4
101.
713
2.2
203.
53
.557
8
6-30
-90
7-1-
90th
ru25
8 50
.641
8.0
17 3
.339
7.6
30 5
.98
1.6
-22
4.3
6813
.37
1,4
102.
09
1.8
1.2
.51
0
6-30
-91
Ove
rall
2580
49.
851
7 10
.016
6 3.
263
212
.224
6 4.
813
22.
535
.726
.515
22.
925
34.
945
.913
92.
714
22.
711
32.
251
78Note:
Total children possible =
5,178.
Cramer's V
=.10.

The relationship between cause of hearing loss and gender was extremely
small (Cramer's V = .07), as was the relationship between cause of hearing
loss and ethnicity (Cramer's V = .09). These small coefficients indicate that
the frequencies within the cells were similar to expected frequencies based on
the marginal totals (Tables 24 and 25).
A small Cramer's V (.34) was obtained for the relationship between cause
of hearing loss and presence of additional handicapping conditions (Table 26).
Inspection of the obtained cell values indicates that the frequencies of
children with an additional handicapping condition and a birth defect or a
child syndrome were larger than expected based on the marginal totals--a
finding that was not surprising. Also anticipated was the finding that the
obtained cell values for children with an additional handicapping condition
and heredity or meningitis were smaller than expected based on the marginal
totals.
The relatively large percentages of children whose hearing losses were
caused by middle-ear problems or by birth defects (e.g., atresia) and who had
conductive hearing losses contributed to the moderate Cramer's V (.45) that
was obtained for the relationship between cause of loss and type of loss
(Table 27). Similarly, the small Cramer's V (.23) obtained for the
relationship between cause of loss and severity of loss (Table 28) reflects
greater than expected frequencies of children whose hearing loss was caused by
middle-ear problems or by birth defects and who had no loss to mild loss.
63
Fstj

Table 24
Frequencies and Percentaqes of Children by Gender and Cause
of Hearing Loss, 1979-1991
Cause Male Female TotalN % N % N %
Unknown 1252 24.8 1106 21.9 2358 46.7
Heredity 272 5.4 228 4.5 500 9.9
Rubella, CMV 86 1.7 79 1.6 165 3.3
Meningitis 382 7.6 238 4.7 620 12.3
Birth Defects 126 2.5 118 2.3 244 4.8
Fever/Infections in 77 1.5 54 1.1 131 2.6Child
RH or Kernicterus 18 .4 17 .3 35 .7
Drugs During 17 .3 9 .2 26 .5Pregnancy
Other Conditions 89 1.8 62 1.2 151 3.0During Pregnancy
Middle-Ear 152 3.0 99 2.0 251 5.0Problems
Drugs Given to 25 .5 19 .4 44 .9Child
Birth Trauma 77 1.5 61 1.2 138 2.7
Syndrome 69 1.4 73 1.4 142 2.8
Other 65 1.3 48 1.0 113 2.2
Not Reported 65 1.3 65 1.3 130 2.6
Overall 2772 54.9 2276 45.1 5048 100.0
Note: Cramer's V = .07. Total children possible = 5,178.

Table 25
Frequencies and Percentages of Children by Ethnicity and Cause of Hearing Loss, 1979-1991
Cau
seC
auca
sian
Afr
ican
Am
eric
anA
sian
Am
eric
anSp
anis
h A
mer
ican
Nat
ive
Am
eric
anO
ther
Tot
al
N%
N%
N%
N%
N%
N%
N%
Unk
now
n16
8433
.534
76.
935
.722
64.
532
.631
.623
5546
.9
Her
edity
393
7.8
591.
20
.048
1.0
5.1
5.1
510
10.1
Rub
ella
, CM
V11
42.
328
.61
.013
.32
.05
.116
33.
2
Men
ingi
tis40
88.
113
32.
62
.051
1.0
18.4
7.1
619
12.3
Bir
th D
efec
ts18
13.
629
.62
.023
.56
.12
.024
34.
8
Feve
r/In
fect
ions
in99
2.0
13.3
1.0
11.2
3.1
3.1
130
2.6
Chi
ld
RH
or
Kem
icte
rus
26.5
5.1
0.0
4.1
0.0
0.0
35.7
Dru
gs D
urin
g12
.29
.20
.01
.02
.01
.025
.5
Preg
nanc
y
Oth
er C
ondi
tions
110
2.2
25.5
0.0
13.3
3.1
1.0
152
3.0
Dur
ing
Preg
nanc
y
Mid
dle-
Ear
174
3.5
14.3
3.1
37.7
20.4
1.0
249
5.0
Prob
lem
s
Dru
gs G
iven
to40
.84
.10
.01
.00
.00
.045
.9
Chi
ld
Bir
th T
raum
a11
12.
212
.20
.010
.22
.00
.013
52.
7
Chi
ld S
yndr
ome
104
2.1
14.3
2.0
14.3
4.1
2.0
140
2.8
Oth
er86
1.7
11.2
0.0
6.1
8.2
0.0
111
2.2
Not
Rep
orte
d74
1.5
23.5
0.0
12.2
4.1
0.0
113
2.2
Ove
rall
3616
72.0
726
14.4
46.9
470
9.4
109
2.2
581.
250
2510
0.0
Note:
Cramer's
V =
.09.
Total children possible =
5,178.
65

Table 26
Frequencies and Percentages of Children by Presence of Another
Handicap and Cause of Hearing Loss, 1979-1991
Cause Other Handicap No Other Handicap TotalN % N % N %
Unknown 430 8.6 1916 38.5 2346 47.2
Heredity 47 .9 458 9.2 505 10.2
Rubella, CMV 75 1.5 83 1.7 158 3.2
Meningitis 113 2.3 510 10.3 622 12.5
Birth Defects 142 2.9 98 2.0 240 4.8
Fever /Infections in 23 .5 105 2.1 128 2.6Child
RH or Kernicterus 10 .2 25 .5 35 .7
Drugs During 9 .2 12 .2 21 .4Pregnancy
Other Conditions 62 1.2 83 1.7 145 2.9During Pregnancy
Middle-Ear 80 1.6 167 3.4 247 5.0Problems
Drugs Given to 9 .2 36 .7 45 .9Child
Birth Trauma 46 .9 73 1.5 119 2.4
Child Syndrome 100 2.0 39 .8 139 2.8
Other 50 1.0 58 1.2 108 2.2
No* Reported 31 .6 84 1.7 115 2.3
Overall 1227 24.7 3747 75.3 4974 100.0
Note: Cramer's V = .34. Total children possible = 5,178.

Table 27
Frequencies and Percentages of Children by Tvve of Hearing Loss and Cause
of Child's Hearing Loss, 1979-1991
Cause Conductive Sensorineural Mixed TotalN % N %
Unknown/No Resp. 46 1.0 2037 42.4 161 3.3 2244 46.7
Heredity 1 .0 474 9.9 22 .5 497 10.3
Rubella, CMV 3 .1 147 3.1 8 .2 158 3.3
Meningitis 1 .0 574 11.9 30 .6 605 12.6
Birth Defects 47 1.0 145 3.0 42 .9 234 4.9
Fever/Infections in 27 .6 81 1.7 12 .2 120 2.5Child
RH or Kernicterus 0 .0 29 .6 5 .1 34 .7
Drugs During 2 .0 20 .4 2 .0 24 .5Pregnancy
Other Conditions 2 .0 134 2.8 8 .2 144 3.0During Pregnancy
Middle-Ear 166 3.5 36 .7 44 .9 246 5.1Problems
Drugs Given to 0 .0 4'. .9 1 .0 43 .9Child
Birth Trauma 4 .1 119 2.5 10 .2 133 2.8
Child Syndrome 20 .4 84 1.7 32 .7 136 2.8
Other 9 .2 74 1.5 7 .1 90 1.9
Not Reported 5 .1 85 1.8 9 .2 99 2.1
Overall 333 6.9 4081 84.9 393 8.2 4807 100.0
Note: Cramer's V = .45. Total children possible = 5,178.
67

Table 28
Frequencies and Percentages of Children by Severity and Cause of Hearing Loss, 1979-1991
Cau
seNo
Mod
erat
eSe
vere
Profound
Tot
al
N%
N%
N%
14
%N
%N
%
Unk
now
n39
.914
03.
138
18.
510
2122
.952
411
.821
0547
.2
Her
edity
5.1
42.9
118
2.6
196
4.4
101
2.3
462
10.4
Rub
ella
, CM
V6
.19
.222
.573
1.6
36.8
146
3.3
Men
ingi
tis11
.225
.677
1.7
258
5.8
178
4.0
549
12.3
Bir
th D
efec
ts8
.235
.850
1.1
821.
830
.720
54.
6
Feve
r/In
fect
ions
in10
.216
.423
.544
1.0
20.4
113
2.5
Chi
ld
RH
or
Ker
nict
erus
1.0
1.0
7.2
16.4
8.2
33.7
Dru
gs D
urin
g0
.02
.07
.29
.25
.123
.5
Preg
nanc
y
Oth
er C
ondi
tions
2.0
14.3
34.8
651.
526
.614
13.
2
Dur
ing
Preg
nanc
y
Mid
dle-
Ear
761.
755
1235
.833
.75
.120
44.
6
Prob
lem
s
Dru
gs G
iven
to1
.04
.112
.318
.48
.243
1.0
Chi
ld
Bir
th T
raum
a1
.011
.233
.757
1.3
22.5
124
2.8
Chi
ld S
yndr
ome
1.0
14.3
36.8
591.
316
.412
62.
8
Oth
er0
.012
.324
.532
.713
.381
1.8
Not
Rep
orte
d5
.18
.225
.642
.923
.510
32.
3
Ove
rall
166
3.7
388
8.7
884
19.8
2005
45.0
1015
22.8
4458
100.
0
Note:
Cramer's V =
.23.
Total children possible =
5,178.
c;
68
111
111
MIM
E IM

Age at Onset of Hearing Loss
Table 29 illustrates the distribution of students according to age at
onset of hearing loss. Comparison data (provided here) were available from
Ries and Voneiff (1974). For the majority of the children (70.1%) for whom
this information was reported, the onset of hearing loss was at birth, with
age at onset for 96.2% of the children under two years of age. Elssmann et
al. (1987) reported a slightly higher percentage (79%) of children who had
been born with hearing loss as compared to the SKI*HI data (71.8).
Table 29
Ace at Onset of Hearing Loss, 1979-1991
SKI*HI Ries & Voneiff
Age at Onset
At Birth 1544 71.8 40,200 74.4
Under 1 Year 309 14.4 3,788 7.0
1 Year to 2 ears 214 10.0 3,781 7.0
2 Years to 3 years 63 2.9 2,377 4.4
3 Years and Over 19 .9 3,854 7.1
Total 2149 100.0 54,000 100.0
Note: Total possible children for SKI*HI = 5,178.
Age-at-onset information was not reported for 58% of the children.
However, as mentioned in the previous section of this report, for nearly 50%
of the children, the cause of hearing loss was unknown or not reported. As we
will report in the next chapter, 50% of the children were identified as
hearing impaired by 17 months of age, with approximately 75% of the children
identified by 24 months of age. Therefo-, it is a reasonable assumption that
for the majority of the 5,178 children, including the 50% for whom the cause
of loss was unknown, the age at onset was prior 24 months--a significant
finding for those responsible for language, communication, cognition, and
69

literacy programming. More importantly, however, this finding reinforces the
argument that children with hearing impairments must be identified at the
earliest possible age so that programming for language, communication,
cognition, and emergent literacy development can begin early. Identification
age and identification procedures will be the subject of the chapter that
follows.
Across the program-start years, only small changes in the relative
proportions were obtained (Table 30). The low Cramer's V (.07) reflects only
slight changes in the percentages of children across the program-start years.
A low Cramer's V (.09) was obtained for the relationship between age at
onset and severity of hearing loss (Table 31). A slightly greater percentage
of children with profound losses was obtained for age at onset between one to
two years than would be expected based on the marginal proportions.
Although tables are not provided here, additional two-way frequency
analyses were conducted for age at onset. Those findings are reported here.
The association between age at onset and gender was small (Cramer's V = .06).
The association between age at onset and ethnicity was also small (Cramer's V
= .08). Tae association between age at onset and presence of additional
handicaps was low (Cramer's V = .18); slightly greater percentages of children
without additional handicaps were obtained for age at onset after two years of
age than would be expected based on the marginal totals. The association
between age at onset and type of hearing loss was small (Cramer's V = .05).
The association between age at onset and cause of hearing loss was
moderate (Cramer's V = .46). For age at onset at birth, smaller percentages
of children whose cause of hearing loss was meningitis were obtained than
would be expected based on the marginal totals. For age at onset after birth,
smaller percentages of children whose cause of hearing loss was heredity,
rubella or other congenital infections, defects at birth, Rh incompatibility,
drugs during pregnancy, conditions during pregnancy, or a syndrome were
obtained than would be expected based on the marginal totals. Neither of
these findings were surprising.
70

Tab
le 3
0
Freq
uenc
ies
and
Perc
enta
ges
of C
hild
ren
by A
ge s
t Ons
et o
f H
eari
ng L
oss,
Ove
rall
and
by P
rogr
am-S
tart
Yea
r
Scho
ol Y
ear
At B
irth
Bir
th to
1 Y
ear
1 to
2 Y
ears
7 to
3 Y
ears
3 Y
ears
& O
lder
Tot
al N
%N
%N
%N
%N
%N
%
7-1-
79 th
ru15
83.3
--
316
.7-
--
-18
.86-
30-8
0
7-1-
80 th
ru40
74.1
814
.85
9.3
11.
9-
-54
2.5
6-30
-81
7-1-
81 th
ru16
877
.429
13.4
146.
54
1.8
2.9
217
10.1
6-30
-82
7-1-
82 th
ru17
568
.435
13.7
3312
.910
3.9
31.
225
611
.96-
30-8
3
7-1-
83 th
ru12
067
.031
17.3
1910
.67
3.9
21.
117
98.
36-
30-8
4
7-1-
84 th
ru13
474
.419
10.6
2212
.23
1.7
21.
118
08.
46-
30-8
5
7-1-
85 th
ru98
67.1
2718
.517
11.6
42.
7-
-14
66.
86-
30-8
6
7-1-
86 th
ru16
069
.029
12.5
3113
.411
4.7
1.4
232
10.8
6-30
-87
7-1-
87 th
ru17
172
.238
16.0
187.
69
3.8
1.4
237
11.0
6-30
-88
7-1-
88 tb
ru13
969
.829
14.6
2110
.66
3.0
42.
019
99.
36-
30-8
9
7-1-
89 th
ru18
076
.333
14.0
177.
24
1.7
2.8
236
11.0
6-30
-90
7-1-
90 th
ru14
473
.831
15.9
147.
24
2.1
21.
019
59.
16-
30-9
1
Ove
rall
1544
71.8
309
14.4
214
10.0
632.
919
.921
4910
0.0
Not
e:C
ram
er's
V =
.07.
71

Table 31
Frequencies and Percentages of Children by Severityof Hearing Loss and Age at Onset of Hearing Loss,
1979 -199.1
Age
at O
nset
No
Mod
erat
eSe
vere
Prof
ound
Tot
al
E%
N%
N%
N%
N%
N%
At B
irth
261.
413
87.
332
417
.160
431
.926
614
.113
5871
.7
Bir
th to
1 Y
ear
15.8
15.8
452.
412
96.
873
3.9
277
14.6
1 to
2 Y
ears
1.1
10.5
271.
485
4.5
643.
418
79.
9
2 to
3 Y
ears
1.1
6.3
6.3
251.
315
.853
2.8
3 to
6 Y
ears
00
1.1
3.2
9.5
5.3
181.
0
Ove
rall
432.
317
09.
040
521
.485
245
.042
322
.318
9310
0.0
Note:
Cramer's
V =
.09.
1. L
' ..)
72
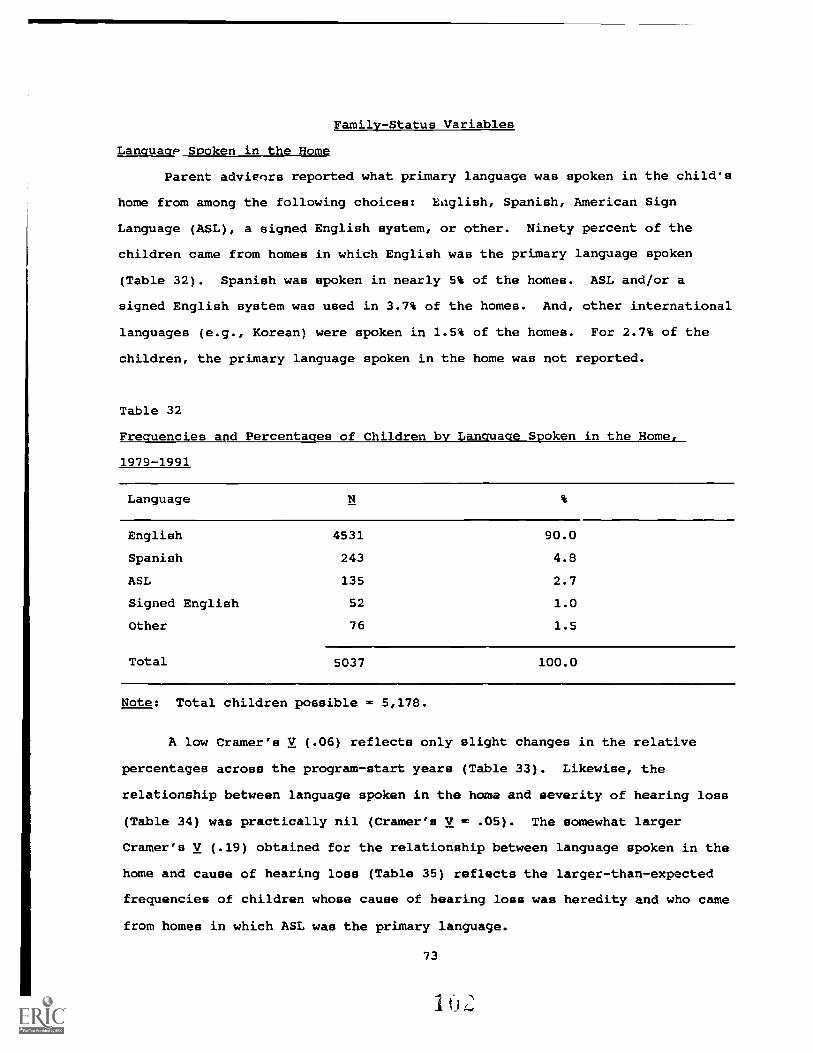
Family-Status Variables
LanguagP Spoken in the Home
Parent adyieors reported what primary language was spoken in the child's
home from among the following choices: kaglish, Spanish, American Sign
Language (ASL), a signed English system, or other. Ninety percent of the
children came from homes in which English was the primary language spoken
(Table 32). Spanish was spoken in nearly 5% of the homes. ASL and/or a
signed English system was used in 3.7% of the homes. And, other international
languages (e.g., Korean) were spoken in 1.5% of the homes. For 2.7% of the
children, the primary language spoken in the home was not reported.
Table 32
Frequencies and Percentages of Children by Language Spoken in the Home,
1979-1991
Language
English 4531 90.0
Spanish 243 4.8
ASL 135 2.7
Signed English 52 1.0
Other 76 1.5
Total 5037 100.0
Note: Total children possible = 5,178.
A low Cramer's V (.06) reflects only slight changes in the relative
percentages across the program-start years (Table 33). Likewise, the
relationship between language spoken in the home and severity of hearing loss
(Table 34) was practically nil (Cramer's V = .05). The somewhat larger
Cramer's V (.19) obtained for the relationship between language spoken in the
home and cause of hearing loss (Table 35) reflects the larger-than-expected
frequencies of children whose cause of hearing loss was heredity and who came
from homes in which ASL was the primary language.
73
I I) I:

Tab
le 3
3
Freq
uenc
iesan
d Pe
rcen
tage
sof C
hild
ren
by L
angu
ageSp
oken
in}'
IC H
ome.
Ove
rall
and
byPr
ogra
m-S
tart
Yea
r
Prog
ram
Yea
rE
nglis
h
Span
ish
ASL
Sign
ed E
ng.
Syst
emO
ther
Tot
al N
E%
E. %
N %
N%
N %
7-1-
79 th
ru32
91.
4
12.
92
5.7
35
6-30
-80
7-14
0 th
ru12
3 91
.16
4.4
32.
21
.72
1.5
135
6-30
-81
7-1-
81 th
ru36
3 90
.59
2.2
143.
57
1.7
8 2.
040
1
6-30
-82
7-1-
82 th
ru51
0 87
.236
6.2
264.
44
.79
1.5
585
6-30
-83
7-1-
83 th
ru38
7 91
.118
4.2
81.
96
1.4
61.
442
5
6-30
44
7-1-
84 th
ru37
4 88
.824
5.7
102.
47
1.7
61.
442
1
6-30
-85
7-14
5 th
ru32
.591
.319
5.3
82.
23
.81
.335
6
6-30
-86
7-1-
86 th
ru48
0 91
.121
4.0
122.
38
1.5
6 1.
152
7
6-30
-87
7-14
7 dm
484
91.8
22 4
.212
2.3
1.2
81.
552
7
6-30
-88
7-1-
88 d
m50
1 91
.830
5.5
5.9
1.2
91.
654
6
6-30
-89
7-1-
89 th
ru50
2 87
.239
6.8
193.
311
1.9
5.9
576
6-30
-90
7-1-
90 th
ru45
0 89
.519
3.8
173.
41
.216
3.2
503
6-30
-91
Ove
rall
4531
90.
024
3 4.
813
52.
752
1,0
76 1
.550
37
,leirenpossible
= 5,178.
I

Table 34.
Frequencies and Percentages
of Children by Language and
Severity of Unaided Hearing
Loss, 1979-1991
Seve
rity
gnas
hA
SLSp
anis
hSi
gned
Enz
lish
Oth
erT
otal
M%
N%
N%
N%
N%
N%
No
156
3.6
1.0
6.1
0.0
3.1
166
3.8
Mild
369
8.4
3.1
9.2
1.0
3.1
385
8.8
Mod
erat
e79
818
.320
.538
.95
.15
.186
619
.8
Seve
re17
5640
.250
1.1
992.
320
.533
.819
5844
.8
Prof
ound
860
19.7
431.
057
1.3
18.4
18.4
996
22.8
Ove
rall
3939
90.1
117
2.7
209
4.8
441.
062
1.4
4371
100.
0
Note:
Cramer's V = .05.
Total children possible =
5,178.
1(tr
J
75

Table 35
Frequencies and Percentages of Children by Home Language and Cause of Hearing Loss, 1979-1991
Cau
seEnglish
ASL
Spanish
Sign
ed E
nglis
hO
ther
Tot
al
N%
Ni
%N
%N
%N
%N
%
Unk
now
n2173
43.1
20
.4
114
2.3
20
.4
36.7
2363
46.9
Her
edity
361
7.2
102
2.0
23.5
15.3
7.1
508
10.1
Rub
ella
, CM
V15
43.
10
.05
.10
.03
.116
23.
2
,
Men
ingi
tis57
811
.50
.031
.64
.110
.262
312
.4
Bir
th D
efec
ts22
14.
41
.013
.31
.06
.124
24.
8
Feve
r/In
fect
ions
in11
92.
40
.09
.21
.02
.013
12.
6C
hild
RH
or
Kem
icte
rus
30.6
1.0
2.0
1.0
0.0
34.7
Drugs
Dur
ing
24.5
0.0
1.0
0.0
0.0
25.5
Preg
nanc
y
Oth
er C
ondi
tions
141
2.8
0.0
5.1
1.0
1.0
148
2.9
Dur
ing
Preg
nanc
y
Mid
dle-
ear
218
4.3
3.1
21.4
0.0
9.2
251
5.0
Prob
lem
s
Dru
gs G
iven
to43
.80
.01
.01
.00
.045
.9
Chi
ld
Bir
th T
raum
a13
12.
61
.03
.11
.00
.013
62.
7
Chi
ld S
yndr
ome
129
2.6
4.1
5.1
2.0
1.0
141
2.8
Oth
er10
22.
03
.15
.12
.00
.011
22.
2
Not
Rep
orte
d10
72.
10
.05
3.1
1.0
116
2.3
Ove
rall
4531
90.0
135
2.7
243
4.8
521.
076
1.5
5037
100.
0
Note:
Cramer's
V =
.19.
Total children possible =
5,178.
76

Although tables are not provided here, additional two-way frequency
analyses were conducted for language spoken in the home. Those findings are
reported here. The associations between language spoken in the home and
gender, and presence of other handicaps, and type of hearing loss, and age at
onset were all small (Cramer's V = .02, .06, .05, .09, respectively). The
association between language spoken in the home and ethnicity was low
(Cramer's V = .37), reflecting anticipated findings. That is, Spanish tended
to be the language spoken in the homes of children who were Spanish-American.
Hearing-Impaired Parent(s)
Nine percent of the children came from families in which one or both
parents were hearing impaired (Table 36). This value is consistent with that
mentioned previously (i.e., for 10% of the children, the known cause of
hearing loss had been identified as heredity). A small Cramer's V (.11)
reflects some changes in the relative percentages across the program-start
years (Table 37). Most noticeably, for the 1981-82 program year, nearly 16%
of the children came from families in which one or both parents had a hearing
loss. The presence/absence of parental hearing loss was not reported for 3.4%
of the children.
Table 36
Frequencies and Percentages of Children by Presence of Hearing-Impaired
Parent, 1979-1991
Type
One or More HI Parent 448 9.0
No HI Parent 4552 91.0
Total 5000 100.0
Note: Total children possible = 5,178.
Extremely small Cramer's Vs indicate little relationship between
parental hearing loss and gender (V = .01, Table 38), parental hearing loss
77

and ethnicity (V = .04, Table 39), parental hearing loss and presence of
another handicapping condition (V = .07, Table 40), parental hearing loss and
type of loss (V = .05, Table 41), and parental hearing loss and severity of
loss (V = .05, Table 42). That is, for all relationships, the obtained cell
values were proportional to what would be expected based on the marginal
values.
A moderate Cramer's V (.56) for parental hearing loss and cause of loss
reflects the larger-than-expected frequencies based on the marginal values, of
children with a hearing-impaired parent and for whom heredity was the cause of
loss (Table 43)--an anticipated finding. Similarly, the moderate Cramer's V
(.44) for parental hearing loss and language spoken in the home reflects the
larger-than-expected frequencies of children with a hearing-impaired parent
whose primary language spoken in the home was ASL (Table 44)--another
anticipated finding. It should be poir1t out, however, that although nearly
9% of the children had at least one hearing-impaired parent, for only 2.7% of
the children was ASL used in the home and for only 1% of the children was
signed English used. It can be concluded that for 5.2% of the children with a
hearing-impaired parent, the families do not use ASL or signed English as the
primary language of the home with their hearing-impaired child.
Although the table is not provided here, an additional two-way frequency
analysis was conducted for presence of parental hearing loss and age at onset.
A low Cramer's V (.24) reflected an anticipated outcome; a larger percentage
of children whose age at onset was at birth had a hearing-impaired parent than
would be expected based on the marginal totals.
78

Table 37
Frequencies and Percentages of Children with At Least One Hearing-Impaired
Parent, Overall and by Program - Start Year
Program Year
At Least OneParent HearingImpaired
Neither ParentHearing Impaired
Total N
7-1-79 thru 7 20.0 28 80.0 356-30-80
7-1-80 thru 14 10.6 118 89.4 1326-30-81
7-1-81 thru 62 15.9 329 84.1 3916-30-82
7-1-82 thru 64 11.1 515 88.9 5796-30-83
7-1-83 thru 55 12.3 358 86.7 4136-30-84
7-1-84 thru 36 8.7 380 91.3 4166-30-85
7-1-85 thru 22 6.0 342 94.0 3646-30-86
7-1-86 thru 36 6.8 493 93.2 5296-30-87
7-1-87 thru 33 6.3 494 93.7 5276-30-88
7-1-88 thru 33 6.1 511 93.9 5446-30-89
7-1-89 thru 45 7.9 528 92.1 5736-30-90
7-1-90 thru 41 8.2 456 91.8 4976-30-91
Overall 448 9.0 4552 91.0 5000
Note: Total children possible = 5,178. Cramer's V = .11.
79

Table 38
Frequencies and Percentages of Children with At Least One Hearing-Impaired
Parent by Child's Gender, 1979-1991
At Least OneParent Hearing Neither Parent
Gender Impaired Hearing Impaired Total
Male 247 s.r 2462 49.9 2709 54.9
Female 187 3.8 2036 41.3 2223 45.1
Total 434 8.8 4498 91.2 4932 100.0
Note: Cramer's V = .01. Total children possible = 5,178.
Table 39
Frequencies and Percentages of Children with At Least One Hearing-Impaired
Parent by Child's Ethnicity, 1979-1991
Ethnicity
At Least OneParent HearingImpaired
NeitherHearing
ParentImpaired Total
N % N % N %
Caucasian 333 6.8 3219 65.3 3552 72.1
African American 59 1.2 648 13.2 707 14.3
Spanish American 35 .7 427 8.7 462 9.4
Native American 4 .1 102 2.1 106 2.2
Asian American 1 < 1 42 .9 43 .9
Other 8 .2 49 1.0 57 1.2
Total 440 8.9 4487 91.1 4927 100.0
Note: Cramer's V = .04. Total children possible = 5,178.
80
I

Table 40
F e aen ies and Percenta es o Chi dren w t L
Parent by Presence of Other Handicaps, 1979-1991
a t One Hea
At Least OnePresence of Other Parent Hearing Neither ParentHandicaps Impaired Hearing Impaired Total
Other Handicap 61 1.3 1133 23.2 1194 24.5Present
Other Handicap 366 7.5 3315 68.0 3681 75.5Not Present
Total 427 8.8 4448 91.2 4875 100.0
Note: Cramer's V = .07. Total children possible = 5,178.
Table 41
Frequencies and Percentages of Children with At Least One Hearing-Impaired
Parent by Type of Hearing Loss, 1979-1991
Type of Loss
At Least OneParent Hearing Neither ParentImpaired Hearing Impaired Total
Conductive 13 .3 316 6.7 329 7.0
Sensorineural 373 7.9 3626 76.9 3999 84.9
Mixed 30 .6 355 7.5 385 8.2
Total 416 8.8 4297 91.2 4713 100.0
Note: Cramer's V = .05. Total children possible = 5,178.
81

Table 42
Frequencies and Percentages of Children with a HearingImpaired Parent by
Severit of Unaided Hearin Lose 1979-1991
Category HI Parent No HI Parent Overall
No 9 .2 157 3.6 166 3.8
Mild 41 .9 341 7.8 382 8.8
Moderate 92 2.1 773 17.7 8o5 19.8
Severe 158 3.6 1797 41.2 1955 44.8
Profound 76 1.7 916 21.0 992 22.8
Overall 376 8.6 3984 91.4 4360 100.0
Note: Cramer's V = .05. Total children possible = 5,178.
82

Table 43
Frequencies and Percentages of Children With at Least One
Hearing-Impaired Parent by Cause of Hearing Loss, 1979-1991
Cause One or More HI Parents No HI Parents TotalN % N %
Unknown 84 1.7 2237 44.7 2321 46.4
Heredity 288 5.8 225 4.5 513 10.3
Rubella, CMV 3 .1 160 3.2 163 3.3
Meningitis 14 .3 608 12.2 622 12.4
Birth Defects 5 .1 237 4.7 242 4.8
Fever/Infections in 3 .1 129 2.6 132 2.6Child
RH or 1Cemicterus 0 .0 34 .7 34 .7
Drugs During 0 .0 26 .5 26 .5
Pregnancy
Other Conditions 7 .1 143 2.9 150 3.0During Pregnancy
Middle-ear 10 .2 239 4.8 249 5.0Problems
Drugs Given to 0 .0 45 .9 45 .9
Child
Birth Trauma 3 .1 134 2.7 137 2.7
Child Syndrome 11 .2 128 2.6 139 2.8
Other 9 .2 104 2.1 113 2.3
Not Reported 11 .2 103 2.1 114 2.3
Overall 448 9.0 4552 91.0 5000 100.0
Note: Cramer's V = .56. Total children possible = 5,178.

Table 44
Frequencies and Percentages of Children with At Least One Hearing-Impaired
Parent by Language Spoken in the Home
Language
At Least OneParent HearingImpaired
Neither ParentHearing Impaired Total
English 285 5.8 4155 84.2 4440 90
Spanish 20 .4 218 4.4 238 4.8
ASL 108 2.2 24 .5 132 2.7
Signed English 17 .3 33 .7 50 1
Other 7 .1 66 1.3 73 1.5
Total 437 8.9 4496 91.1 4933 100
Note: Cramer's V = .44. Total children possible = 5,178,
Relationship Between Demographic Variables and Pretest
Receptive and Expressive Language Quotients
In addition to describing the demographic characteristics of the
children, one objective was to determine the relationship between each of the
demographic variables and pretest expressive and receptive language quotients.
The pretest quotients were calculated by dividing the child's pretest score
(in months) on the Language Development Scale (LDS) by the child's pretest age
(in months) and multiplying by 100. A quotient of 100 indicates that the
child's language age and the child's chronological age are equal. On the
other hand, a quotient of 50 indicates that the child's language age was half
that of his/her chronological age. Overall, the mean pretest expressive
language quotient was 56; the mean pretest receptive language quotient was 60.
One-way analyses of variance were conducted. In each analysis, the
demographic variable was the independent variable and the quotient was the
dependent variable. Additionally, for those analyses that resulted in a
statistically significant E value, the Tukey multiple-comparison technique was
84

used tc determine which differences between pairs of means were statistically
significant.
Given the large sample size for this study, it was anticipated that
nearly all statistical analyses would result in statistically significant
differences among or between means. For differences determined to be
statistically significant, it was important to determine the magnitude of
those differences, for with large samples, even small and unimportant
differences between means may be statistically significant (Shaver, 1985a,
1985b, 1992). Therefore, correlation ratios (Eta2) were calculated (the
between-groups sums of squares was divided by the total sums of squares from
the analyses of variance) as an estimate of effect size (the proportion of
variability in the quotients that was associated with group membership for
each demographic variable). Additionally, standardized mean differences
(SMDs) were calculated to estimate the practical significance of the
difference between the means, using Cohen's (1988) standards, provided in
Chapter 4. In every instance, the smallest mean was subtracted from the
largest mean and divided by the overall standard deviation for the expressive
or receptive quotients (sds = 29.1 and 30.5, respectively). The findings from
these analyses are summarized below and in Table 45.
85

Table 45
Relationship Between. Jemographic Variables and Pretest Receptive and Expressive Language Quotients
Variable
Expressive Quotient Receptive Quotient
2EtaM (sd) n F Eta2 m (sd) n F
Gender
Male 54.8 (28.8) 1745 2.2 <.01 59.5 (31.0) 1747 .8 <.01
Female 56.4 (29.3) 1460 60.5 (30.0) 1463
Ethnicity
Caucasian 58.9 (29.4) 2360 24.2* .04 63.2 (30.9) 2364 20.6* .03
African American 44.9 (26.1) 463 49.5 (28.7) 464
Spanish American 48.1 (25.8) 285 53.6 (26.5) 286
Native American 53.2 (26.0) 46 57.9 (26.8) 45
Asian American 46.6 (34.6) 30 47.2 (29.3) 30
Other 49.1 (26.9) 35 55.0 (28.2) 35
Other Handicap
Yes 48.8 (30.0) 736 53.2* .02 53.5 (31.2) 741 45.2* .01
No 57.7 (28.5) 2443 62.1 (30.1) 2443
Type of Hearing Loss
Conductive 65.0 (29.3) 188 10.1* .01 75.5 (28.6) 188 26.7* .02
Sensorineural 55.1 (28.6) 2664 59.0 (30.1) 2666
Mixed 56.4 (32.7) 244 62.8 (33.5) 245
Severity of Hearing_ Loss
No Loss 62.4 (25.9) 101 24.2* .03 73.1 (25.3) 101 30.2* .04
Mild 66.6 (31.6) 245 72.9 (31.3) 246
Moderate 61.1 (29.9) 599 64.7 (30.6) 601
Severe 53.0 (27.9) 1351 56.9 (28.6) 1352
Profound 50.6 (27.4) 681 54.9 (28.7) 682
Cause of Hearing Loss
Unknown/NR 52.7 (26.4) 1593 10.3* .04 57.1 (28.1) 1593 10.9* .04
Heredity 69.4 (34.8) 342 74.3 (38.8) 342
Rubella/CMV 51.9 (27.0) 108 54.6 (27.7) 109
Meningitis 56.1 (28.8) 402 59.8 (29.6) 403
Defects 2 Birth 56.4 (35.8) 154 62.9 (35.5) 154
Fever or Infections 47.5 (25.5) 82 51.9 (28.8) 82
RH Incompatibility 55.2 (20.0) 20 54.6 (19.1) 20
Drugs During Pregnancy 54.7 (34.7) 19 60.2 (35.3) 19
Conditions During Pregnancy 49.4 (24.1) 110 52.7 (23.7) 110
Middle Ear 60.3 (27.0) 136 69.2 (26.6) 136
Drugs Given to Child 61.5 (34.0) 31 59.3 (25.7) 31
Birth Trauma 55.5 (29.5) 87 56.8 (30.2) 87
Child Syndrome 63.9 (35.2) 91 68.0 (35.2) 94
86
1

Table 45 (Continued)
Variable
Expressive Quotient Receptive Quotient
Eta2
M (sJ) n F Eta2
M (sd) n F
Age at Onset
At Birth 60.2 (33.2) 1000 3.0* .01 64.5 (34.8) 1004 3.2* .01
Under 1 Year 52.7 (28.7) 210 56.4 (27.8) 211
1 Year to 2 Years 55.1 (27.5) 144 58.4 (29.2) 144
2 Years to 3 Years 63.2 (31.9) 36 63.9 (33.9) 36
3 Years and Over 60.4 (43.3) 8 65.6 (29.0) 8
Language Spoken In the Home
English 55.8 (29.0) 2903 13.4* .02 60.0 (30.5) 2908 12.6* .02
Spanish 43.0 (23.0) 137 48.3 (23.5) 137
ASL 70.3 (33.6) 84 76.6 (34.3) 84
Signed English 56.9 (30.1) 41 65.5 (31.2) 41
Other 45.1 (29.1) 42 51.3 (30.0) 42
Presence of Hearing-Impaired Parent
Yes 67.1 (33.3) 274 48.3* .01 72.2 (33.4) 274 49.5* .02
No 54.4 (28.3) 2926 58.8 (30.0) 2931
Note: * = Statistically significant difference between/among the mean quotients.For SKI*HI overall, Expressive M = 55.5 (sd = 29.1, Mdn = 51.6); Receptive M = 59.9 (sd = 30.5, Mdn = 55.9).
Gender
No statistically significant differences were obtained between the mean
pretest expressive and receptive quotients for males and females, and the Eta2
values were practically nil (Table 45). The Stops were small as well (.05 and
.03, respectively).
Ethnicity
Statistically significant differences were obtained among the mean
pretest expressive and receptive quotients for the ethnic groups, E(5, 3213) =
24.2, p <.05 and E(5, 3218) = 20.6, p <.05; however, the Eta2 values were
extremely small (.04 and .03, respectively), indicating little relationship
between ethnicity and the magnitude of the expressive or receptive quotients.
The small Eta2 reflects in part the small numbers of Native-American children
87
(N = 46; 1%), Asian-American children (N = 30; 1%), and children of other
ethnic minorities (N = 35, 1%). With 73% of the quotients in the Caucasian.
category, there was little variability in quotients by ethnic type.
The findings from Tukey's multiple-comparison technique indicated that
for the expressive quotients, the differences between the mean for the
Caucasian children and those for the African-American and the Spanish-American
children were statistically significant. The SMDs for these pairs of means
were small (.48 and .37, respectively) by Cohen's (1988) standards. For the
receptive quotients, the differences between the mean for the Caucasian
children and those for the Asian-American, the African-American, and the
Spanish-American children were statistically significant, with moderate-to-
small SMDs (.53, .45, and .32, respectively).
Other Handicap
Statistically significant differences were obtained between the mean
pretest expressive and receptive quotients for children with an additional
handicapping condition and children without, favoring those children without,
F(1, 3177) = 53.2, 2 <.05 and E(1, 3182) = 45.2, p <.05. However, the Eta2
values were again practically nil (Table 45), indicating little relationship
between presence/absence of an additional handicapping condition and the
magnitude of the quotients. The SMDs were low as well (.31 and .28,
respectively).
Type of Hearing Loss
Statistically significant differences were obtained among the mean
pretest expressive and receptive quotients for type of hearing loss, E(2,
3093) = 10.1, 2 <.05 and F(2, 3096) = 26.7, 2 <.05; however, the Eta2 values
were again extremely small (.01 and .02, respectively), indicating little
relationship between type of hearing loss and the magnitude of the expressive
or receptive quotients. For both the expressive and receptive quotients,
children with conductive hearing losses obtained a statistically significantly
higher mean score than children with sensorineural or mixed losses. The =a
for the pairs cc means ranged from small (.34) to medium (.54).
88

Severity of Hearing Loss
Statistically significant differences were obtained among the mean
pretest expressive and receptive quotients for severity of hearing loss, F(4,
2972) = 24.2, p <.05 and F(4, 2977) = 30.2, p <.05; however, the Eta2 values
were again extremely small (.03 and .04, respectively), indicating little
relationship between severity of hearing loss and the magnitude of the
expressive or receptive quotients. For both the expressive and receptive
quotients, children with no loss, mild losses, and moderate losses obtained
statistically significantly higher mean pretest quotients than children with
severe or profound hearing losses. The SMDs for the pairs of means ranged
from small (.26) to medium (.60).
Cause of Hearing Loss
Statistically significant differences were obtained among the mean
pretest expressive and receptive quotients for cause of hearing loss, F(12,
3162) = 10.3, p <.05 and F(12, 3167) = 10.9, p <.05; however, the Eta2 values
were again extremely small (.04 and .04, respectively), indicating little
relationship between cause of hearing loss and the magnitude of the expressive
or receptive quotients. For the expressive quotients, children whose hearing
losses were caused by heredity or by a syndrome obtained the highest mean
quotients. For the receptive quotients, children whose hearing losses were
caused by heredity, middle-ear infections, or by a syndrome obtained the
highest mean quotients. All SMDs for statistically significant comparisons
were small to moderate (range = .36 to .76).
Age at Onset.of Hearing Loss
Statistically significant differences were obtained among the mean
pretest expressive and receptive quotients for age at onset of hearing loss,
F(4, 1393) = 3.0, p <.05 and E(4, 1398) = 3.2, p <.05; however, the Eta2
values were again practically nil (.01 and .01, respectively), indicating no
relationship between age at onset of hearing loss and the magnitude of the
expressive or receptive quotients. For the expressive and receptive
quotients, children whose onset was at birth obtained a statistically
89
121

significantly higher mean quotient than children whose onset was between birth
and one year of age. However, the SMDs were small (.26 and .27,
respectively).
Language Spoken in the Home
Statistically significant differences were obtained among the mean
pretest expressive and receptive quotients for language spoken in the home,
F(4, 3202) = 13.4, 2 <.05 and F(4, 3207) = 12.6, 2 <.05; however, the Eta2
values were again extremely small (.02 and .02, respectively), indicating
little relationship between language spoken in the home and the magnitude of
the expressive or receptive quotients. For both the expressive and receptive
quotients, children whose primary home language was ASL obtained a
statistically significantly higher mean score than children whose home
language was Spanish, English, or other. The SMDs for the pairs of means
ranged from small (.38) to large (.94), favoring children whose primary home
language was ASL.
Presence of Hearing-Impaired Parent
Statistically significant differences were obtained between the mean
pretest expressive and receptive quotients for children with a hearing-
impaired parent and children without, favoring those children with a hearing-
impaired parent, F(1, 3198) = 48.3, 2 <.05 and E(1, 3203) = 49.5, 2 <.05.
However, the Eta2 values were again practically nil (.01 and .02,
respectively), indicating little relationship between parental hearing loss
and the magnitude of the quotients. The SMDs were low (.44 and .44,
respectively) by Cohen's (1988) standards.
Summary of Relationships Between DemographicVariables and Language Quotients
In summary, the relationships between each of the demographic variables
and pretest expressive and receptive language quotients were studied to
determine the magnitude of the relationships. A summary of these findings
follows:
Statistically significant differences between or among the pretest
means were obtained for all demographic variables except gender.
90
124#

Given the large sample sizes, it was not surprising that the mean
differences were statistically significant.
2. Correlation ratios (Eta2) which indicate the proportion of
variability among the quotients that was associated with each of
the demographic variables were small, leading to the conclusion
that there was little relationship between pretest quotients and
the demographic variables.
3. Standardized mean differences (SMDs), which indicate the magnitude
of the differences between means and are independent of sample
size (unlike indices of statistical significance), were small to
medium for the most part. For example, the mean pretest quotients
of children without additional handicaps were approximately 1/3 of
standard deviation larger than the mean pretest quotients of
children with additional handicaps. Although this difference was
statistically significant, the difference between the means was
very small from an educational perspective.
4. The only large SMDs were obtained for children whose home language
was ASL as compared to children whose home language was Spanish,
English, or other. The largest SMD (.94) described the difference
between the mean pretest quotients of children whose home language
was ASL and children whose home language was Spanish--a difference
of nearly one full standard deviation. It should be noted that
the standard deviations were largest for children whose home
language was ASL, indicating greater variability among the pretest
quotients than for the children whose home language was Spanish.
Summary
Although this chapter contains discussions of some comparisons of the
SKI*HI data with Gallaudet University (1991) data, the primary purpose was to
sketch the demographic characteristics of the children and their families.
Data were provided for each demographic characteristic, overall and by
program-start year. In addition, two-way frequency tables were used to
91

illustrate potential relationships between variables. Finally, findinc3 were
presented describing the magnitude of the relationships between each
demographic variable and pretest expressive and receptive language quotients.
The intent was to set a context for the reporting of our analyses for the
identification-procedure and the program-effectiveness portions of this study.
Identification procedures are the subject of the next chapter.
92
1 1,

CHAPTER 6
IDENTIFICATION PROCEDURES: THE RESULTS
A second general purpose of the investigation was to study the
effectiveness of screening procedures (e.g., Crib-O-Gram, high-risk register,
behavioral testing) for identifying hearing loss in neonates, infants, and
young children. Effectiveness was defined as that procedure which results in
the earliest mean identification age, program-start age, and hearing-aid-fit
age, and the shortest time intervals between suspicion to identification,
identification to program start, and suspicion to program start. Because
identification-procedure information is not collected on the SKI*HI Data
Sheet, a questionnaire was developed (see Chapter 4 and Appendix E) and was
sent to site personnel who had agreed to participate in this additional data-
collection effort. Information related to identification procedure, parental
suspicion of hearing loss, and cause of suspicion was requested. Only
children for whom data were submitted for the 1986-1989 program years were
included in this portion of the study. Personnel from 65 sites (15 states)
agreed to participate. Identification-procedure data were submitted for 1,404
children (Table 46).
To set the context for comparing mean ages and time intervals for the
various identification procedures, we present first in this section the
descriptive statistics for each of the ages (identification age, program-
start age, and hearing-aid-fit age) and time-interval variables (interval
between suspicion and identification, identification and program start, and
suspicion and program start) for SKI*HI overall, both collectively and by
program-start year. Because early identification of hearing loss is a
decisive factor in children's language, communication, cognitive, social, and
emergent-literacy development, identification age is a critical variable.
Therefore, we also present data describing the relationship between each of
the demographic variables discussed in Chapter 5 and identif cation age.
Additionally, for analyses of demographic variables that resulted in
statistically or educationally significant findings among the identification
93

Table 46
Frequencies and Percentages of Children by State for Those Sites
Volunteering to Participate in Identification-Procedure Study,
1986-1989
State N of Sites N of Children
Arkansas 2 46 3.3
Florida 1 7 .5
Georgia 1 204 14.5
Indiana 1 26 1.9
Maine 1 3 .2
Michigan 9 22 1.6
Missouri 1 79 5.6
Mississippi 1 26 1.9
New Mexico 1 41 2.9
New York 1 15 1.1
Ohio 2 16 1.1
Oklahoma 2 129 9.2
Tennessee 2 205 14.6
Texas 39 374 26.7
Utah 1 211 15.0
Total 65 1404 100.0
ages, data will be presented describing the relationships between those
demographic variables and the remaining age and time-interval variables.
For all analyses of the relationships between age or time-interval
variables and demographic variables, statistical significance will be
reported. Additionally, however, the correlation ratio (Eta2) will be
reported as an estimate of the magnitude of the relationships (i.e.,
educational significance). Given the large sample sizes for this study, even
small and unimportant differences between or among means may be statistically
significant. Therefore, Eta2 values and standardized mean differences (,mss)
94
will be used to estimate the educational or practical significance of the
differences between/among mean ages and time intervals.
We follow the data for SKI*HI overall by information collected using the
identification-procedure questionnaire--specifically, who first suspected the
hearing loss and what caused the suspicion. Then we will present data
describing the identification procedures themselves, including data describing
the relationship between each pair of age and time-interval variables.
Finally, we will present the results of the multiple-regression analysis which
was conducted to determine the optimal linear relationship between the
identification variables and pretest receptive and expressive language
quotients. To assist the reader in following the organization of this
chapter, which includes an extensive number of tables, an outline of its
contents follows:
A. Age of Identification1. Overall and by Program-Start Year2. Relationships with Demographic Variables:
a. Genderb. Ethnicityc. Presence of Other Handicapsd. Type of Hearing Losse. Severity of Hearing Lossf. Cause of Hearing Lossg. Age at Onseth. Language Spoken in the Homei. Parental Hearing Loss
3. Identification-Age SummaryB. Age at Program Start
1. Overall and by Program-Start year2. Relationships with Demographic Variables (only those that were
statistically or educationally significant for Age ofIdentification):a. Presence of Other Handicapsb. Severity of Hearing Lossc. Cause of Hearing Lossd. Age at Onsete. Language Spoken in the Homef. Parental Hearing Loss
3. Program-Start-Age SummaryC. Age Hearing Aid Fit
1. Overall and by Program-Start year2. Relationships with Demographic Variables (only those that were
statistically or educationally significant for Age ofIdentification):a. Presence of Other Handicapsb. Severity of Hearing Lossc. Cause of Hearing Lossd. Age at Onsete. Language Spoken in the Homef. Parental Hearing Loss
95

3. Age-Hearing-Aid-Fit SummaryD. Suspicion-to-Identification
1. Overall and by Program-Start-Year Time Interval2. Relationships with Demographic Variables (only those that were
statistically or educationally significant for Age ofIdentification):a. Presence of Other Handicapsb. Severity of Hearing Lossc. Cause of Hearing Lossd. Age at Onsete. Language Spoken in the Homef. Parental Hearing Loss
3. Suspicion-to-ID-Time-Interval SummaryE. Identification-to-Program-Start Time Interval
1. Overall and by Program-Start year2. Relationships with Demographic Variables (only those that were
statistically or educationally significant for Age ofIdentification):a. Presence of Other Handicapsb. Severity of Hearing Lossc. Cause of Hearing Lossd. Age at Onsete. Language Spoken in the Homef. Parental Hearing Loss
3. ID-to-Program-Start-Time-Interval SummaryF. Suspicion-to-Program-Start Time Interval
1. Overall and by Program-Start year2. Relationships with Demographic Variables (only those that were
statistically or educationally significant for Age ofIdentification):a. Presence of Other Handicapsb. Severity of Hearing Lossc. Cause of Hearing Lossd. Age at Onsete. Language Spoken in the Homef. Parental Hearing Loss
3. Suspicion-to-Program-Start-Time-Interval SummaryC. Who Suspected the Hearing Loss and What Caused the Suspicion
1. Who Suspected the Hearing Lossa. Frequencies and Percentagesb. Relationships with Age and Time Intervals
1) Identification Age2) Program-Start Age3) Hearing-Aid-Fit Age4) Suspicion-to-Identification Time Interval5) Identification-to-Program-Start Time Interval6) Suspicion-to-Program-Start Time Interval
2. What Caused the SuspicionF. Identification Procedures
1. High-Risk Register2. NICU3. Frequencies
a. Children Referred by Screening Agencyb. Type of Referring Agency
4. Age and Time Intervalsa. Identification Ageb. Program-Start Agec. Hearing-Aid-Fit Aged. Suspicion-to-Identification Time Intervale. Identififmtion-to-Program-Start Time Intervalf. Suspiciun-to-Program-Start Time Interval
5. Correlation Coefficients Among Age and Time-Interval VariablesG. Multiple-Regression AnalysisH. Summary
96

Aqe and Time-Interval Variables--SKI*HI Overall
Ace of Identification
The identification date was provided by parent advisors on the SKI*HI
data sheet and was defined as the first report from an audiologist indicating
a hearing loss. The identification age was then calculated by subtracting the
child's birth date from the identification date and converting the difference
to months. As discussed in Chapter 2, the Joint Committee on Infant Hearing
(1982) recommended that the hearing-of any at-risk children should be screened
not later than six months of age. Data were presented that described a wide
range of mean identification ages that have been reported in recent
literature. A question of interest, then, was whether the identification age
for SKI*HI replication sites was equal to or better than that reported in the
literature. The mean, standard deviation, and median ages of identification
are provided for the children overall and for each program year in Table 47
and Figure 3. For 6% of the children (N = 330), age of identification was not
reported by site personnel.
When the distribution of ages is skewed, the median more validly reflects
average age of identification. Discounting the 1979-80 program year,
which was the first year for submitting data to the national data bank and for
which the sample size was exceptionally small, the medians ranged from 16
months to 19 months, with an overall median of 17 months. The means were
consistently larger than the medians, ranging from 17.2 months to 19.8 months,
with an overall mean of 18.9 months. The overall standard deviation of 13 was
used in the calculation of the 02s in this section.
The SKI*HI mean age of identification is excellent when compared with
that reported by the Commission on Education of the Deaf (1988)--that is, 30
months for profoundly deaf children. By contrast, the SKI*HI overall mean
identification age is consistent with that reported by Elssmann et al. (1987)
of approximately 19 months, for a questionnaire study conducted in Arizona.
Interestingly, Arizona adopted the SKI*HI model of home programming in 1978 on
a statewide basis. However, site personnel elected not to participate in the
97

Table 47
Mean, Standard Deviation, and Median Age (in Months) at Which the Children
Were Identified as Having a Hearing Loss, Overall and by Program-Start Year
Program Year M SD Mdn
7-1-79 thru 13.0 6.2 12 356-30-80
7-1-80 thru 17.2 10.0 16 1306-30-81
7-1-81 thru 19.0 12.9 17 3836-30-82
7-1-82 thru 19.1 13.3 17 5636-30-83
7-1-83 thru 18.6 11.6 18 3976-30-84
7-1-84 thru 19.3 12.5 18 3986-30-85
7-1-85 thru 17.2 11.9 16 3586-30-86
7-1-86 thru 18.8 12.6 17 4996-30-87
7-1-87 thru 19.2 13.6 17 5056-30-88
7-1-88 thru 19.3 13.1 18 5376-30-89
7-1-89 thru 19.8 13.5 19 5666-30-90
7-1-90 thru 19.1 14.5 16 4776-30-91
Overall 18.9 13.0 17 4848
Note: Total children possible = 5,178.
national data bank. Although the Elssmann et al. study was smaller in scope
and sample size, it is, in fact, an independent replication of the present
investigation, because the majority of the children included in their study
were served by a SKI*HI state-wide replication site.
98

co co
Ca .0 c 0 C :T.
C 8 C15
.5 -
'0ID15
-14
.5 -
0 014
-C
A <13
.5 -
13-
12.5
-
12 -
11.5
Age
of Id
entif
icat
ion
21 -
20.5
-
20 -
19.5
-
10 -
18.5
-
18 -
17.5
-
17 -
16.5 16
-/ //
// //
-\\ \ \ 1,
/\/
//
/ ///
/ /A
1 1 1 1 1 1 1
11
I
80;8
181
;82
183
84;8
5
Pro
gram
-Sta
rt Y
ear
87/8
888
;88
89;9
090
;91
Ove
rall
Mea
n118
.9
----
Med
ian
17
N48
48
Fig
ure
a. M
ean
and
Med
ian
ages
of i
dent
ifica
tion
by p
rogr
am-s
tart
yea
r fo
r S
KI1
-11
over
all.
n1

Identification age by gender. As Table 48 indicates, the median
identification ages for males and females were identical (17 months).
Furthermore, there was no statistically significant difference between the
mean ages of identification for males and females, with Eta2 essentially zero.
The SMD (.01) was practically nil.
Table 48
Mean, Standard Deviation, and Median'Ages of Identification by Sex, 1979-1991
Sex SD Mdn
Male
Female
19.0
18.9
12.9
13.0
17
17
2630
2154
Overall 18.9 13.0 17 4784
Note: Eta2 = <.01. No statistically significant difference between themeans, F(1,4782) = .04, g = .84.
Identification age by ethnicity. For ethnicity, the medians for the
ethnic groups were similar (Table 49), ranging from 16 months for Native
Americans to 19 months for African and Spanish Americans. There was no
statistically significant difference among the mean ages of identification,
with Eta2 again essentially zero. Again, the means are nearly identical,
ranging from 17.2 months for Asian Americans to 19.9 months for African
Americana. The SMDs were small, ranging from .02 to .21.
100
J

1
Table 49
Mean, Standard Deviation, and Median AQea of Identification by Ethnicity,
1979-1991
Ethnicity SD Mdn
Caucasian 18.7 13.1 17 3446
African American 19.9 12.6 19 685
Spanish American 19.3 13.0 19 456
Native American 17.5 12.1 16 99
Asian American 17.:. 11.8 17 43
Other 18.0 11.0 17 57
Overall 18.9 12.9 17 4786
Note: Eta2 = <.01. No statistically significant difference among the meanages, F(5,4780) = 1.53, P = .18.
Identification ace by presence of other handicaps. The median
identification ages for children with and without an additional handicapping
condition differed by 6 months (Table 50)--a large and important difference
when considered in the context of learning language and communication during
the early years of life. Children with an additional handicapping condition
had a median identification age of 12 months. The difference between the.
means was statistically significant; however, Eta2 was extremely small.
Although the SMD was small (.31, or less than 1/3 of a standard deviation) by
Cohen's (1988) standar's, the actual mean difference was four months--again, a
large difference for young children.
101

Table 50
Mean, Standard Deviation, and Median Acres of Identification by Pre.snce of
Other Handicaps, 1979-1991
SD Mdn
Other Handicap Present 15.8 12.9 12 1150
No Other Handicap Present 19.8 12.8 18 3589
Overall 18.9 12.9 17 4739
Note: Eta2 = .02. Statistically significant difference between themean ages, F(1,4737) = 86.7, p < .05.
Identification age by type of hearing loss. The medians for children
with different types of hearing loss were similar (Table 51), ranging from 15
months for children with mixed losses to 18 months for children with
sensorineural losses. No statistically significant difference among the mean
identification ages was obtained, with an Eta2 of essentially zero. Children
whose hearing loss was categorized as Not Yet Determined were not included in
the analysis. The means ranged from 17.6 for children with mixed losses to
19.1 for children with sensorineural losses, with small SMDe, ranging from .00
to .11. Surprisingly, children with conductive hearing losses had a lower
mean age of identification than children with sensorineural losses. Even
after removing from the analysis of conductive hearing losses those children
whose cause of hearing loss was atresia (a condition that is physically
identifiable at birth), the mean identification age was only slightly higher
(i.e., 20.1 months).
102
1)3

Table 51
Mean, Standard Deviation, and Median Ages of Identification by
Type of Hearing Loss, 1979-1991
Type of Loss M SD Mdn N
Sensorineural 19.1 12.7 18 3913
Mixed 17.6 14.0 15 367
Conductive 18.4 14.7 16 306
Not Determined '.8.4 12.8 16.5 150
overall 18.9 13.0 17 4784
Note: Eta2 = <.01. No statistically significaAi difference among the meanages, F(2,4583) = 2.4, 2 = .09.
Identification age by severity of hearing loss. The median differences
among the identification ages for the hearing-loss-severity levels were as
large as 8 months (Table 52)--important differences from an intervention
perspective. A statistically significant difference among the mean
identification ages was obtained, with profoundly impaired children identified
earlier than those with severe, moderate, mild, or no losses, and severely
impaired children identified earlier than those with moderate, mild, or no
losses. Although the Eta2 was small, the SMDs ranged from small to medium
(.18 to .49) by Cohen's (1988) standards. Actual mean differences were as
large as 6.4 months.
103

Table 52
Mean, Standard Deviation, and Median Ages of Identification by Severity of
Hearing Loss, 1979-1991
Severity SD Mdn
No Loss 22.5 13.9 23 156
Mild Loss 22.1 15.8 21 374
Moderate Loss 21.6 14.6 21 850
Severe Loss 18.4 12.2 17 1922
Profound Loss 16.1 10.1 15 974
Overall 19.0 12.9 17 4276
Note: Eta' = .03. Statistically significant difference among the meanages, F(4,4271) = 30.7, p < .05.
Identification age by cause of hearing loss. The causes of hearing loss
provided in Table 53 are arranged by medians from the youngest to the oldest
median identification age. The median identification ages ranged from 9
months, for children born with a syndrome, to 23 months, for children who had
experienced fever or infections--that is, a median difference of 14 months.
In addition, a statistically significant difference was obtained among
the mean identification ages, with a small Eta' of .06. Children were removed
from the analysis for whom the cause of loss was unknown, not reported, or
reported as "other." Findings from the Tukey multiple-comparison test
indicated that the mean identification ages for children whose cause of loss
was fever or infection, middle-ear problems, or meningitis were significantly
greater than the mean identification ages for children whose cause of loss was
a syndrome, rubella, defects at birth, conditions during pregnancy (e.g.,
prematurity), or heredity. These findings are not surprising given that these
latter causes are known high-risk indicators of hearing loss. If such risk
factors were present at birth, professionals would have been alerted to the
potential for hearing loss in the infant. The mean identification ages ranged
104
1 37
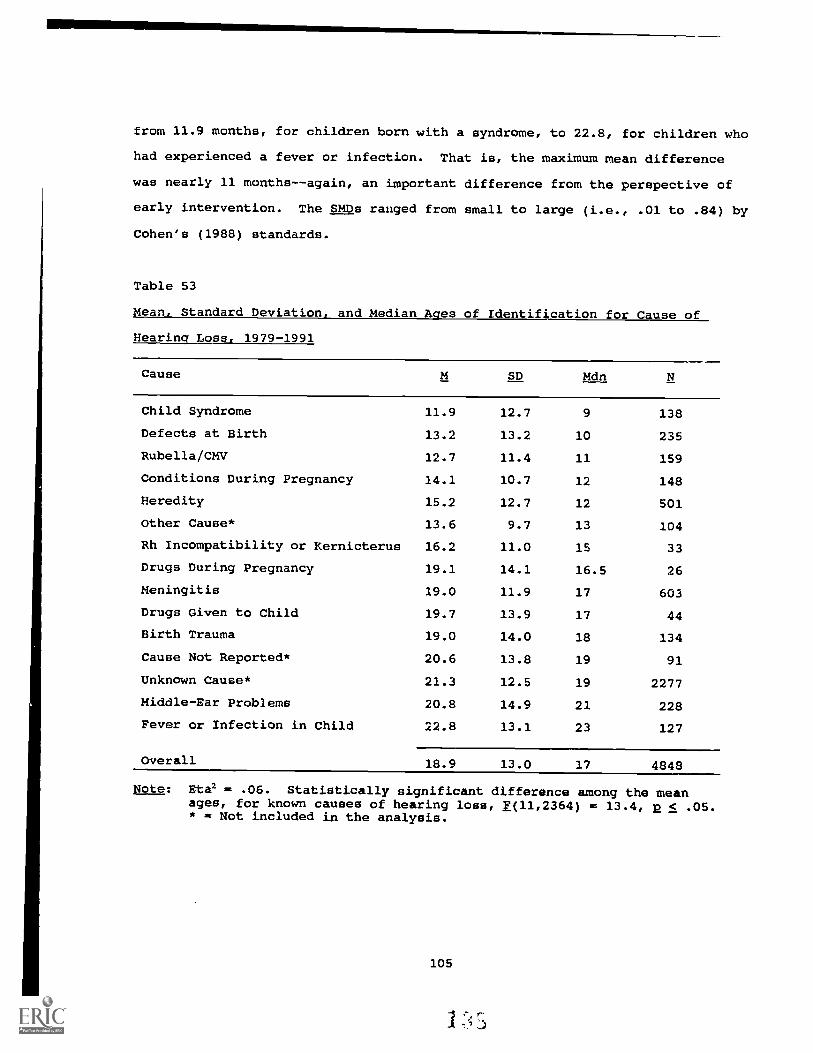
from 11.9 months, for children born with a syndrome, to 22.8, for children who
had experienced a fever or infection. That is, the maximum mean difference
was nearly 11 months--again, an important difference from the perspective of
early intervention. The SMDs ranged from small to large (i.e., .01 to .84) by
Cohen's (1988) standards.
Table 53
Mean, Standard Deviation, and Median Ages of Identification for Cause of
Hearing Loss, 1979-1991
Cause SD Mdn
Child Syndrome 11.9 12.7 9 138
Defects at Birth 13.2 13.2 10 235
Rubella/CMV 12.7 11.4 11 159
Conditions During Pregnancy 14.1 10.7 12 148
Heredity 15.2 12.7 12 501
Other Cause* 13.6 9.7 13 104
Rh Incompatibility or Kernicterus 16.2 11.0 15 33
Drugs During Pregnancy 19.1 14.1 16.5 26
Meningitis 19.0 11.9 17 603
Drugs Given to Child 19.7 13.9 17 44
Birth Trauma 19.0 14.0 18 134
Cause Not Reported* 20.6 13.8 19 91
Unknown Cause* 21.3 12.5 19 2277
Middle-Ear Problems 20.8 14.9 21 228
Fever or Infection in Child 22.8 13.1 23 127
Overall 18.9 13.0 17 4848
Note: Eta2 = .06. Statistically significant difference among the meanages, for known causes of hearing loss, f(11,2364) = 13.4, 2 < .05.* = Not included in the analysis.
105

Identification age by onset of hearing loss. For the five levels of age
at onset (Table 54), the median ages of identification ranged from 12 months,
for children with age at onset of at birth and birth to 1 year, to 47 months,
for children with age at onset of 3 years or older--an extremely large
difference. A statistically significant difference among the mean
identification ages for the age-at-onset levels was obtained, with an Eta2 of
.15. Not surprisingly, the findings from the Tukey multiple-comparison test
indicated that children whose age at onset was at birth or from birth to one
year were identified at a significantly earlier age than children whose age at
onset was one year or older. In fact, there were statistically significant
differences among all of the mean ages of identification except between those
for children whose onset was at birth and from birth to one year. The means
ranged from 14.5 months to 49.2 months--again, important differences. The
SMDs ranged from small to large (.12 to 2.67) by Cohen's (1988) standards.
Table 54
Mean, Standard Deviation, and Median Aces of Identification by
Age at Onset of Unaided Hearing Loss, 1979-1991
Age at Onset SD Mdn
At Birth 14.5 12.6 12 1489
Birth to 1 Year 16.1 12.3 12 299
1 to 2 Years 20.2 6.5 19 206
2 to 3 Years 31.9 5.4 32 58
3 Years or Older 49.2 10.6 47 19
Overall 1.1 12.7 14 2071
Note: Eta2 = .13. Statistically significant difference among the mean ages,F(4,2066) = 75.4, p < .05.
106

Identification age by language spoken in the home. The median
identification ages for the levels of language spoken in the home ranged from
8 months, for homes in which ASL was primarily used, to 19 months, for homes
in which Spanish was the primary language (Table 55). A statistically
significant difference was obtained among the mean identification ages;
however, Eta2 was practically zero. Children from homes in which ASL was used
obtained a significantly lower mean identification age (11 months) than
children from homes in which English or Spanish was spoken (19.2 and 19.5,
respectively). The SMDs ranged from small to medium (.34 to .65) by Cohen's
(1988) standards. These findings are consistent with the early identification
age reported previously for children whose cause of hearing loss was heredity.
Again, because heredity is a known risk factor, it is likely that hearing-
impaired parents using ASL anticipated the possibility of a hearing loss in
their children and had them tested during the first year of life.
Table 55
Mean, Standard Deviation, and Median Aces of Identification by
Language Spoken in the Home, 1979-1991
Language SD Mdn
English 19.2 13.0 18 4304
Spanish 19.5 12.5 19 234
ASL 11.0 10.8 8 128
Signed English 15.5 13.1 13 47
Other 15.4 11.1 16 71
Overall 18.9 13.0 17 4784
Note: Eta2 = .01. Statistically significant difference among the means,f(4,4779) = 15.0, p < .05.
107

Identification age by parental hearing loss. The difference between the
median identification ages for children with and without a parent with a
hearing loss was 4.4 months (Table 56), fw:oring children with a hearing-
impaired parent (SMD = .34). Furthermore, the difference between the mean
identification ages was statistically significant; however, the Eta2 was
extremely small. Again, this finding is not surprising in light of the
previously mentioned results related to early identification for children
whose hearing loss was due to heredity. On average, children with a hearing-
impaired parent were identified at approximately 15 months, compared to
approximately 19 months for children without a hearing-impaired parent.
Table 56
Mean, Standard Deviation, and Median Ages of Identification by One or More
Hearing Impaired Parent, 1979-1991
Parental Hearing Loss SD Mdn
One or More HI Parent 14.9 12.8 12 427
No HI Parent 19.3 12.9 18 4334
Overall 18.9 13.0 17 4761
Note: Eta2 = .01. Statistically significant difference between the means,F(1,4759) = 44.6, 2 < .05.
Identification-Age Summary:
1. Overall, the median identification age was 17 months.
2. For children with additional handicapping conditions, the median
identification age was 12 months.
3. For profoundly impaired children, the median identification age was
15 months.
4. For children whose cause of hearing loss was a known risk factor or
was visually apparent at birth, the median identification age ranged
108
14

from 9 to 16.5 months.
5. For children whose age at onset was at birth or from birth to one
year, the median identification age was 12 months.
6. For children from homes in which ASL and signed English were the
primary languages, the median identification ages were 8 and 13
months, respectively.
7. For children with a hearing-impaired parent, the median
identification age was 12 months.
Aqe at Program Start
The program-start date was routinely provided on the SKI *IiI data sheets
by the parent advisors and was defined as the date that anv parent/infant
program services were first given by personnel from the agency using the
SKI*HI program. First-time services might have included the fiat telephone
contact with the family by the assigned parent advisor, the first visit to the
home when background information was collected, or the first actual home
visit. The program-start age was then calculated by subtracting the birth
date from the program-start date. Because early identification of hearing
loss has little impact if intervention for language, communication, and
auditory development are delayed, program-start age was considered a critical
variable for these analyses.
The mean, standard deviation, and median program-start ages are provided
for the children overall and for each program year in Table 57. For 3% of the
children (N = 160), program-start age was either not reported or could not be
calculated due to missing birth dates. Again, discounting the 1979-80 program
years, for which the sample size was exceptionally small, the median program-
start ages ranged from 20 to 26 months, with an overall median of 25 months.
The means were consistently larger than the medians, ranging from 22.2 to 27.3
months, with an overall mean of 2S.4 months. The overall standard deviation
(14.1) was used in the calculation of SMDs in this section.
Elssmann et al. (1987) reported a mean age of intervention for the 125
children in their survey of approximately 25 months. However, these authors
109
1

defined intervention-start age differently from the definitions used here for
program-start age. Intervention-start age was defined as the age at which the
majority of the children had been fitted with their first hearing aid. As you
will see in the section of this chapter that follows, on average, hearing-aid-
fit age was earlier than program-start age for the children in the SKT*HI data
bank overall. Although the SKI*HI model includes a complete home hearing-aid
program, children were sometimes not referred to the SKI*HI program by an
audiologist until after the hearing aid had been fit, thereby losing critical
months during which language and communication, as well as auditory, services
could have been provided.
110
1q3
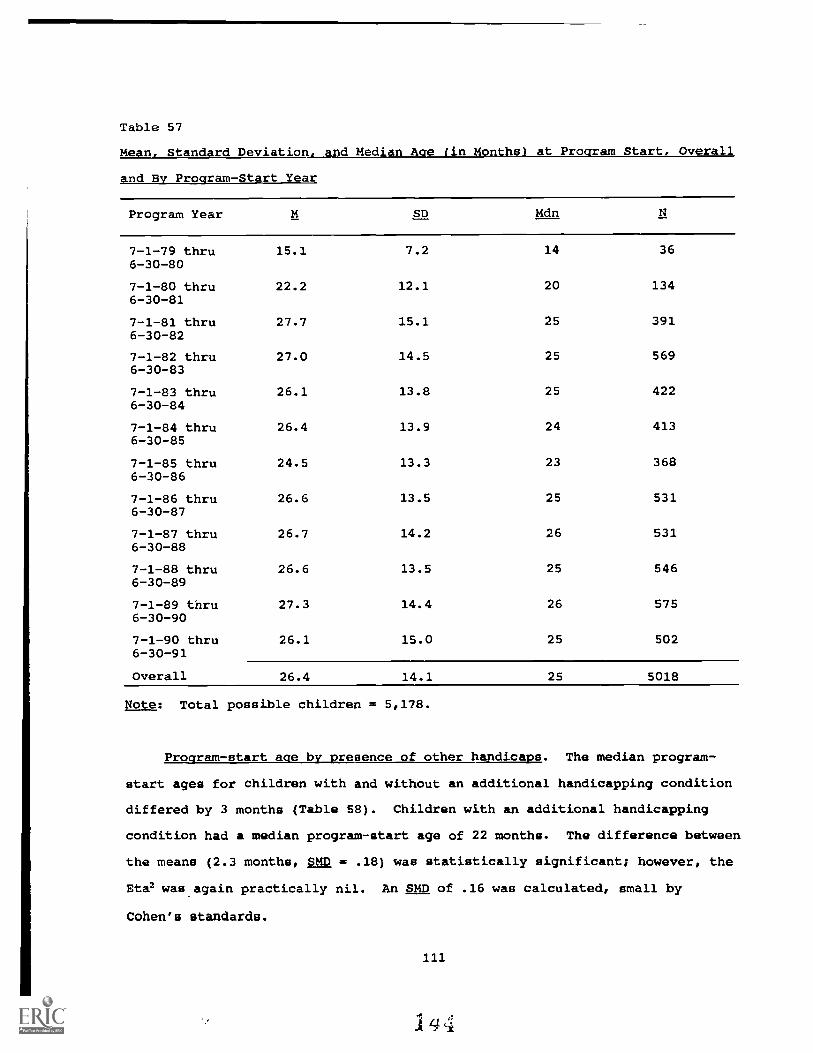
Table 57
Mean, Standard Deviation, and Median Ace (in Months) at Program Start, Overall
and By Program-Start Year
Program Year M SD Mdn
7-1-79 thru 15.1 7.2 14 366-30-80
7-1-80 thru 22.2 12.1 20 1346-30-81
7-1-81 thru 27.7 15.1 25 3916-30-82
7-1-82 thru 27.0 14.5 25 5696-30-83
7-1-83 thru 26.1 13.8 25 4226-30-84
7-1-84 thru 26.4 13.9 24 4136-30-85
7-1-85 thru 24.5 13.3 23 3686-30-86
7-1-86 thru 26.6 13.5 25 5316-30-87
7-1-87 thru 26.7 14.2 26 5316-30-88
7-1-88 thru 26.6 13.5 25 5466-30-89
7-1-89 thru 27.3 14.4 26 5756-30-90
7-1-90 thru 26.1 15.0 25 5026-30-91
Overall 26.4 14.1 25 5018
Note: Total possible children = 5,178.
Program-start ace by presence of other handicaps. The median program-
start ages for children with and without an additional handicapping condition
differed by 3 months (Table 58). Children with an additional handicapping
condition had a median program-start age of 22 months. The difference between
the means (2.3 months, SMD = .18) was statistically significant; however, the
Eta2 was again practically nil. An SMD of .16 was calculated, small by
Cohen's standards.
111
144

Table 58
Mean, Standard Deviation, and Median Program-Start Ages by Presence of
Other Handicaps, 1979-1991
SD Mdn
Other Handicap Present 24.5 14.6 22 1206
No Other Handicap Present 26.8 13.8 25 3689
Overall 26.2 14.0 25 4895
Note: Eta2 = .01. Statistically significant difference between themean ages, F(1,4893) = 25.5, 2 < .05.
Program-start ace by severity of hearing loss. The median differences
among the program-start ages for the severity levels were as large as eight
months (Table 59). Children with profound losses began the program at a
median age of 21 months, and children with moderate, mild, and no losses began
the program at median ages of 28 to 29 months. The differences among the
means was statistically significant, with profoundly and severely impaired
children beginning the program at significantly earlier ages than children
with moderate, mild, or no losses. Although Eta2 was small (.03), actual mean
differences between the program-start ages were as large as 6.4 months, with
small SMDs, ranging from .01 to .45.
112
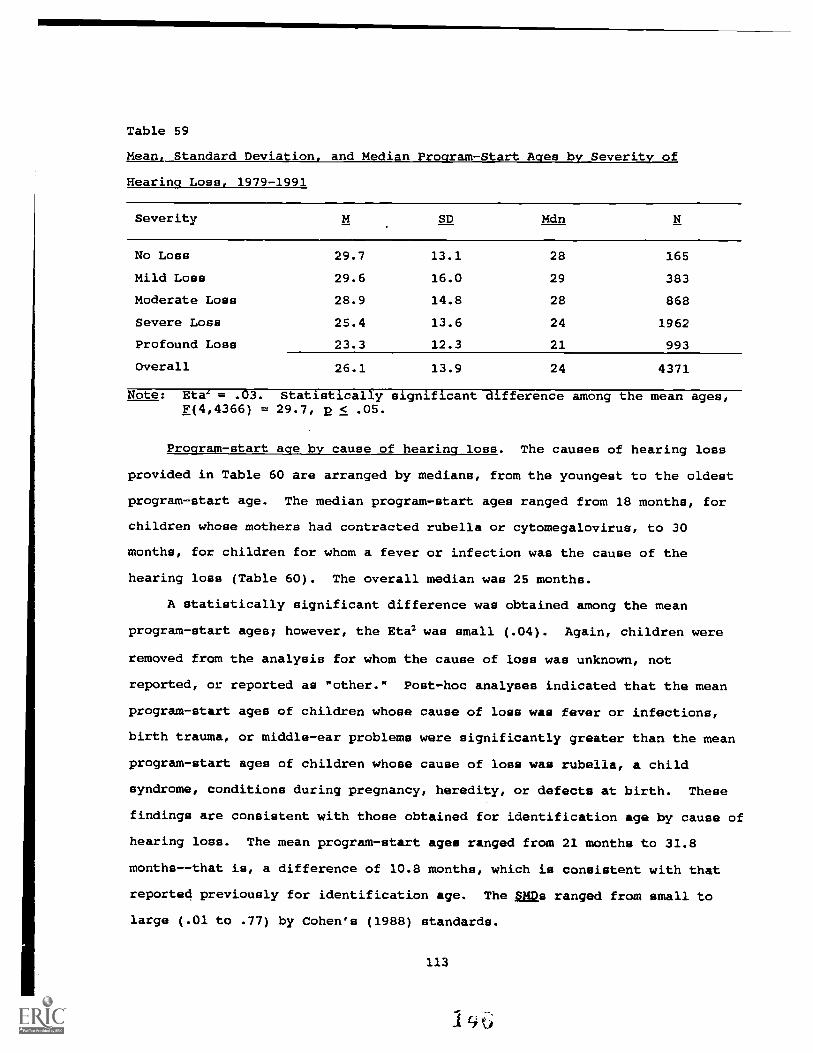
Table 59
Mean, Standard Deviation, and Median Program-start Ages by Severity of
Hearing Loss, 1979-1991
Severity SD Mdn
No Loss 29.7 13.1 28 165
Mild Loss 29.6 16.0 29 383
Moderate Loss 28.9 14.8 28 868
Severe Loss 25.4 13.6 24 1962
Profound Loss 23.3 12.3 21 993
Overall 26.1 13.9 24 4371
Note: Eta' = .03. Statistically significant difference among the mean ages,F(4,4366) = 29.7, 2 < .05.
Program-start age by cause of hearing loss. The causes of hearing loss
provided in Table 60 are arranged by medians, from the youngest to the oldest
program-start age. The median program-start ages ranged from 18 months, for
children whose mothers had contracted rubella or cytomegalovirus, to 30
months, for children for whom a fever or infection was the cause of the
hearing loss (Table 60). The overall median was 25 months.
A statistically significant difference was obtained among the mean
program-start ages; however, the Eta2 was small (.04). Again, children were
removed from the analysis for whom the cause of loss was unknown, not
reported, or reported as "other." Post-hoc analyses indicated that the mean
program-start ages of children whose cause of loss was fever or infections,
birth trauma, or middle-ear problems were significantly greater than the mean
program-start ages of children whose cause of loss was rubella, a child
syndrome, conditions during pregnancy, heredity, or defects at birth. These
findings are consistent with those obtained for identification age by cause of
hearing loss. The mean program-start ages ranged from 21 months to 31.8
months--that is, a difference of 10.8 months, which is consistent with that
reported previously for identification age. The ,mss ranged from small to
large (.01 to .77) by Cohen's (1988) standards.
113

Table 60
Mean, Standard Deviation, and Median Program-Start Ages for Cause of
Hearing Loss, 1979-1991
Cause SD Mdn
Rubella/CMV 21.0 14.0 18 164
Child Syndrome 22.1 14.9 19 141
Other Cause* 23.0 12.7 20.5 112
Conditions During Pregnancy 22.4 12.0 21 151
Defects at Birth 23.7 15.3 21 244
Drugs During Pregnancy 26.5 16.5 21.5 26
Heredity 22.9 14.3 22 507
RH Incompatibility or Kernicterus 25.5 13.0 24 35
Meningitis 26.0 13.2 24 616
Unknown Cause* 27.8 13.7 26 2349
Drugs Given to Child 26.6 16.0 27 45
Birth Trauma 28.8 16.1 27 138
Middle-Ear Problems 28.5 14.5 28 248
Cause Not Reported* 28.7 14.7 28.5 114
Fever or Infection in Child 31.8 12.8 30 128
Overall 26.4 14.1 25 5018
Note: Eta2 = .04. Statistically significant difference among the meanages for known causes of hearing loss, F(11,2431) = 8.8, 2 < .05.* = Not included in the analysis.
Program-start age by onset of hearing loss. For the five levels of age
at onset (Table 61), the median program-start ages ranged from 21 months, for
children with age at onset of at birth and birth to one year, to 51.5 months,
for children with age at onset of three years or older--an extremely large
difference. A statistically significant difference among the mean program-
start ages was obtained, with an Eta2 of .06. The post-hoc analyses indicated
that children whose age at onset of hearing loss was at birth or from birth to
one year began the program at a significantly earlier age than children whose
age at onset was one year or older. Statistically significant differences
114

were obtained among all of the mean program-start ages except between those
for children whose onset was at birth and from birth to one year. The means
ranged from 23.2 months to 53.7 months, with the SMDs ranging from small to
large (.08 to 2.16) by Cohen's (1988) standards.
Table 61
Mean, Standard Deviation, and Median Program -Start Ages by Age at Onset of
Hearing Loss, 1979-1991
Age at Onset SD Mdn
At Birth 23.2 14.4 21 1527
Birth to 1 Year 24.3 14.7 21 304
1 to 2 Years 25.7 9.1 24 213
2 to 3 Years 35.9 7.4 35 62
3 Years or Older 53.7 11.9 51.5 18
Overall 24.3 14.3 22 2124
Note: Eta2 = .06. Statistically significant difference among the mean ages,F(4,2119) = 34.1, p < ,05.
Program-start ace by language spoken in the home. The median program-
start for the levels of language spoken in the home ranged from 15 months, for
homes in which ASL was the primary language, to 27 months, for homes in which
Spanish was the primary language (Table 62). A statistically significant
difference was obtained among the mean program-start ages; however, again the
Eta? was extremely small. Children from homes in which ASL was used obtained
a significantly lower mean program-start age (17.9 months) than children from
homes in which English, Spanish, or other languages were spoken. This finding
is consistent with those reported previously for identification age. The SMDs
ranged from nil to medium (.00 to .64) by Cohen's (1988) standards.
115

Table 62
Mean, Standard Deviation, and Median Program-Start Ages by Lanauage Spoken in
the Home, 1979-1991
Language SD Mdn
English 26.6 14.2 25 4453
Spanish 26.9 13.1 27 237
ASL 17.9 11.6 15 132
Signed English 23.3 14.1 20.5 50
Other 26.6 13.0 26 76
Overall 26.4 14.1 25 4948
Note: Eta2 = .01. Statistically significant difference among the means,F(4,4943) = 13.0, p < .05.
Program-start age by parental hearing loss. The difference between the
median program-start ages for children with and without a parent with a
hearing loss was four months (Table 63), favoring children with a hearing-
impaired parent. The difference between the mean program-start ages was
statistically significant; however, the Eta2 was extremely small. On average,
children with a hearing-impaired parent started the program at 22.8 months of
age, compared to 26.6 months for children without a hearing-impaired parent
(small SMD = .27). This finding is consistent with that reported previously
for identification age.
116
1143

Table 63
Mean, Standard Deviation, and Median Program-Start Ages by One or More
Hearing-Impaired Parent. 1979-1991
Parental Hearing Loss SD Mdn
One or More HI Parent
No HI Parent
Overall
22.8
26.6
14.6
14.0
21
25
442
4472
26.3 14.1 25 4914
Note: Eta2 = .01. Statistically significant difference between themeans, F(1,4912) = 30.6, p < .05.
Program-Start-Age Summary
1. Overall, the median program-start age was 25 months.
2. For children with additional handicapping conditions, the median
program-start age was 22 months.
3. For profoundly impaired children, the median program-start age was
21 months.
4. For children whose cause of hearing loss was a known risk factor or
was visually apparent at birth, the median program-start-age ranged
from 18 to 24 months.
5. For children whose age at onset was at birth or from birth to one
year, the median program-start age was 21 months.
6. For children from homes in which ASL and signed English were the
primary languages, the median program-start ages were 15 and 20.5
months, respectively.
7. For children with a hearing-impaired parent, the median program-
start age was 21 months.
Age Hearin(' Aid Fit
Parent advisors were instructed to write on the SKI*HI data sheet the
date when an aid, either trial or permanent, was first fit by any agency for
each child served. Hearing aids were not recommended for all children by the
attending audiologist in a number of different situations (e.g., fluctuating
117
u

conductive losses due to middle-ear problems, child intolerance of
amplification, and problems with fitting a multiply handicapped child).
Consequently, for 22% of the children (N = 1,152), either a hearing-aid-fit
date was not applicable or not reported or hearing-aid-fit age could not be
calculated due to missing birth dates.
The mean, standard deviation, and median hearing-aid-fit ages are
provided for the children overall and for each program year in Table 64.
Again, discounting the 1979-80 program year, for which the sample size was
exceptionally small, the median hearing-aid-fit ages ranged from 20 to 23
months, with an overall median of 22 months. The means were consistently
larger than the medians, ranging from 21.6 to 24.9 months, with an overall
mean of 23.8 months. The overall standard deviation (13.1) was used in the
calculation of SMDs in this section.
As reported earlier in this chapter, the overall median identification
age was 17 months (M = 18.9 months). The median delay, then, between
identification age and hearing-aid-fit age was approximately 5 months (M delay
of approximately 5 months). This finding is consistent with that reported by
Elssmann et al. (1987), who indicated that audiologists had contributed, "on
average, as much as six additional months to the process--that is, the delay
between age of identification and the age at which the initial hearing aid had
been fitted" (p. 17).
118

Table 64
Mean, Standard Deviation, and Median Ace (in Months) at which a Hearing Aid
was Fit, Overall and by Program -Start Year
Program Year M SD Mdn
7-1-79 thru 18.4 9.8 17 356-30-80
7-1-80 thru 21.6 10.7 20 1186-30-81
7-1-81 thru 23.9 12.7 22 3216-30-82
7-1-82 thru 24.0 13.0 22 4686-30-83
7-1-83 thru 23.7 12.1 23 3106-30 84
7-1-84 thru 23.0 12.4 21 3306-30-85
7-1-85 thru 23.1 13.1 20 2946-30-86
7-1-86 thru 24.0 13.1 22 4416-30-87
7-1-87 thru 24.7 13.7 23 4426-30-88
7-1-88 thru 24.1 12.6 23 4476-30-89
7-1-89 thru 24.9 14.1 23 4776-30-90
7-1-90 thru 23.2 14.1 21 3436-30-91
Overall 23.8 13.1 22 4026
Note: Total children possible = 5,178.
hearing- aid -fit ace by presence of other handicaps. The median hearing-
aid-fit age for children with and without an additional handicapping condition
differed by three months (Table 65). Children with an additional handicapping
condition had a median hearing-aid-fit age of 19 months; those without an
additional handicapping condition had a median age of 22 months. The
119
1

difference between the mean hearing-aid-fit ages was statistically
significant; however, the Eta2 was practically nil (.01). A small SMD (.18)
was calculated.
Table 65
Mean, Standard Deviation, and Median Hearing-Aid-Fit Ages by Presence of
Other Handicaps, 1979-1991
SD Mdn
Other Handicap Present 22.0 13.6 19 881
No Other Handicap Present 24.3 12.8 22 3055
Overall 23.8 13.1 22 3936
Note: Eta2 = .01. Statistically significant difference between themean ages, F(1,3934) = 19.8, p < .05.
Hearing-aid-fit ace by severity of hearing loss. The median differences
among the hearing-aid-fit ages for the severity levels were as large as 9 1/2
months (Table 66), with profound and severely impaired children obtaining the
youngest median hearing-aid-fit ages (19 and 22 months, respectively). The
difference among the means was statistically significant, with profoundly and
severely hearing-impaired children fit with hearing aids at significantly
earlier ages than children with moderate, mild, or no losses. Although Eta2
was small (.04), actual differences between the hearing-aid-fit ages were as
large as 8.4 months. The SMDs ranged from small to medium (.02 to .64) by
Cohen's (1988) standards.
120
153

Table 66
Mean. Standard Deviation, and Median Hearing-Aid-Fit Ages by Severity of
Hearing Loss, 1979-1991
Severity SD Mdn
No Loss 29.1 15.8 28.5 34
Mild Loss 28.9 15.9 27.5 258
Moderate Loss 27.3 14.6 26 725
Severe Loss 23.2 12.3 22 1716
Profound Loss 20.7 10.4 19 869
Overall 23.9 13.0 22 3602
Note: Eta2 = .04. Statistically significant difference among the mean ages,F(4,3597) = 39.1,E < .05.
Hearing-aid-fit age by cause of hearing loss. The causes of hearing loss
provided in Table 67 are arranged by median, from the youngest to the oldest
hearing-aid-fit age. The medians ranged from 17 months, for children whose
mothers had contracted rubella or cytomegalovirus, to 30 months, for children
for whom a fever or infection was the suspected cause of the hearing loss.
The overall median was 22 months.
A statistically significant difference among the mean hearing-aid-fit
ages was obtained; however, the Eta2 was small (.04). Again, children were
removed from the analysis for whom the cause of loss was unknown, not
reported, or reported as "other." Post-hoc analyses indicated that the mean
hearing-aid-fit age for children whose cause of loss was fever or infections
was significantly later than the mean hearing-aid-fit age for children whose
cause of hearing loss was a syndrome, rubella, conditions during pregnancy,
heredity, defects at birth, meningitis, and middle-ear infections. The mean
hearing-aid-fit ages ranged from 19.1 to 30.9--a difference as large as 11.8
months, which is consistent with that reported previously for identification
age and program-start age. The 8MDs ranged from small to large (.01 to .90)
by Cohen's (1988) standards.
121
5 4

Table 67
Mean, Standard Deviation, and Median Hearing-Aid-Fit Ages by Cause of
Hearing Loss, 1979-1991
Cause SD Mdn
Rubella/CMV 19.1 12.3 17 131
RH Incompatibility/Kernicterus 22.0 13.5 17 31
Conditions During Pregnancy 20.4 10.8 18 128
Defects at Birth 21.0 13.6 18 189
Heredity 20.9 13.4 19 410
Child Syndrome 22.1 14.9 19 141
Middle-Ear Problems 23.9 17.8 19 85
Other Cause* 20.2 10.4 20 86
Drugs During Pregnancy 23.4 12.6 20 19
Meningitis 23.4 11.6 21 526
Cause Not Reported* 26.1 13.6 23 72
Unknown Cause* 25.3 12.8 24 2000
Birth Trauma 25.5 14.6 24 109
Drugs Given to Child 25.2 14.5 25.5 44
Fever or Infection in Child 30.9 13.0 30 80
Overall 23.8 13.1 92 4026
Note: Eta2 = .04. Statistically significant difference among the meanages, for known causes of hearing loss, F(11,1856) = 7.0, p < .05.* = Not included in the analysis.
Hearing-aid-fit age by onset cf hearing loss. For the five levels of age
at onset, the median hearing-aid-fit ages ranged from 18 months, for children
with age at onset of at birth and birth to one year, to 47 months, for
children with age at onset of three years or older--an extremely large
difference (Table 68). A statistically significant difference among the mean
hearing-aid-fit ages was obtained, with a low Eta2 (.08). Post-hoc analyses
indicated that children whose age at onset of hearing loss was at birth or
from birth to one year were fit with hearing aids at a significantly earlier
age than children whose age at onset was two years or older. Statistically
122
1 E.

significant differences were obtained among all of the mean hearing-aid-fit
ages, ex'ept between those for children whose onset was at birth and from
birth to one ear and between those for children whose onset was from birth to
one year and from one to two years. The means ranged from 20.8 months to 51.4
months, with the SMDs ranging from small to large (.05 to 2.34) by Cohen's
(1988) standards.
Table 68
Mean, Standard Deviation, and Median Hearing-Aid-Fit Ages by Age at onset of
Hearing Loss, 1979-1991
Age at Onset SD Mdn
At Birth 20.8 13.1 18 1224
Birth to 1 Year 21.5 12.8 18 253
1 to 2 Years 23.9 8.1 22 193
2 to 3 Years 34.6 7.9 35 48
3 Years or Older 51.4 11.1 47 14
Overall 21.9 13.0 19 1732
Note: Eta2 = .08. Statistically significant difference among the mean ages,F(4,1727) = 35.9, p < .05.
Hearing-aid-fit age by language spoken in the home. The median hearing-
aid-fit ages for the levels of language spoken in the home ranged from 16
months, for homes in which ASL was the primary language, to 26 months, for
homes in which Spanish and other languages were the primary languages (Table
69). Although Eta2 was practically zero (.01), a statistically significant
difference was obtained among the mean hearing-aid-fit ages, favoring children
from homes in which ASL or signed English was the primary language (Ms 17.3
and 22.4, respectively). These findings are consistent with those reported
previously for identification age and program-start age. The 21,12s ranged from
small to medium (.09 to .65) by Cohen's (1988) standards.
123

Table 69
Mean, Standard Deviation, and Median Hearing-Aid-Fit Ages by Language Spoken
in the Home, 1979-1991
Language SD Mdn
English 23.9 13.2 22 3624
Spanish 25.8 11.7 26 177
ASL 17.3 9.7 16 93
Signed English 22.4 15.6 18.5 40
Other 25.1 12.3 26 57
Overall 23.8 13.1 22 3991
Note: Eta2 = .01. Statistically significant difference among the means,F(4,3986) = 7.1, 2 < .05.
Hearing-aid-fit age by parental hearing loss. The difference between the
median hearing-aid-fit ages for children with and without a parent with a
hearing loss was 3 months (Table 70), favoring children with a hearing-
impaired parent. Although the Etewas extremely small (<.01), the difference
between the means was statistically significant. On average, children with a
hearing-impaired parent were fit with a hearing aid at approximately 21
months, compared to approximately 24 months for children without a hearing-
impaired parent. The SMD was small (.21).
Table 70
Mean, Standard Deviation, and Median Hearing- Aid -Fit Ages by One or More
Hearing Impaired Parent, 1979-1991
Parental Hearing Loss M 0 Mdn li
One or More HI Parent
No HI Parent
21.2
24.0
13.2
13.0
19
22
332
3637
Overall 23.8 13.1 22 3969
Note: Eta2 = <.01. Statistically significant difference between themeans, £(1,3967) = 13.9, 2 < .05.
124
1 I
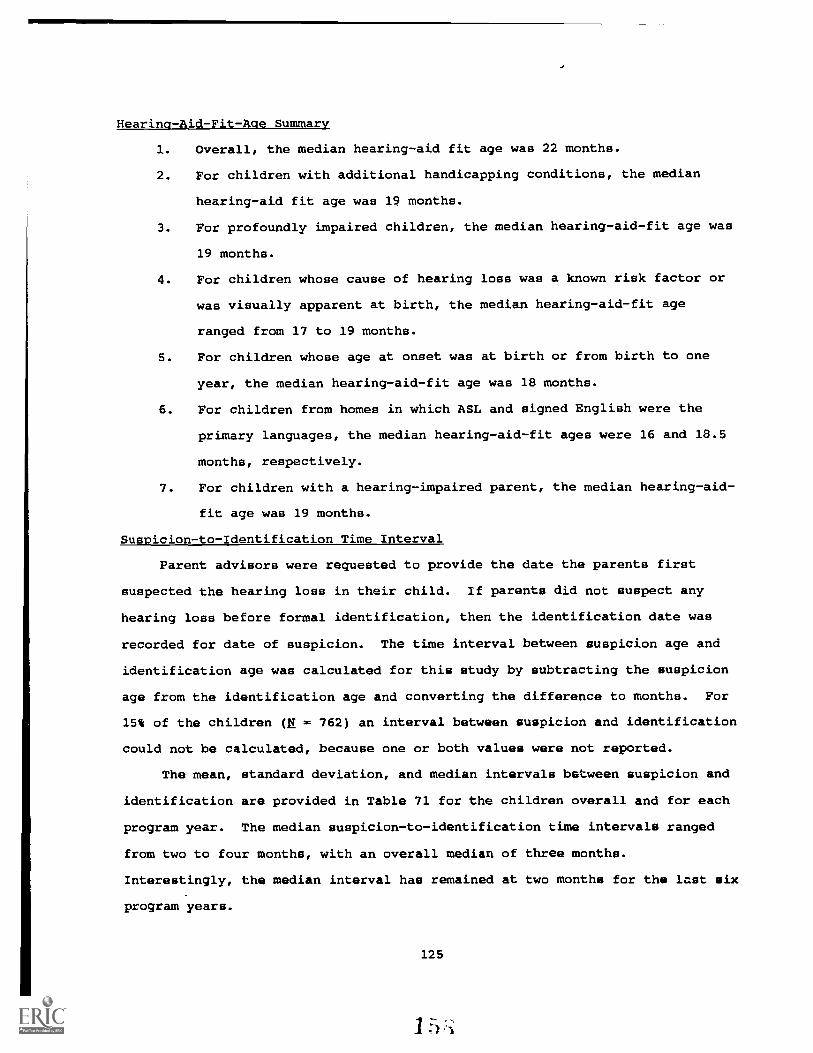
Hearing- Aid Fit -Age Summary
1. Overall, the median hearing-aid fit age was 22 months.
2. For children with additional handicapping conditions, the median
hearing-aid fit age was 19 months.
3. For profoundly impaired children, the median hearing-aid-fit age was
19 months.
4. For children whose cause of hearing loss was a known risk factor or
was visually apparent at birth, the median hearing-aid-fit age
ranged from 17 to 19 months.
5. For children whose age at onset was at birth or from birth to one
year, the median hearing-aid-fit age was 18 months.
6. For children from homes in which ASL and signed English were the
primary languages, the median hearing-aid-fit ages were 16 and 18.5
months, respectively.
7. For children with a hearing- impaired parent, the median hearing-aid-
fit age was 19 months.
Suspicion-to-Identification Time Interval
Parent advisors were requested to provide the date the parents first
suspected the hearing loss in their child. If parents did not suspect any
hearing loss before formal identification, then the identification date was
recorded for date of suspicion. The time interval between suspicion age and
identification age was calculated for this study by subtracting the suspicion
age from the identification age and converting the difference to months. For
15% of the children (N = 762) an interval between suspicion and identification
could not be calculated, because one or both values were not reported.
The mean, standard deviation, and median intervals between suspicion and
identification are provided in Table 71 for the children overall and for each
program year. The median suspicion-to-identification time intervals ranged
from two to four months, with an overall median of three months.
Interestingly, the median interval has remained at two months for the last six
program years.
125

Table 71
Mean, Standard Deviation, and Median Time Interval (in Months) Between Age of
Suspicion and Age of Identification of Hearing Loss. Overall and by Program-
Start Year
Program Year M SD Mdn
7-1-79 thru 4.1 3.3 3 316-30-80
7-1-80 thru 5.3 5.0 3.5 1206-30-81
7-1-81 thru 6.5 6.9 4 3456-30-82
7-1-82 thru 6.5 7.4 4 4956-30-83
7-1-83 thru 6.3 7.0 4 3396-30-84
7-1-84 thru 5.4 6.3 3 3586-30-85
7-1-85 thru 4.9 7.5 2 3156-30-86
7-1-86 thru 5.4 7.8 2 4516-30-87
7-1-87 thru 4.8 6.4 2 4736-30-88
7-1-88 thru 5.4 7.8 2 5076-30-89
7-1-89 thru 5.8 7.7 2 5316-30-90
7-1-90 thru 5.9 9.0 2 4516-30-91
Overall 5.7 7.4 3 4416
Note: Total children possible = 5,178.
The means were consistently larger than the medians, ranging from 4.1 to
6.5 months, with an overall mean of 5.7 months. The overall standard
deviation (7.4) was used in the calculation of 2M2s in this section. The
average suspicion-to-identification time interval for this study was slightly
smaller than the 6.6 to 7.1 months reported by Elasmann et al. (1987).
Elssmann et al. did not report medians, so a comparison cannot be made for
126

that statistic.
Suspicion-to-identification time interval by presence of other handicaps.
The median suspicion-to-identification time intervals for children with and
without an additional handicapping condition were identical (three months), as
shown in Table 72. Although the difference between the mean intervals was
statistically significant, the Eta2 was essentially zero and the actual mean
difference was only .6 of a month (SMD = .08).
Table 72
Mean, Standard Deviation, and Median Interval Between Suspicion and
Identification by Presence of Other Handicaps, 1979-1991
SD Mdn
Other Handicap Present 5.2 7.2 3 1055
No Other Handicap Present 5.8 7.5 3 3268
Overall 5.6 7.4 3 4323
Note: Eta2 = <.01. Statistically significant difference between themean ages, F(1,4321) = 4.1, 2 < .05.
Suspicion-to-identification time interval by severity of hearing loss.
The median differences among the suspicion-to-identification time intervals
for the severity levels were small, ranging from two to three months (Table
73). Although the difference among the mean intervals was statistically
significant, the Eta2 was essentially zero and the largest actual mean
difference between severity levels was only 1.4 months. The interval for
children with profound losses was statistically significantly smaller than
that for children with moderate losses. The SMDs ranged from nil to small
(.00 to .19) by Cohen's (1988) standards.
127
It3!)

Table 73
Mean, Standard Deviation, and Median Interval Between Suspicion and
Identification by Severity of Hearing Loss, 1979-1991
Severity SD Mdn
No Loss 6.4 9.3 2 142
Mild Loss 5.9 8.4 2 338
Moderate Loss 6.4 8.4 3 790
Severe Loss 5.6 7.2 3 1784
Profound Loss 5.0 6.2 3 894
Overall 5.7 7.5 3 3948
Note: Eta2 = <.01. Statistically significant difference among the meanages, F(4,3943) = 4.4, p < .05.
Suspicion-to-identification time interval by cause of loss. The causes
of hearing loss provided in Table 74 are arranged by median, from the smallest
to the largest suspicion-to-identification time intervals. The medians ranged
from one month, for children for whom the cause of hearing loss was meningitis
and defects at birth, to four months, for children for whom Rh
incompatibility, drugs during pregnancy, fever or infection in the child, or
birth trauma was the cause of hearing loss. The overall median was three
months.
A statistically significant difference among the mean suspicion-to-
identification time intervals was obtained; however, the Eta2 was practically
nil (.01). Again, children were removed from the analysis for whom the cause
of loss was unknown, not reported, or reported as "other." Post-hoc analyses
indicated that the mean time interval for children whose cause of loss was
meningitis was significantly smaller than the mean interval for children whose
cause of hearing loss was either birth trauma or fever or infection. The mean
intervals ranged from 4 to 6.7 months--that is, the largest mean difference
was 2.7 months. The SMDs ranged from nil to small (.00 to .36) by Cohen's
(1988) standards.
128
I f'

Table 74
Mean, Standard Deviation, and Median Intervals Between Suspicion and
Identification by Cause of Hearina Loss, 1979-1991
Cause SD Mdn
Meningitis 4.0 7.0 1 557
Defects at Birth 4.5 7.3 1 224
Child Syndrome 4.4 7.4 2 127
Rubella/CMV 5.1 7.6 2 147
Middle-Ear Problems 5.7 8.7 2 208
Heredity 5.3 6.9 3 464
Conditions During Pregnancy 5.8 7.5 3 142
Drugs Given to Child 6.0 10.8 3 41
Rh Incompatibility/Kernicterus 5.5 6.0 4 33
Drugs During Pregnancy 6.0 8.7 4 21
Other Cause * 6.1 7.4 4 87
Unknown Cause * 6.2 7.2 4 2065
Fever or Infection in Child 6.6 7.5 4 108
Birth Trauma 6.7 8.3 4 125
Cause Not Reported * 6.7 8.5 4 67
Overall 5.7 7.4 3 4416
Note: Eta2 = .01. Statistically significant difference among the meanages, for known causes of hearing loss, F(11,2185) = 2.6, p < .05.* Not included in analysis.
Suspicion-to-identification time interval by onset of hearing loss. For
the five levels of age at onset, the median suspicion-to-identification time
intervals ranged from one month, for children with age at onset of at birth
and birth to one year, to two months, for children with age at onset of one
year or older--a small difference (Table 75). Although a statistically
significant difference among the mean intervals was obtained, the Eta2 was
practically zero (.01). Post-hoc analyses indicated that the mean time
interval for children whose age at onset was at birth was statistically
129
1 fi

significantly larger than the mean interval for children whose age at onset
was one-to-two years. The mean intervals ranged from 3 months to 5.6 months,
with small SMDs (.04 to .35) by Cohen's (1988) standards.
Table 75
Mean, Standard Deviation, and Median Intervals Between Suspicion and
Identification by Age at Onset of Hearing Loss, 1979-1991
Age at Onset SD Mdn
At Birth 5.3 7.4 2 1390
Birth to 1 Year 5.0 7.8 2 280
1 to 2 Years 3.5 5.2 2 195
2 to 3 Years 3.0 4.6 1 58
3 Years or Older 5.6 13.1 1 19
Overall 5.0 7.3 2 1942
Note: Eta2 = .01. Statistically significant difference among the meanages, F(4,1937) = 3.8, p < .05.
Suspicion-to-identification time interval by language spoken in tna home.
The median suspicion-to-identification time intervals for the levels cf
language spoken in the home ranged from two to three months (Table 76)--a very
small difference. No statistically significant difference among the mean
intervals was obtained, and Eta2 was essentially zero (<.01). The mean
intervals ranged from 4.8 to 5.7 months, with small and unimportant
differences between pairs of means. The SMDs were small (.04 to .16) by
Cohen's (1988) standards.
130
11.3
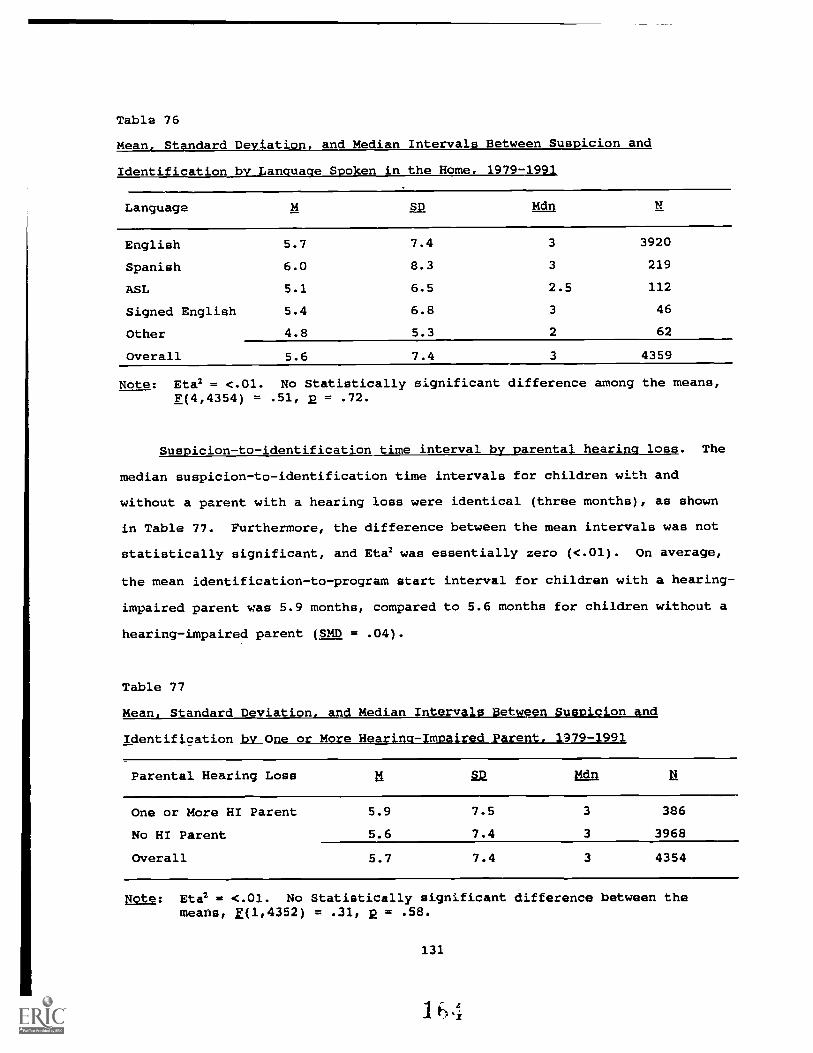
Table 76
Mean, Standard Deviation, and Median Intervals Between Suspicion and
Identification by Language Spoken in the Home, 1979-1991
Language SD Mdn
English 5.7 7.4 3 3920
Spanish 6.0 8.3 3 219
ASL 5.1 6.5 2.5 112
Signed English 5.4 6.8 3 46
Other 4.8 5.3 2 62
Overall 5.6 7.4 3 4359
Note: Eta2 = <.01. No Statistically significant difference among the means,F(4,4354) = .51, p = .72.
Suspicion-to-identification time interval by parental hearing loss. The
median suspicion-to-identification time intervals for children with and
without a parent with a hearing loss were identical (three months), as shown
in Table 77. Furthermore, the difference between the mean intervals was not
statistically significant, and Eta2 was essentially zero (<.01). On average,
the mean identification-to-program start interval for children with a hearing-
impaired parent was 5.9 months, compared to 5.6 months for children without a
hearing-impaired parent (SMD = .04).
Table 77
Mean, Standard Deviation, and Median Intervals Between Suspicion and
Identification by One or More Hearing - Impaired Parent, 1979-1991
Parental Hearing Loss 211 Lan II
One or More HI Parent 5.9 7.5 3 386
No HI Parent 5.6 7.4 3 3968
Overall 5.7 7.4 3 4354
Note: Eta2 = <.01. No Statistically significant difference between themeans, E(1,4352) = .31, 2 = .58.
131
1 1) 4

Suspicion-to-Program-Start-Interval Summary
1. Overall, the median suspicion-to-identification time interval was 3
months.
2. The median suspicion-to-identification time interval was smallest (1
month) for children whose cause of hearing loss was meningitis or
defects at birth and for children whose age at onset was two years
or older.
Identification-to-Program-Start Time Interval
The identification-to-program-start time interval was computed by
subtracting the identification date from the program-start date and converting
the difference into months. For 7% of the children (N = 379) an interval
between identification and program start could not be calculated because one
or both values were not reported.
The mean, standard deviation, and median intervals between identification
and program start are provided in Table 78 for the children overall and for
each program year. The median identification-to-program-start intervals
ranged from two to four months, with an overall median of four months. For
six of the last seven years, the median interval has remained at three months.
The means were consistently larger than the medians. Again, discounting the
1979-80 program year, for which the sample size was exceptionally small, the
mean intervals ranged from 5.2 to 8.8 months, with an overall mean interval of
7.2 months. The overall standard deviation of 9.2 was used in the calculation
of the SMns in this section.
132
165
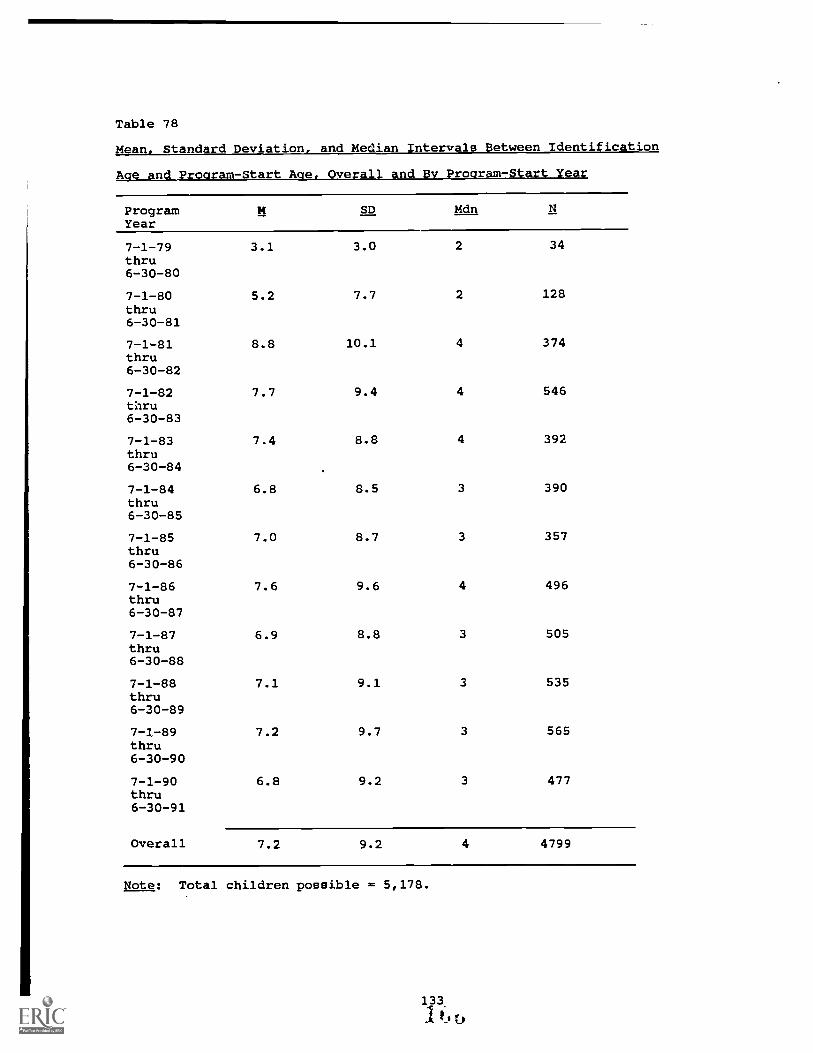
Table 78
Mean, Standard Deviation, and Median Intervals Between Identification
Ace and Proaram-Start Ace, Overall and By Proaram-Start Year
ProgramYear
M SD Mdn
7-1-79thru
3.1 3.0 2 34
6-30-80
7-1-80thru
5.2 7.7 2 128
6-30-81
7-1-81thru
8.8 10.1 4 374
6-30-82
7-1-82thru
7.7 9.4 4 546
6-30-83
7-1-83thru
7.4 8.8 4 392
6-30-84
7-1-84thru
6.8 8.5 3 390
6-30-85
7-1-85thru
7.0 8.7 3 357
6-30-86
7-1-86thru
7.6 9.6 4 496
6-30-87
7-1-87thru
6.9 8.8 3 505
6-30-88
7-1-88thru
7.1 9.1 3 535
6-30-89
7-1-89thru
7.2 9.7 3 565
6-30-90
7-1-90thru
6.8 9.2 3 477
6-30-91
Overall 7.2 9.2 4 4799
Note: Total children possible = 5,178.

Identification-to-program-start time interval by presence of other
handicaps. The median identification-to-program-start time intervals for
children with and without an additional handicapping condition were four and
three months, respectively (Table 79). Although the difference between the
mean intervals was statistically significant, the Eta2 was practically nil and
the actual mean difference was 1.5 months (SMD = .16), favoring children
without an additional handicapping condition.
Table 79
Mean, Standard Deviation, and Median Intervals Between Identification
and Program Start by Presence of Other Handicaps, 1979-1991
SD Mdn
Other Handicap Present 8.3 10.1 4 1140
No Other Handicap Present 6.8 8.8 3 3554
Overall 7.2 9.1 3 4694
Note: Eta2 = .01. Statistically significant difference between themean ages, F(1,4692) = 24.3, 2 < .05.
Identification-to-program-start time interval by severity of hearing
loss. The median differences among the suspicion-to-identification time
intervals for the severity levels were small, ranging from three to four
months (Table 80). The difference among the mean intervals was not
statistically significant, and the Eta2 was essentially zero. The largest
actual mean difference between severity levels was only .4 months. The 2ns
ranged from nil to small (.00 to .04) by Cohen's (1988) standards.
134
1 tk);

Table 80
Mean, Standard Deviation, and Median Interval Between Identification and
Program Start by Severity of Hearing Loss, 1979-1991
Severity SD Mdn
No Loss 7.2 9.2 3 156
Mild Loss 7.2 10.2 3 369
Moderate Loss 7.3 9.4 4 842
Severe Loss 6.9 8.7 3 1906
Profound Loss 7.0 8.9 3 968
Overall 7.0 9.0 3 4241
Note: Eta2 = <.01. No statistically significant difference among the meanages, F(4,4236) = .36, p = .84.
Identification-to-program-start time interval by cause of hearing loss.
The causes of hearing loss provided in Table 81 are arranged by median, from
the smallest to the largest identification-to-program-start time intervals.
The medians ranged from three months, for children for whom the cause of
hearing loss was meningitis, drugs during pregnancy, middle-ear problems, and
Rh incompatibility, to six months, for children for whom a syndrome was the
cause of hearing loss. The overall median was four months.
A statistically significant difference among the mean identification-to-
program-start time intervals was obtained; however, the Eta2 was practically
nil (.01). Again, children were removed from the analysis for whom the cause
of loss was unknown, not reported, or reported as "other." Post-hoc analyses
indicated that the mean identification -to- program -start interval for children
whose cause of loss was meningitis was statistically significantly smaller
than the mean interval for children whose cause of hearing loss was either
birth trauma or defects at birth. The mean intervals ranged from 6.3 to 9.9
months--that is, the largest mean difference was 3.6 months. The Stops ranged
from nil to small (.00 to .36) by Cohen's (1988) standards.
135
3

Table 81
Mean, Standard Deviation, and Median Intervals Between Identification
and Program Start by Cause of Hearina Loss, 1979-1991
Cause SD Mdn
Unknown Cause * 6.3 8.3 3 2253
Meningitis 6.8 8.8 3 596
Drugs During Pregnancy 7.3 9.8 3 26
Middle -Ear Problems 7.4 9.4 3 227
RH Incompatibility/Kernicterus 8.8 11.2 3 33
Heredity 7.4 9.1 4 492
Drugs Given to Child 7.4 7.9 4 44
Cause Not Reported * 7.7 9.9 4 91
Defects at Birth 9.9 12.5 4 235
Fever or Infection in Child 8.8 10.4 4.5 124
Rubella/CMV 8.2 10.4 5 157
Conditions During Pregnancy 8.6 9.0 5 147
Other Cause * 9.3 10.9 5 104
Birth Trauma 9.9 10.9 5 133
Child Syndrome 9.6 9.8 6 137
Overall 7.2 9.2 4 4799
Note: Eta2 = .01. Statistically significant difference among the meanages, for known causes of hearing loss, F(11,2339) = 2.8, 2 < .05.* Not included in analysis.
Identification-to- ro ram-star t me interval b a e at onset of loss.
For the five levels of age at onset, the median identification-to-program-
start time intervals ranged from 2 1/2 months, for children with age at onset
of two years or greater, to 4 months, for children with age at onset at birth
or at birth to one year (Table 82). Although a statistically significant
difference among the mean intervals was obtained, the Eta2 was practically
zero (.01). Post-hoc analyses indicated that the mean intervals for children
whose age at onset was at birth and at birth to one year were statistically
signifidantly larger than the mean intervals for children whose age at onset
was one-to-two and two-to-three years. The mean intervals ranged from 3.8
months to 8.5 months. The SMDs ranged from small to medium (.02 to .51).
136

Table 82
Mean, Standard Deviation and Median Intervals Between Identification
and Program Start by Age at Onset of Hearing Loss, 1979-1991
Age at Onset SD Mdn
At Birth 8.5 10.1 4 1475
Birth to 1 Year 8.3 10.4 4 295
1 to 2 Years 5.6 7.3 3 205
2 to 3 Years 4.4 5.5 2.5 58
3 Years or Older 3.8 3.4 2.5 18
Overall 8.0 9.8 4 2051
Note: Eta2 = .01. Statistically significant difference among the meanages, F(4,2046) = 7.1, 2 < .05.
Identification-to-program-start time interval by language spoken in the
home. The median identification-to-program-start intervals for the levels of
language spoken in the home ranged from three to six months (Table 83).
Although a statistically significant difference among the mean intervals was
obtained, Eta2 was essentially zero (<.01). The mean intervals ranged from
6.4 to 11.1 months. Children from homes in which other languages were spoken
obtained a statistically significantly larger mean interval than children from
homes in which English, Spanish, or ASL were the primary languages. The
largest difference between pairs of means was 4.7 months, favoring children
from homes in which ASL was the primary language. The SMDs ranged from small
to medium (.01 to .51) by Cohen's (1988) standards.
The median and mean for children from homes in which other languages were
spoken were strikingly large (6 and 11.1 months, respectively). It is
possible that because of language barriers, families who spoke minority
languages other than Spanish did not understand the written or spoken
communication detailing services for their children. It is equally possible
that because of cultural differences regarding handicapping conditions, such
families did not initially accept services that were available for their
children.
137
1:U

Table 83
Mean, Standard Deviation, and Median Intervals Between Identification
and Program Start by Language Spoken in the Home, 1979-1991
Language SD Mdn hi
English 7.2 9.1 3 42 62
Spanish 7.3 9.4 4 230
ASL 6.4 7.9 4 127
Signed English 7.7 10.3 3 47
Other 11.1 13.1 6 71
Overall 7.2 9.2 4 4737
Note: Eta2 = <.01. Statistically significant difference among the means,F(4,4732) = 3.5, g < .05.
Identification-to-program-start time interval by parental hearing loss.
The median identification-to-program-start time intervals for children with
and without a parent with a hearing loss were four and three months,
respectively (Table 84). No statistically significant difference between the
mean intervals was obtained, and Eta2 was essentially zero (<.01). The mean
identification-to-program-start interval for children with a hearing-impaired
parent was 7.6 months, compared to 7.2 months for children without a hearing-
impaired parent (SMD = .04).
Table 84
Mean, Standard Deviation, and Median Intervals Between Identification
and Program Start by One or More Hearing- Impaired Parent, 1979-1991
Parental Hearing Loss li
One or More HI Parent
No HI Parent
7.6
7.2
9.1
9.2
4
3
422
4291
Overall 7.2 9.2 3 4713
Note: Eta2 = <.01. No Statistically significant difference between themeans, F(1,4711) = .76, R < .05.
Identification-to-Program-Start-Time-Interval Summary
1. The median identification-to-program-start interval was 4 months.
2. The median identification-to-program-start time interval was
smallest (2.5 months) for children whose age at onset was two years
or older.
3. The median identification-to-program-start time interval was largest
(6 months) for children whose cause of loss was a syndrome and for
children from homes in which international languages other than
Spanish were spoken.
Suspicion -to- Program -Start Interval
The suspicion-to-program-start time interval was computed by subtracting
the suspicion date from the program-start date and converting the difference
into months. For 17% of the children (N = 856) an interval between suspicion
and program start could not be calculated because one or both values were not
reported.
The mean, standard deviation, and median intervals between suspicion and
program start are provided in Table 85 for the children overall and for each
program year. Discounting the 1979-80 program year, for which the sample size
was exceptionally small, the median suspicion-to-program-start intervals
ranged from 8 to 10 1/2 months, with an overall median of 9 months. The means
were consistently larger than the medians, ranging from 10.8 to 15.3 months,
with an overall mean interval of 12.7 months. The overall standard deviation
(11.1) was used in the calculation of the SMDs in this section.
139

Table 85
Mean, Standard Deviation, and Median Intervals Between Ace of Suspicion and
Ace at Program Start, Overall and by Program-Start Year
Program Year SD Mdn
7-1-79 thru 7.1 4.8 6 296-30-80
7-1-80 thru 10.8 9.5 8 1156-30-81
7-1-81 thru 15.3 12.1 12 3266-30-82
7-1-82 thru 13.6 11.1 1C 4716-30-83
7-1-83 thru 13.1 10.6 10.5 3246-30-84
7-1-84 thru 11.9 9.8 9 3436-30-85
7-1-85 thru 11.5 10.8 8 3116-30-86
7-1-86 thru 13.0 11.8 9 4456-30-87
7-1-87 thru 11.5 10.2 8 4736-30-88
7-1-88 thru 12.6 10.9 9 5056-30-89
7-1-89 thru 13.0 11.5 9.5 5306-30-90
7-1-90 thru 12.6 11.7 8.5 4506-30-91
Overall 12.7 11.1 9 4322
Note: Total children possible = 5,178.
Suspicion-to-program-start time interval by presence of other handicaps.
The median suspicion-to-program-start time intervals for children with and
without an additional handicapping condition were 10 and 9 months,
respectively (Table 86). Although the difference between the mean intervals
was statistically significant, the Eta2 was practically nil and the actual
mean difference was 1.4 months (SMD = .13), favoring children without an
additional handicapping condition.,
140

Table 86
Mean, Standard Deviation, and Median Intervals Between Suspicion and
Program Start by Presence of Other Handicaps, 1979-1991
SD Mdn
Other Handicap Present 13.7 11.6 10 1029
No Other Handicap Present 12.3 10.8 9 3206
Overall 12.6 11.0 9 4235
Note: Eta2 = <.01. Statistically significant difference between themean ages, F(1,4233) = 12.6, p < .05.
Suspicion -to- program -start time interval by severity of hearing loss.
The median differences among the suspicion-to-identification time intervals
for the severity levels were small, ranging from 8 to 10 months (Table 87).
Although the difference among the mean intervals was statistically
significant, the Eta2 was essentially zero (<.01). The largest actual mean
difference between severity levels was only 1.9 months. The gMas were small
(ranging from .01 to .17) by Cohen's (1988) standards.
Table 87
Mean, Standard Deviation, and Median Intervals Between Suspicion to
Program Start by Severity of Hearing Loss, 1979-1991
Severity SD
No Loss
Mild Loss
Moderate Loss
Severe Loss
Profound Loss
12.9
13.0
13.6
12.3
11.7
10.9
12.4
11.8
10.7
10.0
10
8
10
9
9
142
331
775
1746
883
Overall 12.5 11.0 9 3877
Note: Eta2 = <.01. Statistically significant difference among the meanages, E(4,3872) = 3.3, p < .05.
141
1 7. ft

Suspicion -to- program -start time interval by cause of hearing loss. The
causes of hearing loss provided in Table 88 are arranged by median from the
smallest to the largest suspicion-to-program-start time intervals. The
medians ranged from 7 months, for children for whom the cause of hearing loss
was meningitis and drugs during pregnancy, to 13 months, for children for whom
birth trauma and conditions during pregnancy were the causes of hearing loss.
The overall median was 9 months.
A statistically significant difference among the mean suspicion-to-
program-start time intervals was obtained; however, the Eta2 was small (.02).
Again, children were removed from the analysis for whom the cause of loss was
unknown, not reported, or reported as "other." Post-hoc analyses indicated
that the mean suspicion-to-program-start interval for children whose cause of
loss was meningitis was statistically significantly smaller than the mean
intervals for children whose cause of hearing loss was birth trauma, defects
at birth, or conditions during pregnancy. The mean intervals ranged from 10.7
months, for children who had contracted meningitis, to 16.3 months, for child
who had suffered birth trauma--that is, the largest mean difference was 5.6
months. The SMDs ranged from small to medium (.01 to .50) by Cohen's (1988)
standards.
142
1(5

Table 88
Mean, Standard Deviation, and Median Intervals Between Suspicion and Proaram
Start by Cause of Hearing Loss, 1979-1991
Cause SD Mdn
Meningitis 10.7 10.5 7 545
Drugs During Pregnancy 13.0 13.0 7 21
Rh Incompatibility/Kernicterus 13.2 12.0 8.5 32
Unknown Cause * 12.3 10.4 9 2026
Heredity 12.7 10.8 9 450
Drugs Given to Child 13.4 13.1 9.5 40
Middle-Ear Problems 12.8 11.1 10 205
Rubella /CMV 13.6 12.7 10 143
Child Syndrome 13.9 11.6 10 125
Cause Not Reported * 14.5 12.7 10 66
Other Cause * 14.0 11.1 11 82
Defects at Birth 14.9 13.2 11 221
Fever or Infection in Child 14.2 11.3 12.5 104
Conditions During Pregnancy 14.4 10.8 13 141
Birth Trauma 16.3 13.1 13 121
Overall 12.7 11.1 9 4322
Note: Eta2 = .02. Statistically significant difference among the meanages, for known causes of hearing loss, f(11,2136) = 3.9, p < .05.* Not included in analysis.
Suspicion -to- program -start time interval by age at onset of loss. For
the five levels of age at onset, the median suspicion-to-program-start time
intervals ranged from 5 months, for children with age at onset of one to two
years, to 10 months, for children with age at onset at birth or at birth to
one year (Table 89). Although a statistically significant difference among
the mean intervals was obtained, the Eta? wan small (.02). Post-hoc analyses
indicated that the mean suspicion-to-program-start intervals for children
whose age at onset was at birth and at birth to one year was statistically
significantly larger than the mean intervals for children whose age at onset
143

was one to two and two to three years. The mean intervals ranged from 7.2
months to 13.8 months, with the SMDs ranging from small to medium (.04 to .59)
by Cohen's (1988) standards.
Table 89
Mean, Standard Deviation, and Median Intervals Between Suspicion to
Program Start by Age at Onset of Hearing Loss, 1979-1991
Age at Onset SD Mdn
At Birth 13.8 11.8 10 1358
Birth to 1 Year 13.1 11.9 10 271
1 to 2 Years 9.1 9.3 5 193
2 to 3 Years 7.2 6.5 6 57
3 Years or Older 9.5 13.5 6 18
Overall 13.0 11.6 9 1897
Note: Eta2 = .02. Statistically significant difference among the meanages, F(4,1892) = 11.1, p < .05.
Suspicion-to-program-start time interval by language spoken in the home.
The median suspicion-to-program-start time intervals for the levels of
language spoken in the home ranged from 8 to 13 months (Table 90). No
statistically significant difference among the mean intervals was obtained,
and Eta2 was essentially zero (<.01). The mean intervals ranged from 11.5 to
15.1 months. The largest difference between pairs of means was 3.6 months.
The SMDs were small (ranging from .01 to .32) by Cohen's (1988) standards.
Suspicion-to-program-start time interval by parental hearing loss. The
median suspicion-to-program-start time intervals for children with and without
a parent with a hearing loss were 10 and 9 months, respectively (Table 91).
No statistically significant difference between the mean intervals was
obtained, and Eta2 was essentially zero (<.01). The mean suspicion-to-
program-start interval for children with a hearing-impaired parent was 13.3
months, compared to 12.6 months for children without a hearing-impaired parent
(5MD = .06).
1441 I"-, t"1r!

Table 90
Mean, Standard Deviation, and Median Intervals Between Suspicion and Program
Start by Language Spoken in the Home, 1979-1991
Language SD Mdn PI
English 12.7 11.0 9 3842
Spanish 13.2 11.7 9 213
ASL 11.5 9.1 9 111
Signed English 13.1 11.7 8 45
Other 15.1 12.8 13 59
Overall 12.7 11.1 9 4270
Note: Eta2 = <.01. No Statistically significant difference among the means,F(4,4265) = 1.2, 2 = .32.
Table 91
Mean, Standard Deviation, and Median Intervals Between Suspicion and
Program Start by One or More Hearing-Impaired Parent, 1979-1991
Parental Hearing Loss SD Mdn
One or More HI Parent
No HI Parent
13.3
12.6
11.3
11.0
10
9
374
3887
Overall 12.7 11.0 9 4261
Note: Eta? = <.01. No Statistically significant difference between themeans, F(1,4259) = 1.4, 2 = .24.
Suspicion-to-Program-Start-Time-Interval Summary
1. Overall, the median suspicion-to-program-start time interval was 9
months.
2. The median suspicion-to-program-start interval was smallest (i.e., 5
to 6 months) for children whose age at onset was one year or older.
3. The median suspicion-to-program-start time interval was largest (13
months) for children from nomes in which languages other than
145
Spanish were spoken.
4. The median suspicion-to-program-start interval was largest (13
months) for children whose cause of hearing loss was conditions
during pregnancy (e.g., prematurity) and birth trauma.
Who Suspected the Hearing Loss and Cause of Suspicion
As described in the previous section, the median identification age was
17 months. With a median suspicion-to-identification time interval of 3
months, at least 50% of the children were first suspected between birth and 14
months of age to have a hearing loss. When developing the identification-
procedure questionnaire (Appendix E), two questions were of particular
interest: (a) Who first suspected the hearing loss? and (b) What caused the
suspicion? We present in this section the findings from the questionnaire for
these two questions. Personnel from 65 sites volunteered to participate in
this portion of the study (Table 46). Site personnel were instructed to
obtain the responses to each question from the children's files but also to
telephone parents if the required information was not available in the files.
Data were submitted for 1,404 children, for the program years 1986-1989 only.
Who Suspected the Hearing Loss
As expected, the findings from the questionnaire indicated that
caregivers (e.g., parents, grandparents, baby sitters) were the first to
suspect a hearing loss for nearly 60% (N = 835) of the children (Table 92).
For 12% (N = 170) of the children, medical personnel were the first to suspect
a hearing loss. Educators, other specialists (audiologists, speech-language
pathologists, and psychologists), and health and human services personnel
accounted for the remaining 7% (N = 101) of the children. For 21% (N = 298)
of the children, the response to this question was "unknown" or there was no
response to the question.
146
1

Table 92
Frequencies and Percentages of Children by Who Suspected the Hearing Loss,
1986-1989
Who Suspected
Caregivers 835 59.5
Medical Personnel 170 12.1
Educators 51 3.6
Other Specialists 34 2.4
Health Dept./Human Services 16 1.1
No Response/Unknown 298 21.2
Total 1404 100.0
In Table 93, we present the means, standard deviations, and medians for
each of the age and time-interval variables by the categories of who first
suspected a hearing loss. Findings from the analyses of variance are reported
also, as well as the Eta2 values, which were all small, indicating little
relationship between the age and time-interval variables and the categories of
who suspected the hearing loss. For all analyses, the No Response/Unknown
category was not included.
Identification ace. The median identification ages ranged from 11
months, for child.ran whose hearing losses were first suspected by health and
human services personnel, to 24 months, for those suspected by educators. The
difference among the mean identification ages was statistically significant,
with the means ranging from 13.4 months to 27.3 months. The ,mss ranged from
small to large (.04 to 1.07) by Cohen's (1988) standards. Post-hoc analyses
indicated that children whose hearing loss was suspected by health/human
services personnel, medical personnel, or caregivers obtained statistically
significantly lower mean identification ages than those suspected by
educators. Because children typically do not attend preschool until
approximately 2 1/2 to 3 years of age, this finding was anticipated.
147

Table 93
Means. Medians. Standard Deviations, and ANOVA Results for Ages :nd Time Intervals by Who Suspected the Hearing Loss, 1986-1989
Who Suspected Mean Mdn SD N F Eta'
Age of Identification (in Months)
Health/Human Services 13.4 [11] 7.9 16 9.3' .04
No Response/Unknown 15.4 [13] 12.1 282
Medical 15.9 [14.5] 12.1 166
Caregivers 20.0 [18] 12.5 803
Other Specialists 20.5 [171 15.7 32
Educators 27.3 [24] 16.9 50
Age at Program Start (in Months)
Health/Human Services 19.2 [15.5] 10.1 16 6.6* .02
Medical 23.4 [22] 13.3 168
No Response/Unknown 24.3 [23] 14.4 293
Cat jiver 26.5 [25] 13.0 822
Other Specialists 28.5 [24] 17.4 32
Educators 33.1 [31] 17.3 50
Age Hearing Aid Fit
Health/Human Services 7.2 [15.5] 9.0 8 6.4* .03
No ResponsciUnIcnown 21.2 [19] 12.0 226
Medical 22.7 [21] 13.2 134
Caregivers 24.8 [24] 12.9 721
Other Specialists 29.2 [23] 18.0 26
Educators 33.2 [31] 15.6 41
Time Interval (in Months) Between Suspicion and Identification
Medical 3.1 [1] 6 161 5.2' .02
Health/Human Services 4.1 [2.5] 4.2 16
No Response/Unknown 4.1 [2] 6.6 264
Educators 5.5 [2] 8.1 49
Caregivers 6.1 [3] 7.9 758
Other Specialists 6.7 [3] 9.3 31
Time Interval (in Months) Between Identification and Program Start
Health/Human Services 5.8 [4] 5.8 16 .9 <.01
Educators 5.8 [3] 8.1 50
Caregivers 6.2 [3] 8.3 798
Medical 7.4 [4] 9.1 166
Other Specialists 7.9 [2.5] 14.9 32
No Response/Unknown 8.3 [4] 9.., 282
11M

Table 93 (Continued)
Who Suspected Means Mdn SD Eta2
Time Interval (in Months) Between Suspicion and Program Start
Health/Human Set-vices 9.9 [7.5] 7.4 16 1.S .01
Medical 10.4 [7] 10.4 155
Educators 11.4 [9] 11.6 49
No Response/Unknown 12.2 [8] 10.9 263
Caregivers 12.2 [9] 10.6 751
Other Specialists 14.8 [9] 15.3 31
Note: = Statistically significant difference among the means, Q < .05.Medians are in brackets.
Program-start ace. The median program-start ages ranged from 15.5 months
for children whose hearing losses were first suspected health and human
services personnel, to 31 months, for those suspected by educators. The
difference among the mean program-start ages was statistically significant,
with the means ranging from 19.2 months to 33.1 months. The SMDs ranged from
small to large (.07 to 1.03) by Cohen's (1988) standards. Again, post hoc
analyses indicated that children whose hearing losses were first suspected by
health/human services personnel, medical personnel, and caregivers obtained
statistically significantly lower mean program-start ages than those suspected
by educators.
Hearing-aid-fit age. The median hearing-aid-fit ages ranged from 15.5
months, for children whose hearing losses were first suspected by health and
human services personnel, to 31 months, for those suspected by educators. The
difference among the mean hearing-aid-fit ages was statistically significant,
with the means ranging from 17.2 months to 33.2 months. The ,mss ranged from
small to large (.11 to 1.2) by Cohen's (1988) standards. Again, post hoc
analyses indicated that children whose hearing losses were suspected by
health/human services personnel, medical personnel, or caregivers obtained
statistically significantly lower mean hearing-aid fit ages than those
149

suspected by educators.
Suspicion-to-identification time interval. The median suspicion-to-
identification time intervals ranged from one month, for children whose
hearing losses were suspected by medical personnel, to three months, for those
suspected by caregivers and other specialists. The difference among the mean
suspicion-to-identification intervals was statistically significant, with the
means ranging from 3.1 months to 6.7 months. The SMDs ranged from nil to
small (.00 to .47) by Cohen's (1988) standards. Post-hoc analyses indicated
that children whose hearing losses were suspected by medical personnel
obtained statistically significantly lower mean suspicion-to-identification
time intervals than those suspected by caregivers.
Identification-to-program-start time interval. The median
identification-to-program-start time intervals ranged from 2.5 months, for
children whose hearing losses were suspected by other specialists, to 4
months, for those suspected by health and human services personnel and medical
personnel. The difference among the mean identification-to-program-start
intervals was not statistically significant, with the means ranging from 5.8
months to 8.3 months. The SMDs ranged from nil to small (.00 to .29) by
Cohen's (1988) standards.
Suspicion -to- program -start time interval. The median suspicion-to-
program-start time intervals ranged from 7 months, for children whose hearing
losses were suspected by medical personnel, to 9 months, for those suspected
by caregivers, educators, and other specialists. The difference among the
mean suspicion-to-program-start intervals was not statistically significant,
with the means ranging from 9.9 months to 14.8 months. The plipe were small
(ranging from .05 to .45) by Cohen's (1988) standards.
What Caused the Suspicion
As expected, the findings from the questionnaire indicated that delays in
auditory and language development caused suspicion of a hearing loss for 55.3%
(H se 777) of the children (Table 94). Heredity and meningitis were each
cause for suspicion for 5.1% (N = 72) of the children. A variety of other
150
1 3

causes of suspicion accounted for the remaining 10.6% (N = 148) of the
children (see Table 94). For 23.9% (N = 335) of the children, cause of
suspicion was reported as unknown or there was no response to this question.
Table 94
Frequencies and Percentages of Children for Each
Cause of Suspicion, 1986-1989
Cause of Suspicion
Auditory or Language Delay 777 55.3
Heredity 72 5.1
Meningitis 72 5.1
Birth Complications/Defects 64 4.6
Otitis Media/Middle Ear 27 1.9
Medical/School Screening 19 1.4
ADD/Behavior Problem 13 .9
Health Problems 11 .8
Rubella/CMV 11 .8
High-Risk Register Card 3 .2
No Response/Unknown 335 23.9
Total 1404 100.0
In Table 95, we present the mean, standard deviation, and median
identification ages for each cause of suspicion. Findings from the analysis
of variance are reported also, as well as the Eta2 value. For 17% (E = 235)
of the children either no identification age was reported or the cause of
suspicion was not reported or was reported as unknown.
The median identification ages ranged from 3 months, for children whose
hearing loss was suspected because of rubella/CMV, to 25 months, for those
su pected because of behavior problems/attention-deficit disorder (ADD). The
difference among the mean identification ages was statistically significant,
with the means ranging from 8.2 months, for children with rubella/CMV as a
cause of suspicion, to 28 months, for children with ADD/behavior problems.
The Amas ranged from small to large (.04 to 1.52) by Cohen's (1988) standards.

Table 95
Frequencies and Percentages of Children and Mean. Standard Deviation, and
Median Age of Identification for Each Cause of Suspicion
Cause of Suspicion
Age of ID
SD Mdh
Auditory or Language Delay 21.5 12.7 20 743
Heredity 10.6 10.6 7 72
Meningitis 18.5 10.7 17 71
Birth Complications/Defects 10.4 10.4 8.5 62
Otitis Media/Middle Ear 20.2 12.3 18 27
Medical/School Screening 23.6 17.6 18 17
ADD/Behavior Problem 28.0 15.0 25 13
Health Problems 16.0 14.0 14 11
Rubella/CMV 8.2 10.3 3 11
High-Risk Register Card 20.7 28.0 5 3
Total 1169
Note: Total children possible = 1,404. Eta2 = .10. Statistically significant
difference among the mean ages, F(9,1020) = 11.9, 2 < .05.
Post-hoc analyses indicated that children with rubella/CMV, hereeity, or birth
complications/defects as causes of suspicion obtained statistically
significantly lower mean identification ages than children with ADD/behavior
problems, medical/school screenings, or auditory/language delays.
Who Suspected and Cause -of- Suspicion Summary
A brief summary of the major findings regarding who first suspected a
hearing loss and what caused the suspicion is provided below:
1. The majority of the hearing losses (60%) were first suspected by
caregivers.
2. Earliest identification ages, program-start ages, and hearing-aid-
fit ages were associated with health/human services and medical
personnel.
3. The shortest time intervals between suspicion and identification
were associated with medical and health/human services personnel.

4. The median time interval from identification to program start was
shortest for other specialists--85% of whom were audiologists.
Identification Procedures
The primary goals of the identification-procedure portion of this
investigation were to determine (a) how the children were identified as
hearing impaired and (b) the relationships between the identification
procedures and the age and time-interval variables. Again, the findings for
these questions were obtained from the identification-procedure questionnaire
(Appendix E). Site personnel were asked the following three questions for
each child: (a) Was the child born in a hospital in which a high-risk
register is completed for each child? (b) Did this child spend time in an NICU
(Neonatal Intensive Care Unit] after birth? and (c) Did a formal, infant
hearing-screening program provide the first indication that the child possibly
had a hearing impairment?" If the answer was yes to the third question, site
personnel were instructed to circle one of the following options: Crib-0-
Gram, Otoacoustic Emission Screening, Middle-ear (Immittance/Impedance)
Screening, Behavioral Audiometry Screening, ABR Screening, or Other. If the
answer was no to the third question, site personnel were asked to specify who
referred the child for audiological testing and what caused the individual to
suspect that the child had a hearing impairment.
High-Risk Register
For 23% (N = 319) of the children, site personnel responded yes to the
first question. Of those 319 children, site personnel indicated that for 76%
of them (N = 243), identification of hearing loss occurred because some
individual (namely caregiver, medical personnel, health/human services
personnel, educator, and other specialist) suspected a hearing loss. Also,
for 58% of these 319 children (N =184), the cause of suspicion of hearing loss
was language delay or lack of auditory responsiveness. For only 3 of the
children was a high-risk notification listed as the cause of suspicion of
hearing loss.
With 319 children born in hospitals with high-risk-register systems in
place and with a finding that only three children were identified through the
high-risk notification system, we conjectured that documentation was not
included in the site files for the children whose parents received a high-risk
notice. To examine this issue more closely, we looked at the aae of
identification for Utah, which has had a well-established statewide high-risk-
register system in place since 1978, as compared to SKI*HI overall. In the
Utah system, the parents complete a high-risk questionnaire at the same time
that they complete the birth certificate application for their child. If the
parents respond affirmatively to any of the high-risk factors, they are
notified by mail three to four months after their child's birth and given a
number to call if they are concerned about their child's hearing. Follow-up
is through the State Department of Health.
Figure 4 provides the median identification ages by four-month blocks for
Utah as compared to SKI*HI overall. A striking difference between the two
broken curves in seen before 12 months of age, with 18.5% of the children in
Utah being identified by 4 months of age as compared to 12.2% of the children
for SKI*HI overall. By 8 months of age. cumulatively, 29% of the children in
Utah had been identified as compared to 21.8% for SKI*HI overall. Although we
have no documentation that such a large percentage of the Utah children had
been identified early because of the high-risk-register-notification system,
the graph provides compelling support for that interpretation.
NICU
For 14% (N = 199) of the children, site personnel re.ponded yes to the
second question--that is, that the children had spent time in a neonatal
intensive care unit after birth. For 44% of those 199 children (n = 87), site
personnel indicated ABR testing had first indicated a hearing loss (M age of
identification = 12.3 months, sd = 11.2, median = 9 months). For 46% (n = 92)
of the children, hearing loss was identified because of some individual's
suspicion (M age of identification = 15.4 months, sd = 10.9, median = 13
months). Clearly, ABR testing decreased the median identification age by four
months.
154
I

14-
Med
ian
Iden
tific
atio
nA
ge 1
979-
1991
12-
10-
8 6 4 2 0
MI,
Uta
h
Mdn
N-6
5817
-- R
emai
nder
of U
S N
-419
017
1ft
......
..B
irth
4 8
12 1
6 20
24
28 3
2 36
40
44 4
852
56
60 6
4 68
72
Age
s in
Mon
ths
Fig
ure
4. M
edia
n ag
es o
f ide
ntifi
catio
n by
four
-mon
thag
e bl
ocks
for
Uta
h an
d S
KI*
HI o
vera
ll, 1
979-
1991
.

Relative Frequencies for Each Identification Procedures
A summary of the responses to the third question asked of the site
personnel is now provided. As expected, people (caregivers, medical
personnel, educators, health/human services personnel, and other specialists)
who suspected a hearing loss were the primary means by which the children were
initially identified as hearing impaired (78.8%, N = 1106, Table 96). For
10.8% (N = 152) of the children, an ABR screening was the initial means by
which the children were identified. Behavioral audiometry, middle
ear/immittance, and Crib-O-Gram were the initial screening procedures for the
remaining 3.1% (N = 44) of the children. For 7.3% (N = 102) of the children,
the response was "unknown" or there was no response to the question.
Table 96
Frequencies and Percentages of Children by Identification
Procedure, 1986-1989
ID Procedure
People 1106 78.8
ABR 152 10.8
Behavioral Audiometry 31 2.2
Middle Ear/Immittance 7 .5
Crib-O-Gram 6 .4
No Response/Unknown 102 7.3
Total 1404 100.0
Whether children were referred by the screening agency. of interest,
too, was whether the children were referred by the screening agency. The data
in Table 97 indicate that of the 196 children who were identified through a
formal infant hearing-screening program, 81% (N = 158) were referred to the
parent/infant program by the screening agency, leaving 19% (ff = 38) not
referred by the screening agency.
156
u

Type of referring agency-. The types of referring agencies :Ire also
provided in Table 97, along with their relative frequencies of occurrence.
Approximately 68% of the referrals to the parent/infant program came through
medical and audiology/speech pathology agencies.
Table 97
Frequencies and Percentages of Children Referred to Home-Programming by Formal
Infant Screening Program and Type of Referring Agency
Referred
Yes 158 81
No 38 19
Total 196 100
Type of Referring Agency
Medical 75 38.5
Aud/Speech Pathology 58 29.7
Educational 34 17.4
Health/Human Service 15 7.7
Patents 4 2.1
Not Reported 10 4.6
Total 196 100.0
Ages and Time Intervals
In Table 98, we present the means, standard deviations, and medians for
each of the age and time-interval variables by the identification procedures.
Findings from the analyses of variance are reported also, as well as the Eta2
values, which were all small, indicating little relationship between the age
and time-interval variables and the identification- procedur. categories. Care
should be taken in interpreting these findings because of the small sample
sizes for Crib-O-Gram and middle-ear/immittance procedures.
Identification age. The median identification ages ranged from 6 months,
for children identified by Crib-O-Gram, to 26 months, for children identified
157

Table 98
Means, Medians, Standard Deviations, and ANOVA Results for Acres and Time
Intervals by Identification Procedures, 1986-1989
ID Procedure Mean Mdn SD N F Eta2
Aqe of Identification (in Months)
Crib-O-Gram 8.3 [6] 9.1 6 13.8* .04
ABR 12.1 (10] 10.8 148
Suspected by 19.6 [18] 13.0 1067People
Behavior 20.7 [19] 13.0 30Audiometry
Immittance 29.1 [26] 9.3 7
Age at Program Start (in Months)
ABR 20.1 [17] 12.9 150 7.8* .02
Crib-O-Gram 24.0 (26] 5.4 6
Suspected by 26.3 [25] 13.5 1088People
Behavior 28.9 [27] 15.1 31Audiometry
Immittance 32.0 [31] 8.6 7
Aqe Hearing Aid Fit
Crib-O-Gram 16.3 [15] 6.6 6 6.3* .02
ABR 19.3 (17.5] 11.6 124
Suspected by 24.9 [24] 13.3 930People
Behavior 27.1 (241 13.1 26Audiometry
Immittance 30.8 (27] 10.6 5
158

l, 12'
0,0b
.) kr?) StCle. \.Co Association for Information and Image ManagementV7'1100 Wayne Avenue. Suite 1100Silver Spring. Maryland 20910
\b
tih
\ 301/587-8202
Centimeter1 2 3
Inches
o?.
11
II
1.0
1.25
N .0%5svo
0% o
10 11 12 13 14 15 mm
MANUFACTURED TO AIIM STANDARDS
BY APPLIED IMAGE, INC.
5

Table 98 (Continued)
ID Procedure Means Mdn SD N F Eta2
Time Interval (in Months) Between Suspicion and Identification
Immittance
ABR
Crib-O-Gram
BehaviorAudiometry
Suspected byPeople
1.1
3.6
4.2
5.2
5.6
[1]
Ill
[4.5]
(2]
(3]
1.1
6.6
3.9
6.2
7.7
7
142
6
29
1015
2.8* .01
Time Interval (in Months) Between Identification and Program Start
Immittance
Suspected byPeople
ABR
BehaviorAudiometry
Crib-O-Gram
2.9
6.4
7.9
9.0
15.7
[2]
[3]
[4]
(5]
[16]
2.0
8.6
9.6
11.9
9.3
7
1062
148
30
6
3.3* .01
Time Interval (in Months) Between Suspicion and Program Start
.01Immittance
ABR
Suspected byPeople
BehaviorAudiometry
Crib-O-Gram
4.0
11.4
12.0
14.3
19.8
[3]
[7.5]
[8]
[11]
[20]
2.4
10.9
10.8
13.0
6.6
7
142
1007
29
6
2.2
Note * = Statistically significant difference among the means, 2 < .05.Medians are in brackets.
159
1

by middle-ear/immittance procedures. The difference among the mean
identification ages was statistically significant, with the means ranging from
8.3 months to 29.1 months. The SMDs ranged from small to large (.09 to 1.6)
by Cohen's (1988) standards. Post-hoc analyses indicated that children
identified by ABR obtained a statistically significantly lower mean
identification age than children identified by behavioral audiometry or
middle-ear/immittance procedures.
Program-start ace. The median program-start ages ranged from 17 months,
for children identified by ABR, to 31 months, for children identified by
immittance. The difference among the mean program-start ages was
statistically significant, with the means ranging from 20.1 months to 32
months. The SMDs ranged from small to large (.17 to .88) by Cohen's (1988)
standards. Post-hoc analyses indicated that children identified by ABR
obtained a statistically significantly lower mean program-start age than
children identified by behavioral audiometry.
Hearing-aid-fit acre. The median hearing-aid-fit ages ranged from 15
months, for children identified by Crib-O-Gram, to 27 months, for children
identified by middle-ear/immittance procedures. The difference among the mean
hearing-aid-fit ages was statistically significant, with the means ranging
from 16.3 months to 30.8 months. The SMDs ranged from small to large (.17 to
1.1) by Cohen's (1988) standards. Post-hoc analyses indicated that children
identified by ABR obtained a statistically significantly lower mean hearing-
aid-fit age than children identified by behavioral audiometry.
Suspicion-to-identification time interval. The median suspicion-to-
identification time intervals ranged from one month, for children identified
by ABR and middle-ear/immittance procedures, to 4.5 months, for children
identified by Crib-O-Gram. The difference among the mean suspicion-to-
identification intervals was statistically significant, with the means ranging
from 1.1 months to 5.6 months. The SMDs ranged from small to medium (.05 to
.60) by Cohen's (1988) standards. Post-hoc analyses indicated that children
identified by ABR obtained statistically significantly smaller mean suspicion-
160
1
to-identification time intervals than children identified by people.
Identification-to-program-start time interval. The median
identification-to-program-start time intervals ranged from 2 months, for
children identified by middle-ear/immittance procedures, to 16 months, for
children identified by Crib-O-Gram. The difference among the mean
identification-to-program-start intervals was statistically significant, with
the means ranging from 2.9 months to 15.7 months. The SMDs ranged from small
to large (.17 to 1.4) by Cohen's (1988) standards. Although the overall F was
statistically significant, post-hoc analyses indicated that no two means were
statistically significantly different from one another.
Suspicion-to-program-start time interval. The median suspicion-to-
program-start time intervals ranged from 3 months, for children identified by
middle-ear/immittance procedures, to 20 months, for children identified by
Crib-O-Gram. The difference among the mean suspicion-to-program-start
intervals was not statistically significant, with the means ranging from 4
months to 19.8 months. The sMDs were small to large (ranging from .05 to 1.5)
by Cohen's (1988) standards.
Summary
A summary of the major findings for the identification procedures
follows:
1. The majority of the children were identified by people
(caregivers, medical and health/human services personnel,
educators, and other specialists) as compared to screening
procedures using behavioral audiometry, ABR, Crib-O-Gram,
or middle ear/immittance.
2. Although no direct documentation was obtained,
evidence indicates that for Utah children, the
may have accounted for the large percentage of
identified by four to eight months of age.
3. Sample sizes were extremely small for the Crib
behavi:Jr audiometry, and middle-ear/immittance
161
indirect
high-risk register
children who were
-0-Gram,

identification procedures. Consequently, no conclusive
evidence can be presented regarding which procedures
resulted in the youngest identification, program-start,
and hearing-aid-fit ages or the smallest suspicion-to-
identification, identification-to-program-start, and
suspicion--to-program-start time intervals.
Relationships Among the Ave and Time-Interval Variables
Correlation Coefficients
The correlation coefficients describing the magnitude and direction of
the relationships among the ages and time-intervals are presented in Table 99
for the identification-procedure study. Because the sample size was large,
all coefficients were statistically significant. Not surprisingly, large
positive coefficients were obtained describing the relationships between
identification age and program-start age (r = .77), between identification age
and hearing-aid-fit age (r = .84), and between program-start age and hearing-
aid-fit age (r = .84). Also not surprising, moderate, positive coefficients
were obtained describing the relationships between the suspicion-to-program-
start interval and the suspicion-to-identification interval (r - .58), between
the identification-to-program-start interval and the suspicionto-program-
start interval (r = .72), and between program-start age and suspicion-to-
program-start interval (r = .55).
Correlation coefficients were computed for SKI*HI children overall.
These data are presented in Table 100. In all cases, the coefficients were
similar to those presented for the identification-procedure study.
16 ?

Table 99
Correlation Coefficients for Identification-Procedure Study. 1986-1989
Age of Id Age Program StartAge Hearing Aid Fit Time Between Suspicion
and IDTune Between ID andProgram Start
Age Program Start
Age Hearing Aid Fit
Time Between Suspicion and ID
Time Between ID and Program Start
Time Between Suspicion and Program
.77*
.84"
.44*
-17*
.07'
.84'
.32*
.40*
.55*
.35*
.06*
.28*
-.14'
.58' .72*
Start
Note: 'Statistically significant, 2 < .01. Minimum pairwise N of cases: 904.
Table 100
Correlation Coefficients for SKI'HI Overall. 1979-1991
Age of Id Age Program StartAge Hearing Aid Fit Time Between Suspicion
and IDTime Between ID an
Placement
Age Program Start
Age Hearing Aid Fit
Time Between Suspicion and ID
Time Between ID and ProgramPlacement
Time Between Suspicion and ProgramPlacement
.77'
.87'
.44'
-.24'
.11*
.81*
.34*
.43'
.58*
.39*
.04'
.29*
-.11'
.58' .74*
Note: *Statistically significant, Q < .01. Minimum pairwise L1 of cases: 2713.
Predicting Pretest Language Quotients
The final question to be addressed in this chapter is which combination
of age and time-interval variab]es best predicts pretest expressive and
receptive language quotients. Please note that posttest quotients or scores
163
i,, 7

will be discussed in the following chapter. A quotient is a ratio of language
age to chronological age times 100. Quotients of 100 indicate that language
age and chronological age are equal; quotients of 50, for example, indicate
that language age is half of the chronological age. The findings should be
interpreted with caution because of the extremely small sample sizes for Crib-
0-Gram and middle-ear/immittance procedures.
Descriptive Statistics for Expressiveand Receptive Language Quotients
We present in Table 101 the mean, standard deviation, and median
expressive and receptive language quotients by identification-procedure. The
median expressive language quotients ranged from 24, for children identified
by middle-ear/immittance procedures, to 60, for children identified by Crib -0-
Gram. The median pretest receptive language quotients ranged from 29, for
children identified by middle-ear/immittance procedures, to 70, for children
identified by Crib-O-Gram. No statistically significant differences among the
mean pretest quotients were obtained for either the expressive or receptive
scales of the LDS, with the mean quotients ranging from 50 to 63.2 and from 48
to 67.3, respectively.
Multiple Regression
Correlation coefficients between each of the age and time-interval
variables and the pretest expressive- and receptive-language quotients were
computed. All coefficients were small and negative (r ranged from -.06 to -
.19). Given the small coefficients, the findings from the multiple-regression
analysis are not surprising. With all age and time-interval variables
included in the equations, the multiple Rs for predicting both the expressive
and receptive pretest quotients were low (R = .20 and .21, respectively).
Using a stepwise-regression procedure, only program-start-age was included in
both equations as an independent variable; the beta coefficients were -.20 and
-.21 for the expressive and receptive scales, respectively. With the small
zero -order re, the other age and time-interval variables were not included in
the final equations for predicting pretest expressive and receptive larezuag
quotients.
164

Table 101
Means. Medians, Standard Deviations, and ANOVA Results for Expressive and Rece tive
Pretest Developmental Quotients by Identification Procedure, 1986-1989
ID Procedure
Means
Medians
Standard
Deviation
N
Expressive Language Quotients
Behavioral Audiometry
53.6
52
20.5
24
1.65
People Suspected
56.5
53
27.7
838
Crib-O-Gram
56.7
60
28.0
5
Middle Ear
50.0
24
45.1
3
ABR
63.2
54
32.1
118
Receptive Language Quotients
Middle Ear
48.0
29
45.7
31.08
Behavioral Audiometry
60.0
64
18,4
24
People Suspected
61.4
57
29.9
838
Crib-O-Gram
67.3
70
34.2
5
ABR
66.9
59
31.3
118
Note:
No statistically significant differences among the means, g < .05.
Based on total children possible of 1,404.

Summary
The major findings for this section are:
1. Mean pretest expressive and receptive language quotients were low
for the identification procedures. Because sample sizes were small
for two of the procedures, findings must be interpreted with
caution.
2. No strong, or even moderate, coefficients were obtained
describing the relationships among the ages and time-
intervals and pretest receptive and expressive language
quotients.
3. Findings from the multiple-regression analysis indicated that only
progrem-start age predicted pretest expressive and receptive
language quotients, any then only to a small degree (R = .20 and
.21, respectively).
166
2u

Summary
Some findings from this chapter will be highlighted here:
1. Overall, the median identification age was 17 months, with a median
hearing-aid fit age of 22 months and a median program-start age of 25
months.
2. For children with additional handicapping conditions, the median
identification age was 12 months, with a median hearing-aid fit age
of 19 months and a median program-start age of 22 months.
3. For profoundly impaired children, the median identification age was
15 months, with a median hearing-aid-fit age of 19 months and a
median program-start age of 21 months.
4. For children whose cause of hearing loss was a known risk factor or
was visually apparent at birth, the median identification age ranged
from 9 to 16.5 months; the median hearing-aid-fit age ranged from 17
to 19 months; and the median program-start-age ranged from 18 to 24
months.
5. For children whose age at onset was at birth or from birth to one
year, the median identification age was 12 months, with a median
hearing-aid-fit age of 18 months and a median program-start age of 21
months.
6. For children from homes in which ASL and signed English were the
primary languages, the median identification ages were 8 and 13
months, respectively; the median hearing-aid-fit ages were 16 and
18.5 months, respectively; and the median program-start ages were 15
and 20.5 months, respectively.
7. For children with a hearing-impaired parent, the median
identification age was 12 months, with a median hearing-aid-fit age
of 19 months and a median program-start age of 21 months.
8. Overall, the median suspicion-to-identification time interval was 3
months, with a median identificktion-to-program-start interval of 4
months and a median suspicion-to-program-start interval of 9 months.
167

9. The median suspicion-to-identification time interval wan smallest (1
month) for children whose cause of hearing loss was meningitis or
defects at birth.
10. The median suspicion-to-identification time interval was also
smallest (1 month), as was the median identification-to-program-start
interval (2.5 months), for children whose age at onset was two years
or older. The median suspicion-to-program-start interval was
smallest (5 to 6 months) for children whose age at onset was one year
or older.
11. The median identification-to-program-start time interval was largest
(6 months) for children whose cause of loss was a syndrome.
12. The median identification-to-program-start time interval ;as also
largest (6 months), as was the median suspicion-to-program-start time
interval (13 months), for children from homes in which languages
other than English and Spanish were spoken.
13. The median suspicion-to-program-start interval was largest (13
months) for children whose cause of hearing loss was conditions
during pregnancy (e.g., prematurity) and birth trauma.
14. The majority of the hearing losses (60%) were first suspected by
caregivers.
15. Earliest identification ages, program-start ages, and hearing-aid-fit
ages were associated with health/human-services and medical
personnel.
16. The shortest time intervals between suspicion and identification were
associated with medical and health/human-services personnel.
17. The median time interval from identification to program start was
shortest for other specialists--85% of whom were audiologists.
18. The majority of the children were identified by people
(caregivers, medical and health/human-services personnel,
educators, and other specialists) rather than by screening
prOCedures using behavioral audiometry, ABR, Crib-O-Gram, or
168

middle ear/immittance.
19. Although no direct documentation was obtained, indirect evidence
indicates that for Utah children, the high-risk register may have
accounted for the large percentage of children who were identified by
four to eight months of age.
20. Sample sizes were extremely small for the Crib-O-Gram, behavior
audiometry, and middle-ear/immittance identification procedures.
Consequently, no conclusive evidence can be presented regarding which
procedures resulted in the youngest identification, program-start,
and hearing-aid-fit ages or the smallest suspicion-to-identification,
identification-to-program-start, and suspicion-to-program-start time
intervals.
21. Using multiple-regression analyses, with all age and time-interval
variables included in the procedure, only program-start age served as
a predictor of pretest expressive and receptive language quotients.
The multiple Rs were low.
The primary purpose of this chapter was to study the effectiveness of
screening procedures for identifying hearing loss in neonates, infants, and
young children. To set the context for the identification-procedure results,
data describing each of the age and time-interval variables were presented,
overall and by program year. In addition, data were presented describing
relationships between each of the age and time-interval variables and the
demographic variables that had been discussed in Chapter 5. In addition to
descriptive and inferential statistics, correlation ratios, and effect sizes
were presented to describe the magnitude of the relationships studied.
Following these data, we presented the findings from the identification-
procedure questionnaire, including data for the following: (a) who first
suspected ne hearing loss, (b) the cause of suspicion of a hearing loss, and
(c) the identification procedures used. Finally, we described the
relationships among all age and time-interval variables. One measure of the
effectiveness of the SKI*HI model is whether children are identified early and
169
r ,
4 1)(i-
the intervalbetween identification and program start is brief. We have
presented those findings and the conclusions are positive. Other measures of
program effectiveness will be the topic of the chapter that follows.
170
4:(

CHAPTER 7
PROGRAM EFFECTIVENESS: THE RESULTS
The third major purpose of this investigation was to study the
effectiveness of SKI*HI home-based programming, particularly the impact of
treatment amount, treatment density, and program-start age on child language
gains and developmental rates. Again, to set the context for studying program
effectiveness, we present first in this chapter the descriptive statistics for
each of the mediator variables, which include: treatment amount, planned and
actual treatment density, communication methodology, communication-methodology
age, program-start-to-communication-methodology interval, and other non-
parent/infant-program services (see Figure 2). We also present data
describing the relationships between the treatment variables (treatment amount
and density and communication methodology) and specific demographic variables
for which theoretically there could be an association (presence/absence of
additional handicaps, severity of hearing loss, age at onset of loss, and
presence/absence of hearing-impaired parent).
Following the descriptive information, we will present the program-
effectiveness data, beginning with child data and using the SKI*HI Language
Development Scale (LDS) receptive- and expressive-language scores. These data
will include (a) mean pre-, post-, and predicted test scores, effect sizes,
and PCIs for SKI*HI overall; (b) the ANOVA analyses of PCIs for each of the
demographic and treatment variables; (c) value-added analysis (using
regression analysis to calculate the amount of gain associated with effects
other than maturation--the value added); and (d) the multiple-regression
analysis, using treatment variables to predict posttest language developmental
rate.
Next, we will present descriptive statistics for the child- and parent-
outcome variables that were specifically related to the SKI*HI program goals
(level of hearing-aid use, threshold improvement from amplification, auditory,
communication-language, and vocabulary increases, and parent-skill
acquisition). Finally, we will present the follow-up data that were collected
171

for children who had been in the program from 1986-89 regarding program
placement after SKI*HI and current program placement.
Mediator Variables
Treatment Amount
Treatment amount was calculated by subtracting the date of each child's
last posttest from his/her program-start date and converting the difference
into months. The mean and median treatment amounts for SKI*HI overall are
provided in Table 102. The amounts ranged from 1 month to 78 months, with a
mean of 14.8 months and median of 13 months. For 38% of the children (N =
1,947), the posttest date and/or program-start date were not reported, so
treatment amount could not be calculated.
Table 102
Means, Standard Deviations, Medians, and Fancies for Treatment
Amount, Treatment Density, and Gain Time (in Months)
Variable
Overall
SD Mdn Range
Amount 14.8 9.9 13 1-78 3231
Density 2.6 1.4 2.5 .1-15 1229
Gain Time 12.3 8.7 9 1-60 3259
Note: N = Sample Size.Treatment Amount = time between program start and posttest, 1979-1991.Density = actual number of visits per month, 1987-1991.Gain Time = time between pretest and posttest (number of months of
language gain), 1979-1991.
The same information can be viewed somewhat differently by inspecting the
frequencies and percentages of children stratified by treatment amount in six-
month age blocks (Table 103). Fifty-five percent of the children received
treatment for 12 months or more. The relationships between treatment amount
and five of the demographic variables were of interest. These data follow in
this section.
172
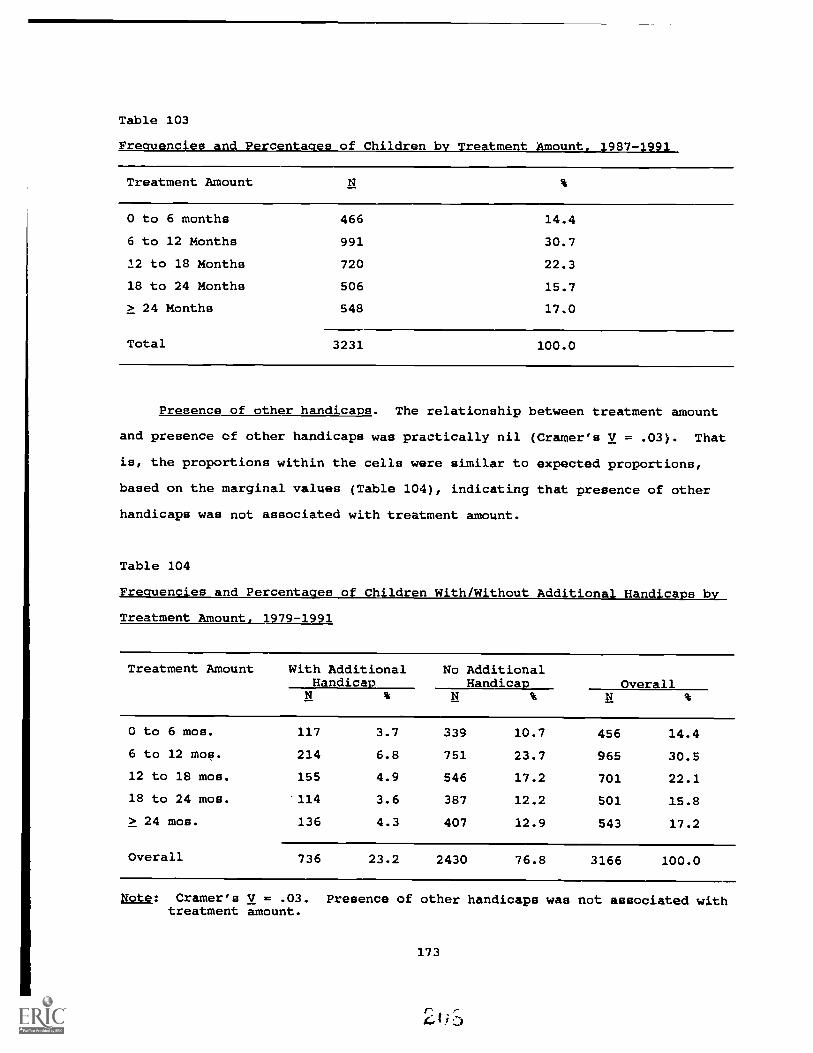
Table 103
Freauencies and Percentaaes of Children by Treatment Amount.
Treatment Amount
0 to 6 months 466 14.4
6 to 12 Months 991 30.7
12 to 18 Months 720 22.3
18 to 24 Months 506 15.7
> 24 Months 548 17.0
Total 3231 100.0
Presence of other handicaps. The relationship between treatment amount
and presence of other handicaps was practically nil (Cramer's V = .03). That
is, the proportions within the cells were similar to expected proportions,
based on the marginal values (Table 104), indicating that presence of other
handicaps was not associated with treatment amount.
Table 104
Frequencies and Percentages of Children With/Without Additional Handicaps by
Treatment Amount, 1979-1991
Treatment Amount With AdditionalHandicap
No AdditionalHandicap Overall
0 to 6 mos. 117 3.7 339 10.7 456 14.4
6 to 12 mos. 214 6.8 751 23.7 965 30.5
12 to 18 mos. 155 4.9 546 17.2 701 22.1
18 to 24 mos. 114 3.6 387 12.2 501 15.8
> 24 mos. 136 4.3 407 12.9 543 17.2
Overall 736 23.2 2430 76.8 3166 100.0
Note: Cramer's V = .03. Presence of other handicaps was not associated withtreatment amount.
173

Severity of hearing loss. A low Cramer's V (.08) was obtained for the
relationship between treatment amount and severity of hearing loss (Table
105). Only small differences separated obtained and expected percentages
based on the marginal values, indicating that severity of hearing loss was not
associated with amount of treatment.
Age at onset. Again, a low Cramer's V (.08) was obtained for the
relationship between treatment amount and age at onset, with only small
differences between obtained and expected percentages based on the marginal
values (Table 106). Therefore, age at onset was not associated with amount of
treatment.
Language spoken in the home. The relationship between treatment amount
and language spoken in the home was also low (Cramer's V = .06), with the
obtained percentages similar to those expected based on the marginal values
(Table 107). Therefore, language spoken in the home was not associated with
amount of treatment.
Parental hearing loss. Finally, the relationship between treatment
amount and presence /absence of a parent with a hearing loss was low (Cramer's
V = .07), with the obtained percentages similar to those expected based on the
marginal values (Table 108). The conclusion was that the presence of parental
hearing loss was not associated with amount of treatment.
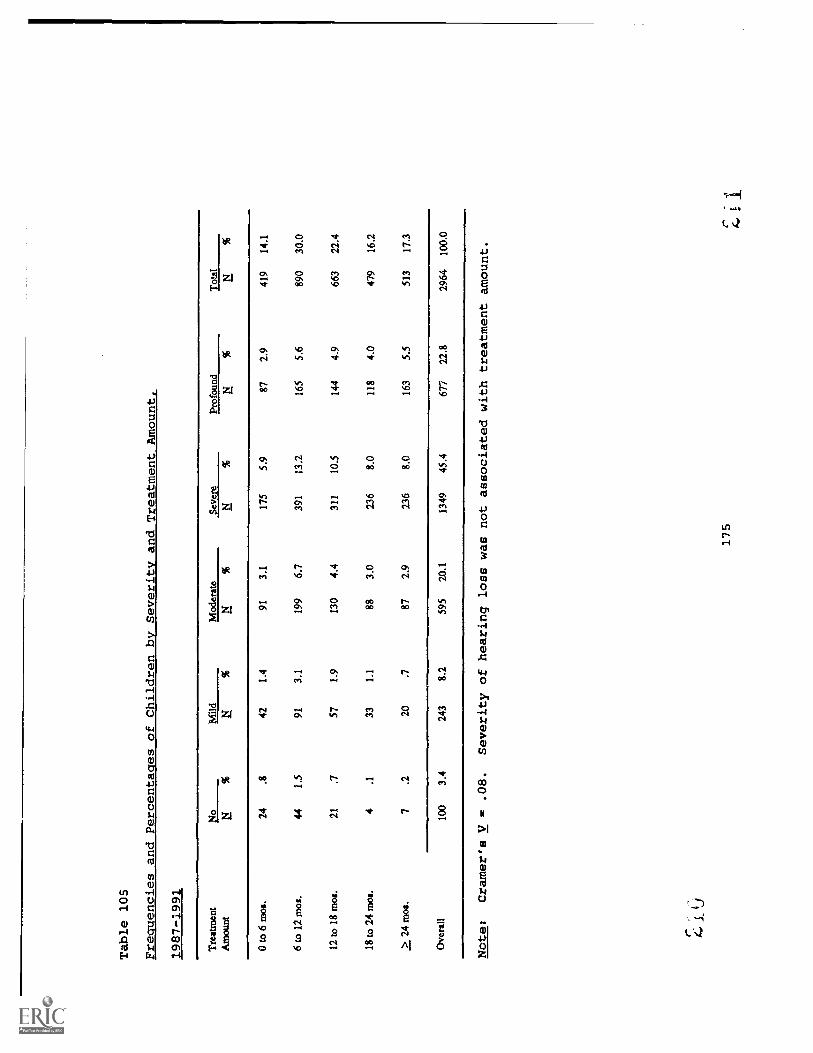
Table 105
Frequencies and Percentages of Children by Severity and Treatment Amount,
1987-198;
Tre
atm
ent
Am
ount
Mild
Mod
erat
eSe
vere
Prof
ound
Tot
alN
%N
%N
%N
%
0 to
6 m
os.
24.8
421.
491
3.1
175
5.9
872.
941
914
.1
6 to
12
mos
.44
1.5
913.
119
96.
739
113
.216
55.
689
030
.0
12 to
18
mos
.21
.757
1.9
130
4.4
311
10.5
144
4.9
663
22.4
18 to
24
mos
.4
.133
1.1
883.
023
68.
011
84.
047
916
.2
> 2
4 m
os.
7.2
20.7
872.
923
68.
016
35.
551
317
.3
Ove
rall
100
3.4
243
8.2
595
20.1
1349
45.4
677
22.8
2964
100.
0
Note:
Cramer's V = .08.
Severity of hearing loss was not associated with treatment amount.
175
4.
1-
r-
-

Table 106
Frequencies and Percentages of Children by Treatment Amount and Acre at Onset,
1979-1991
Treatment
Bir
th to
1 Y
ear
1 to
2 Y
ears
to 3
Yea
rs3
Yea
rs o
r G
reat
erT
otal
Am
ount
N%
N%
0 to
6 m
os.
125
9.0
372.
712
.95
.42
.118
113
.0
6 to
12
mos
.27
619
.850
3.6
533.
814
1.0
1.1
394
28.2
12 to
18
mos
.20
814
.939
2.8
322.
39
.62
.129
020
.8
18 to
24
mos
.17
312
.450
3.6
292.
16
.40
.025
818
.5
> 2
4 m
os.
217
15.6
342.
417
1.2
2.1
2.1
272
19.5
Ove
rall
999
71.6
210
15.1
143
10.3
362.
67
.513
9510
0.0
Note:
Cramer's V = .08.
Age at onset was not associated with treatment amount.
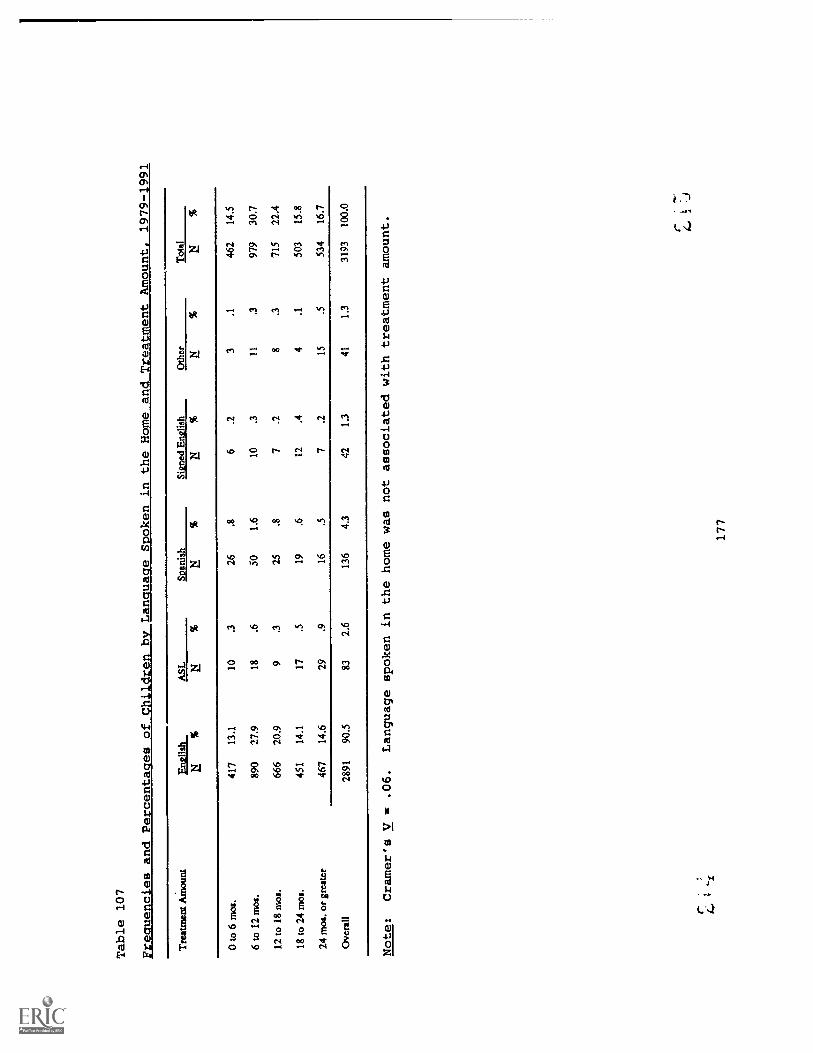
Table 107
FmIceldPecemt4gssofCtILLrenta_ree:Languacre Spoken in the Home
and Treatment Mount, 1979-1991
Treatment
Am
ount
Eng
lish
ASL
Span
ish
Sinn
ed E
nglis
hO
ther
Tot
al
NN
%N
%
0 to
6 m
os.
417
13.1
10.3
266
.23
.146
214
.5
6 to
12
mos
.89
027
.918
.650
1.6
10.3
11.3
979
30.7
12 to
18
mos
.66
620
.99
.325
.87
.28
.371
522
.4
18 to
24
mos
.45
114
.117
.519
.612
.44
.150
315
.8
24 m
os. o
r greater
467
14.6
29.9
16.5
7.2
15.5
534
16.7
Ove
rall
2891
90.5
832.
613
64.
342
1.3
411.
331
9310
0.0
Note:
Cramer's V = .06.
Language spoken in the home was not associated
with treatment amount.
r;
`s
177
r:

Table 108
Frequencies and Percentages of Children with a Hearing-Impaired Parent by
Treatment Amounts 1979-1991
Treatment Amount HI Parent No HI Parent OverallN
0 to 6 mos. 39 1.2 419 13.2 458 14.4
6 to 12 mos. 78 2.4 901 28.3 979 30.7
12 to 18 mos. 48 1.5 661 20.7 709 22.3
18 to 24 mos. 40 1.3 463 14.5 503 15.8
24 mos. or greater 69 2.2 468 14.7 537 16.9
Overall 274 8.6 2912 91.4 3186 100.0
Note: Cramer's V = .07. Presence/absence of parental hearing loss was notassociated with treatment amount.
Treatment Density
The number of home visits per week (i.e., treatment density) can be
viewed from two perspectives: (a) scheduled (or planned) treatment density
and (b) actual treatment density. On the SKI*HI Data Sheet, parent advisors
indicate the scheduled frequency of home visits by placing a check mark in the
appropriate blank (see Appendix A). Frequencies and percentages of children
by scheduled frequency of home visits are provided in Table 109. For 4% of
the children (N = 194), scheduled frequency of home visits was not reported.
Clearly, once-a-week visits were the preferred plan. Parent advisors reported
a change in the scheduled frequency for 7.5% of these children, with the
change generally in the direction of less frequent home visits.
Because both parents and parent advisors must cancel visits at times
because of illness, holidays, and vacations, it was expected that actual
frequency of home visits would be slightly less than the scheduled frequency.
Beginning with the 1987 data, the actual number of visits recorded was encoded
into the data bank. However, not all parent advisors recorded this
information at the bottom of the Data Sheet (see Appendix A).
178
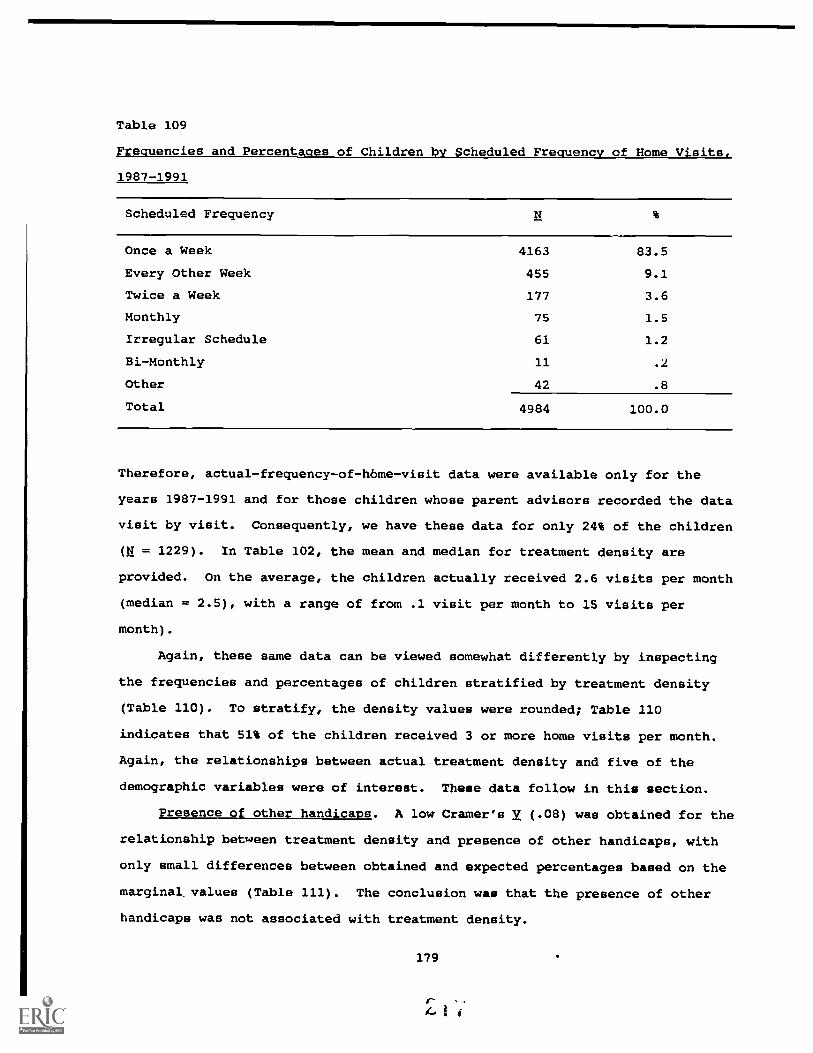
Table 109
Frequencies and Percentages of Children by Scheduled Frequency of Home Visits,
1987-1991
Scheduled Frequency
Once a Week 4163 83.5
Every Other Week 455 9.1
Twice a Week 177 3.6
Monthly 75 1.5
Irregular Schedule 61 1.2
Bi-Monthly 11 .2
other 42 .8
Total 4984 100.0
Therefore, actual-frequency-of-home-visit data were available only for the
years 1987-1991 and for those children whose parent advisors recorded the data
visit by visit. Consequently, we have these data for only 24% of the children
(N = 1229). In Table 102, the mean and median for treatment density are
provided. On the average, the children actually received 2.6 visits per month
(median = 2.5), with a range of from .1 visit per month to 15 visits per
month).
Again, these same data can be viewed somewhat differently by inspecting
the frequencies and percentages of children stratified by treatment density
(Table 110). To stratify, the density values were rounded; Table 110
indicates that 51% of the children received 3 or more home visits per month.
Again, the relationships between actual treatment density and five of the
demographic variables were of interest. These data follow in this section.
Presence of other handicaps. A low Cramer's V (.08) was obtained for the
relationship between treatment density and presence of other handicaps, with
only small differences between obtained and expected percentages based on the
marginal. values (Table 111). The conclusion was that the presence of other
handicaps was not associated with treatment density.
179

Table 110
Frequencies and Percentages of Children by Actual Treatment Density. 1987-1991
Treatment Density
1 Time per Month 275 22.4
2 Times per Month 326 26.5
3 Times per Month 366 29.8
4 Times per Month 207 16.8
> 4 Times per Month 55 4.5
Total 1229 100.0
Note: M visits per month = 2.6.
Table 111
Frequencies and Percentages of Children by Presence of Another
Handicap and Treatment Density. 1987-1991
Dmaity Other Handicap No Other Handicap otalN % N %
< .5yJmo 3 .2 32 2.6 35 2.9
lx/mo 54 4.4 185 15.1 239 19.5
2x/mo 89 7.3 237 19.3 326 26.6
3x/mo 84 6.8 281 22.9 365 29.7
4x/mo 42 3.4 165 13.4 237 16.9
5x/mo or greater 13 1.1 42 3.4 55 4.5
Overall 285 23.2 942 76.8 1227 100.0
Note: Cramer's V = .08. Presence of other handicaps was not associated withtreatment density.
180

Severity of hearing loss. A low Cramer's V (.10 ) was obtained for the
relationship between treatment density and severity of hearing loss (Table
112). Only small differences separated obtained and expected percentages
based on the marginal values, indicating that severity of hearing loss was not
associated with treatment density.
Age at onset. Again, a low Cramer's V (.08) was obtained for the
relationship between treatment density and age at onset, with only small
differences separating obtained and expected percentages based on the marginal
values (Table 113). The finding was that age at onset was not associated with
treatment density.
Language spoken in the home. The relationship between treatment density
and language spoken in the home was also low (Cramer's V = .08), with the
obtained percentages similar to those expected based on the marginal values
(Table 114). Language spoken in the home was not associated with treatment
density.
Parental hearing loss. Finally, the relationship between treatment
density and presence/absence of a parent with a hearing loss was low (Cramer's
V = .07), with the obtained percentages similar to those expected based on the
marginal values (Table 115). Presence of parental hearing loss was not
associated with treatment density.
181

Table 112
Frequencies andPercentages of Childrenby Severity andTreatment Density,
1987-1991
Den
sity
No
Mild
Mod
erat
eS
ever
eP
rofo
und
Tot
alN
%E
%N
%E
%N
%!
%<
.5x/
tno
0.0
5.4
5.4
151.
38
.733
2.8
ix/m
o8
.720
1.7
272.
310
69.
068
5.8
229
19.5
2xlm
o17
1.4
302.
669
5.9
120
10.2
816.
931
727
.03x
/mo
161.
419
1.6
706.
015
513
.290
7.7
350
29.8
4x/m
o21
1.8
221.
940
3.4
827.
028
2.4
193
16.4
5x/m
o or
gre
ater
4.3
6.5
11.9
211.
811
.953
4.5
Ove
rall
665.
610
28.
722
218
.949
942
.528
624
.311
7510
0.0
Note:
Cramer's V = .10.
Severity of hearing
loss was not associatedwith treatment
density.

Table 113
Frequencies and Percentages of Children by Treatment Density and Aqe at Onset, 1987-1991
Treatment Density
At Birth
Birth to 1 Year
1 to 2 Years
2 to 3 Years
3 Years or Greater
Total
E%
NE
N
< .5x/rno
14
2.7
1.2
2.4
0.0
0.0
17
3.2
I x/mo
85
16.1
21
4.0
61.1
2.4
1.2
115
21.8
2x/mo
108
20.5
25
4.7
10
1.9
61.1
1.2
150
28.5
3x/mo
108
20.5
17
3.2
15
2.8
5.9
3.6
148
28.1
4x/mo
53
10.1
81.5
61.1
2.4
0.0
69
13.1
5x/mo or greater
19
3.6
5.9
4.8
0.0
0.0
28
5.3
Overall
387
73.4
77
14.6
43
8.2
15
2.8
5.9
527
100.0
Note:
Cramer's V = .08.
Age at onset was not associated with treatment density.
4 f:
183

Table 114
Frequencies and Percentages of Children by Treatment Density and Language Spoken in the Home, 1987-1991
Tre
atm
ent D
ensi
tynQ
lish
Span
ish
ASL
Sign
ed-E
nglis
hO
ther
Tot
al!
%N
%N
%N
%
< .5
x/m
o28
2.3
2.2
2.2
0.0
2.2
342.
8
lx/m
o20
517
.08
.710
.85
.45
.423
319
.3
2x/m
o27
122
.430
2.5
9.7
6.5
2.2
318
26.3
3x/m
o32
627
.020
1.7
9.7
5.4
2.2
362
30.0
4x/m
o19
115
.87
.63
.23
.22
.220
617
.1
5x/m
o or
gre
ater
514.
22
.21
.10
.01
.155
4.6
Ove
rall
ion
88.7
695.
734
2.8
191.
614
1.2
1208
100.
0
Note:
Cramer's V = .08.
Language spoken in the home was not associated with treatment density.
184
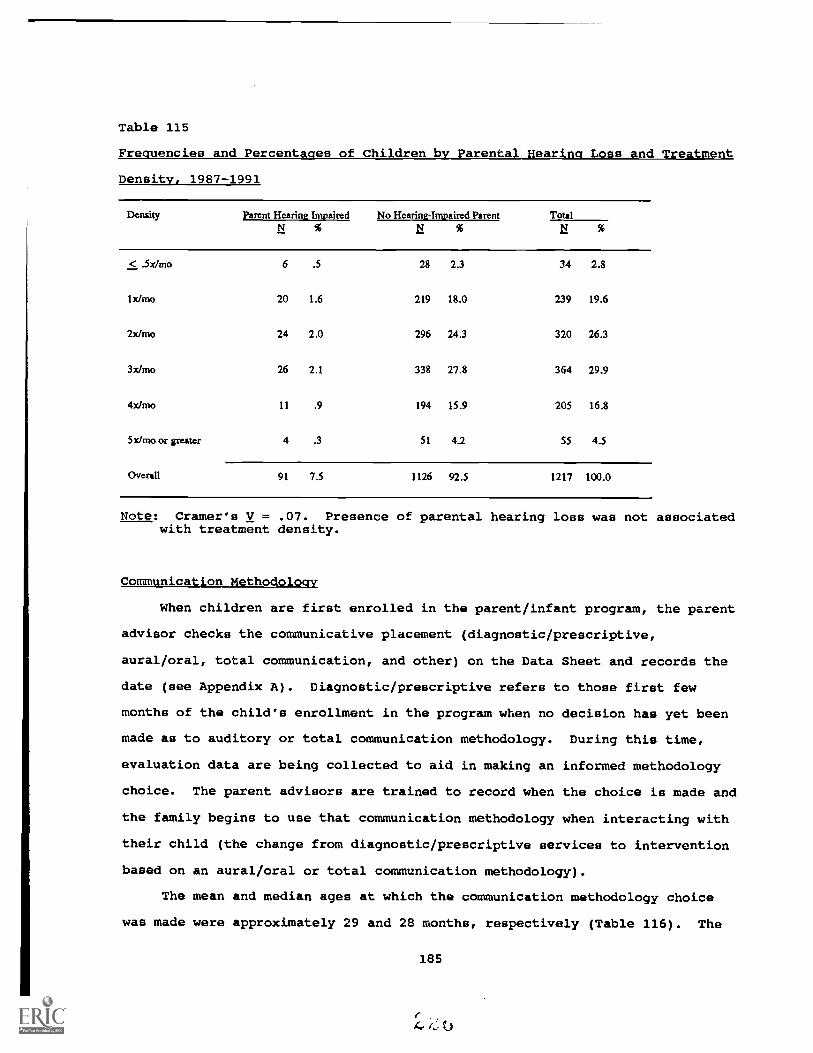
Table 115
Frequencies and Percentages of Children by Parental Hearing Loss and Treatment
Density, 1987-1991
Density Parent Hearing Impaired No Hearing-Impaired Parent TotalN % N %
< .5x/rrio 6 .5 28 2.3 34 2.8
Ix/mo 20 1.6 219 18.0 239 19.6
2x/mo 24 2.0 296 24.3 320 26.3
3x/mo 26 2.1 338 27.8 364 29.9
4x/mo 11 .9 194 15.9 205 16.8
5x/mo or greater 4 .3 51 4.2 55 4.5
Overall 91 7.5 1126 92.5 1217 100.0
Note: Cramer's V = .07. Presence of parental hearing loss was not associatedwith treatment density.
Communication Methodology
When children are first enrolled in the parent/infant program, the parent
advisor checks the communicative placement (diagnostic/prescriptive,
aural/oral, total communication, and other) on the Data Sheet and records the
date (see Appendix A). Diagnostic/prescriptive refers to those first few
months of the child's enrollment in the program when no decision has yet been
made as to auditory or total communication methodology. During this time,
evaluation data are being collected to aid in making an informed methodology
choice. The parent advisors are trained to record when the choice is made and
the family begins to use that communication methodology when interacting with
their child (the change from diagnostic/prescriptive services to intervention
based on an aural/oral or total communication methodology).
The mean and median ages at which the communication methodology choice
was made were approximately 29 and 28 months, respectively (Table 116). The
185
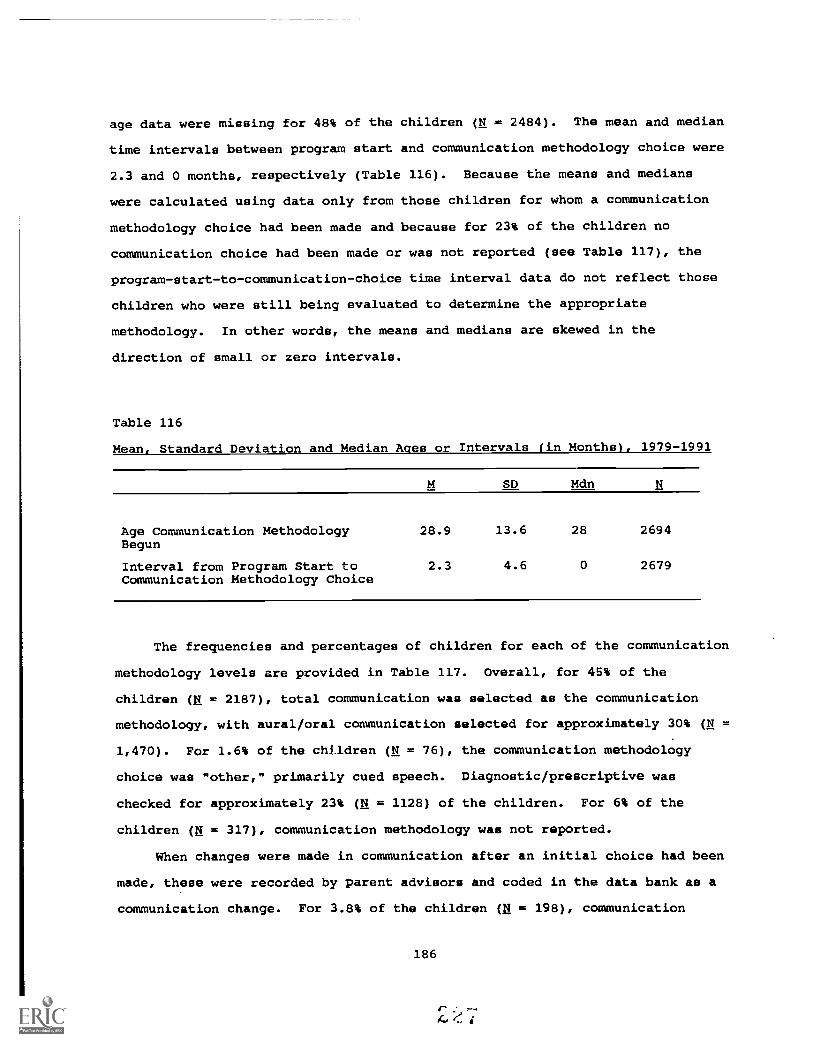
age data were missing for 48% of the children (N = 2484). The mean and median
time intervals between program start and communication methodology choice were
2.3 and 0 months, respectively (Table 116). Because the means and medians
were calculated using data only from those children for whom a communication
methodology choice had been made and because for 23% of the children no
communication choice had been made or was not reported (see Table 117), the
program-start-to-communication-choice time interval data do not reflect those
children who were still being evaluated to determine the appropriate
methodology. In other words, the means and medians are skewed in the
direction of small or zero intervals.
Table 116
Mean, Standard Deviation and Median Ages or Intervals (in Months), 1979-1991
SD Mdn
Age Communication Methodology 28.9 13.6 28 2694Begun
Interval from Program Start to 2.3 4.6 0 2679Communication Methodology Choice
The frequencies and percentages of children for each of the communication
methodology levels are provided in Table 117. Overall, for 45% of the
children (H = 2187), total communication was selected as the communication
methodology, with aural/oral communication selected for approximately 30% (N
1,470). For 1.6% of the children (N = 76), the communication methodology
choice was mother," primarily cued speech. Diagnostic/prescriptive was
checked for approximately 23% (N = 1128) of the children. For 6% of the
children (H = 317), communication methodology was not reported.
When changes were made in communication after an initial choice had been
made, these were recorded by parent advisors and coded in the data bank as a
communication change. For 3.8% of the children (li = 198), communication
186

Table 117
Frequencies and Percentaqes of Children by communication Methodology.
1979-1991
Method
Total Communication 2187 45.0
Aural/oral 1470 30.2
Diagnostic/Prescriptive 1128 23.2
Other 76 1.6
Total 4861 100.0
methodology changed during the time the child was enrolled in the program.
Inspection of these changes indicated that for the majority of the children
the change was from aural/oral to total communication.
Presence of other handicaps. The relationship between communication
methodology and presence of other handicaps was small (Cramer's V = .06).
That is, the proportions within the cells were similar to expected proportions
based on the marginal values (Table 118), indicating that the presence of
other handicaps was not associated with the communication-methodology choice.
Table 118
Frequencies and Percentages of Children with the Presence of Another Handicap
by Communication Methodology, 1979-1991
CommunicationMethodology
Other Handicap No Other Handicap Overall
Aural/oral 294 8.1 1133 31.1 1427 39.2
Total Communication 491 13.5 1645 45.2 2136 58.7
Other 28 .8 46 1.3 74 2.0
Overall 813 22.4 2824 77.6 3637 100.0
Note: Cramer's V = .06. Presence of other handicaps was not associated withthe communication-methodology choice.
187

Severity of hearing loss. A small Cramer's V (.31) was obtained for the
relationship between communication methodology and severity of hearing loss
(Table 119). Inspection of the cell values revealed an anticipated finding.
That is, the proportions of children with severe and profound hearing losses
were greater than expected based on the marginal values for total
communication. Further, the proportions of children with no, mild, and
moderate losses were greater than expected based on the marginal values for
aural/oral. The conclusion was then that severity of hearing loss was
associated with communication-methodology choice, but the relationship was
small.
Age at onset. The relationship between communication methodology and age
at onset was practically nil (Cramer's V = .03), indicating that the
proportions within the cells were similar to expected proportions based on the
marginal values (Table 120). The conclusion was that age at onset was not
associated with communication-methodology choice.
Language spoken in the home. The relationship between communication
methodology and language spoken in the home was low (Cramer's V = .12),
reflecting a small increase in the percentages of childrer from homes in which
ASL was the primary language who were using total communication (Table 121).
This finding was anticipated. There was, then, a slight association between
language spoken in the home and communication-methodology choice.
Parental hearing loss. Finally, the relationship between communication
methodology and presence/absence of a parent with a hearing loss was low
(Cramer's V = .05), with the obtained percentages similar to those expected
based on the marginal values (Table 122). The conclusion was that presence of
parental hearing loss was not associated with communication-methodology
choice.
188
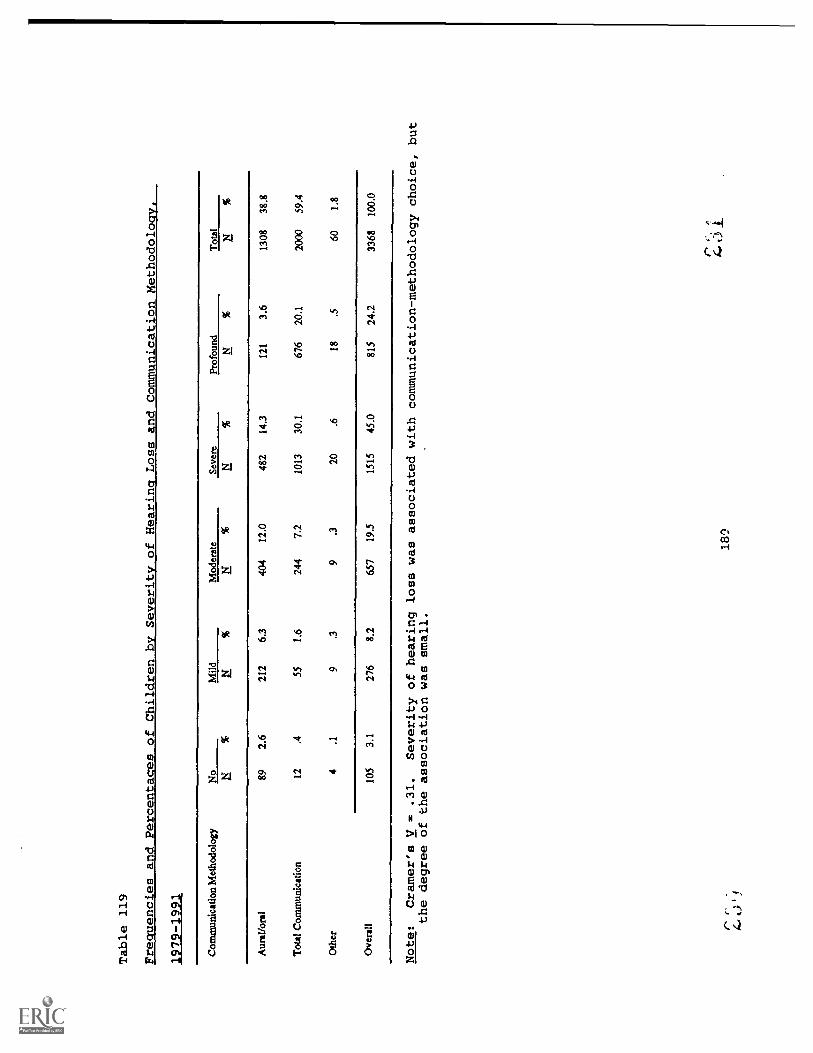
Table 119
Fre
enc es and Percenta es of Children b
Severit
of Hearin.
Loss and Communication Methodoloav,
1979-1991
Com
mun
icat
ion
Met
hodo
logy
No
Mild
Mod
erat
eSe
vere
Prof
ound
Tot
alN
%N
%N
%N
%
Aur
al/o
ral
Tot
al C
omm
unic
atio
n
Oth
er
89 12 4
2.6 .4 .1
212
55
9
6.3
1.6 .3
404
244 9
12.0
7.2 .3
482
1013 20
14.3
30.1 .6
121
676 18
3.6
20.1 .5
1308
2000 60
38.8
59.4
1.8
Ove
rall
105
3.1
276
8.2
657
19.5
1515
45.0
815
24.2
3368
100.
0
Note:
Cramer's V
.31.
Severity of hearing loss was associated with communication-methodology choice, but
the degree of the association was small.
18'.?
r, 4.0
1.

Table 120
Frequencies and
Percentages of
Children by Ace at
Onset andCommunication Methodoloom,
1979-1991
Com
mun
icat
ion
Met
hodo
logy
At B
irth
girt
h to
1 Y
ear
Ito
2 Y
ears
2 to
3 Y
ears
3 Y
ears
or
Old
erT
otal
N%
NN
%N
%N
%N
%
Aur
al/o
ral
432
27.1
915.
763
4.0
161.
07
.460
938
.2
Tot
al C
omm
unic
atio
n67
342
.214
79.
298
6.1
291.
88
.595
559
.9
Oth
er23
1.4
3.2
2.1
1.1
1.1
301.
9
Ove
rall
1128
701
241
15.1
163
10.2
462.
916
1.0
1594
100.
0
Note:
Cramer's V 3s .03.
Age at onset was
not associatedwith
communication-methodology
choice.
190
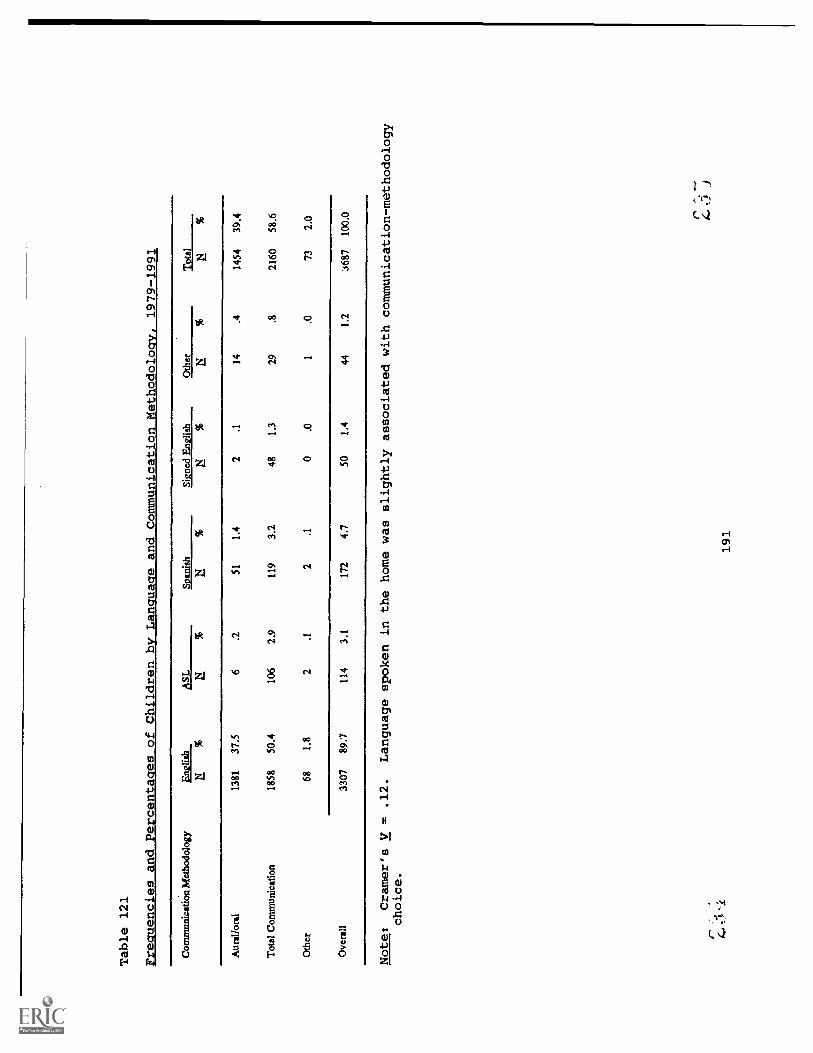
Table 121
Frequencies and _Percentages of Children by Language and Communication Methodology, 1979-1991
Com
mun
icat
ion
Met
hodo
logy
Eng
lish
ASL
Span
ish
Sign
ed E
nglis
hO
ther
12L
11__
_N
%N
%a
%N
%
Aur
al/o
ral
1381
37.5
6.2
511.
42
.114
.414
5439
.4
Tot
al C
omm
unic
atio
n18
5850
.410
62.
911
93.
248
1.3
29.8
2160
58.6
Oth
er68
1.8
2.1
2.1
0.0
1.0
732.
0
Ove
rall
3307
89.7
114
3.1
172
4.7
501.
444
1.2
'A87
100.
0
Note:
Cramer's V = .12.
Language spoken in the home was slightly associated with communication-methodology
choice.
191

Table 122
Frequencies and Percentages of Children with a Hearing-Impaired Parent by
Communication Methodology, 1979-1991
CommunicationMethodology
HI Parent No HI Parent Overall
Aural/Oral 112 3.0 1334 36.3 1446 39.3
Total Communication 237 6.5 1918 52.2 2155 58.7
Other 7 .2 66 1.8 73 2.0
Overall 356 9.7 3318 90.3 3674 100.0
Note: Cramer's V = .05. Presence of parental hearing loss was not associatedwith communication-methodology choice.
Summary of Relationships Between TreatmentVariables and Demographic Variables
1. Presence of other handicaps, severity of hearing loss, age at
onset, language spoken in the home, and presence of parental
hearing loss were not associated with treatment amount.
2. Presence of other handicaps, severity of hearing loss, age at
onset, language spoken in the home, and presence of parental
hearing loss were not associated with treatment density.
3. Presence of other handicaps, age at onset, and presence of parental
hearing loss were not associated with communication-methodology
choice. Severity of hearing loss was associated with
communication-methodology choice to a small degree; children with
severe and profound hearing losses tended to use total
communication and children with no, mild, and moderate losses
tended to use aural/oral communication. Language spoken in the
home was associated with communication-methodology choice to a
slight degree, reflecting the tendency to use total communication
for children from homes in which ASL was the primary language.
192

Additional Services
Parent advisors were requested to list and date the initiation of other
non-parent/infant program services (other than diagnostic) given to the child
and family while the child was in the parent/infant program (see Appendix A).
They were requested to list the services by category (educational, speech-and-
hearing therapy, mental health, health, social, services for mentally
retarded, and other). The frequencies and percentages of children who were
reported to have received other services are provided in Table 123. A large
percentage o' the children (46.3%) received educational services (e.g.,
preschool) in addition to the home-based programming.
For 51% of the children (N = 2653), no data were recorded in this section
of the data sheet. Because it was impossible to determine whether the missing
data reflected the absence of additional services or a lack of reporting such
services by the parent advisor, no additional analyses were conducted using
this variable.
Table 123
Frequencies and Percentages of Children by Other Services Received
Service
Education 1170 46.3
Other and Combinations 608 24.1
Speech and Hearing 278 11.0
Education and Speech 187 7.4
Health 121 4.8
Mental Health 88 3.5
Social Services 58 2.3
Mental Retardation 15 .6
Total 2525 100.0
193

Pre-. Post-, and Predicted Language Scores
As stated in the introduction to this report, the SKI*HI program was
designed to ameliorate the profound negative effects of a hearing loss on a
child's communication and language development. The language input a child
receives during the early years of life is crucial to his or her acquisition
of communicative/linguistic competence and later academic skills. If the
child suffers an early language deprivation, there are profound negative
effects on all areas of oral and written language development (semantics,
syntax, phonology, pragmatics, writing, and reading) as well as on
socialization and cognitive development. As indicated in the literature
review for this report, there are few research-based findings regarding the
effect of early home-based intervention on communication skills of children
with hearing impairments. McConnell (1974) provided a parent-oriented program
and audiological management for 94 severe-to-profoundly hearing-impaired
preschoolers in a demonstration home. McConnell reported an average gain in
language age of 20.8 months at the end of an average instructional interval of
27.8 months, indicating less than one month of gain for every month of
instruction. As the data will demonstrate in this section of the report,
SKI*HI children, on average, made one month of language gain for every month
of intervention.
The parent advisors were trained to administer the Lanauaae Development
Scale (LDS) (Tonelson & Watkins, 1979) to the childre at the time of entry
into the program (within the first three months of the child's enrollment in
the program) and twice yearly thereafter. The parent advisor recorded the LDS
receptive and expressive test scores and the dates whenever the test was given
on the SKI*HI Data Sheet (Appendix A). The scores were recorded as receptive
and expressive ages, which were the highest ages in months of the highest
interval achieved. For example, if the child's highest receptive-age interval
was 20-22 months, the receptive age was recorded as 22 months.
The mean pre-, post-, and predicted LDS teat scores are provided in Table
124. For both the expressive and receptive scales, the differences between
194

the pre- and posttests were statistically significant. The magnitude of the
difference in standard deviation units was large (SMDs = 1.1) by Cohen's
(1988) standards. That is, assuming normal distributions, the average score
at posttest was 1.1 standard deviations larger than the average score
at pretest. Another way of describing this difference is that on average at
the posttest, the expressive and receptive language scores were higher than
approximately 84% of the expressive and receptive language scores at pretest.
Table 124
Mean, Standard Deviation, and Median Pre-, Post-, and Predicted LDS Scores,
1979-1991
Overall
Expressive Receptive
M SD Mdn N M SD Mdn N
Pretest Score 14.6 10.8 12 3307 15.9 11.3 12 3311
Posttest Score 26.3 14.1 24 3307 28.5 14.4 28 3311
Gain 11.7 12 12.6 16
SMD 1.1 1.1
Predicted Posttest Score 21.5** 13.0 18.7 3243 23.3* 13.8 20.5 3246
Note: Average treatment time 12.3 months overall (median = 9 months).N = Sample Size.* = Differences between mean pre- and posttest scores were
statistically significant, 2 < .05.** = Differences between mean post- and predicted-test scores were
statistically significant, 2 < .05.SMD = Standardized mean difference (i.e., The difference between the
means in standard deviation units. For example, the averagescore at posttest for the SKI*HI expressive LDS scores was
approximately one standard deviation greater than the averagescore at the pretest.)
The average treatment time between the pre- and posttests was 12.3 months
(median = 9 months). For the expressive scale, both the mean and median gains
were approximately 12 months, indicating that, on average, the children made
approximately one month of gain for every month of treatment (median = 1.3
months of gain per month of treatment). For the receptive scale, the mean
gain was 12.6 months, again indicating one month of gain for every month of
195
5

treatment. However, the median receptive language gain was 16 months. With a
median gain time of 9 months, 50% of the children made 1.8 months of gain for
every month of treatment. For 36% of the children, one or both of the pre- or
posttest scores were not reported by the parent advisors.
Additionally, observed expressive and receptive posttest scores were
compared to predicted posttest scores. The predicted scores were calculated
on a child-by-child basis, using the child's pretest developmental rate
(language age divided by chronological age) and multiplying by the posttest
chronological age. The predicted means are provided in Table 124 as well.
Differences between the mean actual posttests and predicted posttests were
statistically significant, indicating that SKI*HI children consistently scored
higher at posttest than was predicted based on maturation alone. For 37% of
the children, predicted posttest scores could not be computed because parent
advisors failed to report either a pre- or posttest score, testing daxes, or
the children's age.
Proportional Chance Indices
The proportional change index (PCI) is a ratio of developmental rate
during intervention to developmental rate prior to intervention; it is
calculated on a child-by-child basis. Children whose rates of development
were slower during intervention than at pretest received PCIs of less than
1.0, and those whose rates of development accelerated during intervention
received pcis greater than 1.0 (Wolery, 1983). The mean and median PCIs for
SKI*HI overall are provided in Table 125. The mean expressive and receptive
PCIs were both large (2.7 and 2.6, respectively), indicating rates of
development during treatment more than twice the developmental rates at
pretest. However, when a distribution of scores is skewed, the median more
validly reflects average performance. Inspection of the medians reveals that
they were large as well (both 1.8), indicating rates of development during
treatment that were nearly twice the developmental rates at pretest. For 37%
of the children, PCIs could not be computed because parent advisors failed to
report essential information for their computation or because the children had
not yet been administered a posttest.
196

Table 125
Mean, Standard Deviation, and Median PCIs, 1979-1991
Overall
Expressive
M SD Mdn N
Receptive
M SD Mdn N
PCI 2.7 3.7 1.8 3238 2.6 3.2 1.8 3243
We present in the following subsections analyses of the PCIs by each of
the demographic and treatment variables. For each variable, we provide not
only means, medians, and standard deviations fa: both the expressive and
receptive scales of the LDS, but also analysis of variance results for
determining if there was a statistically significant difference between/among
the means and chi-square results for determining if there was a statistically
significant difference between/among the medians. Because the fCI values are
a function of treatment time (i.e., the PCIs are already adjusted for time in
treatment), analysis of covariance using treatment time as a covariate was
deemed inappropriate and was not used for these analyses.
Gender
For both the expressive and receptive LDS scales, no statistically
significant differences between the mean or median PCIs for males and females
were obtained (Table 126). For both scales, males and females obtained median
PCIs of 1.8. The mean PCIs for males and females differed only slightly.
197
4

Table 126
Means, Standard Deviations, Medians. and ANOVA and Chi-Sauare Results for
Expressive and Receptive PCIs by Gender
Statistic Male Female Difference F X
Expressive PCIs
M 2.7 2.7 .0 .13
SD 3.8 3.7
Mdn 1.8 1.8 .0 .0
N 1741 1453
Receptive PCIs
M 2.5 2.7 .2 .99
SD 3.3 3.2
Mdn 1.8 1.8 .0 .1
N 1740 1460
Note: No statistically significant difference between means or medians,2 < .05.
Ethnicity
For both scales, the differences among the median PCIs for the ethnic
group were not statistically significant (Table 127). Although a
statistically significant difference among the mean PCIs was obtained for the
expressive scale, the Eta2 was essentially zero (<.01), indicating no
relationship between ethnicity and expressive language PCIs. Post-hoc
analyses indicated that Asian Americans obtained a statistically significantly
higher mean score than the other ethnic groups. No statistically significant
difference among the receptive mean Egis was obtained.
198

Table 127
Means, Standard Deviations, Medians and ANOVA and Chi-Square Results for Expressive and Receptive PCIs by Ethnicity
CaucasianAfricanAmerican
Asian SpanishAmerican American
NativeAmerican Others F 2
Expressive PCIs
M 2.7 2.9 5.4 2.6 2.6 2.7 3.2
SD 3.6 3.7 10.9 3.5 2.8 3.3
Mdn 1.8 1.8 2.2 1.6 1.9 1.9 3.7
N 2351 462 29 285 46 35
Mean Differences
Caucasian .2 2.7 .1 .1 .0
African American 2.5 .3 .3 .2
Asian American 2.8 2.8 2.7
Spanish American .0 .1
Native American .1
Median Differences
Caucasian .0 .4 .2 .1 .1
African American .4 .2 .1 .1
Asian American .6 .3 .3
Spanish American .3 .3
Native American .0
Receptive PCIs
M 2.5 2.9 3.7 2.6 2.4 2.4 1.6
SD 3.2 3.7 3.6 3.2 1.8 2.0
Mdn 1.8 1.7 2.4 1.5 2.1 2.2 5.2
N 2356 462 29 286 45 35
Mean Differences
Caucasian .4 1.2 .1 .1 .1
African American .8 .3 .5 .5
Asian American 1.1 1.3 1.3
Spanish American .2 .2
Native American .0
Median Differences
Caucasian .1 .6 .3 .3 .4
African American .7 .2 .4 .5
Asian American .9 .3 .2
Spanish American .6 .7
Native American .1
Note: .. Statistically significant difference among the means, fa < .05.
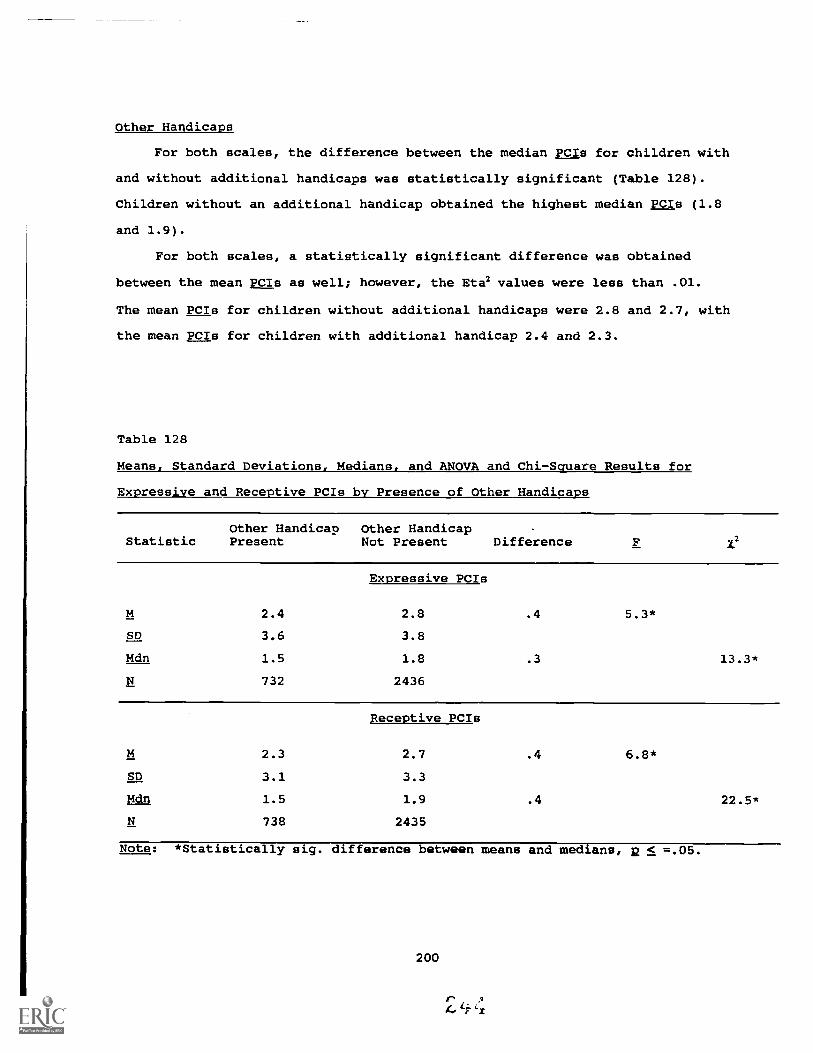
Other Handicaps
For both scales, the difference between the median PCIs for children with
and without additional handicaps was statistically significant (Table 128).
Children without an additional handicap obtained the highest median EgIs (1.8
and 1.9).
For both scales, a statistically significant difference was obtained
between the mean PCIs as well; however, the Eta2 values were less than .01.
The mean PCIs for children without additional handicaps were 2.8 and 2.7, with
the mean PCIs for children with additional handicap 2.4 and 2.3.
Table 128
Means, Standard Deviations, Medians, and ANOVA and Chi-Square Results for
Expressive and Receptive PCIs by Presence of Other Handicaps
Other Handicap Other HandicapStatistic Present Not Present Difference 1.2
Expressive PCIs
M 2.4 2.8 .4 5.3*
SD 3.6 3.8
Mdn 1.5 1.8 .3 13.3*
N 732 2436
Receptive PCIs
M 2.3 2.7 .4 6.8*
SD 3.1 3.3
Mdn 1.5 1.9 .4 22.5*
N 738 2435
Note: *Statistically sig. difference between means and medians, 2 < =.05.
200
I' A
6Li

Type of Hearing Loss
For the expressive scale, the difference among the median PP CIs for the
types of hearing loss was not statistically significant, with the medians
ranging from 1.6 to 1.8 (Table 129). For the receptive scale, the difference
among the medians was statistically significant. The medians ranged from 1.5
to 1.8. Inspection of the cells indicated that there were more children with
sensorineural hearing losses who obtained PCIs greater than the median than
expected.
For both language scales, the differences among the mean PCIs for
the types of hearing loss were not statistically significant, with Eta2 values
less than .01. For the expressive scale, the mean PCIs ranged from 2.5 to
2.7; for the receptive scale they ranged from 2.3 to 2.6.
201

Table 129
Means, Standard Deviations, Medians, and ANOVA and Chi-Square Results for
Expressive and Receptive PCIs by Type of Hearing Loss
Conductive Sensorineural Mixed F X?
Expressive PCIs
M 2.7 2.7 2.5 .3
SD 3.9 3.8 3.3
Mdn 1.6 1.8 1.7 1.5
N 188 2655 242
Conductive
Mean Differences
.0 .2
Sensorineural .2
Median Differences
Conductive .2 .1
Sensorineural .1
Receptive PCIs
M 2.2 2.6 2.3 2.6
SD 2.4 3.3 3.0
Mdn 1.5 1.8 1.6 6.1*
N 188 2657 243
Conductive
Mean Differences
.4 .1
Sensorineural .3
Median Differences
Conductive .3 .1
Sensorineural .2
Note: * ic Statistically significant difference among means or medians,2 < .05.
202
r .
4 6

Severity of Hearing Loss
For the expressive scale, the difference among the median PCI5 for the
hearing-loss severity levels was not statistically significant, with the
medians ranging from 1.6 to 2.1 (Table 130). For the receptive scale, the
difference among the medians was statistically significant. The medians
ranged from 1.6 to 1.9. Inspection of the cells indicated that more children
than expected with severe hearing losses obtained PCIs greater than the median
and more children than expected with profound hearing losses obtained PCIs
less than the median, based on the marginal values.
For the expressive scale, the difference among the mean PCIs for
the hearing-loss severity levels was not statistically significant. The means
ranged from 2.5 to 3.1. For the receptive scale, the difference among the
means was statistically significant; however, the Eta2 was essentially zero.
The means ranged from 2.3, for children with no loss, to 2.8, for children
with severe losses.
203

Table 130
Means, Standard Deviations, Medians and ANOVA and Chi - Square Results for
Expressive and Receptive PCIs by Level of Unaided Hearing Loss, 1979-1991
Normal Mild Moderate Severe Profound
Expressive PCIs
M 3.1 2.6 2.5 2.8 2.7 1.2
SD 6.2 3.4 2.9 3.8 3.6
Mdn 2.1 1.8 1.6 1.8 1.7 4.2
N 101 244 597 1346 678
Mean Differences
Normal .5 .6 .3 .4
Mild .1 .2 .1
Moderate .3 .2
Severe .1
Median Differences
Normal .3 .5 .3 .4
Mild .2 .0 .1
Moderate .2 .1
Severe .1
Receptive PCIs
M 2.3 2.4 2.4 2.8 2.4 3.1*
SD 2.1 3.2 2.4 3.9 2.6
Mdn 1.8 1.7 1.7 1.9 1.6 10.6*
N 101 246 599 1346 680
Mean Differences
Normal .1 .1 .5 .1
Mild .0 .4 .0
Moderate .4 .0Severe .4
Median Differences
Normal .1 .1 .1 .2
Mild .0 .2 .1
Moderate .2 .1
Severe .3
Note: Statistica y s gni cant erence among t e means or me ans.
204

Cause of Hearing Loss
For both scales, the differences among the medians were statistically
significant for the causes of hearing loss (Table 131). For both scales,
inspection of the cell frequencies revealed more children than expected with
PcIs greater than the median whose cause of loss was fever or infection and
more children than expected with PCIs less than the median whose cause of loss
was a syndrome. The medians ranged from 1.4, for children whose cause of loss
was a birth defect or a syndrome, to 2.5, for children whose cause of loss was
fever or infection. For the receptive scale, the medians ranged from 1.2, for
children whose cause of loss was a syndrome, to 2.9, for children whose cause
of loss was fever of infection.
For both scales, the differences among the mean PCIs for the causes of
hearing loss were statistically significant; however, the Eta2 values were low
(.02 for both scales). For the expressive scale, post-hoc analyses indicated
that the mean PCI for children whose cause of loss was fever or infection was
statistically significantly higher than the mean PCIs for children whose cause
of loss was a syndrome, heredity, rubella, defects at birth, meningitis, or
middle-ear problems. The mean PCIs ranged from 2.0 to 4.5. For the receptive
language scale, post-hoc analyses indicated that the mean PCI for children
whose cause of loss was fever or infection was statistically significantly
higher than the mean PCIs for children whose cause of loss was a syndrome,
heredity, rubella, defects at birth, meningitis, or middle-ear problems. The
mean PCIs ranged from 1.8 to 3.8.
205

fable 131
deans, Standard Deviations, Medians, and ANOVA and Chi-Square Results for Expressive and Receptive PCIs
Dv Cause of Hearing Loss, 1979-1991
Unk
now
nH
ered
ityR
ubel
laC
MV
Men
ingi
tisB
irth
Def
ect
Feve
rin C
hild
Rh
orK
erni
cter
us
Dru
gsD
urin
gPr
egna
ncy
Oth
erC
ondi
tions
Dur
ing
Preg
nanc
yM
iddl
eE
ar
Dru
gsto C
hild
Bir
thT
raum
aC
hild
Synd
rom
e:k
her
Ove
rall
F1'
2
Exp
ress
ive
PCIs
M2.9
2.3
2.3
2.6
2.3
4.5
2.0
2.9
2.7
2.8
2.6
2.7
2.2
2.7
2.4*
SD
3.7
2.9
2.2
4.2
3.6
7.6
1.4
2.7
3.0
3.1
3.4
4.5
2.7
4.2
Mdn
1.9
1.5
1.8
1.7
1.4
2.5
2.0
2.3
1.7
2.0
1.8
1.6
1.4
1.9
27.1
*
N15
8734
110
840
115
182
2019
110
136
3187
9174
3238
Rec
eptiv
e PC
Is
M2.
82.
22.
22.
52.
23.
82.
52.
22.
62.
52.
92.
71.
82.1
2.6*
SD3.
62.
52.
03.
32.
64.
31.
61.
52.
62.
82.
54.
21.
91.
7
Mdn
1.9
1.5
1.7
1.6
1.5
2.9
2.3
1.9
1.9
1.8
2.2
1.6
1.2
1.7
26.5
*
E15
8834
210
940
215
181
2019
109
136
3187
9474
3243
Note:
*= Statistically significant difference among means or medians, 2 < .05.
Analysis of variance and e conducted excluding unknown and other categories.
J
206

Age at Onset
For the expressive scale, no statistically significant difference among
the median PCIs for the age-at-onset levels was obtained (Table 132). The
medians ranged from 1.6 to 2.9. For the receptive scale, a statistically
significant difference among the median PCIs was obtained. Inspection of the
cell frequencies revealed more children than expected with PCIs greater than
the median whose age at onset was 1-to-2 years or greater and more children
than expected with PCIs less than the median whose age at onset was at birth.
The medians ranged from 1.6 to 3.2.
For both scales, a statistically significant difference among the mean
PCIs for the age-at-onset levels was obtained; however, the Eta2 values were
low (.01 for both scales). For the expressive scale, the means ranged from
2.4, for children whose onset was at birth, to 7.6, for children whose onset
was at three years or older. Post-hoc analyses indicated that the mean PCI
for children whose onset was at three years or older was statistically
significantly higher than that for all other groups of children. For the
receptive scale, post-hoc analyses revealed that no two means differed
significantly. The means ranged from 2.3, for children whose age at onset was
at birth, to 3.4, for children whose age at onset was two to three years.
Table 132 reveals a tendency for the medians to increase in magnitude as
age at onset increases. This finding is not surprising. If a hearing loss is
identified at birth and intervention is begun early, the developmental rate
prior to intervention is more likely to approximate one (i.e., if
developmental age equals chronological age, pretest developmental rate = 1)
than if the onset is later and the child is not identified immediately (e.g.,
if developmental age equals 18 months and chronological age equals 36 months,
pretest developmental rate = .5). Thus, the denominator in the equation for
calculating PCIs is larger if pretest developmental rate is equal to 1,
resulting in smaller PCIs.
207

Table 132
Means, Standard Deviations, Medians and ANOVA and Chi - Square Results for
Expressive and Receptive PCIs by Aae at Onset, 1979-1991
At BirthBirth to 1 to 21 Year Years
2 to 3Years
> 3Years F
M
SD
Mdn
2.4
3.4
1.6
996
Expressive PCIs
2.4
2.7
2.0
36
.0
.3
.5
.4
.3
.5
7.6
15.5
2.9
8
5.2
4.9
4.7
5.2
1.3
1.2
1.4
.9
4.2*2.7 2.9
3.6 4.9
1.7 1.5
210 143
Mean Differences
N
At Birth
Birth to 1 Year
1 to 2 Years
2 to 3 years
At Birth
Birth to 1 Year
1 to 2 Years
2 to 3 Years
.3 .5
.2
Median Differences
.1 .1
.2
M
SD
Mdn
2.3
2.6
1.6
1000
Receptive PCIs
3.4
4.0
2.2
36
1.1
.8
.6
.6
.6
.4
2.8
1.8
3.2
8
.5
.2
.0
.6
1.6
1.6
1.4
1.0
2.5*2.6 2.8
3.6 3.6
1.6 1.8
211 144
Mean Differences
N
At Birth
Birth to 1 Year
1 to 2 Years
2 to 3 Years
At Birth
Birth to 1 Year
1 to 2 Years
2 to 3 Years
.3 .5
.2
Median Differences
.0 .2
.2
Note: * = Statistically significant difference among means/medians, 2 < .05.
208
4

Lanauage Spoken in the Home
For the expressive language scale, the difference among the median PCIs
for the levels of language spoken was statistically significant (Table 133).
Inspection of cell frequencies revealed more children than expected with PCIs
less than the median whose home language was AST, and more children than
expected with PCIs greater than the median whose home language was signed
English. The medians ranged from 1.3 to 2.2. For the receptive scale, the
difference among the medians was not statistically significant. The medians
ranged from 1.1 to 1.8.
For the expressive language scale, a statistically significant difference
among the mean PCIs was obtained for the levels of language spoken in the
home; however, the Eta2 was essentially zero (<.01). The means ranged from
2.0 for children whose home language was ASL, to 4.5, for children whose home
language was another international language. Post-hoc analyses indicated that
the mean PCI for children whose home language was "other" was statistically
significantly higher than the mean PCIs for children whose home language was
ASL, Spanish, or English. For the receptive language scale, no statistically
significant difference among the mean PCIs was obtained, with Eta2 less than
.01. The means ranged from 1.9, for children whose home language was ASL, to
3.0, for children whose home language was "other."
It is likely that the small mean and median PCIs obtained for children
whose home language was ASL reflect the fact that such children were
identified at an earlier age than children from homes in which other languages
were used (see Table 55, Chapter 6) and children from homes in which neither
parent was hearing impaired (see Table 56, Chapter 6). As with the discussion
for age at onset, smaller psis will be obtained whenever pretest developmental
rate approximates one (i.e., when developmental age approximates chronological
age). And again, for all groups, mean and median Ma were greater than one.
209
4r

Table 133
Means, Standard Deviations, Medians and ANOVA and Chi - Square Results for
Expressive and Receptive PCIs by Language Spoken in the Home, 1979-1991
English ASLSigned
Spanish English Other F Y2
Expressive PCIs
M 2.7 2.0 2.6 3.4 4.5 3.5*
SD 3.6 2.4 3.0 5.4 9.5
Mdn 1.8 1.3 1.6 2.2 1.9 22.3*
N 2893 84 137 41 41
Mean Differences
English .7 .1 .7 1.8
ASL .6 1.4 2.5
Spanish .8 1.9
Sgn.Eng. 1.1
Median Differences
English .5 .2 .4 .1
ASL .3 .9 .6
Spanish .6 .3
Sgn.Eng. .3
Receptive PCIs
M 2.6 1.9 2.6 2.5 3.0 1.3
SD 3.3 1.8 2.9 4.8 3.3
Mdn 1.8 1.1 1.6 1.6 1.3 10.0N 2899 84 137 41 41
Mean Differences
English .7 .0 .1 .4
ASL .7 .6 1.1
Spanish .1 .4
Sgn.Eng. .5
Median Differences
English .7 .2 .2 .5
ASL .5 .5 .2
Spanish .0 .3
Sgn.Eng. .3
Note: * = Statistically significant difference among means/medians, 2 < .05.
210

Parental Hearing Loss
For the expressive language scale, no statistically significant
difference was obtained between the median PCIs for children with and without
a parent with a hearing loss (Table 134). For the receptive scale, the
difference between the medians was statistically significant. Children
without a hearing-impaired parent obtained the highest median (2.8).
For the expressive scale, no statistically significant difference was
obtained between the mean PCIs, and the Eta2 was less than .01. The means
were 2.3 and 2.8. For the receptive scale, a statistically significant
difference between the means was obtained. However, Eta2 was again
practically zero (<.01). Children without a hearing-impaired parent obtained
the highest mean (2.6).
Table 134
Means, Standard Deviations, Medians, and ANOVA and Chi-Square Results for
Expressive and Receptive PCIs by Presence of Hearing Impaired Parent, 1979-
1991
Statistic
At Least OneParent HearingImpaired
Neither ParentHearing Impaired Difference Overall F 1
Expressive PCIs
M 2.3 2.8 .5 2.7 3.2
SD 2.8 3.8 3.7
Mdn 1.6 1.8 .2 1.8 3.8
N 274 2915 3189
Receptive PCIs
M 2.1 2.6 .5 2.6 6.0*
SD 2.4 3.3 3.2
Mdn 1.5 1.8 .3 1.8
N 274 2920 3194
Note: * Statistically significant difference between the means/medians,>.05.
211

Treatment Amount
For both scales, statistically significant differences among the median
PCIs for the treatment-amount levels were obtained (Table 135). For the
expressive scale, the medians ranged from 1.4, for treatment amounts greater
than 24 months, to 2.2, for treatment amounts of 0-to-6 months. For the
receptive scale, the medians ranged from 1.3, for treatment amounts greater
than 24 months, to 2.3, for treatment amounts of 0-to-6 months.
For both scales, the differences among the mean PCIs for the treatment-
amount levels were statistically significant. However Eta2 was low for both
analyses (.02), indicating little relationship between treatment amount and
the ratios of developmental rate during treatment to developmental rate prior
to treatment.
For both scales, post-hoc analyses revealed that children whose treatment
amounts were less than six months obtain,: higher mean PCIs than children
whose treatment amounts were six months or greater. In fact, mean PCIs tended
to decrease as treatment amount increased. Inspection of the cell frequencies
above and below the medians from the chi-square tests of the medians revealed
the same pattern. Exploratory analyses were conducted to assist in
understanding the reasons for this pattern, because it would seem to indicate
that the effectiveness of the program diminished with increases in treatment
time.
Again, the formula for computing PCIs is a ratio of intervention rate
(i.e., gain from pre- to posttest divided by gain time) to pretest
developmental rate (i.e., language age divided by chronological age).
Exploratory analyses revealed that the pretest developmental rates (the
denominators of the equations) were similar across the treatment-amount
levels, indicating that the pattern of decreasing PCIs was not associated with
pretest developmental rates.
The alternative was then explored--that is, that the pattern of
decreasing mean and median PCIs was associated with the numerator of the
equation--the intervention rates. The intervention rates did, in fact,
212
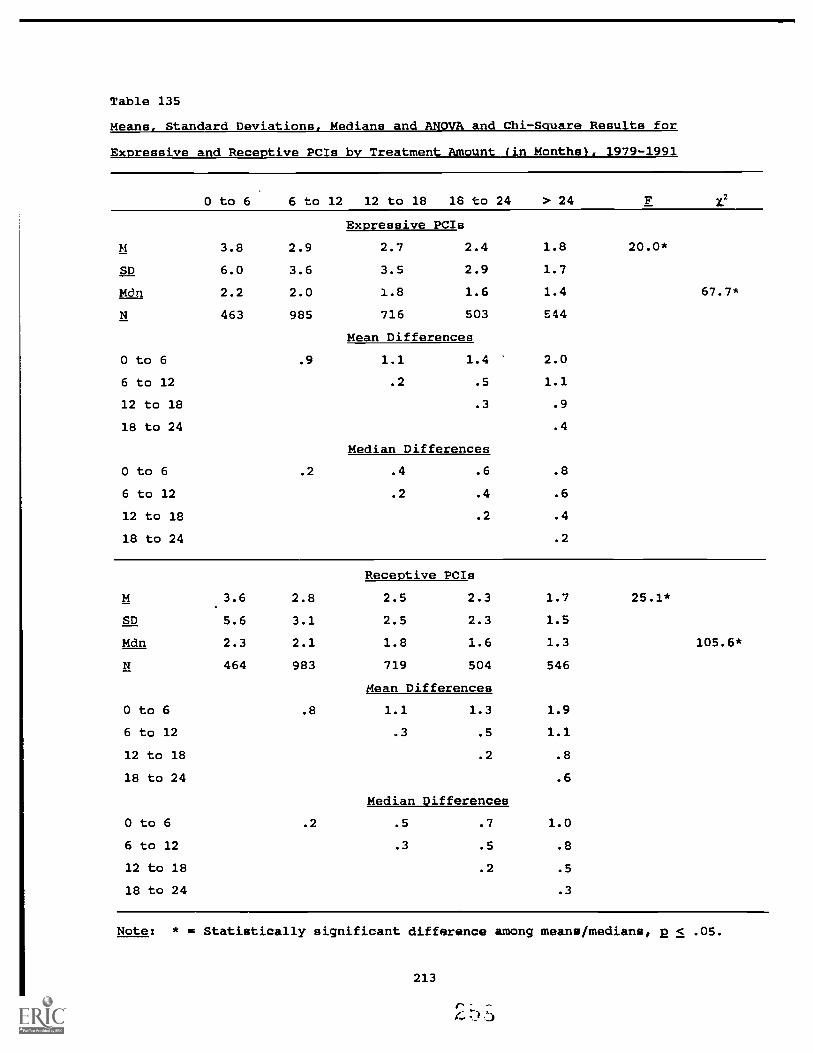
Table 135
Means, Standard Deviations, Medians and ANOVA and Chi-Square Results for
Expressive and Receptive PCIs by Treatment Amount (in Monthsl, 1979-1991
0 to 6 6 to 12 12 to 18 18 to 24 > 24 F X.2
Expressive PCIs
M 3.8 2.9 2.7 2.4 1.8
SD 6.0 3.6 3.5 2.9 1.7
Mdn 2.2 2.0 1.8 1.6 1.4
N 463 985 716 503 544
Mean Differences
O to 6 .9 1.1 1.4 2.0
6 to 12 .2 .5 1.1
12 to 18 .3 .9
18 to 24 .4
Median Differences
O to 6 .2 .4 .6 .8
6 to 12 .2 .4 .6
12 to 18 .2 .4
18 to 24 .2
20.0*
67.7*
Receptive PCIs
M 3.6 2.8 2.5 2.3 1.7
SD 5.6 3.1 2.5 2.3 1.5
Mdn 2.3 2.1 1.8 1.6 1.3
N 464 983 719 504 546
Mean Differences
O to 6 .8 1.1 1.3 1.9
6 to 12 .3 .5 1.1
12 to 18 .2 .8
18 to 24 .6
Median Differences
O to 6 .2 .5 .7 1.0
6 to 12 .3 .5 .8
12 to 18 .2 .5
18 to 24 .3
25.1*
105.6*
Note: * I* Statistically significant difference among means/medians, 2 < .05.
213

decrease with increases in treatment amounts, indicating that large gains in
language scores were observed for the children who had received smaller
treatment amounts, with smaller gains observed for the children who have
received greater treatment amounts at the time of this analysis.
Because the children were fitted with appropriate amplification, provided
with both auditory and communication-language programming, and provided with a
communication system (aural/oral or total communication), such large gains in
the first few months of the program are anticipated. For example, if a child
with a chronological age of 24 months and a language age of 4 months entered
the program, immediate language gains were achieved in the first few months of
intervention. Although the large gains tended to decrease as treatment amount
increased, it should be emphasized that the mean and median PCIs still
remained greater than one, indicating that the intervention developmental rate
was still greater than the pretest developmental rate even for children who
received 24 months or more of treatment.
Treatment Density
For both scales, the differences among the median PCIs for the treatment-
density levels were statistically significant (Table 136). Inspection of the
chi-square tables revealed a higher percentage than expected of pcis larger
than the median for children who received home visits four times per month.
For the expressive scale, the medians ranged from 1.2, for children who
received home visits .5 times per month or less, to 2.0, for children who
received home visits 4 times per month. For the receptive scale, the medians
ranged from 1.1, for children who received home visits .5 times per month or
less, to 2.1, for children who received home visits 4 times per month.
For both scales, the difference among the mean PCIs for the treatment-
density levels were not statistically significant, with the Eta2 values
essentially zero. The expressive means ranged from 2.1, for children who
received home visits one time per month, to 2.6, for children with home visits
three times per month. The receptive means ranged from 2.1 for children who
received home visits one time per month, to 3.0, for children with visits
greater than five times per month.
214
r--4:1)

Table 136
Means, Standard Deviations., Medians and ANOVA and Chi-Square Results for Expressive and Receptive PCIs by Treatment Density. 1987-1991
< .5x/mo lx/mo 2x/mo 3x/mo 4x/mo >5rJmo F
Expressive PCIs
M 2.2 2.1 2.4 2.6 2.5 2.5 .9
SD 2.8 2.4 2.9 3.4 2.5 2.8
Mdn 1.2 1.5 1.6 1.8 2.0 1.4 13.0*
N 35 240 325 365 207 54
Mean Differences
< .5x/mo .1 .2 .4 .3 .3
1rJmo .3 .5 .4 .4
2x/mo .2 .1 .1
3x/mo .1 .1
4x/mo .0
Median Differences
< .5x/mo .3 .4 .6 .8 .2
lx/mo .1 .3 .5 .1
2x/mo .2 .4 .2
3x/mo .2 .4
4xlmo .6
Receptive PCIs
M 2.2 2.1 2.1 2.6 2.8 3.0 2.0
SD 3.4 2.1 2.2 4.5 2.6 5.5
Mdn 1.1 1.5 1.6 1.8 2.1 13 31.7
N 35 239 326 366 206 55
Mean Differences
< .5x/mo .1 .1 .4 .6 .8
1 x/mo .0 .5 .7 .9
2x/mo .5 .7 .9
3x/mo .2 .4
4x/mo .2
Median Differences
< .5x/mo .4 .5 .7 1.0 .2
1 x/mo .1 .3 .6 .2
2x/mo .2 .5 .3
3x/mo .3 .5
4x/mo .8Statistically significant difference among the medians, 2 < .05.
215
2 6

Communication Methodology
For both language scales, the differences among the median PCIs for the
communication methods were statistically significant (Table 137). Inspection
of the chi-square tables revealed a higher than expected percentage of PCIs
that were less than the median for children using aural/oral communication.
For the expressive scales, the medians ranged from 1.6, for children using
aural/oral communication, to 2.1, for children using "other" communication
(e.g., cued speech). For the receptive scale, the medians ranged from 1.7,
for children using aural/oral communication, to 2.6, for children using other
communication.
For both scales, the differences among the mean PCIs for the
communication methods were statistically significant. However, the Eta2
values were essentially zero. The expressive means ranged from 2.5, for
children who used aural/oral communication, to 3.6, for children using other
communication. The receptive means ranged from 2.2, for children using
aura/oral communication, to 2.9, for children using total communication.
Post-hoc analyses revealed that the mean PCIs for children using total
communication were statistically significantly larger than the mean PCIs for
children using aural/oral communication, for both the expressive and receptive
scales.
These findings are best understood by recalling that we reported
previously in this chapter that greater percentages of children with severe
and profound hearing losses used total communication (Table 119). Exploratory
analyses revealed that children with severe and profound hearing losses tended
to have small pretest developmental rates. When using the pcx formula (the
ratio of intervention developmental rate to pretest developmental rate), then,
we were dividing the intervention developmental rate by a small value,
resulting in large PCIs for children using total communication.
216

Table 137
Means, Standard Deviations. Medians and ANOVA and Chi - Square Results for
Expressive and Receptive PCIs by Communication Methodolocy. 1979-1991
Aural/ TotalOral Comm Other
Expressive PCIs
M 2.5 2.9 3.6 3.8*
SD 3.7 3.6 6.0
Mdn 1.6 1.9 2.1 8.2*
N 772 1180 23
Mean Differences
Aural/oral .4 1.1
Total Communication .7
Median Differences
Aural/oral .3 .5
Total Communication .2
Receptive PCIs
M 2.2 2.9 2.8 9.3*
SD 2.2 3.9 2.3
Mdn 1.7 1.9 2.6 6.2*
N 775 1182 23
Mean Differences
Aural/oral .7 .6
Total Communication .1
Median Differences
Aural/oral .2 .9
Total Communication .7
Note: * = Statistically significant difference among the means/medians.
Summary for Pre-, Post-, and PredictedLanauaae Gains and PCIs
At this point we have presented two types of program-effectiveness data:
pre-, post-, and predicted language gains and PCIs. A summary of those
findings is provided here.
217

I
II
1. Overall, pre-to-post developmental gains in receptive and
expressive language were statistically significant and
educationally important, with large standardized mean differences.
On average, SKI*HI children made one month of language gain for
every month of intervention (medians = 1.3 months of expressive
language gain per month of treatment and 1.8 months of receptive
language gain per month of treatment).
2. Overall, the difference between actual posttest means and predicted
posttest means were statistically significant, with the actual
posttest means higher than what wa3 predicted based on maturation
alone.
3. Overall, the median PCIs were large, with a rate of development
during intervention that was nearly twice the rate of development
prior to intervention.
4. Median PCIs were largest for children without an additional
handicap.
5. For the receptive language scale, median PCIs were largest for
children with a sensorineural hearing loss and for children with
severe hearing losses.
6. For both scales, median PCIs were largest for children whose cause
of :tearing loss was fever or infection and for children whose age
at onset was 2 to 3 years.
7. For both scales, median PCIs were smallest for children whose home
language was ASL, reflecting the fact that such children were
identified at an earlier age than children from homes in which
other languages were used and children from homes in which neither
parent was hearing impaired (see Chapter 6).
8. Median PCIs were largest for children who received treatment
amounts of 12 months or less and for children who received
treatment four times per month.
9. Median PCIs were largest for children using total communication.
218
r

Value-Added Analysis
Value-added analysis (Bryk & Weisberg, 1976; Hebbeler, 1985; Markowitz et
al., 1991) was used to estimate the growth associated with participation in
the program, over-and-above the growth associated with maturation. Using the
total distribution of the children's scores at the pretest as well as the
total distribution of the children's ages at the pretest, pretest scores were
regressed on pretest chronological ages. The resulting coefficient estimated
the language growth rate prior to intervention. Because hearing-loss severity
was hypothesized to be related to developmental growth in our population, we
incorporated unaided hearing thresholds into the equation as well. The
univariate correlation coefficients follow in Table 138:
Table 138
Univariate Correlation Coefficients for Value-Added Analysis
Pretest Pretest HearingLDS Expressive LDS Receptive Threshold
Pretest CA
Pretest LDS Expressive
Pretest LDS Receptive
.66 .67
.95
-.14
-.24
-.24
The regression equations used to estimate each child's growth associated with
maturation alone follow: Y' = .6352 + (-.1448X) for the expressive scale and
Y' = .6494 + (-.149X) for the receptive scale. In the equations, Y' equaled
the predicted score and X equaled hearing threshold level in standardized dB
values (with a mean = 0 and a standard deviation .= 1). For the expressive and
receptive scales, the multiple R = .67 and .69, respectively.
Using the equations, for each child the resulting values were multiplied
by the amount of time between the pretest and the posttest scores to estimate
the amount of growth due to maturation alone for each of the language scales.
To determine the child's total growth, the pretest score was subtracted from
219

the posttest score for each scale. Finally the growth associated with
maturation was subtracted from the total growth to estimate the growth
associated with program participation (i.e., the value added) for each scale.
In Table 139 we report the mean value added (in months) as well as a mean
value added per month (i.e., value added divided by time between the pretest
and posttest). For SKI*HI overall for the expressive and receptive scales,
the mean gain associated with maturation was 7.7 and 7.9 months, respectively.
The mean value added, over and above maturation, was 4.2 and 4.9 months,
respectively. The mean value added per month was .5.
For the hearing-loss severity levels, inspection of Table 139 reveals
that with increases in hearing-loss severity, the mean value added increased.
That is, for children with no loss or mild losses, the value-added means
ranged from approximately two months to three months; for children with severe
and profound hearing losses, the value-added means ranged from 4.3 months to
6.4 months. The value-added-per-month means tended to increase with increases
in hearing-loss-severity levels as well (from .4 to .6). Finally, the mean
gain times increased with increases in hearing-loss severity, resulting in
mean values added per month that varied little across the hearing-loss
severity levels (.4 to .6).
For communication methodology, inspection of Table 139 reveals only
slight differences in the value-added means, with the value-added-per-month
means being nearly identical. The mean gain times differed slightly, with
children using total communication tending to remain in intervention longer
than children using aural/oral communication. The mean values added per month
did not differ for the two communication methodologies.
Predicting Posttest Scores
A multiple-regression analysis was conducted to determine the optimal
linear combination of treatment variables for predicting language development
rates during intervention. We computed intervention efficiency indexes (IEI)
for both the expressive and receptive scales of the LDS by calculating the
gain from pre- to posttest and dividing by the time from pre- to posttest. We
present first the correlation coefficients among the treatment variables
220
)

Table 139
Value-Added Analysis. Mean Maturation Gain, Mean Value-Added Gain, Mean Value-
Added Gain per Month, anc' Gain Time, Overall and by Hearing-Loss Severity and
Communication Methodology (in Months), 1979-1991
M Gain M GainMaturation Value Added
M ValueAddedPoints/Mo.
Gain Time
Expressive
Receptive
OVERALL N = 2973
.5
.5
11.97.7 4.2
7.9 4.9
Hearing-Loss Severity
No Loss (n = 1011Expressive 8.4 1.9 .4 8.7
Receptive 8.6 1.9 .4
Mild (n = 246)Expressive 8.7 2.8 .5 10.2
Receptive 8.9 3.0 .5
Moderate (n = 5971Expressive 8.8 3.3 .4 11.7
Receptive 9.0 3.9 .5
Severe (n = 13501Expressive 7.8 4.3 .5 12.9
Receptive 8.0 5.2 .6
Profound (n = 6801Expressive 6.2 5.6 .5 13.6
Receptive 6.3 6.4 .6
Communication Method° loav
Aural/oral (n = 8961Expressive 7.9 4.3 .5 11.3
Receptive 8.1 4.7 .6
Total Communication (n = 14571Expressive 7.9 4.7 .5 13.5
Receptive 8.0 5.5 .5
221
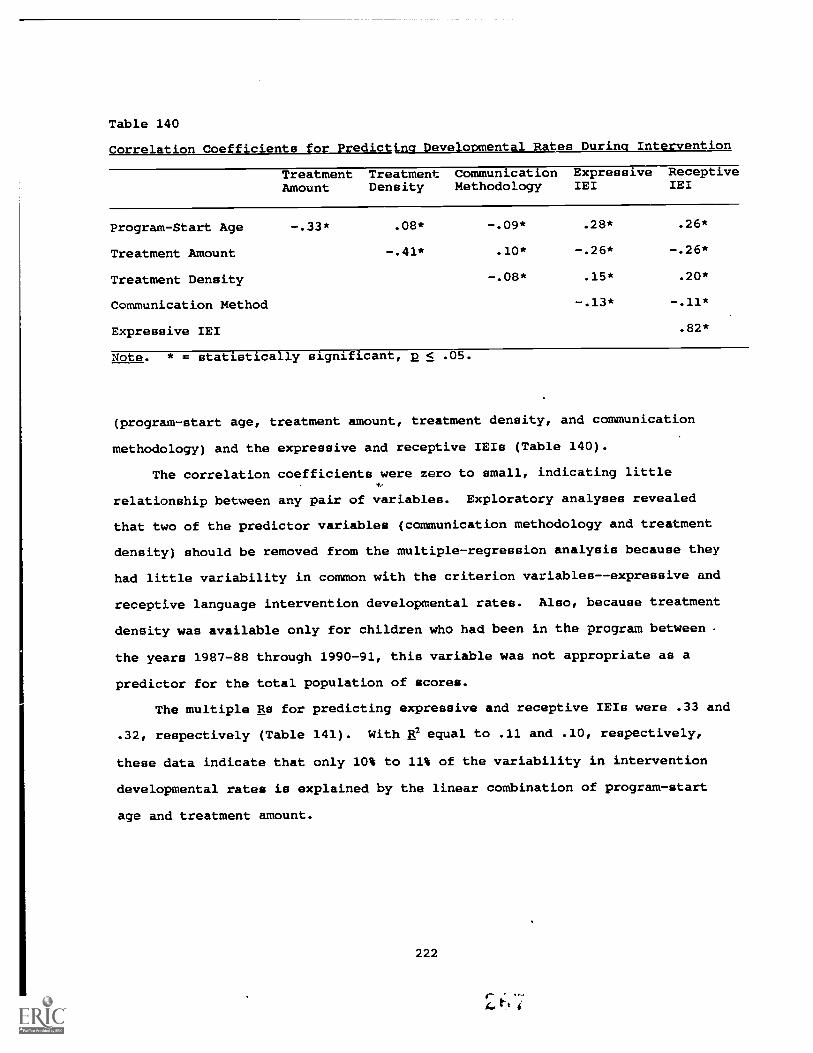
Table 140
Correlation Coefficients for Predicting Developmental Rates During Intervention
Treatment TreatmentAmount Density
CommunicationMethodology
ExpressiveIEI
ReceptiveIEI
Program-Start Age -.33* .08* -.09* .28* .26*
Treatment Amount -.41* .10* -.26* -.26*
Treatment Density -.08* .15* .20*
Communication Method -.13* -.11*
Expressive IEI .82*
Note. * = statistically significant, p < .05.
(program-start age, treatment amount, treatment density, and communication
methodology) and the expressive and receptive IEIs (Table 140).
The correlation coefficients were zero to small, indicating little
relationship between any pair of variables. Exploratory analyses revealed
that two of the predictor variables (communication methodology and treatment
density) should be removed from the multiple-regression analysis because they
had little variability in common with the criterion variables--expressive and
receptive language intervention developmental rates. Also, because treatment
density was available only for children who had been in the program between
the years 1987-88 through 1990-91, this variable was not appropriate as a
predictor for the total population of scores.
The multiple Rs for predicting expressive and receptive IEIs were .33 and
.32, respectively (Table 141). With e equal to .11 and .10, respectively,
these data indicate that only 10% to 11% of the variability in intervention
developmental rates is explained by the linear combination of program-start
age and treatment amount.
222

Table 141
Multiple-Regression Analyses for Predicting Developmental Rate During
Intervention
Beta CoefficientsProgram-Start Treatment
Age Amount R R2 N
Expre,sive IEI .216 -.185 .33* .11 2881
Receptive IEI .190 -.202 .32* .10 2881
Note: * = Statistically significant, 2 < .05.
Child Outcomes
The child-outcome data were coded into the National Data Bank only for
the 1987 through 1991 program years. The data were obtained from the lower
portion of the SKI*HI Data Sheets (Appendix A). Parent advisors recorded
session-by-session observations under the section entitled Child Data. For
the 1987 through 1991 program years, data for a total of 2,178 children were
submitted. However, not all parent advisors completed the lower portion of
the data sheet, or they recorded data only monthly rather than session by
session. Furthermore, not all children wore a hearing aid, particularly
children with no or mild conductive hearing losses. Consequently, the sample
sizes for the child-outcome data are smaller than those obtained for the
demographic data. We will report here the child outcomes for level of
hearing-aid use, threshold improvement, auditory development, communication-
language development, and vocabulary development.
Level of Hearing-Aid Use
The parent advisor taught the parents what the hearing aid is and how to
manage it. The parent advisor also provided lessons on related topics, such
as the nature of sound, the importance of hearing for language development,
hearing assessment, speech perception, and causes and types of hearing losses.
The goals of the home-hearing-aid program included: (a) that the child will
be properly fit with hearing aids and earmolds that allow maximum use of
residual hearing acuity; (b) that the child will accept the hearing aid within
223

the first few weeks of the fitting; and (c) that the parents will demonstrate
understanding of the important skills and concepts in the hearing-aid lessons,
which include the importance of appropriate, consistent amplification as well
as the daily listening check, trouble shooting for feedback, and caring for
the hearing aid.
One measure of program effectiveness is whether the child wore the
hearing aid full-time. Parent advisors were instructed to write down the
number of the appropriate time interval (1 = < 1/4 time, 2 = 1/4 to 1/2 time,
3 = 1/2 to 3/4 time, 4 = over 3/4 time, and 5 = all of the time) underneath
the session date. If the child did not achieve a new time interval by the
time of the session, then the space by Time Hearing Aid Worn was left blank
for that session's date. When the child wore the aid for all waking hours or
the hearing-aid time recommended by the audiologist, reporting was
discontinued and was indicated by a slash on the data sheet for that session.
In Table 142 we present the frequencies and percentages of children for
each level of hearing-aid use and the mean and median time in months that it
took to attain the highest level of hearing-aid use. Seventy-three percent of
the children achieved 3/4-time to full-time hearing-aid use. The remainder of
the children were in the process of achieving full-time hearing-aid use. The
median amount of time that it took to achieve full-time hearing-aid use was
one month.
The percentages of children for each level of hearing -aid use are also
provided in Table 142 by severity of hearing loss, type of hearing loss, and
communication methodology. Clearly, the largest percentages of children who
were wearing their hearing aid full time were children with severe and
profound sensorineural hearing losses. The low Cramer's y (.16) for the
relationship between communication methodo.Lugy and level of hearing-aid use
reflects the slightly larger-than-expected percentage, based on the marginal
values, of children wearing their aids full time who used aural/oral
communication--an anticipated finding.
224

Table 142
Highest Level of Hearing-Aid Use, 1987-1991
Less than 1/4 to 1/2 1/2 to 3/4 3/4 to Full1/4 Time Time Time Time Full Time Total
Overall Frequencies and Percentages
130 111 153 222 860 1476
% 8.8 7.5 10.4 15.0 58.3 100
Time (in Months) to Attain Highest Level of Hearing Aid Use
M 2.3 3.3 4.6 4.4 2.8 3.2
SD 3.9 5.0 5.3 5.4 4.5 4.8
Mdn 0 1 3 3 1 1
Severity of Unaided Hearing Loss-Percentages of Children *
No Loss .3 .3 .1 .1 .4 1.2
Mild .6 .4 .6 .7 4.1 6.5
Moderate 1.0 1.2 2.1 3.9 12.7 20.9
Severe 3.4 3.6 4.6 6.5 27.8 46.0
Profound 3.2 1.8 2.9 4.0 13.3 25.3
Overall 8.6 7.3 10.4 15.3 58.4 100.0
Type of Hearing Loss-Percentages of Children **
Conductive .6 .4 .2 .2 1.7 3.1
Sensorineural 7.6 6.3 8.5 13.3 53.5 89.3
Mixed .8 .6 1.5 1.3 3.5 7.6
Overall 9.0 7.3 10.3 14.8 58.7 100.0
Communication Methodology -- Percentages of Children ***
A/O 1.0 1.7 2.5 4.1 27.4 36.7
T.C. 6.6 4.8 7.3 10.4 33.3 62.5
Other .1 .2 0 .2 .3 .8
Overall 7.7 6.7 . 9.9 14.7 61.1 100.0Note:* Cramer's V = .08, based on N = 1390. Severity of hearing loss was not associated with
highest level of hearing-aid use.** Cramer's V = .09, based on j . 1440. Type of hearing loss was not associated with the
highest level of hearing-aid use.*** Cramer's y - .16, based on N = 1146. Communication methodology was associated with
the highest level of hearing-aid use, but the association was small.
225
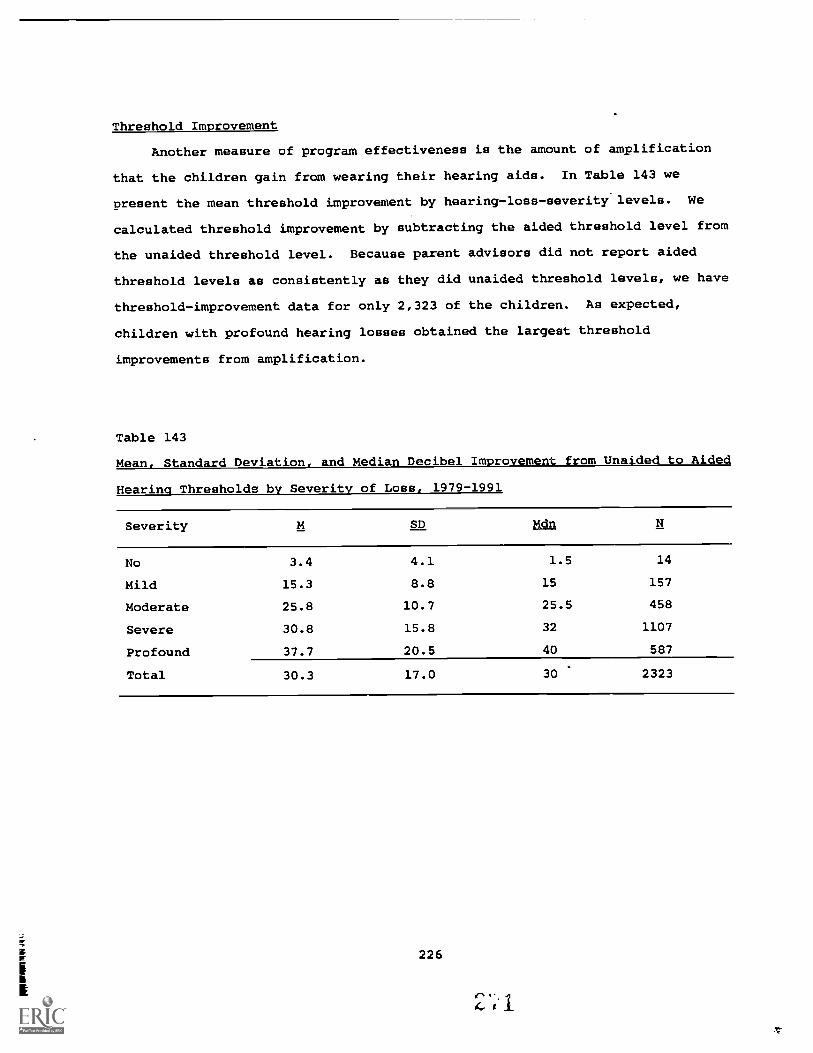
Threshold Improvement
Another measure of program effectiveness is the amount of amplification
that the children gain from wearing their hearing aids. In Table 143 we
present the mean threshold improvement by hearing-loss-severity levels. We
calculated threshold improvement by subtracting the aided threshold level from
the unaided threshold level. Because parent advisors did not report aided
threshold levels as consistently as they did unaided threshold levels, we have
threshold-improvement data for only 2,323 of the children. As expected,
children with profound hearing losses obtained the largest threshold
improvements from amplification.
Table 143
Mean, Standard Deviation, and Median Decibel Improvement from Unaided to Aided
Hearing Thresholds by Severity of Loss, 1979-1991
Severity M SD Mdn
No 3.4 4.1 1.5 14
Mild 15.3 8.8 15 157
Moderate 25.8 10.7 25.5 458
Severe 30.8 15.8 32 1107
Profound 37.7 20.5 40 587
Total 30.3 17.0 30 2323
226
Ids I I
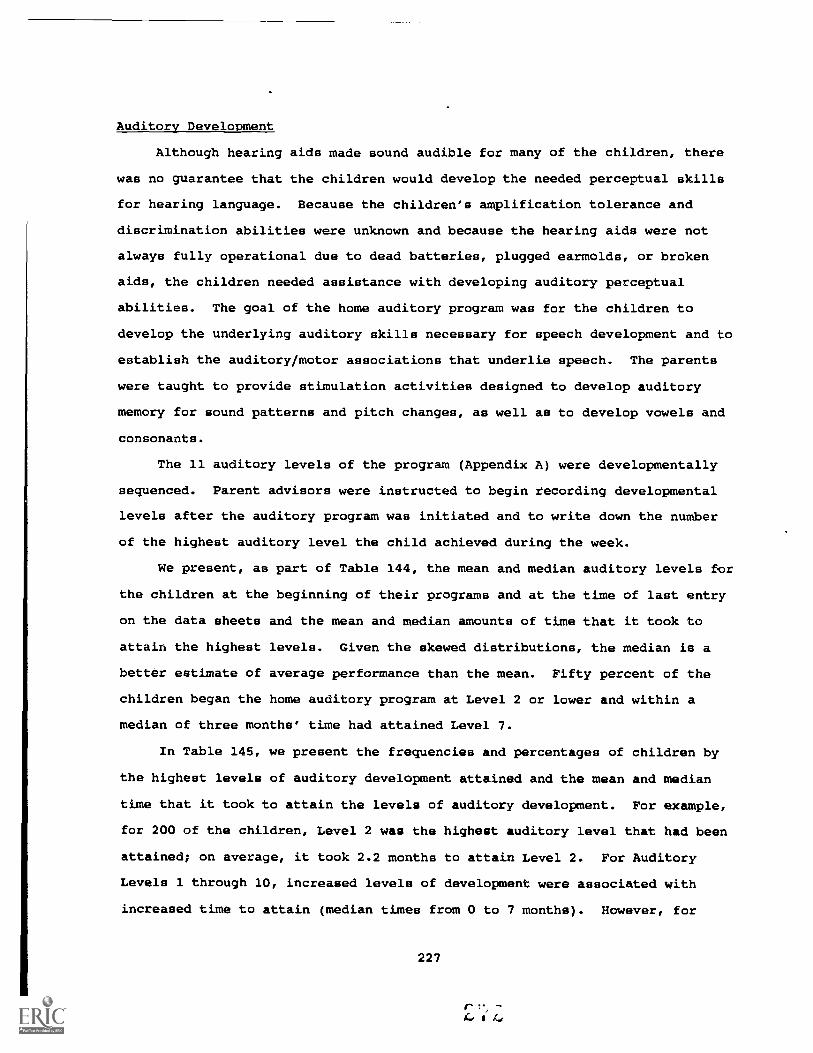
Auditory Development
Although hearing aids made sound audible for many of the children, there
was no guarantee that the children would develop the needed perceptual skills
for hearing language. Because the children's amplification tolerance and
discrimination abilities were unknown and because the hearing aids were not
always fully operational due to dead batteries, plugged earmolds, or broken
aids, the children needed assistance with developing auditory perceptual
abilities. The goal of the home auditory program was for the children to
develop the underlying auditory skills necessary for speech development and to
establish the auditory/motor associations that underlie speech. The parents
were taught to provide stimulation activities designed to develop auditory
memory for sound patterns and pitch changes, as well as to develop vowels and
consonants.
The 11 auditory levels of the program (Appendix A) were developmentally
sequenced. Parent advisors were instructed to begin recording developmental
levels after the auditory program was initiated and to write down the number
of the highest auditory level the child achieved during the week.
We present, as part of Table 144, the mean and median auditory levels for
the children at the beginning of their programs and at the time of last entry
on the data sheets and the mean and median amounts of time that it took to
attain the highest levels. Given the skewed distributions, the median is a
better estimate of average performance than the mean. Fifty percent of the
children began the home auditory program at Level 2 or lower and within a
median of three months' time had attained Level 7.
In Table 145, we present the frequencies and percentages of children by
the highest levels of auditory development attained and the mean and median
time that it took to attain the levels of auditory development. For example,
for 200 of the children, Level 2 was the highest auditory level that had been
attained; on average, it took 2.2 months to attain Level 2. For Auditory
Levels 1 through 10, increased levels of development were associated with
increased time to attain (median times from 0 to 7 months). However, for
227
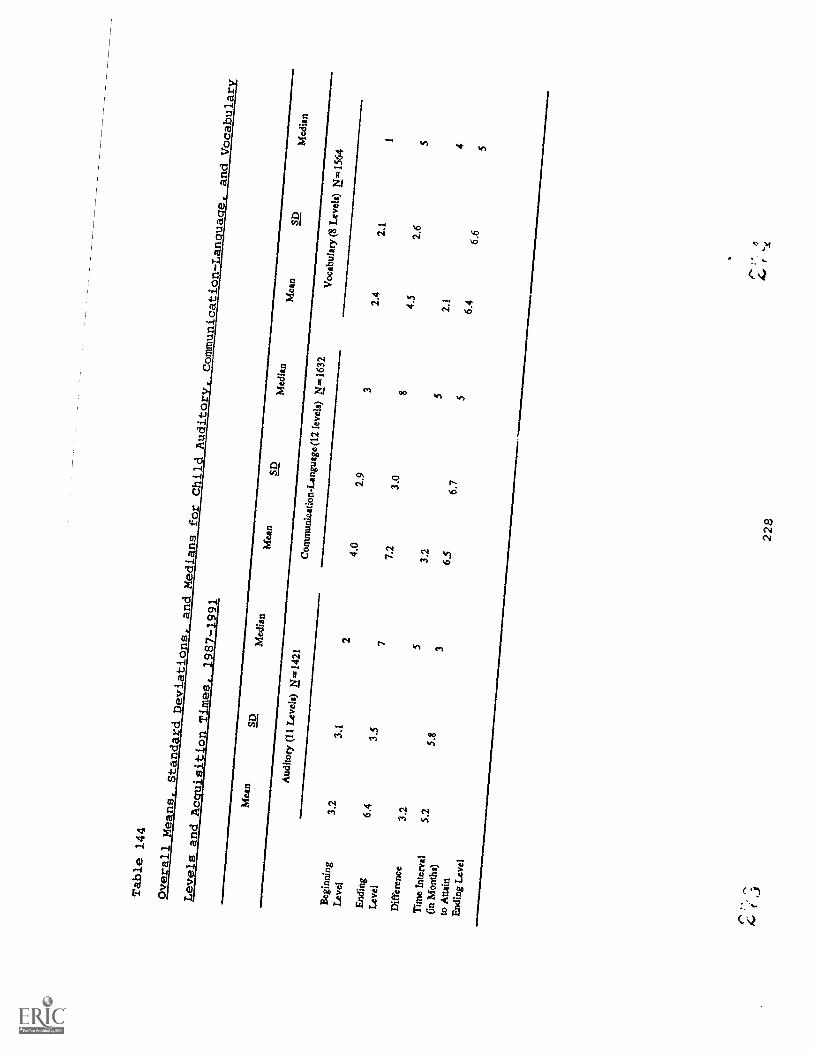
Table 144
Overall
Means,
StandardDeviations,
and Medians
for ChildAuditory,
CommunicationLam:place,
andVocabulary
Levels andAcquisitionTimes,
1987-1991
Mea
nSD
Med
ian
Mea
nSD
Med
ian
Mea
nSD
Med
ian
Aud
itory
(11
Lev
els)
N.1
421
Com
mun
icat
ion-
Lan
guag
e (12
leve
ls)
N.,1
632
Voc
abul
ary
(8L
evel
s) N
.156
4B
egin
ning
3.2
3.1
24.
02.
93
2.4
2.1
1
Lev
el
End
ing
6.4
3.5
77.
23.
08
4.5
2.6
5
Lev
el
Dif
fere
nce
3.2
53.
25
2.1
4
Tim
e In
terv
al(i
n M
onth
s)to
Atta
in
5.2
5.8
36.
56.
75
6.4
6.6
5
End
ing
Lev
el
228

Table 145
Frequencies and Percentages of Children and Means, Standard Deviation and
Median Time (in Months) to Attain Each Level of Auditory Development, 1987-1991
Level
Lev
elL
evel
Lev
elL
evel
Lev
elL
evel
Lev
elL
evel
Lev
elL
evel
12
34
56
78
910
11T
otal
N83
200
105
137
127
5714
588
7577
32.7
1421
%6
147
109
410
65
523
100
M1.
62.
23.
64.
56.
16.
66.
18.
57.
78.
35.
5
SD2.
53.
84.
44.
45.
76.
65.
66.
86.
36.
46.
0
Mdn
01
23
55
57
67
4
Note:
Depicted here are the numbers of children by highest level of auditory development attained.
The mean times reported are not cumulative.
For example, for children for whom Level 3 was the
highest level attained, the average time to attain thlt level was 3.6 months (median = 2 months).
Although times are not cumulative, the means indicate that it took approximately 1 to 1 1/2 months
additional time to attain the next level of auditory development.
229
J
!*,

Level 11 (speech use), that pattern did not hold. For 23% of the children,
Level 11 was attained in a median time of four months.
Communication-Language Development
Communication begins developing at birth through natural interactions and
conversations between the child and the parents. The child communicates
his/her intentions through a variety of gestures, facial expressions, and
vocalizations. Parents must be sensitive to the child's messages and respond
to them effectively. The goals of the home communication program were that
the parents (a) understand how communication develops and its importance for
language development; (b) develop the essential skills to foster and stimulate
effective parent/child communication; (c) monitor and evaluate their child's
communication behaviors; and (d) arrive at a communication methodology
decision appropriate for the child and the entire family.
The 12 communication-language levels of the program (see Appendix A) were
developmentally sequenced. Parent advisors were instructed to begin recording
developmental levels after the communication program was initiated and to
write down the number of the highest communication-language level the child
achieved during the week.
We present, as part of Table 144, the mean and median communication-
language levels for the children at the beginning of their program and at the
time of last entry on the data sheets and the mean and median amounts of time
that it took to attain the highest levels. Given the skewed distributions,
the median is a better estimate of average performance than the mean. Fifty
percent of the children began the home communication program at Level 3 or
lower and within a median of five months' time had attained Level 8.
In Table 146, we present the frequencies and percentages of children by
the highest levels of communication-language development attained and the mean
and median time that it took to attain the levels. For Communication-Language
Levels 1 through 11, increased levels of development were associated with
increased time to attain (median times from 0 to 7 months). However, for
Level 12 (uses compound/complex sentences), that pattern did not hold. For 6%
of the children, Level 12 vas attained in a median time of four months.
230
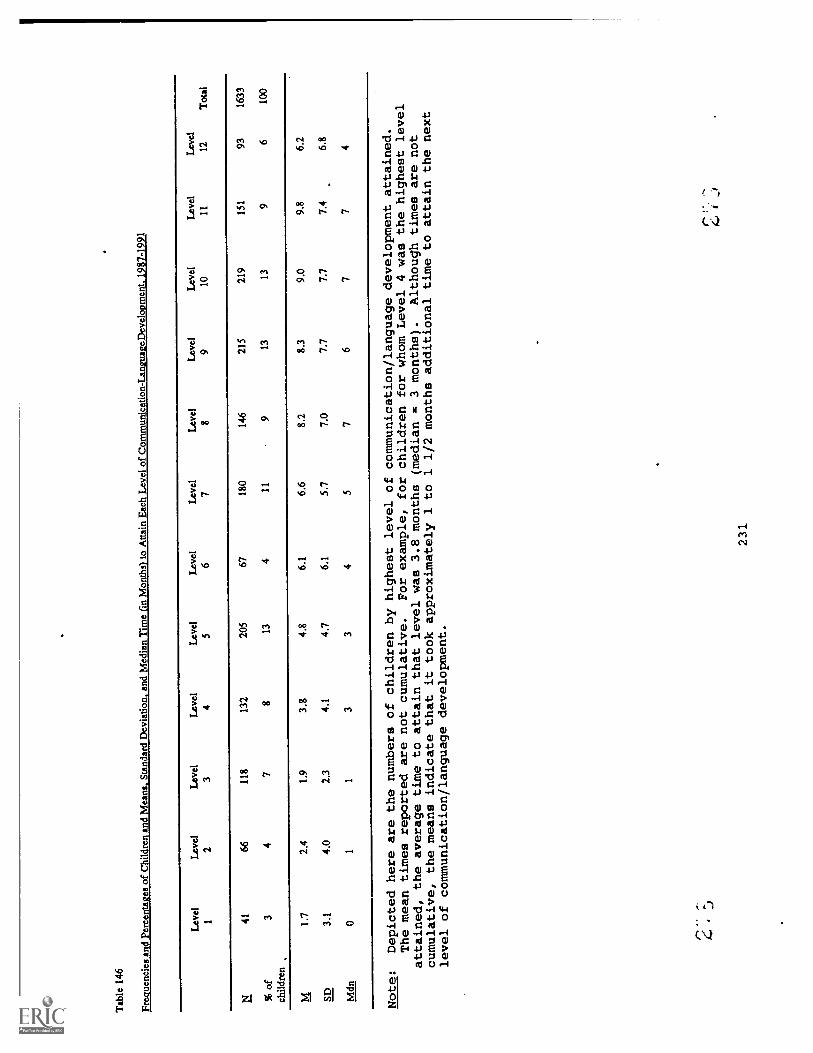
Tab
le 1
46
Freq
uenc
ies
and
Perc
enta
ges
of C
hild
ren
and
Mea
ns. S
tand
ard
Dev
iatio
n, a
nd M
edia
n T
ime
(in
Mon
ths)
to A
ttain
Eac
h L
evel
of
Com
mun
icat
ion-
Lan
guag
eDev
elop
men
t. 19
87-1
991
Lev
el1
Lev
el2
Lev
el3
Lev
el4
Lev
el5
Lev
el6
Lev
el7
Lev
el8
Lev
el9
Lev
el10
Lev
el11
Lev
el12
Tot
al
N41
6611
813
220
567
180
146
215
219
151
9316
33
% o
fch
ildre
n3
47
813
411
913
139
610
0
M1.
72.
41.
93.
84.
86.
16.
68.
28.
39.
09.
86.
2
SD3.
14.
02.
34.
14.
76.
15.
77.
07.
77.
77.
46.
8
Mdn
01
13
34
57
67
74
Note:
Depicted here are the numbers of children by highest level of communication/language developmentattained.
The mean times reported are not cumulative.
For example, for children for whom Level 4 was the highest level
attained, the average time to attain that level was 3.8 months (median = 3 months).
Although times are not
cumulative, the means indicate that it took approximately 1 to 1 1/2 months additional time toattain the next
level of communication/language development.
"*"
"
231
i

Vocabulary Development
As a part of the communication program, vocabulary development was
monitored. Eight vocabulary intervals were provided on the SKI*HI Data Sheets
and parent advisors are instructed to write down the number of the appropriate
vocabulary interval. Specific instructions as to what constitutes a new word
were provided in the SKI*HI manual on pages 81-82. The general instructions
were to count as a new word a morpheme that was distinguishable as a word and
had been used spontaneously (not imitatively) by the child more than once.
We present, as part of Table 144, the mean and median vocabulary
intervals for the children at the beginning of their program and at the time
of last entry on the data sheets and the mean and median amounts of time that
it took to attain the highest intervals. Again, given the skewed
distributions, the median is a better estimate of average performance than the
mean. For 50% of the children, the median initial vocabulary interval was
one. Within a median of five months' time, 50% of the children had attained
Interval 5.
In Table 147, we present the frequencies and percentages of children by
the highest vocabulary interval attained and the mean and median time that it
took to attain the intervals. For Intervals 1 through 7, increases in
vocabulary were associated with increased time to attain (median time from 0
to 9 months). However, for Interval 8 (201 to 300 words), that pattern did
not hold. For 20% of the children, Interval 8 was attained in a median time
of six months.
232
(+ r-
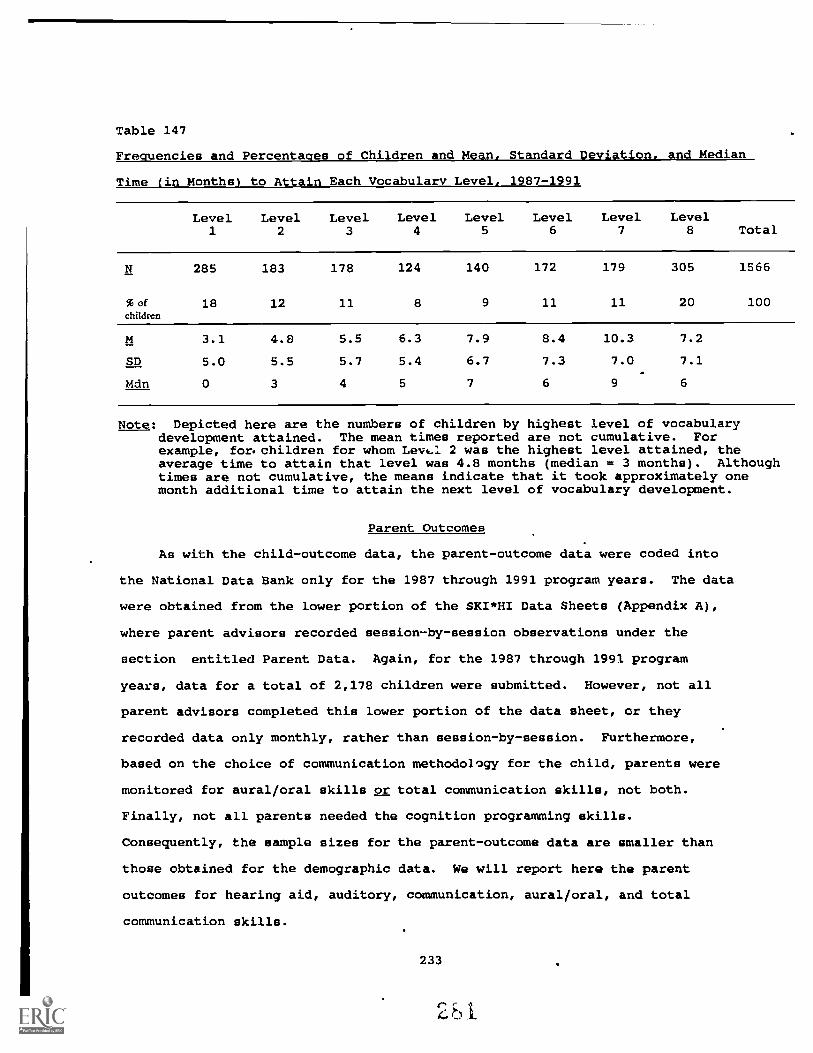
Table 147
Frequencies and Percentages of Children and Mean, Standard Deviation, and Median
Time (in Months) to Attain Each Vocabulary Level, 1987-1991
Level1
Level2
Level3
Level4
Level5
Level6
Level7
Level8 Total
N 285 183 178 124 140 172 179 305 1566
%ofchildren
18 12 11 8 9 11 11 20 100
M 3.1 4.8 5.5 6.3 7.9 8.4 10.3 7.2
SD 5.0 5.5 5.7 5.4 6.7 7.3 7.0 7.1
Mdn 0 3 4 5 7 6 9 6
Note: Depicted here are the numbers of children by highest level of vocabularydevelopment attained. The mean times reported are not cumulative. Forexample, for. children for whom Levt.1 2 was the highest level attained, theaverage time to attain that level was 4.8 months (median = 3 months). Althoughtimes are not cumulative, the means indicate that it took approximately onemonth additional time to attain the next level of vocabulary development.
Parent Outcomes
As with the child-outcome data, the parent-outcome data were coded into
the National Data Bank only for the 1987 through 1991 program years. The data
were obtained from the lower portion of the SKI*HI Data Sheets (Appendix A),
where parent advisors recorded session-by-session observations under the
section entitled Parent Data. Again, for the 1987 through 1991 program
years, data for a total of 2,178 children were submitted. However, not all
parent advisors completed this lower portion of the data sheet, or they
recorded data only monthly, rather than session-by-session. Furthermore,
based on the choice of communication methodology for the child, parents were
monitored for aural/oral skills or total communication skills, not both.
Finally, not all parents needed the cognition programming skills.
Consequently, the sample sizes for the parent-outcome data are smaller than
those obtained for the demographic data. We will report here the parent
outcomes for hearing aid, auditory, communication, aural/oral, and total
communication skills.
233
0 1.

Hearing-Aid Skills
A hearing-aid competency test was provided in the SKI*HI manual on pages
231-234. Parent advisors were instructed to write down, only once, the number
of the home visit during which the parent received a score of 80-100% on the
hearing-aid competency test. The mean visit number at which 80-100%
competency was achieved was 11 (sd = 8), with a median of 9.
Auditory Skills
Parent advisors were instructed to begin recording after the initiation
of the Auditory Program the number(s) of all new auditory skills acquired by
the parent(s) during the home visit or preceding week. Eleven skills were
possible (see Appendix A). Specific instructions for determining parent
progress were found on page 71 of the SKI*HI manual. If the parent achieved
no new auditory skills during a particular week, the PAs were instructed to
leave the spSce for the current week blank.
For the 1987-1991 program years, data coders counted the number of
auditory skills recorded by the PAs on the data sheets. The mean number of
auditory skills acquired was 4.6 (median = 4), and these were acquired by the
parent, on average, in 6.4 months (median = 5 months.) (Table 148).
Communication Skills
To document communication -skill acquisition, recording began after the
initiation of the Communication Program. The same instructions for recording
auditory skills applied to the recording of communication skills. Fifteen
communication skills were possible (see Appendix A). The mean number of
communication skills acquired was 8.1 (median = 8), and these were acquired,
on average, in 6 months (median = 5 months) (Table 148).
Aural/Oral Skills
Recording began after the initiation of the Language Stimulation Program:
Aural/Oral. Again, the same instructions applied for recording aural/oral
skills acquired by the parents. Nine aural/oral skills were possible (see
Appendix A). The mean number of aural/oral skills acquired was 4.7 (median =
5), and these were acquired, on average, in 5 months (median = 4 months)
(Table 148).
234

'able 148
!sans, Standard Deviations, and Medians for Number of Parent Skills Acquired and Time in Months to Acquire Skills, 1987-1991
Skill
Number of Skills
Time in Months
MSD
Mdn
NM
SD
Mdn
Auditory (11 skills)
4.6
3.1
41327
6.4
5.9
51057
Communication (15 skills)
8.1
5.0
81493
6.0
5.1
51299
Aural/Oral (9 skills)
4.7
2.9
5702
5.0
4.7
4547
Total Communication (20 skills)
6.7
5.0
6670
6.4
5.7
5561
Cognition (12 skills)
4.4
3.4
3265
4.6
4.9
3200
235

Total Communication Skills
Recording began after the initiation of the Language Stimulation Program:
Total Communication. Again, the same instructions applied for recording total
communication skills acquired by the parents. Twenty total communication
skills were possible (see Appendix A). The mean number of total communication
skills acquired was 6.7 (median = 6), and these were acquired, on average, in
6.4 months (median = 5 months) (Table 148).
Cognition Skills
Recording began after the initiation of the Cognition Program, with the
same instructions for recording as those for the auditory skills. Twelve
cognition skills were possible (see Appendix A). The mean number of cognition
skills acquired was 4.4 (median = 3), and these were acquired, on average, in
4.6 months (median = 3 months) (Table 148).
Follow-up Data
Prior to presenting the follow-up data, we present the mean and median
ages for graduation from the home-based program. Although parent advisors
failed to report this information consistently, we do 'lave data for 27% (N =
1,481) of the children, providing an estimate of graduation age for the total
population of children. The mean graduation age was 43 months (24 = 13), with
a median of 42 months.
One outcome variable of particular interest to parents and educators was
the placement of children with hearing impairments upon completion of home-
based progr=mming. Before the large-scale implementation of early
identification and home-intervention procedures, children with hearing
impairments were typically identified close to school age (3 to 5 years of
age) after they failed to learn language. Because of the substantial language
deprivation that had occurred by that time, these children were usually placed
in residential or day schools for the deaf, where they were taught by highly
structured language-teaching methods. A national demographic study conducted
by Gallaudet College for the 1968-1969 years indicated that 64% of all
children with hearing impairments who were less than 6 years of age were
236

placed in residential programs (typically state schools for the deaf) or day
schools for the deaf. Only 7% of such children were in regular school classes
and/or received special education services on a part-time basis. The
remaining 29% of the children in the Gallaudet study attended special
preschool programs that were not part of a larger system, such as a state
school for the deaf. More recent studies have been conducted on the placement
of children with hearing impairments (Schildroth, 1986; Singer, Butler, &
Walker, 1986), but information specifically related to the placement of
children who have had early home-based intervention has not been available.
For this investigacion, follow-up data were collected from site personnel
using the questionnaire discussed previously in Chapter 6 (see Appendix E).
Responses were obtained for 1,404 children for the program years 1986-1989
only.
Placement Immediately After Home-Based Programming
In Table 149 we present the frequencies and percentages of children for
the various placements. The largest percentage (39%) of the children were
placed in self-contained classrooms for the hearing impaired, with only 15%
placed in a day school for the hearing impaired, and 2% placed in residential
programs. Twelve percent were placed in mainstreamed/integrated classrooms
and another 2% were placed in Head Start/Home Start integrated preschools.
Small percentages of the children received other services (6%), individual
speech/language/auditory services (6%), or transition-program services (< 1%).
For 10% of the children (j 146), the site personnel did not know what
placement occurred immediately after home-based programming.
237

1Z)
Q1k
v
Centimeter1 2
9-
Inches
C-4?
6)e'
I r,
Association for Information and Image Management1100 Wayne Avenue. Suite 1100Silver Spring. Maryland 20910
301/587-8202
2
1 1 1
1.0
-6
10 11 12 13 14 15 mm
1.25 1.4
uui 6
MANUFACTURED TO AIIM STANDARDS
BY APPLIED IMAGE, INC.
5
(-\ot S§ /:,

Table 149
Frequencies and Percentages of Children for Placement After Home Programming,
1986-1989
Placement
Self-Contained Class for the Hearing Impaired 547 39
Day School for the Hearing Impaired 211 15
Mainstreamed/Integrated Classroom 167 12
Other Services 83 6
Class for Mentally Handicapped =12
Class for Severely Impaired =5
Non-Categorical Class =46
Developmentally Delayed Class =7
Other =13
Individual Speech/Language/Auditory Services 79 6
Head Start/Home Start/Preschool 34 2
Residential Program 31 2
In Home-No Services 22 2
Day Care 8 1
Transition Program 3 <1
Aid In Class =1
Itinerant Teacher =1
Callier =1
Hasn't Graduated 73 5
Unknown/Not Reported 146 10
Total 1404 100
238
Current Placement
For current program placement for these same children, a slightly
different pattern of placement was observed (Table 150). For 21% of the
children, site personnel reported a public-school placement (13%) or a
mainstreamed/integrated-classroom placement (8%). Twelve percent of the
children were placed in self-contained classes for the hearing impaired within
a public school setting. Smaller percentages were reported for day schools
for the hearing impaired (11%), day schools for the deaf and/or blind (8%),
and residential programs for the deaf (3%). For 24% of the children (n =
337), the site personnel either did not know the child's placement or did not
respond to the question.
Internal and External Validity
We have presented evidence that the program results were attributable to
SKI*HI intervention. Possible rival hypotheses to program effectiveness that
were studied and ruled out were: (a) Testing: The testing effect includes
teaching to the test or the practice effect. SKI*HI children did not take a
test per se. Instead, their communication skills were observed in their home
environment by the PA and the parent, and communication level was recorded on
the LDS testing form by the PA. Additionally, SKI*HI children were not
"taught the test". The PA taught the parents auditory, communication,
cognitive, aural/oral or total-communication facilitation skills. The parents
then provided the children with stimulation throughout the day in the home
environment; they did not teach the test. (b) Maturation: Children
consistently demonstrated greater average gains than would be expected due to
maturation alone, and the rate of development during intervention was greater
than developmental rate prior to intervention. (c) Selection: The threat of
selection to the internal validity of these findings was not applicable,
because there was no control or comparison group. (d) Attrition: All
children for whom there was both pre- and posttest data were used; there is no
reason to expect that SKI*HI children (a] who dropped out of the program prior
to posttest or [b] who entered the program mid-year and were only assessed
239

Table 150
Frequencies and Percentages of Children by Current Placement, 1986-1989
Current Placement N %
Public School 188 13
Self-Contained Class for Hearing Impaired 163 12
Day School for Hearing Impaired 157 11
Mainstreamed/Integrated Class 119 8
Day School for Deaf and/or Blind 111 8
Self-Contained Plus Other Classroom 44 3
Residential Program for the Deaf 42 3
Non-Categorical Self-Contained Classroom 38 3
Preschool for the Hearing Impaired 33 2
Preschool Plus Other Services 34 2
Mainstreamed Plus Other Services 24 2
Special Individual and Group Program 11 1Combinations
In Home-No Services 11 1
Program for Multiply Handicapped 10 1
Deceased 9 1
Not Graduated 73 5
Do Not Know/Moved 275 20
No Response/Cannot Tell 62 4
Total 1404 100
240
once during the year or (c] for whom PAs did not report posttest data differed
systematically from those who had both pre-and posttest data; (e)
Instrumentation: Parent advisors were trained to collect demographic, child,
and parent data, and instructions for completing the SKI*HI Data Sheet were
provided in the SKI*HI manual for PAs. The instrumentation question of
interest was whether the PAs' scores were reliable and valid (i.e., were the
PAs affected by knowing the children?). Inter-examiner agreement data were
available for scores from children used in the LDS test-validation study
(Tonelson & Watkins, 1979). And intercoder-agreement data were reported in
Chapter 4, indicating that coder agreement was high. (f) History: It is
possible that other events, in addition to SKI*HI treatment, accounted for
some of the gains. For 49% of the children, other services (e.g., preschool,
mental health, social, or speech therapy) were obtained by the parents of
children during SKI*HI programming. However, such services, as needed, were
part of the support services provided to SKI*HI children (see Figure 1). (g)
Regression: On average, SKI*HI children's LDS developmental quotients were
more than two standard deviations below the mean of 100 at the pretest, so
some regression toward the mean would be expected at posttest. A comparison
was made of roan developmental gain for children whose quotients were more
than one standard deviation below the mean at pretest with the mean
developmental gain for those children whose quotients were higher than one
standard deviation above the mean at pretest. For the receptive LDS scores,
the children with low pretest quotients had an average gain of 12.6 months and
the children with high pretest quotients had an average gain of 11.3 months.
For the expressive LDS scores, similar findings were obtained. The children
with low pretest quotients had an average gain of 11.8 months and the children
with high pretest quotients had an average gain of 11.1 months. The gains
were quite similar for the children whether their quotients were high or low
at the pretest. Even for children with high quotients at pretest, whose
posttest scores would have regressed in a negative direction, mean gains were
still substantial.
241
rij

With respect to external validity, the generalizability of program
results has clearly been well established. SKI*HI has been implemented in
widely diverse settings with racially and culturally different families.
Summary.
Some findings from this chapter will be highlighted here.
1. The relationships among the treatment variables (i.e., treatment
amount, treatment density, and communication methodology) and
demographic variables (presence of other handicaps, severity of
hearing loss, age at onset of hearing loss, language spoken in the
home, and presence of parental hearing loss) were all small.
2. Forty-nine percent of the children were receiving services in
addition to the home-based program. The vast majority of these
children were receiving educational services (e.g., preschool).
3. Overall, pre- to post-developmental gains in receptive and
expressive language were statistically significant and educationally
important, with large standardized mean differences. On average,
SKI*HI children made one month of language gain for every month of
intervention (medians = 1.3 months of expressive language gain per
month of treatment and 1.8 months of receptive language gain per
month of treatment).
4. Overall, the differences between actual posttest means and predicted
posttest means were statistically significant, with ...he actual
posttest means higher than what was predicted based on maturation
alone.
5. Overall, the median PCIs were large, with a rate of development
during intervention that was nearly twice the rate of development
prior to intervention.
6. Median pcis were largest for children without an additional
handicap.
7. For the receptive language scale, median pore were largest for
children with a sensorineural hearing loss and for children with
242

severe hearing losses.
8. For both scales, median PCIs were largest for children whose cause
of hearing loss was fever or infection and for children whose age at
onset was 2 to 3 years.
9. For both scales, median PCIs were smallest for children whose home
language was ASL, reflecting the fact that such children were
identified at an earlier age than children from homes in which other
languages were used and children from homes in which neither parent
was hearing impaired (see Chapter 6).
10. Median PCIs were largest for children who received treatment amounts
of 12 months or less and for children who received treatment four
times per month.
11. Mediar. PCIs were largest for children using total communication.
12. The regression of pretest scores on pretest chronological age
resulted in regression equations used to estimate each child's
amount of growth due to maturation alone. Overall, the mean gains
from pre- to posttest that were associated with maturation were 7.7
and 7.9 months for the expressive and receptive scales,
respectively. The mean gains over and above the gains associated
with maturation were 4.2 and 4.9 months for the expressive and
receptive scales, respectively.
13. The children evidenced increased full-time hearing aid use and
increased auditory, communication-language, and vocabulary
developmental levels during SKI*HI programming.
14. The parents evidenced increased ability to manage their children's
hearing handicap, to stimulate communication-language skills, and to
promote their children's cognitive development during SKI*HI
programming.
15. Immediately after home-based programming, 39% of the children were
placed in self-contained classrooms, with only 15% placed in day
schools for the hearing impaired and 2% placed in residential
243
programs.
16. The data for current program placement indicate that 21% of the
children were in a public school placement or a mainstreamed/
integrated classroom, with 12% placed in self-contained classes for
the hearing impaired. Nineteen percent of the '-hildren were placed
in day schools and 3% were in residential programs for the deaf.
Chapter Concluding Statement
In this chapter, we have presented the major results from the analyses of
the data from our population of children, as well as descriptive statistics
for the treatment variables. The findings demonstrate how SKI*HI programming
meets the needs of young hearing-impaired children and their families. The
results are positive! SKI*HI does equip families to manage their children's
handicap, communicate meaningfully with their children, and promote their
children's development, thus snab:ing hearing-impaired infants and toddlers to
make substantial developmental growth.
244
r.f a

CHAPTER 8
SUMMARY, CONCLUSIONS, AND DISSEMINATION OF FINDINGS
SKI*HI is a home-based program for infants and young children with
hearing impairments and for their families. The major goals of the program
are to identify hearing-impaired children as close to birth as possible and to
provide them and their families with complete home programming that will
facilitate development. The delivery model for the program includes
identification/screening services, home-visit services, support services, and
program management. The "heart" of the service is provided by a parent
advisor, who makes weekly home visits to families. The parent advisor works
closely with parents and with other members of a multi-disciplinary team to
assess, plan, and provide appropriate home-based services for all family
members.
In this chapter a brief overview of the purpose and design of the study
is provided. Next, the results and conclusions are summarized. Finally,
dissemination activities that have occurred and that are planned will be
reported, followed by a concluding statement.
Study Overview
As noted in Chapter 1, previous reports on the demographics of children
with hearing impairments, identifications procedures, and effectiveness of
home-based programming have been limited to findings for small numbers of
children being served in specific regions over a brief time span. The SKI*HI
National Data Bank was initiated in 1979 and by the completion of this
investigation contained information on more than 5,000 hearing-impaired
children (ages 0 through 5 years of age) and their families. The problem
addressed by this research project was the lack of a complete analysis and
synthesis of the information in the National Data Bark for educators of
children with hearing impairments and for researchers.
Purpose
The general purpose of the project was to provide research findings on
critical areas of home-based programming for hearing-impaired children and
245
r: 4C.4. t

their families. The specific objectives were (a) to describe the demographic
characteristics of the children who received home-based intervention and to
study the relationship of these characteristics with child achievement; (b) to
study the effectiveness of identification procedures for hearing loss; and (c)
to investigate aspects of home-based intervention, including amount,
intensity, and time of program start, on the language development of infants
and young children with hearing impairments.
Design
A pretest/posttest, single-group design was used rather than a
comparison-group design. To control for maturation, the pre/post gains of the
children were studied using predictive models.
Sample
From July 1979 through June 1991, personnel from 143 different agencies,
representing 30 states and one Canadian province, submitted data on 5,178
hearing-impaired children (ages 0 through 5 years) and on their families. All
data submitted to the NLtional Data Bank were included in the analyses.
For the identification-procedure data and for the follow-up data related
to placement after SKI*HI, personnel from 45 different agencies, representing
15 states, submitted data for 1,404 children. These data were collected for
the July 1986 through June 1989 program years.
Instruments and Procedures
Demographic, test, and parent/child data were collected using the SKI*HI
Data Sheet. Identification-procedure and program-placement data were
collected using a questionnaire specifically developed for the study. The
standardized language-asee3sment instrument was the Language Development
Scale.
Data Collection
Demographic, test, and parent/child data were collected by trained
parent advisors and were submitted to the site coordinators, who then
submitted the data to the National Data Bank. Identification-procedure and
program-placement data were collected by the site coordinators and then were
246

submitted to the National Data Bank. All data coding and entry was checked
for accuracy.
Data Analysis
For demographic, identification, and treatment variables, descriptive
statistics and two-way frequency tables were presented. The analyses of child
progress controlled for maturation through the use of four different, but
related, approaches: (a) mean posttest scores were compared with mean
predicted posttest scores; (b) intervention developmental rate was compared
with pretest developmental rate using PCIs; (c) growth associated with
maturation was compared with the growth over and above maturation using value-
added analysis; and (d) the o?timal linear combination of treatment variables
for predicting language development rate during intervention was determined
using multiple regression.
Results and Conclusions
Demographic
The demographic characteristics studied were gender, race, presence/
absence of other handicapping conditions, type of hearing loss, severity of
hearing loss, cause of hearing loss, age at onset of hearing loss, language
spoken in the home, and presence/absence of parent with a hearing loss. A
summary of the findings follow:
1. Gender. Overall, 55% of the children were males and 45% were
feoales. The relative percentages varied only slightly across the
program years. Only small coefficients were obtained describing
the relationships between gender and the other demographic
variables.
2. Ethnicity. Overall, 72% of the children were Caucasian. The
remaining 28% were primarily of African-, Spanish-, Native-, or
Asian-American descent. The relative percentages of each ethnic
group did not differ significantly across the program years. Only
small coefficients were obtained describing the relationships
between ethnicity and the other demographic variables.
247
3. Additional handicap. Overall, 25% of the children had an
additional handicapping condition. Little variation in the
percentage was observed across the program years. A low
association between presence of an additional handicap and cause
of loss was observed. Not surprisingly, children whose cause of
loss was a birth defect or a child syndrome tended to have
additional handicapping conditions.
4. Type of hearing loss. The vast majority (82%) of the children had
sensorineural hearing losses. The relative percentages for the
types of hearing loss varied little across the program years. A
low association between type of hearing loss and severity of
hearing loss was observed. Not surprisingly, children with no
loss and mild losses tended to have conductive hearing losses.
Also, a moderate association between type of hearing loss and
cause of loss was observed. Children whose cause of loss was
middle-ear problems or birth defects (e.g., atresia) tended to
have conductive hearing losses.
5. Severity of hearing loss. Overall, the mean and median hearing
thresholds were 74 dB and 75 dB, respectively; 50% of the children
had hearing losses in the severe-to-profound range. The relative
percentages for the hearing-loss-severity levels varied little
across the program years. As mentioned above, in Number 4, a
small relationship between severity of hearing loss and type of
loss was observed. In addition, a small relationship between
severity of hearing loss and cause of hearing loss was observed.
Not surprisingly, children whose cause of loss was middle-ear
problems or birth defects tended to have almost no loss or mild
losses.
6. Cause of hearing loss. The cause of hearing loss was unknown for
50% of the children. Of the known causes of hearing loss,
meningitis and heredity were the most frequently reported causes.
248
Approximately 20% of the hearing losses, from both known and
unknown causes, occurred after birth. The relative percentages
for the causes of hearing loss varied little across the program
years. As mentioned above, a low degree of association between
cause of hearing loss and presence of other handicaps was
observed, as well as a moderate association between cause of
hearing loss and type of hearing loss and a low association
between cause of hearing loss and severity of loss.
7. Age at onset. For 96% of the children, the age at onset was two
years or less. The relative percentages for the age-at-onset
levels varied little across the program years. The association
between age at onset and cause of hearing loss was moderate,
reflecting fewer children with onset of hearing loss at birth
whose hearing losses were caused by meningitis, and fewer children
with onset of hearing loss after birth whose losses were caused
prenatal factors.
8. Language spoken in the home. For 90% of the children, the
language spoken in the home was English. The relative percentages
f'r the languages varied little across the program years. The
association between language spoken in the home and cause of
hearing loss was low, reflecting the larger-than-expected
frequencies of children whose cause of hearing loss was heredity
and who came from homes in which ASL was the primary language.
The association between language spoken in the home and ethnicity
was low, reflecting the finding that Spanish was the language
spoken in the homes of children who were Spanish-American.
Neither finding was surprising.
9. Parental hearing loss. For 9% of the children, one or both
parents were also hearing impaired. The relative percentages of
parental hearing loss varied little across the program years. The
association between presence of parental hearing loss and cause of
249
loss was moderate, reflecting the larger-than-expected frequencies
of children with a hearing-impaired parent and for whom heredity
was the cause of hearing loss. Also, the association between
presence of parental hearing loss and language spoken in the home
was moderate, reflecting larger-than-expected frequencies of
children with a hearing-impaired parent whose primary language in
the home was ASL. Again, neither of these findings was
surprising.
The relationships between each of the demographic variables and pretest
expressive and receptive language quotients were also studied. Overall, the
mean expressive language pretest quotient was 56; the mean receptive language
pretest quotient was 60. The relationships are summarized here.
1. Gender. Males and females did not differ significantly with
respect to pretest expressive and receptive language quotients.
2. Ethnicity. For the exrrgssive scale, Caucasian children obtained
significantly higher mean pretest quotients than African- or
Spanish-American children. For the receptive scale, Caucasian
children obtained significantly higher mean pretest quotients than
African-, Asian-, or Spanish-American children.
3. Other handicap. Children without an additional handicap obtained
significantly higher mean pretest quotients than children without
additional handicaps.
4. Type of hearinc as. Children with conductive hearing losses
obtained significantly higher mean pretest quotients than children
with sensorineural or mixed losses.
5. Severity of hearing loss. Children with no losses, mild losses,
and moderate losses obtained significantly higher mean pretest
quotients than children with severe or profound hearing losses.
6. Cause of hearing_loss. For the expressive scale, children whose
hearing losses were caused by heredity or by a syndrome obtained
the highest mean pretest quotients. For the receptive scale,
250

children whose hearing losses were caused by heredity, middle-ear
infections, or by a syndrome obtained the highest mean pretest
quotients.
7. Age at onset. Children whose onset of hearing loss was at birth
obtained significantly higher mean pretest quotients than children
whose onset was between birth and one year of age.
8. Language spoken in the home. Children whose home language was ASL
obtained significantly higher mean pretest quotients than children
whose home language was Spanish, English, or other.
9. Presence of hearing-impaired parent. Children for whom one or
both parents had a hearing loss obtained significantly higher mean
pretest quotients than children without a hearing-impaired parent.
10. Correlation ratios (Eta2) which indicate the proportion of
variability among the pretest quotients associated with each of
the demographic variables were small, leading to the conclusion
that there was little relationship between pretest quotients and
the demographic variables.
11. Standardized mean differences (SMDs), which indicate the magnitude
of the differences between means and are independent of sample
size (unlike indices of statistical significance), were small to
medium for the most part. For example, the mean pretest quotients
of children without additional handicaps were approximately 1/3 of
a standard deviation larger than the mean pretest quotients of
children with additional handicaps. Although this difference was
statistically significant, the difference between the means was,
from an educational perspective, very small.
12. The only large SMDs were obtained for children whose home language
was ASL as compared to children whose home language was Spanish,
English, or other. The largest SMD (.94) described the difference
between the mean pretest quotients of children whose home language
was ASL and children whose home language was Spanish--a difference
251
of nearly one full standard deviation. It should be noted that
the standard deviations were largest for children whose home
language was ASL, indicating greater variability among the pretest
quotients than for the children whose home language was Spanish.
Identification Procedures
The identification variables studied were identification age, program-
start age, hearing-aid-fit age, suspicion-to-identification time interval,
identification-to-program-start time interval, suspicion-to-program-start time
4nterval, identification procedure, who suspected the hearing loss, and cause
of suspicion. A summary of the findings follow:
1. Overall, the median identification age was 17 months, with a
median hearing-aid fit age of 22 months and a median program-start
age of 25 months.
2. For children with additional handicapping conditions, the median
identification age was 12 months, with a median hearing-aid fit
age of 19 months and a median program-start age of 22 months.
3. For profoundly impaired children, the median identification age
was 15 months, with a median hearing-aid-fit age of 19 months and
a median program-start age of 21 months.
4. For children whose cause of hearing loss was a known risk factor
or was visually apparent at birth, the median identification age
ranged from 9 to 16.5 months; the median hearing-aid-fit age
ranged from 17 to 19 months; and the median program-start-age
ranged from 18 to 24 months.
5. For children whose age at onset was at birth or from birth to one
year, the median identification age was 12 months, with a median
hearing-aid-fit age of 18 months and a median program-start age of
21 months.
6. For children from homes in which ASL and signed English were the
primary languages, the median identification ages were 8 and 13
months, respectively; the median hearing-aid-fit ages were 16 and
252
301

18.5 months, respectively; and the median program-start ages were
15 and 20.5 months, respectively.
7. For children with a hearing-impaired parent, the median
identification age was 12 months, with a median hearing-aid-fit
age of 19 months and a median program-start age of 21 months.
8. Overall, the median suspicion-to-identification time interval was
3 months, with a median identification-to-program-start interval
of 4 months and a median suspicion-to-program-start interval of 9
months.
9. The median suspicion-to-identification time interval was smallest
(1 month) for children whose cause of hearing loss was meningitis
or defects at birth.
10. The median suspicion-to-identification time interval was also
smallest (1 month), as was the median identification-to-program-
start interval (2.5 months), for children whose age at onset was
two years or older. The median suspicion-to-program-start
interval was smallest (5 to 6 months) for children whose age at
onset was one year or older.
11. The median identification-to-program-start time interval was
largest (6 months) for children whose cause of loss was a
syndrome.
12. The median identification-to-program-start time interval was also
largest (6 months), as was the median suspicion-to-program-start
time interval (13 months), for children from homes in which
languages other than English and Spanish were spoken.
13. The median suspicion-to-program-start interval was largest (13
months) for children whose cause of hearing loss was conditions
during pregnancy (e.g., prematurity) and birth trauma.
14. The majority of the hearing losses (60%) were first suspected by
caregivers.
15. Earliest identification ages, program-start ages, and hearing-aid-
253

fit ages were associated with health/human-services and medical
personnel.
16. The shortest time intervals between suspicion and identification
were associated with medical and health/human-services personnel.
17. The median time interval from identification to program start was
shortest for other specialists - -85% of whom were audiologists.
18. The majority of the children were identified by people
(caregivers, medical and health/human-services personnel,
educators, and other specialists) rather than by screening
procedures using behavioral audiometry, ABR, Crib-O-Gram, or
middle ear/immittance.
19. Although no direct documentation was obtained, indirect evidence
indicates that for Utah children, the high-risk register may have
accounted for the large percentage of children who were identified
by four to eight months of age.
20. Sample sizes were extremely small for the Crib-O-Gram, behavior
audiometry, and middle-ear/immittance identification procedures.
Consequently, no conclusive evidence can be presented regarding
which procedures resulted in the youngest identification, program-
start, and hearing-aid-fit ages or the smallest suspicion-to-
identification, identification-to-program-start, and suspicion-to-
program-start time intervals.
21. Using multiple-regression analyses, with all age and time-interval
variables included in the procedure, only program-start age served
as a predictor of pretest expressive and receptive language
quotients. The multiple Rs were low.
Program Effectiveness
The treatment variables studied were treatment amount, planned and
actual treatment density, communication methodology, communication-methodology
age, program-start-to-communication-methodology interval, and other non-
parent/infant-program services. A summary of the findings follows:
254

1. The relationships among the treatment variables (i.e., treatment
amount, treatment density, and communication methodology) and
demographic variables (presence of other handicaps, severity of
hearing loss, age at onset of hearing loss, language spoken in the
home, and presence of parental hearing loss) were all small.
2. Forty-nine percent of the children were receiving services in
addition to the home-based program. The vast majority of these
children were receiving educational services (e.g., preschool).
3. Overall, pre- to post-developmental gains in receptive and
expressive language were statistically significant and
educationally important, with large standardized mean differences.
On average, SKI*HI children made one month of language gain for
every month of intervention (medians = 1.3 months of expressive
language gain per month of treatment and 1.8 months of receptive
language gain per month of treatment).
4. Overall, the difference between actual posttest means and
predicted posttest means were statistically significant, with the
actual posttest means higher than what was predicted based on
maturation alone.
5. Overall, the median PCIs were large, with a rate of development
during intervention that was nearly twice the rate of development
prior to intervention.
6. Median PCIs were largest for children without an additional
handicap.
7. For the receptive language scale, median PCIs were largest for
children with a sensorineural hearing loss and for children with
severe hearing losses.
8. For both scales, median PCIs were largest for children whose cause
of hearing loss was fever or infection and for children whose age
at onset was 2 to 3 years.
9. For both scales, median EgIs were smallest for children whose homo
255

language was ASL, reflecting the fact that such children were
identified at an earlier age than children from homes in which
other languages were used and children from homes in which neither
parent was hearing impaired (see Chapter 6).
10. Median PCIe were largest for children who received treatment
amounts of 12 months or less and for children who received
treatment four times per month.
11. Median PCIs were largest for children using total communication.
12. The regression of pretest scores on pretest chronological age
resulted in regression equations used to estimate each child's
amount of growth due to maturation alone. Overall, the mean gains
from pre- to posttest that were associated with maturation were
7.7 and 7.9 months for the expressive and receptive scales,
respectively. The mean gains over and above the gains associated
with maturation were 4.2 and 4.9 months for the expressive and
receptive scales, .7espectively.
13. The children evidenced increased full-time hearing aid use and
increased auditory, communication-language, and vocabulary
developmental levels during SKI*HI programming.
14. The parents evidenced increased ability to manage their children's
hearing handicap, to stimulate communication-language skills, and
to promote their children's cognitive development during SKI*HI
programming.
15. Immediately after home-based programming, 39% of the children were
placed in self-contained classrooms, with only 15% placed in day
schools for the hearing impaired and 2% placed in residential
programs.
16. The data for current program placement indicate that 21% of the
children were in a public school placement or a mainstreamed/
integrated classroom, with 12% placed in self-contained classes
for the hearing impaired. Nineteen percent of the children were
256
placed in day schools and 3% were in residential programs for the
deaf.
Dissemination of Findings
The general purpose of this project was to disseminate the research
findings to educators of children with hearing impairments and to researchers.
Following are the dissemination activities that have occurred and that are
planned for the near future.
Dissemination Activities Accomplished
A letter (Appendix I) and an individualized site report (see Appendix J
for an example) were mailed to key personnel representing the individual,
agencies and states that participated in the National Data Bank. A total of
130 reports were mailed.
A copy of the final report has been mailed to the ERIC Document
Reproduction Service for citation in the ERIC database.
The following presentations have been made to date:
1. Presentation at the request of the Office of Special Education by
the Projec+1 Director, Dr. Thomas C. Clark, at the National Meeting
of State Directors of Special Education, Spring 1991, Washington,
DC.
2. Presentation by the Project Director, Dr. Thomas C. Clark:
Keynote address at the Southeast Regional Conference of Early
Intervention Programs Serving Families of Children with Sensory
Impairments, April 1992, Birmingham, AL.
3. Presentation by the Project Director, Dr. Thomas C. Clark: Summary
data presented at the Southwestern Regional Conference of SKI*HI
and INSITE Programs, August 1991, Durango, CO.
4. Presentation by the Project Director, Dr. Thomas C. Clark: Data
presented at the North Central Regional Conference of Early
Intervention Programs, July 1992, St. Paul, MN.
5. Presentation by the Project Director, Dr. Thomas C. Clark:
Keynote address at the Texas Statewide Conference on Education of
257

the Deaf, August 1992, San Antonio, TX.
6. Presentation by Don G. Barringer, Assistant Director, SKI*HI
Institute: Regular session at the Council for Exceptional
Children, May 1992, Baltimore, MD.
7. Presentation by the Research Director, Dr. Carol J. Strong, at the
Utah Preschool Conference, May 1991, SLC, UT.
8. Presentation by the Research Director, Dr. Carol J. Strong, to the
Institutional Council of the Utah Schools for the Deaf and the
Blind, Spring 1991, SLC, UT.
9. Presentation by the Research Director, Dr. Carol J. Strong, to the
Utah Parent/Infant Program parent advisors, Spring 1991, Ogden,
UT.
Dissemination Activities Planned
1. A miniseminar proposal was submitted by Dr. Carol J. Strong,
Research Director, and was accepted for presentation at the
American Speech-Language-Hearing Association (ASHA) conference in
November 1992, San Antonio, TX.
2. During the next year, at least three articles will be written and
submitted to refereed journals. These articles will focus on the
three major thrusts of this research: demographics,
identification procedures, and program effectiveness.
3. A color-slide presentation is currently being developed to
facilitate presentation of the data at conferences.
Concluding Statement
The major accomplishments of SKI*HI were (a) that SKI*HI children showed
higher rates of development during intervention than prior to intervention and
greater gains in receptive and expressive language development than would be
expected due to maturation alone (in addition to which they showed pre- to
posttest developmental gains that were statistically significant and that
yielded effect sizes indicating important practical effects); (b) that SKI*HI
children showed increased auditory, communication-language, and vocabulary
258

developmental levels and increased full-time hearing aid use; (C) that SKI*HI
parents showed increased ability to manage their child's hearing handicap,
communicate meaningfully with their child, and promote their child's cognitive
development; and (d) that SKI*HI children were identified at an early age and
beaan to receive home programming services promptly after identification.
We have summarized the demographic, identification-procedure, and
program-effectiveness information in the National Data Bank. The data,
submitted from throughout the United States and one Canadian province,
represent children who were culturally and ethnically diverse. It is likely,
then, that the findings reported here can be generalized to all children
participating in SKI*HI home-based programming for whom data were not
submitted to the National Data Bank. Generalizability of the findings beyond
such children is left to the reader. In conclusion, then, this study has
provided important information regaraing the demographics, identification
procedures, and program effectiveness of home-based programming for hearing-
impaired children and their families.
259

REFERENCES
Abramovich, S. J., Hyde, M. L., Riko, K., & Alberti, P. W. (1987). Earlydetection of hearing loss in high-risk children using brainstem electricalresponse audiometry. Journal of Larvnaoloav and Otology, 19E1(2), 120-126.
Allen, T. E. (1986). Patterns of academic achievement among hearing impairedstudents: 1974 and 1983. In A. N. Schildroth & M. A. Karchmer (Ede.), Deafchildren in America, Boston: Little, Brown & Co., Inc.
Bagnato, S. J., & Neiswortl, J. T. (1980). The intervention efficiency index:An approach to preschool program accountability. Exceptional Children, 46,264-269.
Bailey, D. B., & Simeonsson, R. J. (1988). Family assessment in earlyintervention. Columbus, OH: Merrill Pub. Co.
Balow, I. H., & Brill, R. G. (1975). An evaluation of reading and academicachievement levels of 16 graduating classes of the California School for theDeaf, Riverside. The Volta Review, 77, 266-276.
Becker, S. (1976). Initial concern and action in the detection and diagnosis ofa hearing impairment in the child. The Volta Review, 78, 105-115.
Bess, F. H., & McConnell, F. E. (1981). Audiology, education, and the hearingimpaired child. St. Louis, MO: C. V. Mosby.
Blair, J. D. (1981). Assisting parents through the mourning process.Unpublished manuscript. Utah State University, Department of CommunicativeDisorders, Logan, Utah.
Bonfils, P., Uziel, A., & Pujol, R. (1988). Screening for auditory dysfunction ininfants by evoked otoacoustic emissions. Arch Otolarvngol Head Neck Surgery,114.
Brasel, K. E., & Quigley, S. P. (1977). Influence of certain language andcommunication environments in early childhood on the development of languagein deaf individuals. Journal of Speech and Hearing Research, 2g, 96-107.
Bryk, A. S., & Weisberg, H. I. (1976). Value-added analysis: A dynamicapproach to the estimation of treatment effects. Journal of EducationalStatistics, 1(2), 127-155.
Bryk, A., & Woods, Euse in short-term
Clark, T. C. (1979).hearing-impairedNorth Carolina.
(1980). An introduction to the value-added model and itsimpact assessment. Cambridge, MA: The Huron Institute.
Language development through home intervention for infantchildren. Unpublished doctoral dissertation, University of(University Microfilms International No. 80-13, 924).
Clark, T. C. (1988). Effects of hearing impairment on language. Unpublishedclass notes. Utah State University, Department of Communicative Disorders,Programming for Hearing Impaired Children, Logan, Utah.
Clark, T. C. (1989). Nome-based Programming for families of handicapped infantsand young children. Utah State University, HOPE, Inc., Logan, Utah.
Clark, T. C., & Watkins, S. (1985). Programming for hearing impaired infantsthrough home intervention: SKI*HI home visit curriculum (4th ed.). Logan,UT: SKI*HI Institute, Department of Communicative Disorders, Utah StateUniversity.
260
,J

Cohen, J. (1988). Statistical power analysis for the behavioral sciences.Hillsdale, NJ: Lawrence Eribaum Associates.
Commission on Education of the Deaf. (1988, February). Toward eaualit-:Education of the deaf. Washington, DC: Author.
Coplan, J. (1987). Deafness: Ever heard of it? Delayed recognition of permanenthearing loss. Pediatrics, 79(2), 206-213.
Cox, L. C., Hack, M., & Metz, D. A. (1984). Longitudinal ABR in the NICU infant.International Journal of Pediatric Otorhinolarvnaology, 4, 225-231.
Craig, W. N. (1964). Effects of preschool training on the development of readingand lipreading skills of deaf children. American Annals of the Deaf, 109,280-296.
Elssmann, S. F., Matkin, N. D., Sabo, M. P. (1987). Early identification ofcongenital sensorineural hearing impairment. The Hearing Journal, 13-17.
Featherstone, H. (1980). A difference in the family. New York: Penguin Books.
Fria, T. J. (1985). Identification of congenital hearing loss with the auditorybrainstem response. In J. T. Jacobson, (Ed.), The auditory brainstem response(pp. 317-336). San Diego: College Hill Press.
Galambos, R., Hicks, G. E., & Wilson, M. J. (1984). The auditory brainstemresponse reliably predicts hearing loss in graduates of a tertiary intensivecare nursery. Ear and Hearing, 5(4), 254-260.
Gallaudet University. (1991). Regional and national summary: Annual survey ofhearing impaired children and youth. Center for Assessment and DemographicStudies: Washington, D.C.
Garrity, J. H., & Mengle, H. (1983). Early identification of hearing loss:Practices and procedures. American Annals of the Deaf, lab, 1-4, 99-106.
Gerber, S. E., & Mencher, G. T. (Eds.) (1983). The development of auditorybehavior. New York: Grune & Stratton.
Grant, J. (1987). The hearing impaired: Birth to six. Boston: College-HillPress.
Greenberg, M. T.. Calderon, R., & Kuscne, C. (1984). Early intervention usingsimultaneous communication with deaf infants. Child Development, .aa, 607-616.
Greenstein, J. M, Greenstein, B. B., McConville, K., & Stellini, L. (1975).Mother-infant communication and language acquisition in deaf infants. NewYork: Lexington School for the Deaf.
Gustason, G. (1989). Early identification of hearing impaired infants: A reviewof Israeli and American progress. The Volta Review, 21, 291-296.
Hebbeler, K. M. (1985). iimproach of the preschool evaluation Protect to:gieeffectissfglx].vneso,ytntmpntj&nneasurintl. Paper presented at themeeting of the Council for Exceptional Children, Anaheim, CA. (ERIC DocumentReproduction Service No. ED 259 485)
Jacobson, J. T., & Jacobson, C. A. (1987). Application of test performancecharacteristics in newborn auditory screening. Seminars in Hearing, 8(2),133-141.
261

Jaffe, B. F. (Ed.) (1977). Hearing loss in children: A comprehensive text.Baltimore: University Park Press.
Jensema, C. J., Karchmer, M. A., & Trybus, R. J. (1978). The rated speechintelligibility of hearing impaired children: Basic relationships and adetailed analysis. (Office of Demographic Studies, Series R., No. 5).Washington, DC: Gallaudet College.
Johnson, N. J., & Elberling, C. (1982). Evoked acoustic emissions from the humanear. Scandanavia Audioloav, 11, 3-12.
Joint Committee on Infant Hearing. (1982). Position statement. Pediatrics, 70,496-497.
Levitt, H., McGarr, N. S., & Geffner, D. (1986). Introduction. In H. Levitt, N.S. McGarr, & D. Geffner (Eds.), Development of language and communicationskills in hearing-impaired children (ASHA Monograph), Washington, DC: AmericanSpeech-Language-Hearing Association.
Liff, S. (1973). Early intervention and language development in hearing impairedchildren. Unpublished master's thesis, Vanderbilt University, Nashville, TN.
Luterman, D. M. (1979). Counseling parents of hearing impaired children.Boston: Little, Brown and Company.
Luterman, D. M. (1987). Deafness in the family. Boston: College-Hill Press.
Madell, J. R. (1988). Identification and treatment of very young children withhearing loss. Infants and young children, 1(2), 20-30.
Mahoney, T. M. (1984). High-risk hearing screening of large general newbornpopulations. Seminars in Hearing, 5(1), 25-37.
Mahoney, T. M., & Eichwald, J. G. (1986). The ups and downs of high-risk hearingscreening: The Utah statewide program. Seminars in Hearing, $(2), 155-163.
Malkin, S. F., Freeman, R. D., & Hastings, J. 0. (1976). Psychosocial problems ofdeaf children and their families: A comparative study. Audiological HearingEducation, 2, 21-99.
Malphurs, O., Jr. (1989). Infant hearing screening in Mississippi. Journal ofthe Mississippi State Medical Association, 2g(8), 245-248.
Markowitz, J. B., Hebbeler, K., Larson, J. C., Cooper, J. A., & Edmister, P.(1991). Using value-added analysis to examilse short-term effects of earlyintervention. Journal of Early Intervention, ri, 377-389.
Mauk, G. (1990, May). Jetrospective Survey of Identification of HearingImpairment in Children. Paper presented at the meeting of the Utah Speech-Language-Hearing Association, Park City, Utah.
Mauk, G. W., White, K. R., Mortensen, L. B., & Behrens, T. R. (1991). Theeffectiveness of screening programs based on high-risk characteristics inearly identification of hearing impairment. Bar and Hearing, la, 312-319.
McAnnally, P., Rose, S., & Quigley, S. (1987). Language learning practices withdeaf children. Boston: College-Hill Press.
McConnell, F. (1974). The parent teaching home: An early intervention programfor hearing-impaired children. Peabody Journal of Education, 51, 162-170.
262

Meadow, K. P. (1980). Deafness and child development. Los Angeles: Universityof California Press.
Meadow-Orlans, K. P. (1987). An analysis of the effectiveness of earlyintervention programs for hearing-impaired children. In M. T. Guralnick & F.C. Bennett (Eds.), The effectiveness of early intervention for at-risk andhandicapped children. Orlando, FL: Academic Press.
Moore, W. G., Josephson, J. A., & Sauk, G. W. (1991). Identification of childrenwith hearing impairments: A baseline survey. The Volta Review, 93, 187-196.
Moores, D. (1987). Educating the deaf. Boston: Houghton Mifflin Co.
Moores, D. F., Weiss, K. L., & Goodwin, M. W. (1978). Early education programsfor hearing-impaired children: Major findings. American Annals of the Deaf,123, 925-936.
Musselman, C. L., Lindsay, P. H., & Wilson, A. (1985). Linguistic and socialdevelopment in preschool deaf children. Toronto, Ontario: Ministry ofColleges and Universities.
Northern, J. L., & Downs, M. P. (1984). Hearing in children, 3rd ed. Baltimore:Williams & Wilkins.
Northern, J. L., & Gerkin, K. P. (1989). New technology in infant hearingscreening. Otolarvngologlz. Clinics of North America, 22(1), 75-87.
Oiler, D. K. (1985). Infant vocalizations. In S. Harel & N. J. Anastasiow(Eds.), The at-risk infant. Baltimore: Paul H. Brooks Pub. Co.
Parving, A. (1985). Hearing disorders in childhood: Some procedures fordetection, identification, and diagnostic evaluation. International Journalof Pediatric Otorhinolaryngology, 9, 31-57.
Quigley, S. P. (1969). The influence of fingerspelling on the development oflanguage, communication, and educational achievement in deaf children.Urbana, IL: University of Illinois.
Quigley, S. P. (1978). Effects of early hearing impairment on normal languagedevelopment. In F. N. Martin (Ed.), Pediatric audiology. Englewood Cliffs,NJ: Prentice-Hall, Inc.
Quigley, S. P., & Paul, P. V. (1986). A perspective on academic achievement.In D. M. Luterman (Ed.), Deafness in perspective. San Diego, CA: College-Hill Press.
Ramey, C. T., & Trohanis, P. L. (Eds.) (1982). Finding and educating high -riskand handicapped irfants. Baltimore: University Park Press.
Ries, F. W., & Voneiff, P. (1974). Demographic profile of hearing impairedstudents. PRWAD Annual. Office of Demographic Studies: Gallaudet College,Washington, DC.
Sanders, D. M. (1988). Teaching deaf children. Boston: College-Hill Press.
Schildroth, A. (1986). Hearing impaired children under 6: 1977 and 1984.American Annals of the Deaf, 121(2), 85-90.
Shah, C. P., Chandler, D., & Dale, R. (1978). Delay in referral of children withimpaired hearing. The Volta Review, AQ(4), 206-215.
263

Shaver, J. P. (1985a). Chance and nonsense: Atests of statistical significance, Part 1.
Shaver, J. P. (1985b). Chance and nonsense: Atests of statistical significance, Part 2.
conversation about interpretingPhi Delta Kappan, 67, 57-60.
conversation, about interpretingPhi Delta Kappan, 67, 138-141.
Shaver, J. P. (1992). What statistical significance testing is, and what it isnot. Paper presented at the annual meeting of the American EducationalResearch Association, San Francisco, CA.
Sheehan, R. (1979). Mild to moderately handicapped preschoolers: How do youselect child assessment procedures? In T. Black (Ed.), Perspectives onmeasurement: A collection of readings for educators of young handicappedchildren. Chapel Hill, NC: Technical Assistance' Development System.
Shonkoff, J. P., & Hauser -Cram, P. (1989). Chances in children and familiesafter one year of early intervention: Data from Phase I of the EarlyIntervention Collaborative Study. Paper presented at the 6th BiennialNational Training Institute, National Center for Clinical Infant Programs,Washington, DC.
Simmons, P. B. (1978). Identification of hearing loss in infants and youngchildren. Otolaryngologic Clinics of North America, 11(1), 19-28.
Simmons-Martin, A. (1983). Salient features from the literature, withimplications for parent-infant programming. American Annals of the Deaf,128(2), 107-117.
Singer, J. D., Butler, J., & Walker, D. (1986). Characteristics of specialeducation placements: Findings from probability samples in five metropolitanschool districts. Journal of Special Education, 20(3), 319-337.
Stein, L., Clark, S., & Kraus, N. (1983). The hearing impaired infant:Patterns of identification and habilitation. Ear and Hearing, 4, 232-236.
Stevens, J. C., Webb, H. D., Smith, M. F., & Buffin, J. T. (1990). The effect ofstimulus level on click evoked responses in neonates under intensive care.British Journal of Audiology, ZA, 293-300.
Stoneman, A., & Brody, G. H. (1984). Research with families of severelyhandicapped children: Theoretical and methodological considerations. In J.Blacher (Ed.), Young severely handicapped children and their families (pp.179-214). New York
Tingey, C. (1988). Down syndrome: A resource book. Boston: College-Hill Press.
Tonelson, S., & Watkins, S. (1979). Instruction manual for the SKI*HI LanguageDevelopment Scale: Assessment of language skills for hearing impairedchildren from infancy to five years of ace. Logan, UT: SKI*HI Institute,'1;zah State University.
Turnbull, H., & Turnbull, A. (1986). Families, professionals andexggptionalitv: A special partnership. Columbus, OH: Merrill Pub. Co.
U. S. Department of Health and Human Services. (1990). Healthy people 2000%National health promotion and disease prevention obiectives. Washington,D.C.: Public Health Service.
Watkins, S. (1987). Long term effects of home intervention with hearing-impairedchildren. American Annals of the Deaf, 132(4), 267-271.
264

Weisberg, H. I. (1974). Short-term cognitive effects of Head Start Programs: Areport on the third year of planned variation--1971-72. Cambridge, MA: TheHuron Institute.
Welkowitz, J., Ewen, R. B., & Cohen, J. (1982). Introductory statistics for thebehavioral sciences (3rd ed.). New York: Harcourt Brace Jov-emovich.
White, K. R., & Pezzino, J. (1986). Ethical, practical, and scientificconsiderations of randomized experiments in early childhood special education.Topics in Early Childhood Special Education, 6(3), 100-116.
White, S., & White, R. (1986). The effects of hearing status of the family andage of intervention on reception and expressive oral language skills inhearing-impaired infants. In H. Levitt, N. S. McGarr, & D. Geffner (Eds.),Development of language and communication skills in hearing-impaired children(ASHA Monograph), Washington, DC: American Speech-Language-HearingAssociation.
Wolery, M. (1983). Proportional change index: An alternative for comparingchild change data. Exceptional Children, 50, 167-170.
Wolery, M., & Bailey, D. B. (1984). Alternatives to impact evaluations:Suggestions for program evaluation in early intervention. Journal of theDivision for Early Childhood, 9, 27-36.
Young, N. B. (1976). Identification of hearing impairment in infants: A model forcase finding. Proceedings of a Conference on Early Assessment ofCommunicative Disorders in Children. Portland, OR: University of OregonHealth Sciences Center, Child Development and Rehabilitation Center.
265

APPENDICES
266

I..
Chi
ld'i
Nam
e'A
iM
I N
ilIO
N IN
Ma
NM
EM
IIO
NM
IIn
Ma
MI
MN
SIM
MN
NW
MIA
MI I
n M
N M
N N
ig a
n an
NM
In M
NSW
101
1W
IMO
n M
al W
M IN
NM
aM
aO
M M
IO
n W
M M
B M
aIn
WM
WE
MI N
MI
SK
I*H
I DA
TA
SH
EE
T
DE
MO
GR
AP
HIC
S1
1. S
ite P
refix
(3
lette
rs)
2 C
hild
IDe
3 D
ate
of b
irth
4 S
axS
Pro
gram
Sta
rt D
ate
6. D
ate
of ID
7 O
ther
han
dica
ps
S. D
ate
Hea
ring
Aid
Fit
9. O
no o
r B
oth
Par
ents
Dea
f: Y
es! N
o (c
ircle
one
) 10
.D
ate
of S
uspi
cion
t tT
ype
of L
oss:
Sen
sorl
neur
ol l
cond
uctiv
e I m
ixed
(ci
rcle
one)
12. C
ause
ol L
oss
13. D
ate
01"C
ause
" it
Occ
urre
d af
ter
Birt
h14
. Rac
e15
. Lan
guag
e S
poke
n in
the
Hor
n.
DE
MO
GR
AP
HIC
S11
(Fill
in a
t pro
gram
Initi
atio
n an
d th
erea
fter
whe
n aa
aaa
eldi
tione
lcha
ng
es a
re m
ade)
:
1.H
earin
g Lo
ss (
dB n
umer
ical
val
ues:
use
but
ear
: circ
leII
2. C
omm
unic
atio
n M
etho
dolo
gy:
Dai
s B
egun
:3.
Oth
er N
onP
aren
t inf
ant
ave.
of 2
treq
uenc
las
Of
1011
0:P
rogr
am S
ervi
ces:
Dia
gnos
tIcIp
tasc
liptiv
e
4. F
requ
ency
of H
ome
Vis
its:
Otto
Beg
un:
Dat
e B
egun
:(
) tw
ice
a w
eek
Tes
t Dal
eU
naid
ed d
BT
eat D
ata
Aid
ed d
BA
ural
Ora
l(
) on
ce a
wee
k
Tot
al C
omm
unic
atio
n(
) ev
ery
othe
r w
eek
Oth
er(
) ot
her
S. G
radu
atio
n D
ate
TE
ST
DA
TA
(W
rite
dow
n sc
ores
and
dat
es o
f tes
ts)
LDS
:T
est D
ate
RA
EA
(hig
hest
mon
th in
Oth
er T
ests
:
age
Inte
rval
)
Tea
t nam
eT
est D
ate
Ft/m
utts
CilL
D D
AT
A (
Slo
sh It
em if
no
long
er r
epor
ting.
Lea
ve(V
isits
) s)
blan
k If
child
not
yet
ach
ieve
d.)
11.
a.
0._
0_0_
0_0_
4_4-
--Ia_
0_0_
a_e_
Dat
eD
ate
Dat
eD
ate
Dat
eD
ate
Oat
aD
ate
Nis
Me
Ost
Otto
Deo
Dat
eD
eoD
ate
Dat
e
Tim
e H
earin
g A
id W
orn.
Beg
in r
ecor
ding
afte
r H
.A. P
rop.
Initi
ated
. Writ
s II
of a
ppro
pria
te ti
me
inte
rval
. Soo
bac
k. D
isco
ntin
ue (
slas
h) w
hen
child
achi
eves
100
%.
-
Aud
itory
Dev
elop
men
tB
egin
rec
ordi
ng a
ttar
Aud
. Pro
p. in
itiat
ed.
Writ
e hi
ghes
t lev
el c
hild
ach
ieve
s (1
.11)
. See
back
.
Com
Mun
icat
ionL
angu
age
Dev
elop
men
tB
egin
rec
ordi
ng a
tter
Com
m. P
rop.
Initi
ated
. Writ
ehi
ghes
t lev
el c
hild
achi
eves
(1.
12).
See
hec
k. W
rite
II of
app
ropr
iate
voca
bula
ry In
terv
al.
Set
bac
k. D
isco
ntin
ue (
slas
h) w
hen
child
has
(Jew
300
wor
ds.
Com
mun
icat
ionL
angu
age
Leve
l:
Voc
abul
ary:
____
i__
(RE
NT
DA
TA
(lo
gin
reco
rdin
g at
ter
each
pro
gram
Inttl
eled
. Sla
sh
Hem
line
long
er r
erho
rtin
g. L
eave
bla
nk If
not
yet
achi
eved
.)
Hea
ring
Aid
Ski
ds: V
isit
Ipar
ent a
chie
ves
10.1
00%
on
hear
ing
aid
com
pete
ncy
tett'
Maw
Aud
itory
Ski
lls a
cqui
red
(141
).S
ea b
eck.
New
Com
mun
icat
ion
Ski
lls a
cqui
red
(1.1
5).
See
beck
.N
ew A
ural
Ore
s la
ngua
ge S
kills
enq
uire
d (1
4).
See
bra
.,
New
tota
lCO
MM
UM
C/9
011
SIM
Iac
quire
d (1
.20)
.
See
bec
k.N
ew C
ogni
tion
Ska
te a
cqui
red
(1.1
2) O
ptio
nal,
See
bac
k.
.
0
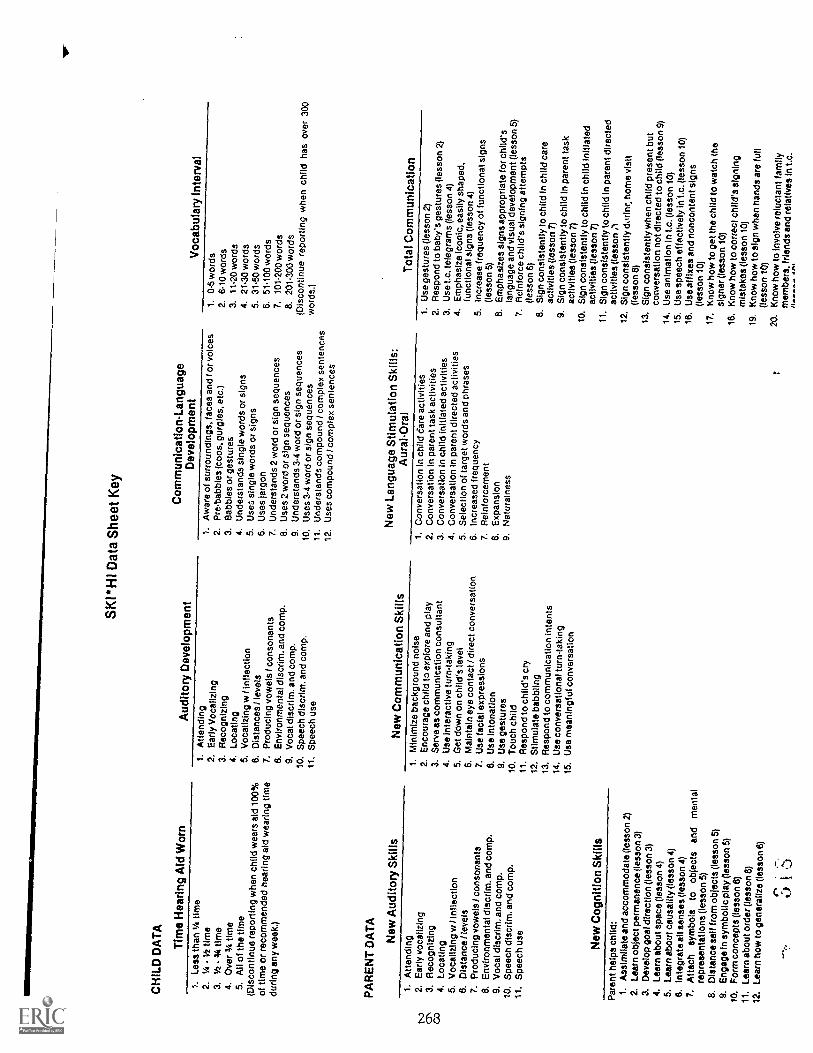
SK
I*H
I Dat
a S
heet
Key
CH
ILD
DA
TA
Tim
e H
earin
g A
id W
orn
Aud
itory
Dev
elop
men
tC
omm
unic
atio
n-La
ngua
geD
evel
opm
ent
Voc
abul
ary
Inte
rval
1. L
ess
than
1/4
tim
e2.
Ur
Vz
time
3.1/
2 -
3,4
time
4. O
ver
34 ti
me
5.A
ll of
the
time
(Dis
cont
inue
rep
ortin
g w
hen
child
wea
rs a
id10
0%of
tim
e or
rec
omm
ende
d he
arin
g ai
dw
earin
g tim
edu
ring
any
wee
k.)
PA
RE
NT
DA
TA
New
Aud
itory
Ski
lls
1. A
ttend
ing
2,E
arly
Voc
aliz
ing
3. R
ecog
nizi
ng4.
Loc
atin
g5.
Voc
aliz
ing
w I
infle
ctio
n6.
Dis
tanc
es! l
evel
s7.
Pro
duci
ng v
owel
s / c
onso
nant
s8.
Env
ironm
enta
l dis
crim
. and
com
p.9,
Voc
al d
iscr
tm. a
nd c
omp.
10. S
peec
h di
scrim
. and
com
p.11
, Spe
ech
use
New
Com
mun
icat
ion
Ski
lls
1. A
war
e of
sur
roun
ding
s, fa
ces
and
1"or
voi
ces
2. P
re-b
abbl
es (
coos
, gur
gles
. etc
.)3.
cab
bies
or
gest
ures
4. U
nder
stan
ds s
ingl
e w
ords
or
sign
s5.
Use
:. si
ngle
wor
ds o
r si
gns
6. U
ses
jarg
on7.
Und
erst
ands
2 w
ord
or s
ign
sequ
ence
s8.
Use
s 2
wor
d or
sig
n se
quen
ces
9. U
nder
stan
ds 3
.4 w
ord
or s
ign
sequ
ence
s10
. Use
s 3-
4 w
ord
or s
ign
sequ
ence
s11
. Und
erst
ands
com
poun
d / c
ompl
exse
nten
ces
12. U
ses
com
poun
d / c
ompl
ex s
ente
nces
New
Lan
guag
e S
timul
atio
nS
kills
:A
ural
-Ora
l
1. 0
-5 w
ords
2. 6
.10
wor
ds3.
11.2
0 w
ords
4. 2
1.30
wor
ds5.
31.
50 w
ords
6. 5
1.10
0 w
ords
7.10
1.20
0 w
ords
8. 2
01.3
00 w
ords
(Dis
cont
inue
rep
ortin
g w
hen
child
has
over
300
wor
ds.)
Tot
al C
omm
unic
atio
n1.
Atte
ndin
g2.
Ear
ly v
ocal
izin
g3.
Rec
ogni
zing
4. L
ocat
ing
5. V
ocal
izin
g w
I in
flect
ion
8. D
ista
nce
/leve
ls7.
Pro
duci
ng v
owel
s / c
onso
nant
s8,
Env
ironm
enta
l dis
crim
. and
com
p.9.
Voc
al d
iscr
im. a
nd c
omp.
10. S
peec
h di
scrI
m. a
nd c
omp.
11. S
peec
h us
e
New
Cog
nitio
n S
kills
1.M
inim
ize
back
grou
nd n
oise
2. E
ncou
rage
chi
ld to
exp
lore
and
pla
y3.
Ser
ve a
s co
mm
unic
atio
n co
nsul
tant
4. U
se in
tera
ctiv
e tu
rn-t
akin
g5.
Get
dow
n on
chi
ld's
leve
l6.
Mai
ntai
n ey
e co
ntac
t / d
irect
conv
ersa
tion
7. U
se fa
cial
exp
ress
ions
8. U
se in
tona
tion
9. U
se g
estu
res
10. T
ouch
chi
ld11
. Res
pond
to c
hild
's c
ry12
. Stim
ulat
e ba
bblin
g13
. Res
pond
to c
omm
unic
atio
n in
tent
s14
. Use
con
vers
atio
nal t
urn-
taki
ng15
. Use
mea
ning
ful c
onve
rsat
ion
1, C
onve
rsat
ion
in c
hild
dar
e ac
tiviti
es2.
Con
vers
atio
n in
par
ent t
ask
activ
ities
3. C
onve
rsat
ion
In c
hild
initi
ated
act
iviti
es4.
Con
vers
atio
n In
par
ent d
irect
ed a
ctiv
ities
5. S
elec
tion
of ta
rget
wor
ds a
nd p
hras
es6.
Incr
ease
d fr
eque
ncy
7. R
einf
orce
men
t8.
Exp
ansi
on9.
Nat
ural
ness
1. U
se g
estu
res
(less
on 2
)2.
Res
pond
to b
aby'
s ge
stur
es (
less
on 2
)3.
Use
Lc.
tele
gram
s (le
sson
4)
4. E
mph
asiz
e ic
onic
, eas
ily s
hape
d,fu
nctio
nal s
igns
(le
sson
4)
5. In
crea
se fr
eque
ncy
of fu
nctio
nal s
igns
(less
on 5
)6.
Em
phas
izes
sig
ns a
ppro
pria
tefo
r ch
ild's
lang
uage
and
vis
ual d
evel
opm
ent (
less
on5)
7. R
einf
orce
chi
ld's
sig
ning
atte
mpt
s(le
sson
6)
8. S
ign
cons
iste
ntly
to c
hild
in c
hild
care
activ
ities
(le
sson
7)
9. S
ign
cons
iste
ntly
to c
hild
inpa
rent
task
activ
ities
(le
sson
7)
10. S
ign
cons
iste
ntly
to c
hild
Inch
ild In
itiat
edac
tiviti
es (
less
on 7
)11
. Sig
n co
nsis
tent
ly to
chi
ld in
pare
nt d
irect
edac
tiviti
es (
less
on ;1
12. S
ign
cons
iste
ntly
dor
inr,
hom
evi
sit
(less
on 8
)13
. Sig
n co
nsis
tent
ly w
hen
child
pres
ent b
utco
nver
satio
n no
t dire
cted
to c
hild
(le
sson
9)14
. Use
ani
mat
ion
In L
c. (
less
on 1
0)15
. Use
spe
ech
effe
ctiv
ely
in.t.
c. (
less
on10
)16
. Use
affi
xes
and
nonc
onte
ntsi
gns
(less
on 1
0)17
. Kno
w h
ow to
get
the
child
tow
atch
the
sign
er (
less
on 1
0)18
. Kno
w h
ow to
cor
rect
chi
ld's
sign
ing
mis
take
s (le
sson
10)
19. K
now
how
to s
ign
whe
n ha
nds
are
full
(less
on 1
0)20
. Kno
w h
ow to
invo
lve
relu
ctan
tfa
mily
mem
bers
, frie
nds
and
rela
tives
in t.
c.
Par
ent h
elps
chi
ld:
1. A
ssim
ilate
and
acc
omm
odat
e (le
sson
2)
2. L
earn
obj
ect p
erm
anen
ce (
less
on 3
)3.
Dev
elop
goa
l dire
ctio
n (le
sson
3)
4. L
earn
abo
ut s
pace
(le
sson
4)
5. L
earn
abo
ut c
ausa
lity
(less
on 4
)6.
Inte
grat
e al
l sen
ses
(less
on 4
)7.
Atta
ch S
ymbo
lsto
obje
cts
and
men
tal
repr
esen
tatio
ns (
less
on 5
)8.
Dis
tanc
e se
lf fr
om o
bjec
ts (
less
on 5
)9.
Eng
age
In s
ymbo
lic p
lay
(less
on 5
)10
. For
m c
once
pts
(less
on 6
)11
. Lea
rn a
bout
ord
er (
less
on 8
)12
. Lea
rn h
ow to
gen
eral
ize
(less
on 6
)
C.;
Ai

Appendix B
Step-By-Step Guide to Completion and Submission of
SKI*H1 Data Sheet
Step 1
Complete Demographic Section I of SKI*HI Data Sheet at program initiation. CompleteDemographic Section II at program initiation and thereafter when additions/changes are made.
Demographic Data - I. Parent advisor fills in Demographic - I (fixed data) only once at program
initiation. All dates should be written in numbers: month/day/year. For example, a program startdate of June 4, 1985 is written 6/4/85.
1. Site Prefix: Each SKI*H1 replication agency is assigned a 3-letter prefix (for example, GAA
Georgia's prefix and NDX is North Dakota's prefix). Enter the site's assigned prefix.
2. Child ID Number: Each child in a program is assigned a 3 digit number (for example, thesixteenth child to be assigned a number in a particular program is 016). Enter the child's IDnumber.
3. Birthdate: Write birthdate in numbers. For example, a birthday of July 6, 1985 is written7/6/85.
4. Sex: Write M for male, F for female.5. Program start date: The program start date is the month, day and year that any parent-infant
program services were first given by the SKI*HI program. Examples are the date the coordinator
spends time on the first telephone contact, the day the parent advisor visits the home and collectsbackground information, or the first date of any home visit.
6. Date of ID: Identification is defined as first report from an audiologist indicating a hearingloss.
7. Other handicaps: Check yes if the child has a handicap, other than a hearing loss, which has
been professionally confirmed.8. Date hearing aid first fit: Write the date in numbers (month,day, year) when an aid, either
trial or permanent, was first fit by any agency.
9. One or both parents deaf: Circle yes if one or both parents living in the home are hearingimpaired.
10. Date of suspicion: Suspicion: Record the date the parents first suspected the hearing loss.
If parents did not suspect any hearing loss before formal identification, record the identificationdate.
11. Type of loss: Circle only one of the types. Mixed implies both sensori-neural and conduc-tive types of loss.
r. r269 0
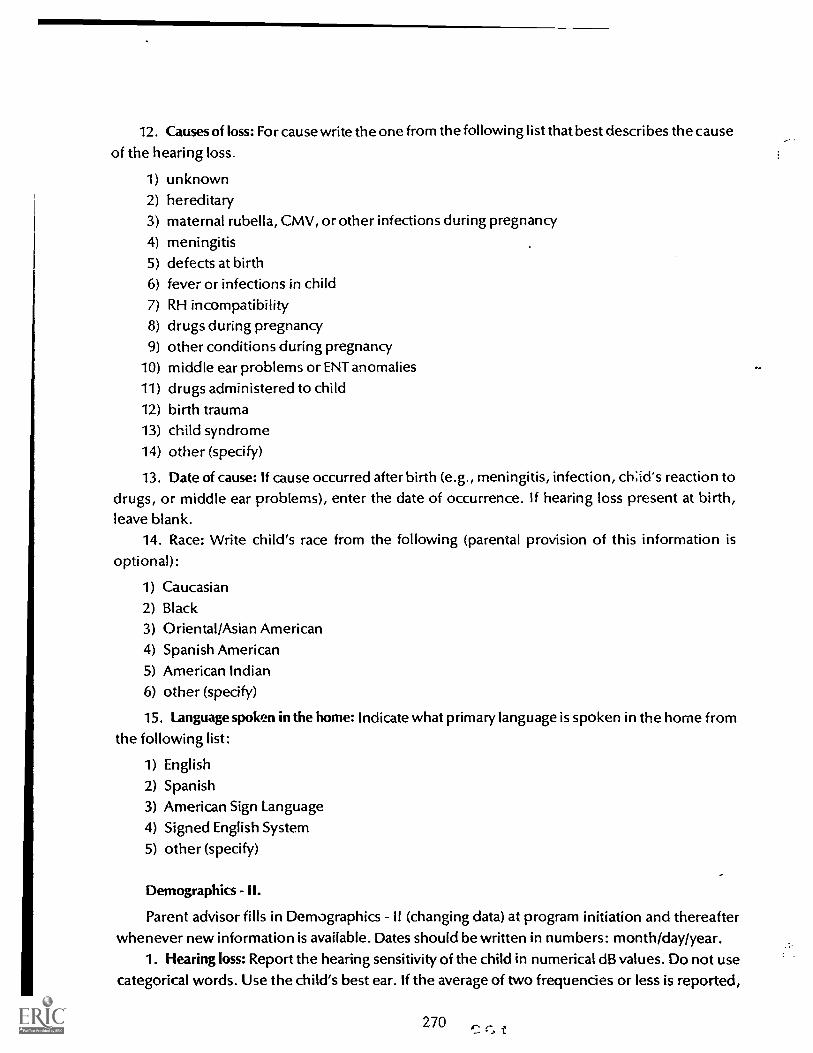
12. Causes of loss: For cause write the one from the following list that best describes the cause
of the hearing loss.
1) unknown2) hereditary3) maternal rubella, CMV, or other infections during pregnancy
4) meningitis5) defects at birth6) fever or infections in child7) RH incompatibility8) drugs during pregnancy9) other conditions during pregnancy
10) middle ear problems or ENT anomalies11) drugs administered to child12) birth trauma13) child syndrome14) other (specify)
13. Date of cause: If cause occurred after birth (e.g., meningitis, infection, ch:id's reaction todrugs, or middle ear problems), enter the date of occurrence. If hearing loss present at birth,leave blank.
14. Race: Write child's race from the following (parental provision of this information isoptional):
1) Caucasian2) Black3) Oriental/Asian American4) Spanish American
5) American Indian6) other (specify)
15. Language spoken in the home: Indicate what primary language is spoken in the home from
the following list:
1) English2) Spanish3) American Sign Language
4) Signed English System
5) other (specify)
Demographics - II.
Parent advisor fills in Demographics - II (changing data) at program initiation and thereafter
whenever new information is available. Dates should be written in numbers: month/day/year.1. Hearing loss: Report the hearing sensitivity of the child in numerical dB values. Do not use
categorical words. Use the child's best ear. If the average of two frequencies or less is reported,

circle that number. If the average of three or more frequencies is reported, do not circle that dB
value. Make sure to indicate test date in numbers: month/day/year.2. Communication Methodology: When the child first enters the parent-infant program, check
the communicative placement and give date. Diagnostic/Prescriptive refers to the first fewmonths of the child's enrollment in the program when no decision has yet been made as toauditory or total communication placement. During this time, evaluation data is being collectedto aid in making this decision. By the end of the Communication Program, a communicationmethod decision should be made, if possible. The child then begins the Language StimulationProgram: Aural-Oral or the Language Stimulation Program: Total Communication. The parentadvisor should be sure to note when the child changes from diagnostic-prescriptive to anaural-oral or a total communication language program. When the child is placed in or changed to a
specific methodology, give the date the family begins to use that method with the child.3. Other Non-Parent-Infant Program Services: List and date the initiation of other non-parent-
infant program services (other than diagnostic) given to the child and family while child is in theparent- infant program. List services by category as shown below:
a. educational (e.g., preschool, day care, kindergarten)b. speech and hearing therapyc. mental health (e.g., parent counseling, child therapy)d. health (e.g., free clinics, public health nurse, nutritional services)e. social (e.g., welfare, aid to dependent children, family services)
f. services for mentally retardedg. other (specify)
4. Frequency of Home Visits: Check the one that best describes the current visiting schedule.
5. Graduation Date: Put the date in numbers (month ,day, year) of the child's graduation from
the parent infant program.
Step 2
Explain parent notebook to parents (see pages 89--:.57). Have parents post parent notebookchecklists in an obvious place and check highest level of child's behavior for preceding week.When particular checklist is completed, have parents put it back in the Parent Notebook.
Step 3
Obtain child and parent progress data and record on the SKI*HI Data Sheet during or aftereach home visit. It is suggested that the parent advisor take one SKI*HI Data Sheet (whichbecomes the parent advisor's master copy for that child) and then insert a carbon and another data
sheet underneath the master for weekly submission to the supervisor. Or the parent advisor may
xerox the master data sheet for the supervisor. The parent advisor retains the master copy forcontinued data entry.
Before recording child and parent data, the parent advisor should enter the home visit date in
numbers (month/day/year) and the home visit number (1, 2, 3, 4 ... etc.). For example, the firsthome visit made to a home on Nov. 3, 1985 reads: Visit 1 on 11/3/85. When beginning a new data

sheet, the first home visit number entered will be the next higher number after the last entry onthe previous sheet. If the parent advisor goes to the home and the family is not there, date thehome visit but do not write in a new home visit number. Then write "no show" across the blanklines below.
Child Data.
On all child data, slash the item EZ1 if no longer reporting the item. Leave the item blank if the
child has not yet achieved a new skill. For example, if the child has not yet begun the AuditoryProgram, leave the auditory development item blank. Or if the child achieves an auditory level of 4
one week but does not achieve a new auditory level the next week leave the next week blank.1. Time Hearing Aid Worn: Begin recording weekly after initiating the Home Hearing Aid
Program. Using the SKI*H1 Data Sheet Key, write down the number of the appropriate timeinterval (as determined from the parent's entry on the Hearing Aid Wearing Time Checklist fromthe Parent Notebook). If the child does not achieve a new time interval during a particular week(for example, the child stays at1(4 -1/2 of the time), leave the current week blank. When the childwears the aid all of his waking hours or the hearing aid time recommended by the audiologist,discontinue reporting by slashing item on data sheet.
2. Auditory Development: Begin recording weekly after the Auditory Program is initiated.Using the SKI*H I Data Sheet Key, write down the number of the highest auditory level the childachieves during the week (as determined from the parent's entry on the Auditory DevelopmentChecklist from the Parents Notebook). The parent advisor will want to discuss with the parents the
parent's entry on the Auditory Development Checklist and then using the guide below, make afinal decision as to the auditory level that should be checked on the SKI*H I Data Sheet.
Determining The Child's Auditory Achievement Level
For Auditory Skills 1, 3,4, and 6, achievement of a particular level is determined by the child's
responding, without auditory clues (see page 394), to three or more different sound stimuli at a50% or higher consistency level during a series of meaningful presentations of each sound. Forexample, the child is on the "locating" level if he can localize half the time without clues to threeor more sounds (e.g., knocking, his name being called, electrical appliance) during a series ofmeaningful presentations of each sound (e.g., Mother knocks five times on kitchen cabinet whileshe is cooking and child responds three times).
For Auditory Skills 8, 9, and 10, achievement of a particular level occurs when the child ismaking more than 50% of his auditory responses on that level. For example, if most of the child'sresponses are discriminations of vocal sounds, words, or phrases, the child is on auditory level 9.For achievement of vocal skills (auditory skills 2, 5, 7, and 11), the child should be making 50% ormore of his vocalizations on that level. If the child does not acquire a new auditory level (auditory
level for current week is the same as the preceeding week), leave blank.
3. Communication-Language Development: Begin recording after Communication Program isinitiated.
77')

(a) Language level: Using SKI*HI Data Key, write down the number of the highest languagelevel the child achieves during the week (as determined from the parent's entry on theCommunication-Language Checklist from the Parent Notebook). The parent advisor shoulddiscuss the parent checklist entry with the parents and verify it if pOssible. If the child does notacquire a new language level (level for current week is same as preceding week), leave blank.
(b) Vocabulary count: Using the Key, write down the number of the appropriate vocabularyinterval (as determined from the parent's entry on the Communication-Language Checklist fromthe Parent Notebook). The parent advisor should discuss with parents their entry on theCommunication-Language Checklist. Using the following guide, the parent advisor can make afinal decision as to what new vocabulary words should be counted for entry on the SKI*HI DataSheet.
What Constitutes A New Vocabulary Word
Count as a new word, a morpheme that is distinguishable as a word and has been usedspontaneously (not imitatively) by the child more than once. if the word is so misarticulated that itis not recognizable as a word (child says ma or makes an unrecognizable or unrelated sign as hepoints to a doggie) do not count it as a morpheme (word). If the child understands one morpheme
(cat) but uses it in an over-generalized manner to refer to any furry znimal with four legs and a tail,
only one morpheme will be counted (the verbalized or signed cat is very different from the worddog).
If the child says a morpheme /13d-ba/ for bottle and another morpheme /ba-be/ for baby, theparents can "hear" the differences and will note the presence of two morphemes. Similarly, if thechild signs a close approximation for father and a slightly different but distinguishable approxima-tion for boy, the parent will note the presence of two morphemes. If the child utters onemorpheme /ba-ba/ in many different situations, such as when the child wants his /13:1-bi/ (bottle),
waving and saying /bd-bd/ (bye-bye) or pointing to a /ba -ba/ (baby), the parent will know the childhas three morphemes if:
1. There is a close approximation of the uttered word to the real word (/l35-b5/ to bye-bye or/bd-b5/ to baby) and,
2. If there is a strong indication of the child's knowing the three words because of (a) gesturalclues such as waving and saying /ba-ba/ or pointing or reaching for a /ba-ba/ (bottle) or (b)environmental clues (whenever mother gives the child a bottle the child says ma-bai or wheneverthe child sees a baby the child says /ba-ba./).
This principle can also be applied when the child is using signs. For example, the child mayuse the same squeezing or wrist-twisting motion for milk, orange, and ice cream, but indicationsmay be that he knows and distinguishes the three different words.
If the child utters /1:05-b.a/ or makes one sign indiscriminately as a generalized response to
many events or objects (points to many things and makes the sign or says /ba-ba /) only onemorpheme will be counted. If the child uses two words together such as /allgone/ or /allwet/ thatrepresent one meaningful unit, only one morpheme will be counted.

If during a particular week the child does not achieve a new vocabulary count interval (forexample, child stays at 21-30 words), leave the space for that week blank. When the child has more
than 300 words, discontinue recording by slashing item on the data sheet.
Parent Data.
On all parent data, slash the item fit if no longer reporting the item. Leave the item blank if theparent has not achieved new skills. For example, if the Language Program has not been initiated,
leave the new language skills item blank. Or if the parent achieves language skills 1 and 2 during a
preceding week and no new skills for the current week, leave the current week blank.
1. Hearing Aid Skills: Begin recording after initiation of the Home Hearing Aid Program. Write
down only once, the number of the home visit during which the parent receives 80-100% on thehearing aid competency test. The competency test is in hearing aid lesson 9 and is on pages231-234. For example, if the parent achieves 80-100% on the competency test during visit 10, write
down 10. Discontinue reporting by slashing this item after the parent achieves 80-100% on thecompetency test.
2. New Auditory Skills: Begin recording after initiation of the Home Auditory Program . Usingthe SKI*H I Data Sheet Key, write down the number(s) of all new skills the parent acquired during
the home visit or preceding week. (See page 71 for complete description of determining parentprogress.) If the parent achieves no new auditory skills during a particular week (for example, theparent achieves auditory skills 3 and 4 during a preceding week but achieves no new skills duringthe current week), leave the space for the current week blank.
3. New Communication Skills: Begin recording after initiation of the Home CommunicationProgram. Using the Key, write down the number(s) of all new skills the parent acquires during thehome visit or preceding week. (See page 71 for complete description of determining parentprogress.) If the parent achieves no new communication skills during a particular week (forexample, the parent achieves communication skill 3 and 4 during a preceding week but achievesno new skills during the current week), leave the space for the current week blank.
4. New Language Stimulation Skills: Aural-Oral: Begin recording after initiation of theLanguage Stimulation Program: Aural-Oral. Using the Key, write down the number(s) of all newskills the parent acquires during the home visit or preceding week. (See page 71 for completedescription of determining parent progress.) If the parent achieves no new language skills duringa particular week (for example, the parent achieves language skills 2 and 3 during a precedingweek but achieves no new skills during the current week), leave the space for the current weekblank. Leave blank if the family is using Language Stimulation Program: Total Communication.
5. New Language Stimulation Skills: Total Communication: Begin recording after initiation of
the Language Stimulation Program: Total Communication. Using the Key, write down the num-ber(s) of all new skills the parent acquires during the home visit or preceding week. (See page 71
for complete description of determining parent progress.) If the parent achieves no new totalcommunication skills during a particular week (for example, the parent achieves total communi-cation skills 7 and 8 during a preceding week but achieves no new skills during the current week),leave the space for the current week blank. Leave blank if the family is using Language Stimulation
Program: Au ral-Oral .
0) "7 1.

1
6. New Cognition Skills (optional): Begin recording after initiation of the Home CognitionProgram. Using the Key, write down the number(s) of all new skills the parent acquires during the
home visit or preceding week. (See page 71 for complete description of determining parentprogress.) If the parent achieves no new cognition skills during a particular week (for example,the parent achieves cognition skills 1 and 2 during a preceding week but achieves no new skills
during the current week), leave the space for the current week blank.
Step 4
Submit the carbon or xerox copy of the SKI*HI Data Sheet weekly to the supervisor. It ispossible that the copy sent to the supervisor will also contain the Lesson Plan and Lesson Narrative
Report if suggestion 1 on page 62 is being used. If suggestion 2 is being used, the parentadvisor may be required to send to the supervisor both the Lesson Plan and Lesson Narrative..Report (one form) and the SKI*H I Data Sheet (another form). In some programs, submission ofthe Lesson Plan and Narrative Report Form may not be required or may eventually be phased out if
the parent advisor and supervisor deem it appropriate. However, it is suggested that the parentadvisor continue to make written lesson plans and narrative reports for her own use even if she is
not submitting them to her supervisor.Upon receipt of the carbon copies, the supervisor reviews parent and child progress,
responds to any parent advisor comments, and files the report chronologically in the child's file.
Step 5
Administer LDS to child at time of entry into the program and twice yearly. Record date and
results on SKI *HI Data Sheet. Administer and report on other tests as appropriate.
Language Development Scale (LDS): Parent advisor records LDS test scores and dates when-
ever the LDS is given. Children in SKI*HI replication sites should receive the test at least twice ayear. More frequent administrations are encouraged. The first administration of the LDS must take
place within the first three months of the child's enrolment in the program. This first administra-tion constitutes the pretest. The earlier the first administration can be given, the greater thelikelihood of demonstrating child progress.
Parent advisor should record the child's receptive and expressive ages (RA and EA). These
ages will be the highest age in months of the highest interval achieved (for example, if the child'sreceptive age interval is 20- 22 months, the RA would be recorded as 22 months). Parent advisors
should make sure to date all test administrations in numbers: month/day/year.
Other tests: Administrations of tests (other than the LDS) are optional. All test administrations
must be dated. If the SKI* H I Receptive Language Test is given, enter the child's percentage scores
for Parts A, B, C, and D. If the child does not respond, enter a 0.
Step 6
By May 31 of each year, SKI*HI Data Sheets (on every child in the local program) should be
submitted to the SKI*HI institute Data Manager.
27517,

Notices will come from the SKI*HI Data Bank Manager (SKI*H1 Institute) to remind replicationsite personnel to submit copies of their SKI*HI Data Sheets in May. The program should cut off thechild's name at the top of the SKI *HI Data Sheet to ensure anonymity of the data,make copies of all
data sheets kept on each child since the previous May's submission, and send the copies to:
SKI*H1 Data Manager
SKI*HI InstituteDepartment of Communicative DisordersUtah State University
Logan, Utah 84322-9605
(801) 752-4601
In small programs that do not have a supervisor, the parent advisor will need to follow theabove procedures to submit data on her children.
At the SKI*H I Data Center, all data will be analyzed. Reports will be sent to replication sitepersonnel describing the progress of parents and children in the entire SKI*HI Network and intheir particular site if more than 10 children are served. In order to help replication site personnelinterpret and use these reports, the section below is given.
all .",1 1
276

Data Collection and Submission Quick Reference
Step
Complete demographic Section I of SKI*HI Data Sheet at program initiation. Complete Demo-graphic Section II at program initiation and thereafter when additions/changes are made.
Step 2
Explain parent notebook to parents (see pages 89-157). Have parents put parent notebook check-lists in an obvious place (ex: refrigerator door) and check highest level of child's behavior forpreceding week. When particular checklist is completed, have parents put it back in the ParentNotebook.
Step 3
Obtain child progress data (from parent checklists and parent advisor observation) and recordhighest level of child's behavior on Master SKI*HI Data Sheet during each home visit. Recordparent progress data. A carbon and another data sheet may be inserted underneath the masterdata sheet for submission to supervisor (or a xerox copy may be submitted).
Step 4
Submit copy of SKI*HI Data Sheet weekly to supervisor (and as appropriate, Lesson Plan andLesson Narrative Report).
Step 5
Administer Language Development Scale (LDS) to child at least twice yearly and record date andresults on SKI *HI Data Sheet. Administer and report on other tests as appropriate.
Step 6
By May 31, all data sheets should be submitted to the SKl *Hl Institute Data Manager.
277
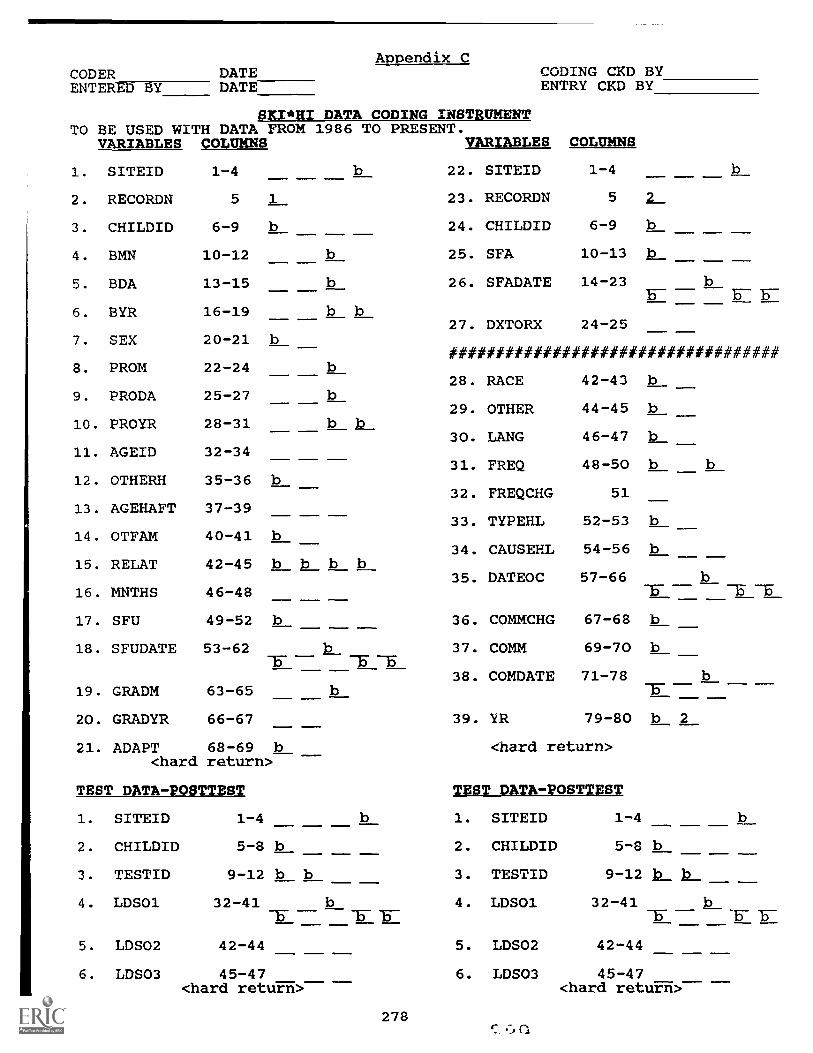
Appendix CCODER DATE
DATA CODING
CODING CKD BYENTERED BY DATE ENTRY CKD BY
SKI*HI INSTRUMENTTO BE USED WITH DATA FROM
VARIABLES COLUMNS1986 TO
b
PRESENT.VARIABLES COLUMNS
1. SITEID 1-4 22. SITEID 1-4 b
2. RECORDN 5 1 23. RECORDN 5 2
3. CHILDID 6-9 b 24. CHILDID 6-9 b
4. BMN 10-12 b 25. SFA 10-13 b
5. BDA 13-15 b 26. SFADATE 14-23 b
6. BYR 16-19 b bB-
27. DXTORX 24-257. SEX 20-21 b
###################################8. PROM 22-24
28. RACE 42-43 b9. PRODA 25-27
10. PROYR 28-31 b b29. OTHER 44-45 b
30. LANG 46-47 b11. AGEID 32-34
31. FREQ 48-50 b b12. OTHERH 35-36 b
32. FREQCHG 5113. AGEHAFT 37-39
33. TYPEHL 52-53 b14. OTFAM 40-41 b
34. CAUSEHL 54-56 b15. RELAT 42 -45 b b b b
35. DATEOC 57-6616. MNTHS 46-48 15- T -5
17. SFU 49-52 b 36. COMMCHG 67-68 b
18. SFUDATE 53-62 37. COMM 69-70 bIT -5 -5
38. COMDATE 71-7819. GRADM 63-65 IT
20. GRADYR 66-67 39. YR 79-80 b 2
21. ADAPT 68-69 b <hard return><hard return>
TEST DATA-POSTTEST TEST DATA-POSTTEST
1. SITEID 1-4 1. SITEID 1-4 b
2. CHILDID 5-8 b 2. CHILDID 5-8 b
3. TESTID 9-12 b b 3. TESTID 9-12 b b
4. LDSO1 32-41-5-
4. LDSO1 32-41 b
5. LDS02 42-44 5. LDS02 42-44
6. LDS03 45-47 6. LDS03 45-47<hard return>
278
<hard return>

CODEDCHECKED
VARIABLES
BY
VARIABLES COLUMNS
BY
COLUMNS40. SITEID 1-4 65. SITEID 1-4
41. RECORDN 5 3 66. RECORDN 5 4
42. CHILDID 6-9 b 67. CHILDID 6-9 b
43. S #8889 10-12 b 68. ASMODAYR 10-15
44. S #8990 13-14 69. MODAYRAS 16-21
45. S#9091 15-16 70. CS# 22-24 b
46. S#8788 17-18 71. CSMODAYR 25-30
47. BEGTHAW 19 72. MODAYRCS 31-36
48. THAW 20 73. AO# 37-38 b
49. TCMODAYR 21-26 74. AOMODAYR 39-44
50. MODAYRTH 27-32 75. MODAYRAO 45-50
51. ADL 33-35 b 76. TC# 51-53 b
52. BEGADL 36-37 77. TCMODAYR 54-59
53. ADMODAYR 38-41 78. MODAYRTC 60-65
54. MODAYRAD 42-47 b b 79. CG# 66-68 b
55. CLDL 48-50 b_ 80. CGMODAYR 69-74
56. BEGCLDL 51-52 81. MODAYRCG 75-80<Hard Return>
57. CLMODAYR 53-56
58. MODAYRCL 57-62 b b
59. BEGVI 63
60. VI 64
61. VIMODAYR 65-70
62. MODAYRVI 71-76
63. VISIT! 77-78
64. AS# 79-80<Hard Return>
279

appendix D
To be used for
1. SITEID
2. RECORDN
SKI*HI DATA CODING CONVENTIONS Revised2/14/90
data from 1986 to present. Note: Use zero fill.
3-character label in spaces 1,2,3.Blank in space 4.
A 1 should appear in column 5.
3. CHILDID Blank in 6. 3-digit ID# in 7,8,9.
4. BMN Month of Birth. 2 digits in 10 & 11.Blank in 12.
5. BDA Day of Birth. 2 digits in 13 & 14.Blank in 15.
6. BYR Year of Birth. 2 digits in 16 & 17.Blanks in 18 & 19.
7. SEX Blank in 20. 1 digit in 21.1= male 2= female
8. PROM Program start month. 2 digits in 22 & 23.Blank in 24.
9. PRODA Program start day. 2 digits in 25 & 26.Blank in 27.
10. PROYR Program start year. 2 digits in 28 &29. Blanks in 30 & 31.
11. AGEID Age of identification in months. Calculate.Zero fill in 32. 2 digits in 33 & 34. Tocalculate age in months, use the followingguidelines: One month= 30 days. If child'sdays are greater than 15, add one to themonth column. If days are less than or equalto 15, leave month column asExample: Year Month
is.Day
1587 3 33
If Date of ID equals 88 4 3
and Date of Birth equals 86 6 9
Subtract to get ID Age: 1 9 24Since days are >15
add 1 to months: 1 10Multiply yrs x 12
& add to months: (1 x 12) + 10= 22 monthsIf days not specified on Date of ID, thencalculate AGEID using Date of Birth (roundedup one months if days greater than 15).
280

12. OTHERH Other handicaps. If no response isprovided by site, assume the answer isNo, except in those instances where theentire demographic section is leftblank. Blank in 35. 1 digit in 36.1= yes, 2= no.
13. AGEHAFT Age of hearing aid fit in months.Calculate Zero fill in 37. 2 digits in38 & 39. Subtract Date of Birth fromdate Hearing Aid Fit.
14. OTFAM Other Family Member with Hearing Prob-lem. Blank in 40. 1 digit in 41.1= yes, 2= no.
15. RELAT Dropped from new data sheet. Blanks in42, 43, 44, and 45.
16. MNTHS Months between suspicion of loss andidentification of loss. Calculate. Zerofill in 46. 2 digits in 47 & 48.
17. SFU Hearing loss, unaided, in dB values.Use best ear dB, if give both ears. IfNo Response to sound is indicated, thenenter 120 dB. Also, use the followingguidelines: 0 - 20 = normal hearing; 25
18. SFUDATE
- 40 = mild loss; 45 - 60 = moderateloss; 65 - 90 = severe loss; 90+ =profound loss. Enter a decibel value inthe middle of each range. Blank in 49.Zero fill in 50, if needed. Digits in51 & 52.
Date of unaided test. Month in 53 & 54.Blank in 55. Day in 56 & 57. Blank in58. Year in 59 & 60. Blanks in 61 &62.
19. GRADM Month of graduation in 63 and 64. Blankin 65.
20. GRADYR Year of graduation in 66 and 67.
21. ADAPT Was program adapted for the child? Anydata sheet with stars around the outsideindicates program was adapted. Blank in68. One digit in 69.
1= yes 2= no
22. SITEID 3-character label in spaces 1,2,3,Blank in space 4.
23. RECORDN A 2 should appear in column 5.24. CHILDID Blank in 6. 3-Digit ID/ in 7, 8, 9.
281f..

25. SFA
26. SFADATE
27. DXTORX
28. RACE
29. OTHER
30. LANG
31. FREQ
Hearing loss, aided in dB values. Blankin 10. Zero fill in 11, if needed.Digits in 12 & 13. Use best ear dB ifgive both ears.
Date of aided test. Month in 14 & 15.Blank in 16. Day in 17 & 18. Blank in19. Year in 20 & 21. Blanks in 22 & 23.
Time span betweenDiagnostic/Prescription date and firstcommunication Methodology choice. 2digits in 24 & 25.
Race/National origin. Blank in 42. Onedigit in 43.1= Caucasian2= Black3= Others4= Oriental American5= Spanish American6= American Indian
Other non-Parent-Infant Program Serv-ices. Blank in 44. One digit in 45.1= Educational2= Mental Health3= Health4= Social5= Memtal Retardation6= Other (Combination Services)7= Speech & Hearing Rx8= Educational + Speech & Hearing Rx
Primary language spoken in the home.Blank in 46. One digit in 47.1= English2= ASL3= Spanish4= Other5= Signed English System
Frequency of home visits. Blank in 48.One digit in 49. Blank in 50.1= Irregular2= Once a week (3 x/mo. also coded as 2)3= Every other week4= Monthly5= Bi-monthly6= Twice a week7= Other
282
282

32. FREQCHG
33. TYPEHL
34. CAUSEHL
35. DATEOC
36. COMMCHG
Did frequency of home visits change?One digit in 51.Yes= 1 No= 2
Type of Hearing Loss. Blank in 52.Digit in 53.1= Not yet determined.2= Conductive3= Sensorineural4= Mixed
Cause of hearing loss. Blank in 54.Digits in 55 and 56.1= Unknown2= Hereditary3= Maternal Rubella, CMV or other
infections during pregnancy4= Meningitis5= Defects at birth (Atresia)6= Fever or infections in child7= RH incompatibility/Kernicterus/Jaundice8= Drugs during pregnancy9= Other conditions during pregnancy
(premature)10= Middle ear problems or ENT
anomalies (Otitis Media)11= Drugs administered to child12= Birth trauma13= Child syndrome14= Other (specify)15= Not Reported
Date of occurrence of hearing loss, ifafter birth. Month in 57 & 58. Blankin 59. Day in 60 & 61. Blank in 62.Year in 63 & 64. Blanks in 65 & 66.
Did communication method change fromaural to total or from total to aural orto other, etc.? (Note: Do not mark a"Yes" if Communication Methodology hasgone from Diag./Prescriptive to Aural orto Total--this does not indicate achange in Communication Methodology.)Blank in 67. One digit in 68. If stillin diagnostic/prescriptive phase, leaveblank.1= yes 2= no
283

37. COMM Present Communication Method. Blank in69. Digit in 70.1= Diagnostic-prescriptive2= Auditory (Aural-Oral)3= Total Communication4= Other
38. COMDATE Date family begins to use presentCommunication Method. Month in 71 &72. Blank in 73. Day in 74 & 75.Blank in 76. Year in 77 & 78.
39. YR Blank in 79. A 2 should appear in 80.
40. SITEID 3-character label in spaces 1,2,3.Blank in space 4.
41. RECORDN A 3 should appear in column 5.
42. CHILDID Blank in 6. 3-Digit ID# in 7, 8, 9.
43. S#8889 Blank in 10. Actual number of sessions childreceived from pretest to posttest for 1988-89year. 2 digits in 11 & 12.
44. S#8990 Actual number of sessions child received frompretest to posttest for 1989-90 year. 2
digits in 13 & 14.
45. S#9091 Actual number of sessions child received frompretest to posttest for 1990-91 year. 2
digits in 15 & 16.
46. S#8788 Actual number of sessions child received frompretest to posttest for 1987-88 year. 2
digits in 17 & 18.
47. BEGTHAW Put number representing beginning amount oftime hearing aid was worn. 1 digit in 19.
48. THAW Put number representing largest amount oftime hearing aid is worn by child in 20.
49. THMODAYR Month, Day and Year of first entry for TimeHearing Aid Worn. Month in 21 & 22, Day in23 & 24, and Year in 25 & 26.
50. MODAYRTH Month, Day and Year of entry for largestamount of time hearing aid is worn by child.Month in 27 & 28, Day in 29 & 30, and Year in31 & 32.
51. ADL Put highest auditory development levelattained by child in 34 & 35. Blank in 33.
52. BEGADL Beginning auditory level in 36 and 37.
284-
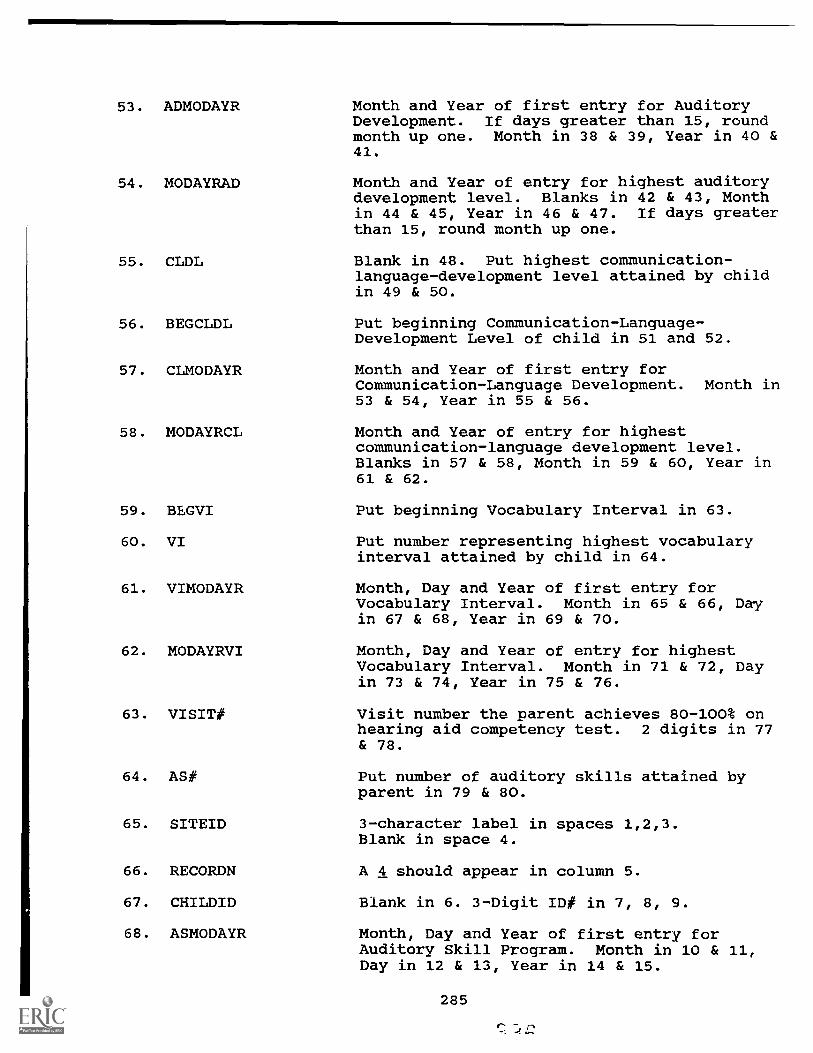
53. ADMODAYR
54. MODAYRAD
55. CLDL
56. BEGCLDL
57. CLMODAYR
58. MODAYRCL
59. BEGVI
60. VI
61. VIMODAYR
62. MODAYRVI
63. VISIT#
64. AS#
65. SITEID
66. RECORDN
67. CHILDID
68. ASMODAYR
Month and Year of first entry for AuditoryDevelopment. If days greater than 15, roundmonth up one. Month in 38 & 39, Year in 40 &41.
Month and Year of entry for highest auditorydevelopment level. Blanks in 42 & 43, Monthin 44 & 45, Year in 46 & 47. If days greaterthan 15, round month up one.
Blank in 48. Put highest communication-language-development level attained by childin 49 & 50.
Put beginning Communication-Language-Development Level of child in 51 and 52.
Month and Year of first entry forCommunication-Language Development. Month in53 & 54, Year in 55 & 56.
Month and Year of entry for highestcommunication-language development level.Blanks in 57 & 58, Month in 59 & 60, Year in61 & 62.
Put beginning Vocabulary Interval in 63.
Put number representing highest vocabularyinterval attained by child in 64.
Month, Day and YearVocabulary Interval.in 67 & 68, Year in
Month, Day and YearVocabulary Interval.in 73 & 74, Year in
of first entry forMonth in 65 & 66, Day
69 & 70.
of entry for highestMonth in 71 & 72, Day
75 & 76.
Visit number the parent achieves 80-100% onhearing aid competency test. 2 digits in 77& 78.
Put number of auditory skills attained byparent in 79 & 80.
3-character label in spaces 1,2,3.Blank in space 4.
A 4 should appear in column 5.
Blank in 6. 3-Digit ID# in 7, 8, 9.
Month, Day and Year of first entry forAuditory Skill Program. Month in 10 & 11,Day in 12 & 13, Year in 14 & 15.
285
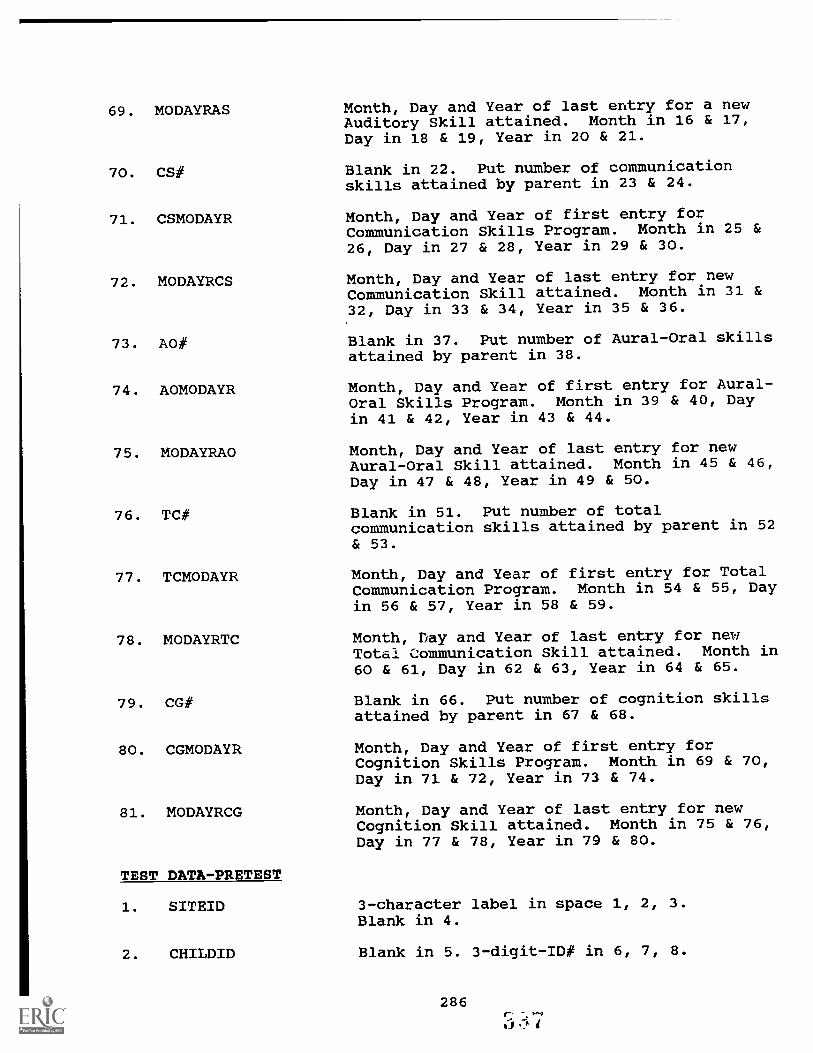
69.
70.
MODAYRAS
CS#
Month, Day and Year of last entry for a newAuditory Skill attained. Month in 16 & 17,Day in 18 & 19, Year in 20 & 21.
Blank in 22. Put number of communicationskills attained by parent in 23 & 24.
71. CSMODAYR Month, Day and Year of first entry forCommunication Skills Program. Month in 25 &26, Day in 27 & 28, Year in 29 & 30.
72. MODAYRCS Month, Day and Year of last entry for newCommunication Skill attained. Month in 31 &32, Day in 33 & 34, Year in 35 & 36.
73. AO# Blank in 37. Put number of Aural-Oral skillsattained by parent in 38.
74. AOMODAYR Month, Day and Year of first entry for Aural-Oral Skills Program. Month in 39 & 40, Dayin 41 & 42, Year in 43 & 44.
75. MODAYRAO Month, Day and Year of last entry for newAural-Oral Skill attained. Month in 45 & 46,Day in 47 & 48, Year in 49 & 50.
76. TC# Blank in 51. Put number of totalcommunication skills attained by parent in 52& 53.
77. TCMODAYR Month, Day and Year of first entry for TotalCommunication Program. Month in 54 & 55, Dayin 56 & 57, Year in 58 & 59.
78. MODAYRTC Month, Day and Year of last entry for newTotal Communication Skill attained. Month in60 & 61, Day in 62 & 63, Year in 64 & 65.
79. CG# Blank in 66. Put number of cognition skillsattained by parent in 67 & 68.
80. CGMODAYR Month, Day and Year of first entry forCognition Skills Program. Month in 69 & 70,Day in 71 & 72, Year in 73 & 74.
81. MODAYRCG Month, Day and Year of last entry for newCognition Skill attained. Month in 75 & 76,
TEST DATA-PRETEST
1. SITEID
2. CHILDID
Day in 77 & 78, Year in 79 & 80.
3-character label in space 1, 2, 3.Blank in 4.
Blank in 5. 3-digit-ID# in 6, 7, 8.
286C- $.4.4

3. TESTID Blanks in 911 & 12.
4. LDSO1
5. LDSO2
6. LDSO3
TEST DATA-POSTTEST
1. SITEID
2. CHILDID
3. TESTID
4. LDSO1
5. LDSO2
6. LDSO3
15=16=17=18=20=21=22=23=24=25=26=27=
1986-871986-871987-881987-881988-891988-891989-901989-901990-911990-911991-921991-92
& 10. 2-digit code in
PretestPosttestPretestPostestPretestPostestPretestPostestPretestPostestPretestPostest
Date of administration of LDS. Monthin 32 & 33. Blank in 34. Day in 35 &36. Blank in 37. Year in 38 & 39.Blanks in 40 & 41.
Receptive Age on LDS. Zero fill 42.2-digit score in 43 & 44.
Expressive Age on LDS. Zero fill 45.2-digit score in 46 & 47.
3-character
Blank in 5.
Blanks in 911 & 12.15=16=17=18=20=21=22=23=24=25=26=27=
1986-871986-871987-881987-881988-891988-891989-901989-901990-911990-911991-921991-92
label in 1, 2, 3. Blank in 4.
3-digit-ID# in 6,7,8.
& 10. 2-digit code in
PretestPostestPretestPostestPretestPostestPretestPostestPretestPostestPretestPostest
Date of administration of LDS. Monthin 32 & 33. Blank in 34. Day in 35 &36. Blank in 37. Year in 38 & 39.Blanks in 40 & 41.
Receptive Age on LDS. Zero fill 42.2-digit score in 43 & 44.
Expressive Age on LDS. Zero fill 45.2-digit score in 46 & 47.
287(-!
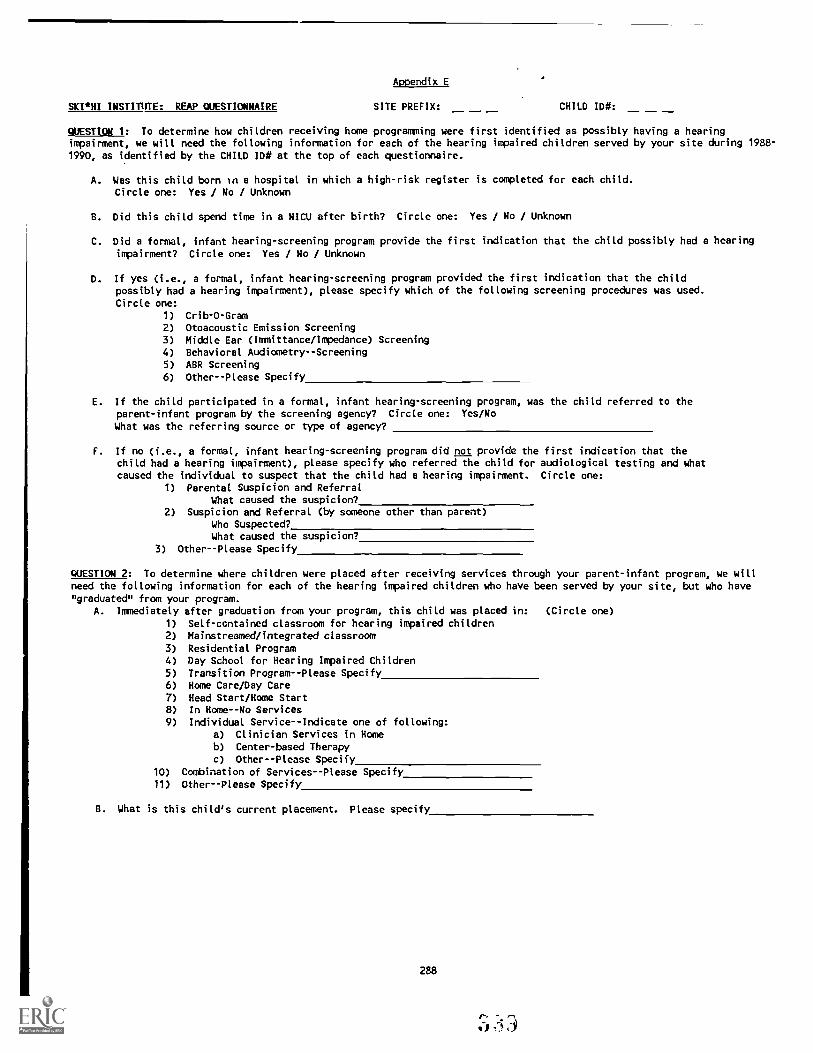
SKI *HI INSTITUTE: REAP QUESTIONNAIRE
Appendix E
SITE PREFIX: CHILD ID#:
QUESTION 1: To determine how children receiving home programming were first identified as possibly having a hearingimpairment, we will need the following information for each of the hearing impaired children served by your site during 1988-1990, as identified by the CHILD 1D# at the top of each questionnaire.
A. Was this child born In a hospital in which a high-risk register is completed for each child.Circle one: Yes / No / Unknown
B. Did this child spend time in a NICU after birth? Circle one: Yes / No / Unknown
C. Did a formal, infant hearing-screening program provide the first indication that the child possibly had a hearing
impairment? Circle one: Yes / No / Unknown
D. If yes (i.e., a formal, infant hearing-screening program provided the first indication that the childpossibly had a hearing impairment), please specify which of the following screening procedures was used.
Circle one:
1) Crib-O-Gram
2) Otoacoustic Emission Screening3) Middle Ear (Immittance/Impedance) Screening4) Behavioral Audiometry--Screening
5) ABR Screening
6) Other--Please Specify
E. If the child participated in a formal, infant hearing-screening program, was the child referred to theparent-infant program by the screening agency? Circle one: Yes/No
What was the referring source or type of agency?
F. If no (i.e., a formal, infant hearing-screening program did not provide the first indication that thechild had a hearing impairment), please specify who referred the child for audiological testing and whatcaused the individual to suspect that the child had a hearing impairment. Circle one:
1) Parental Suspicion and Referral
What caused the suspicion?2) Suspicion and Referral (by someone other than parent)
Who Suspected?What caused the suspicion?
3) Other--Please Specify
QUESTION 2: To determine where children were placed after receiving services through your parent-infant program, we will
need the following information for each of the hearing impaired children who have been served by your site, but who have
"graduated" from your program.A. Immediately after graduation from your program, this child was placed in: (Circle one)
1) Self-contained classroom for hearing impaired children
2) Mainstreamed/integrated classroom
3) Residential Program4) Day School for Hearing Impaired Children
5) Transition Program--Please Specify6) Home Care/Day Care
7) Head Start/Home Start
8) In Home--No Services
9) Individual Service--Indicate one of following:a) Clinician Services in Homeb) Center-based Therapy
c) Other--Please Specify
10) Combination of Services--Please Specify
11) Other -- Please Specify
B. What is this child's current placement. Please specify
288

DIRECTIONS FOR COMPLETING QUESTIONNAIRE
PURPOSE: The purpose of question 1 is to determine which method of infanthearing screening was used (if any) that first alerted parents orprofessionals that a child had a possible hearing impairment.Screening does not include diagnostic testing completed aftersuspicion of hearing loss. Screening usually takes place during thefirst few months of life and is designed to refer an infant forfurther diagnostic testing. Therefore, as you answer question 1,keep in mind we are looking for screening method only, notdiagnostic testing. You may need to telephone parents if you cannotdetermine the answers to Question 1 from the information availableto you in the files.
QUESTION: 1A. If your state has a high risk register and the child wasborn in a hospital in your state you may assume that thechild was included in the high risk register whether ornot that information is in the child's file. If youdon't know the answer to this question, circle unknown.
1B. If information is in the child's file or you candetermine the response in some other way, then circlethe appropriate answer. If you are unable to determinethe answer, circle unknown.
1C. Refers to formal, infant screening programs otherthan the high-risk registry. If the child was wasidentified through a formal, infant screening program,answer yes. If you have information indicating thatparental suspicion was used to screen for hearingimpairment, then circle no and skip to Question 1F.
1D. Circle the answer that applies. If none of thechoices apply, but some other method of screening wasused, describe in #6. Remember, this question refers toscreening method only, not to diagnostic testing thatmay have been performed after the screening to confirma hearing loss.
1E. Answer from the information available to you.
1F. Answer from the information available to you.
PURPOSE: The purpose of question 2 is to determine where children were placedafter "Graduating" from a parent-infant program.
QUESTION: 2A. Please answer from the available information or contactthe parent.
2B. Specify the child's current placement-use choices listedin 2A or write in a placement that is not listed in 2A.
289
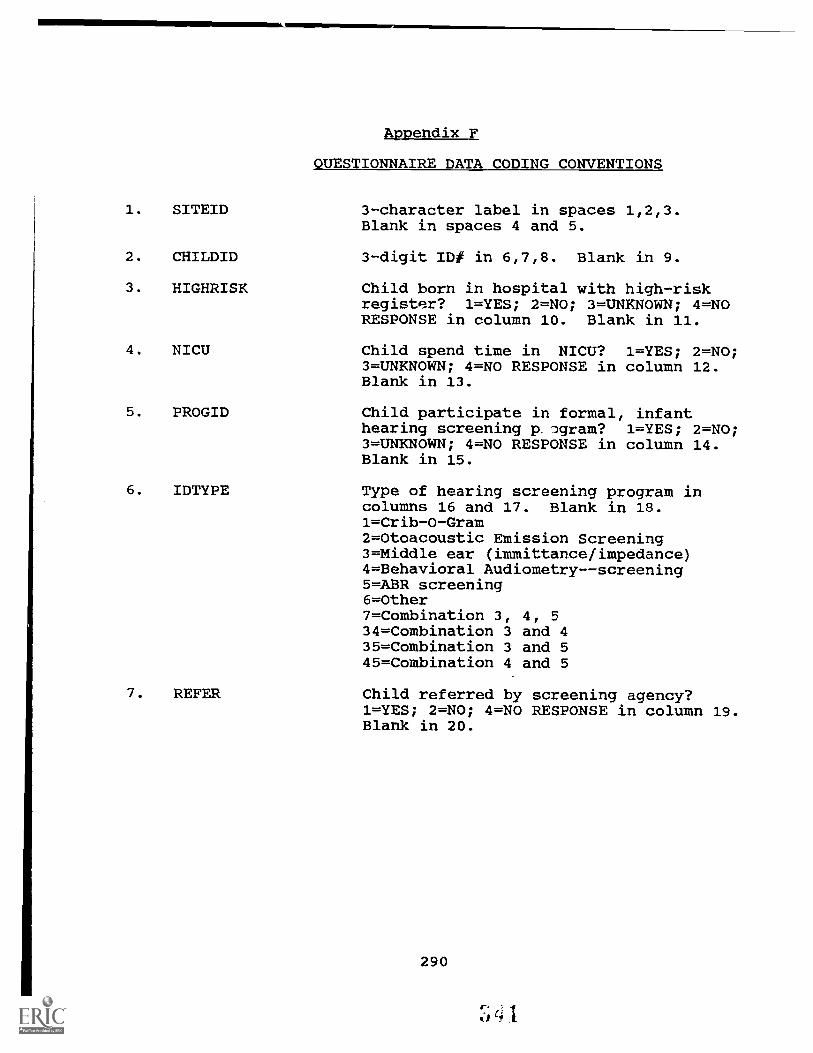
Appendix F
1.
2.
SITEID
CHILDID
QUESTIONNAIRE DATA CODING CONVENTIONS
3-character label in spaces 1,2,3.Blank in spaces 4 and 5.
3-digit ID# in 6,7,8. Blank in 9.
3. HIGHRISK Child born in hospital with high-riskregister? 1=YES; 2=NO; 3=UNKNOWN; 4=NORESPONSE in column 10. Blank in 11.
4. NICU Child spend time in NICU? 1=YES; 2=NO;3=UNKNOWN; 4=NO RESPONSE in column 12.Blank in 13.
5. PROGID Child participate in formal, infanthearing screening p lgram? 1=YES; 2=NO;3=UNKNOWN; 4=NO RESPONSE in column 14.Blank in 15.
6. IDTYPE Type of hearing screening program in
7. REFER
columns 16 and 17. Blank in 18.1=Crib-O-Gram2=Otoacoustic Emission Screening3=Middle ear (immittance/impedance)4=Behavioral Audiometry--screening5=ABR screening6=Other7=Combination 3, 4, 5
34=Combination 3 and 435=Combination 3 and 545=Combination 4 and 5
Child referred by screening agency?1=YES; 2=NO; 4=NO RESPONSE in column 19.Blank in 20.
290

8. REFTYPE
9. IDWHO
Who was referring source or type ofagency in columns 21-22. Blank in 23.1=Hearing and speech clinic2=Audiologist3=Health Department4=Neighbor5=Hospital6=Pediatrician7=Medical8=Central Institute for Deaf (CID)9=Boys Town10=Preschool/Developmental Projram11=Parents as Teachers12=Parents13=Physician14=Handicapped Services/Exceptional
Child Program15=Public or Private School16=ENT17=School for the Deaf and Blind18=Social Worker/Human Services/Adoption
Agency20=Parent Advisor21=Callier22=Keep Pace Program27=High-Risk Registry28=HEAR Foundation
Who suspected in 24-25. Blank in 26.00=No Response1=Parent2=ENT3=Grandparent4=Day Care Center5=Pediatrician6=Physician7=Foster Parent8=Baby Sitter9=Child Development Specialist/Center
for Developmental Disabilities10=Unknown (e.g., adopted)11=Parents as Teachers Organization12=Head Start13=Relatives14=Medical Staff15=School for the Blind16=Audiologist17=Psychologist18=Friend/Neighbor19=Speech Therapist20=Parent Adviser21=School Personnel (pre or elem.)22=Other23=Health Department/Human Services
291
-41-

10. IDWHAT What caused the suspicion in 27-28.Blanks in 29-30.0=Unknown1=Low/No Response to Auditory Stimulus2=Delayed Language/Development3=Otitis Media--Middle Ear4=Heredity/Other Family Members H-I5=Rubella/CMV6=Meningitis7=Syndrome8=Premature9=Birth Complications10=No response to the question11=Combination of 1, 2, and 312=Combination of 1 and 213=Combination of 1 and 314=Combination of 1 and 415=Combination of 1 and 516=Combination of 1 and 617=Combination of 1 and 720=Siezures21=Decreased neck control/Hold Head to
Side22=Illness/High Temperature/Health
Problems23=Combination of 2 and 324=Combination of 2 and 426=Combination of 2 and 627=Combination of 2 and 730=Combination of 31 and 131=Birth Defect32=Accident33=Attention Deficit/Behavior Problem
/Noisy Child34=Combination of 3 and 435=Combination of 5 and 1236=High-Risk Register Card38=Combination of 7 and 3140=Brain Damage41=School Screening42=Medical Check-up43=Combination of 2 and 2244=Combination 4 and 3146=Combination 31 and 3350=Doing poorly in school51=Combination 4 and 3652=Combination of 3 and 3155=Combination
behaviorsof 2 and autistic
62=Combination of 2 and 3363=Combination of 3 and 3365=Combination of 2 and 3169=Combination of 6 and 989=Combination of 8 and 9
292
14 J
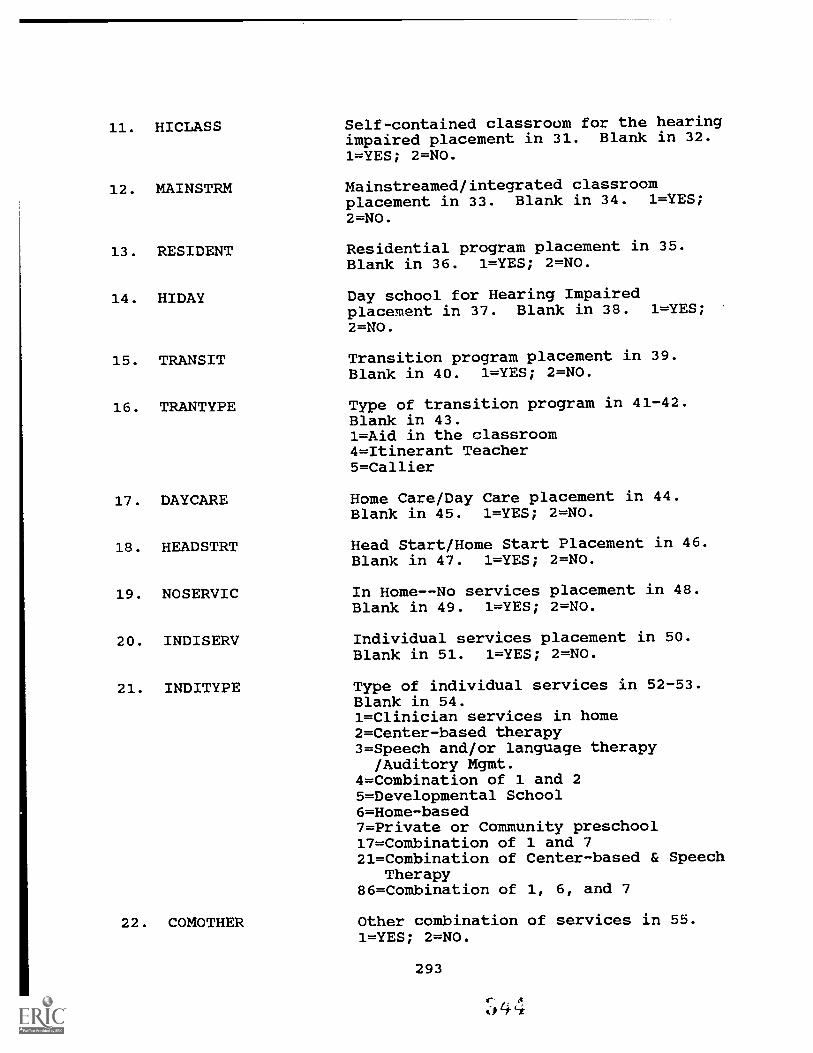
11. HICLASS
12. MAINSTRM
13. RESIDENT
14. HIDAY
15. TRANSIT
16. TRANTYPE
17. DAYCARE
18. HEADSTRT
19. NOSERVIC
20. INDISERV
21. INDITYPE
Self-contained classroom for the hearingimpaired placement in 31. Blank in 32.1=YES; 2=NO.
Mainstreamed/integrated classroomplacement in 33. Blank in 34. 1=YES;2=NO.
Residential program placement in 35.Blank in 36. 1=YES; 2=NO.
Day school for Hearing Impairedplacement in 37. Blank in 38. 1=YES;2=NO.
Transition program placement in 39.Blank in 40. 1=YES; 2=NO.
Type of transition program in 41-42.Blank in 43.1=Aid in the classroom4=Itinerant Teacher5=Callier
Home Care/Day Care placement in 44.Blank in 45. 1=YES; 2=NO.
Head Start/Home Start Placement in 46.Blank in 47. 1=YES; 2=NO.
In Home--No services placement in 48.Blank in 49. 1=YES; 2=NO.
Individual services placement in 50.Blank in 51. 1=YES; 2=NO.
Type of individual services in 52-53.Blank in 54.1=Clinician services in home2=Center-based therapy3=Speech and/or language therapy
/Auditory Mgmt.4=Combination of 1 and 25=Developmental School6=Home-based7=Private or Community preschool17=Combination of 1 and 721=Combination of Center-based & Speech
Therapy86=Combination of 1, 6, and 7
22. COMOTHER Other combination of services in 55.1=YES; 2=NO.
293
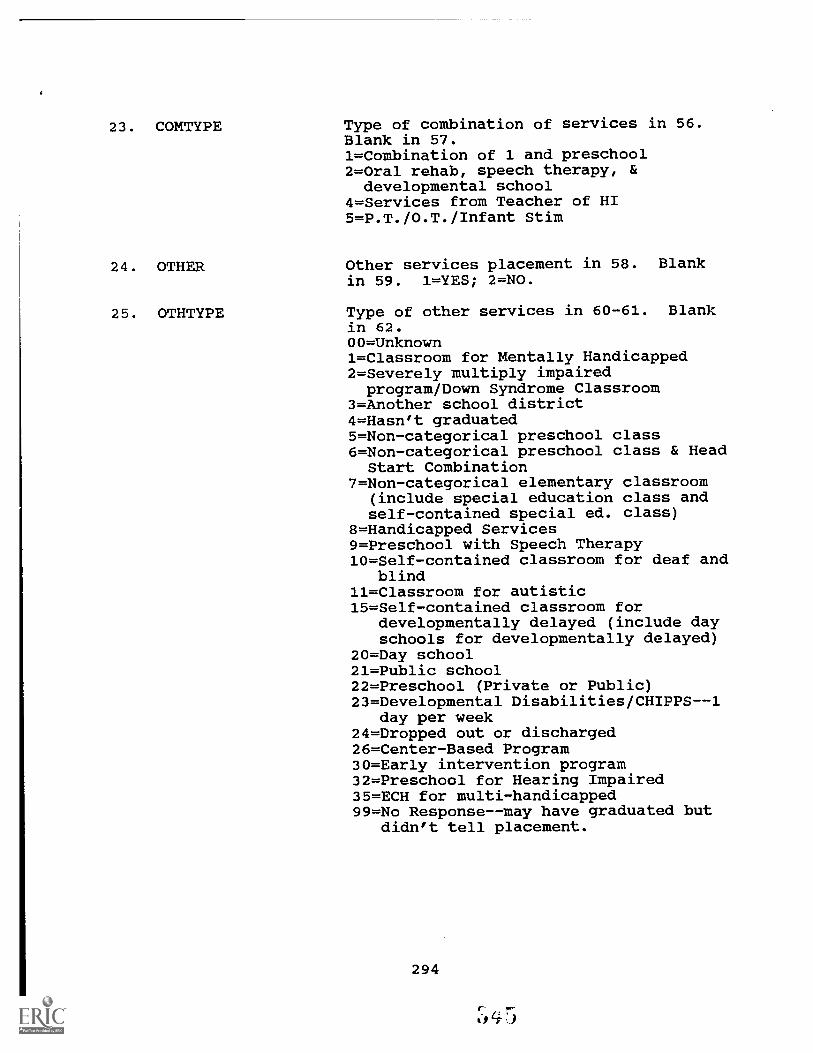
23. COMTYPE Type of combination of services in 56.Blank in 57.1=Combination of 1 and preschool2=Oral rehab, speech therapy, &developmental school
4=Services from Teacher of HI5=P.T./0.T./Infant Stim
24. OTHER Other services placement in 58. Blankin 59. 1=YES; 2=NO.
25. OTHTYPE Type of other services in 60-61. Blankin 62.00=Unknown1=Classroom for Mentally Handicapped2=Severely multiply impairedprogram/Down Syndrome Classroom
3=Another school district4=Hasn't graduated5=Non-categorical preschool class6=Non-categorical preschool class & Head
Start Combination7=Non-categorical elementary classroom
(include special education class andself-contained special ed. class)
8=Handicapped Services9=Preschool with Speech Therapy10=Self-contained classroom for deaf and
blind11=Classroom for autistic15=Self-contained classroom for
developmentally delayed (include dayschools for developmentally delayed)
20=Day school21=Public school22=Preschool (Private or Public)23=Developmental Disabilities/CHIPPS--1
day per week24=Dropped out or discharged26=Center-Based Program30=Early intervention program32=Preschool for Hearing Impaired35=ECH for multi-handicapped99=No Response--may have graduated but
didn't tell placement.
294

26. CURPLACE Child's current placement in 63-64.O =Don't know/Moved/Placed in AnotherProgram
1=No Response/Can't Tell: Abbreviation2=Mainstreamed/integrated classroom3=Residential program--School for Deaf4=Day School for Hearing Impaired5=Self-contained classroom for HI6=Combination--Self-contained classroomplus Head Start/Early Childhood Class
7=Combination--self-contained pluspreschool
8=In Home--No Services10=Speech/Language Therapy12=Combination--Self-contained classroom
for HI and mainstreamed13=Combination--Self-contained classroom
plus mainstreamed with interpreter14=Combination--Preschool plus
interpreter plus Deaf Ed Classes15=Special Ed with HI monitoring17=Comb. Home-based with O.T. /P.T. and
Infant Stimulation19=Combination--Self-contained classroom
for HI and individual services24=Combination of 2 and 427=Combination Preschool (Head Start)
plus language therapy28=Combination of Clinician Services,
Home based, & private preschool30=Speech Therapy31=Private School plus cued speech plus
language/speech therapy45=Combination of 4 and 574=Preschool (public or private)75=Combination Mainstream and Resource
Room and/or Speech Therapy and/orItinerant/Support Services
76=Preschool for Hearing Impaired77=Preschool plus interpreter78=Public School and Consultant79=Transition program80=Autistic classroom81=School for the deaf and/or blind--Day
School82=Preschool/Early Childhood and Speech
Therapy/Services from Teacher of HI83= Handicapyed Services84=Noncategtrical self-contained
classroom85=Combination--public school and
special education86=Combination--Individual services and
center-based therapy87=Special Ed. Class/Mental Retardation88=Severely multiply impaired program89=Combination--Self-contained classroom
plus OT and PT
295

90=Combination--Mainstreamed andinterpreter
91=Developmental Preschool/Day CareCenter
92=Deceased93=Public School94=Preschool Noncategorical/Special
Needs/Child Development Center95=Hasn't graduated96=Combination--Day School for HI and
Center-based Therapy97=Combination--Mainstreamed classroom
and center-based therapy98=Combination--Mainstreamed classroom
and clinician services in home99=Combination--Mainstreamed classroom,
Home Care/Day Care, and center-basedtherapy

Appendix GPERSONNEL DESCRIPTION
Utah Parent/Infant Program Parent Advisors--1990-1991N = 35
Years of Professional Experience
Mean 10.6 years
Standard Deviation 6.7 years
Median 11 years
Mode 12 years
Range 1 tt. 33 years
Educational Credentials
Area Number of PAsHighest Decree
PhD
MEd/MS/MA
Developmental Psychology
Deaf Educ./Educ. of Hearing Impaired
1
6Speech-Language Pathology 5Audiology 4Family Relations 1Special Education 1
BS/BA Elementary Education 4Communicative Disorders/Spch. & Hrg. Sc. 3Education 2Special Education 1Family Life 1Social Sciences 1
Associates Liberal Arts 1
No Degree Some College Course Work 4
Total 35
Certification Credentials
Credential
Teaching
Area Number of PAs
Elementary Education 9Special Education 8Deaf Educ/Teacher of Hearing Impaired 5
Early Childhood 3Audiology 1
Secondary Education 1Music Education 1
ASHA CCC Speech-Language PathologyAudiology
Licensure Utah: Speech-Language Pathology
SKI*HI Trainer or National Trainer
Certificate Sign Language
22
1
3
2
Total 38Note: Total certification credentials is greater than total number of PAs,because some PAs have multiple credentials while others have none.
297

Name of Agency:
Address:
Site Prefix:
Appendix H
SKI*HI DATA RESEARCH 1989-92PARTICIPATION RESPONSE FORM
Name of Contact Person for Data Research:
Telephone Number:
Yes! We will participate in the SKI*HI Data ResearchStudy that will investigate the relationship betweenspecific identification procedures (e.g., Crib-o-gram,high-risk registers, parental suspicion and referral)and specific demographic variables (e.g., age of ident-ification, time interval between suspicion of hearingloss and identification, and time between identificationand program placement).
We understand our participation will involve the programsupervisor's completion of a questionnaire concerningidentification procedures. It will also involve facili-tating a survey of parents who have participated in theprogram.
Yes! We will participated in the SKI*HI Data ResearchStudy that will investigate child placement information.
We understand this will involve the completion of a surveyform.
Signed:(Signature)
(Typewritten or Printed Name)
TPosition)
(Date)
298

SKI*HI INSTITUTE, Logan, Utah
Research on the Effectiveness of At-Home Programming (REAP)
Summary Data--SKI*HI National Data Bank--1979 to 1991
Utah and SKI*HI Overall
July, 1992
Skip ReeseUtah Parent-Infant-ProgramUtah Schools for the Deaf and Blind846 20th St.Ogden, Utah 84401
Dear Skip:
In 1989 the U. S. Department of Education, Office of Special Education andRehabilitative Services, awarded a research grant to the SKI*HI Institute forthe purpose of analyzing the data submitted by parent advisors to the SKI*HINational Data Bank since 1979. That funding period ends on June 30, 1992.The three research objectives that have guided the investigation were todetermine: (a) the demiographic characteristics of the children with hearingimpairments who have participated in home-based programming; (b) how thechildren with hearing impairments were identified and which identificationprocedure resulted in the earliest age of identification and programplacement; and (c) the effectiveness of home-based programming with respect tochild-communication gains, parent-skill acquisition, and placement after home-based programming. An in-depth final report will be submitted to the fundingagency in July. The information will be disseminated as well through articlessubmitted to professional journals and through presentations at conferences.
Overall, data were submitted for 5,178 children between 1979 and 1991. Duringthat same time period, data for'715 children (14% of the total) were submittedby the Utah Parent-Infant-Program.
Your site also participated in a special questionnaire study related toidentification procedures and placement after home programming for the years1986 to 1989. Overall, data were submitted for 1,404 children for that study,with your site contributing data for 211 children (15% of the total).
So that you can compare the findings for your site with those for SRI*HIoverall, both sets of data are provided in the nine tables which are enclosedand appear in the following order:
Table
1 Frequencies and percentages of children for each of thedemographic characteristics.
2 Mean, standard deviation, and median ages and intervals (inmonths). (Note: For this table, the median is a better estimateof central tendency than the mean.)
299
ere?, Anant mita BO s ME

Table
3 Frequencies and percentages of children for identificationprocedure, who suspected the hearing loss, cause of suspicion ofthe hearing loss, referral by the screening agency, and type ofreferring agency.
4 Mean, standard deviation, and median pre-, post-, and predictedLDS scores and Proportional Change Indexes (PCI :) for bothreceptive and expressive language.
The pre-test scores are the first LDS receptive and expressivescores for each child that were submitted to the National DataBank and the post-test scores are the last scores submitted.Treatment time is calculated by determining the time, in months,between the first and the last LDS test score.
The predicted mean post-test score indicates what the childrenwould have scored as a result of maturation alone. For example,an actual mean post-test score of 26.E and a predicted mean post-test score of 20.5 indicates that, on the average, the children'sactual mean post-test score was six months greater than would beexpected due to maturation alone.
The PCI is a ratio of the child's rate of progress duringintervention as compared to the rate of progress prior tointervention. For example, a mean PCI of 2.0 indicates that theaverage rate of progress during intervention was two times greaterthan the average rate of progress prior to intervention.
5 Frequencies and percentages of children for each level of hearingaid usage and the average time (in months) to attain thechildren's highest level of hearing aid usage.
6 Mean, standard deviation, and median beginning and ending levelsfor child auditory, communication-language, and vocabularydevelopment and acquisition times.
7 Mean, standard deviation, and median number of auditory,communication, aural-oral, total communication, and cognitionskills acquired by parents and acquisition times.
8 Mean, standard deviation, median, and range for treatment density(i.e., actual number of visits per month) and treatment amount(i.e., time between the pretest and the posttest).
9 Frequencies and percentages of children for placement after homeprogramming.
10 Frequencies and percentages of children for current placement.
If you need assistance in interpreting the tables, please contact Carol Strongor Beth Walden at the SICI*H/ Institute by August 31, 1992 (801) 752-4601.
We have the following suggested uses for these data:1. Make transparencies and/or copies of the tables.
2. Present the data to your parent advisors and other staff members.Your parent advisors will pleased to know the results of theirwork.
3. Share the data with your administrators, your state office, and,if possible to appropriate state professional groups. The dataspeak well of your program.
300
351

If you wish to use the data in written documents, please use the followingcitation as a reference:
Strong, C. J., Clark, T. C., Barringer, D. O., Walden, B., & Williams, S.A. (1992). Research on the effects of home intervention on hearing=impaired children and their families (Project No. H023C90117). FinalReport to the U. S. Department of Education, Office of Special Educationand Rehabilitative Services. Logan, UT: SRI*HI Institute, Department ofCommunicative Disorders, Utah State University.
Your participation in the National Data Bank has been greatly appreciated. Wehope this summary of your contributions will be useful to you. And we hopethat you will continue to submit demographic and child-progress data for thechildren that you serve.
Sincerely,
Dr. Carol Strong Dr. Thomas C. ClarkResearch Director, Project REAP Project Director
301
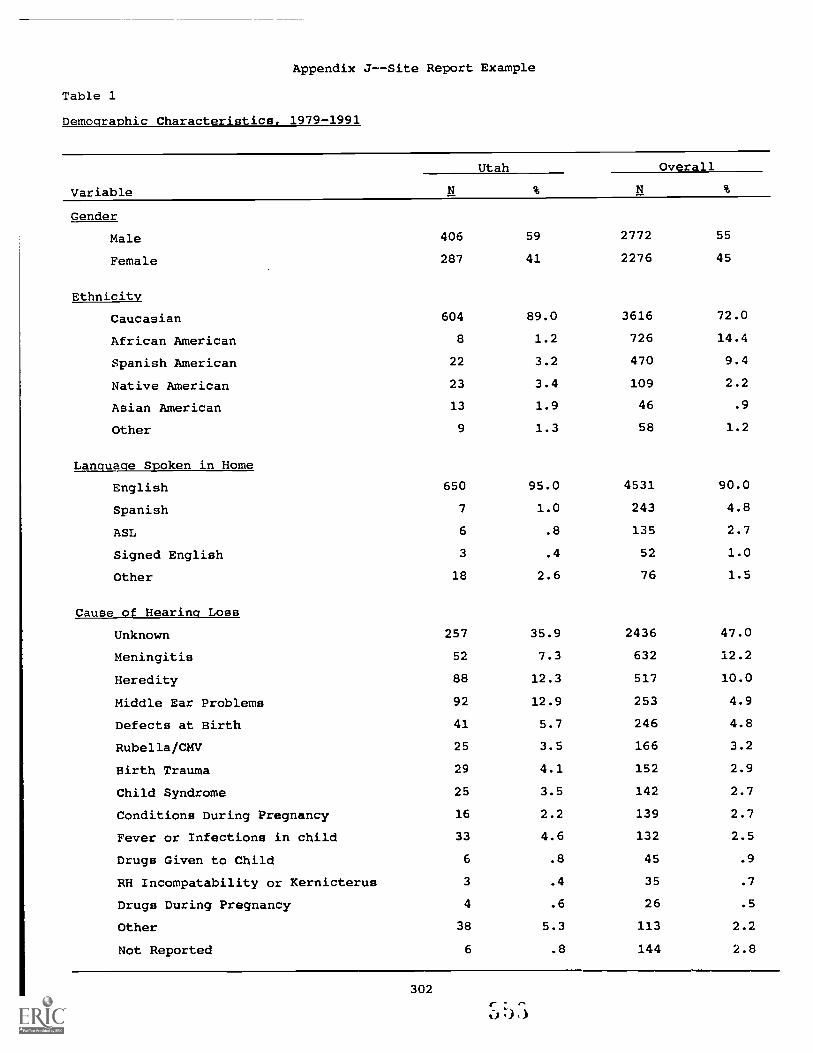
Appendix J--Site Report Example
Table 1
Demographic Characteristics, 1979-1991
Variable
Utah Overall
Gender
Male 406 59 2772 55
Female 287 41 2276 45
Ethnicity
Caucasian 604 89.0 3616 72.0
African American 8 1.2 726 14.4
Spanish American 22 3.2 470 9.4
Native American 23 3.4 109 2.2
Asian American 13 1.9 46 .9
Other 9 1.3 58 1.2
Language Spoken in Home
English 650 95.0 4531 90.0
Spanish 7 1.0 243 4.8
ASL 6 .8 135 2.7
Signed English 3 .4 52 1.0
Other 18 2.6 76 1.5
Cause of Hearing Loss
Unknown 257 35.9 2436 47.0
Meningitis 52 7.3 632 12.2
Heredity 88 12.3 517 10.0
Middle Ear Problems 92 12.9 253 4.9
Defects at Birth 41 5.7 246 4.8
Rubella/CMV 25 3.5 166 3.2
Birth Trauma 29 4.1 152 2.9
Child Syndrome 25 3.5 142 2.7
Conditions During Pregnancy 16 2.2 139 2.7
Fever or Infections in child 33 4.6 132 2.5
Drugs Given to Child 6 .8 45 .9
RH Incompatability or Kernicterus 3 .4 35 .7
Drugs During Pregnancy 4 .6 26 .5
Other 38 5.3 113 2.2
Not Reported 6 .8 144 2.8
302
a)

Table 1 (Continued)
Variable
Utah Overall
Planned Frequency of Home Visits
629
30
9
3
3
93.3
4.5
1.3
.4
.4
4163
455
177
75
61
11
42
83.5
9.1
3.6
1.5
1.2
.2
.8
Once a Week
Every Other Week
Twice a Week
Monthly
Irregular
Bi-Monthly
Other
Actual Frequency of Home Visits
One Time per Month 34 16.4 275 22.3
Two Times per Month 44 21.3 326 26.5
Three Times per Month 64 30.9 366 29.8
Four Times per Month 50 24.2 207 16.8
Greater than Four Times Per Month 15 7.2 55 4.5
Treatment Amount
O to 6 Months 67 13.0 466 14.4
6 to 12 Months 145 28.1 991 30.7
12 to 18 Months 118 22.9 720 22.3
18 to 24 Months 99 19.2 506 15.7
Greater than 24 Months 87 16.9 548 17.0
Other Services Received
Education 128 57.9 1170 46.3
Other and Combinations 50 22.6 608 24.1
Speech and Hearing 7 3.2 278 11.0
Education and Speech 7 3.2 187 7.4
Health 25 11.3 121 4.8
Mental Health 1 .5 88 3.5
Social Services 2 .9 58 2.3
Mental Retardation 1 .5 15 .6
Note: N = Sample SizeTotal children possible for SKI*HI overall, N = 5,178.Total children possible for Utah, N = 715.Actual Frequency of Home Visits data collected only for years 1987-1991.
303

Table 1 (Continued)
Variable
Utah Overall
Presence of Other Handicaps
Other Handicap Present 198 28.8 1227 24.7
Other Handicap Not Present 490 71.2 3747 75.3
Presence of Hearing Impaired Parent
One or Both Hearing Impaired Parent 64 9.3 448 9.0
No Hearing Impaired Parent 624 90.7 4552 91.0
Type of Hearing Loss
Sensorineural 459 68.6 4081 82.1
Mixed 61 9.1 393 7.9
Conductive 143 21.4 333 6.7
Not Yet Determined 6 .9 161 3.2
Severity of Unaided Hearing Loss
No 88 14.1 166 3.7
Mild 106 17.0 388 8.7
Moderate 143 22.9 884 19.8
Severe 203 32.5 2005 45.0
Profound 84 13.5 1015 22.8
Severity of Aided Hearing Loss
No 86 28.5 338 14.1
Mild 107 35.4 791 33.1
Moderate 67 22.2 660 27.6
Severe 39 12.9 524 21.9
Profound 3 1.0 78 3.1
Age at Onset
At Birth 242 81.5 1544 71.8
Under 1 Year 26 8.8 309 14.4
1 Year 23 7.7 214 10.0
2 Years 3 1.0 63 2.9
3 Years and Over 3 1.0 19 .9
Communication Methodology
Total Communication 89 13.8 2187 45.0
Aural/Oral 287 44.4 1470 30.2
Diagnostic/Prescriptive 251 38.8 1128 23.2
Other 20 3.1 76 1.6
304

Table 2
Mean, Standard Deviation and Median Ages or Intervals (in Months), 1979-1991
Utah
Overall
SD
Mdn
NSD
Mdn
N
Age of Identification (ID)
19.3
15.2
17
658
18.9
13.0
17
4848
Age of ID if Hearing Loss
18.8
12.7
17
49
20.2
12.2
18
582
Occurred after Birth
Age of Program Start
26.7
16.5
24
685
26.4
14.1
25
5017
Age Hearing Aid Fit
25.8
16.2
22.5
460
23.8
13.1
22
4026
Age Communication
32.7
15.1
31
252
28.9
13.6
28
2694
Methodology Begun
Age of Graduation
43.3
13.4
41
125
43.0
13.0
42
1481
o Interval from Suspicion
in to Identification
5.9
7.8
3600
5.7
7.4
34416
Interval from Identification
to Program Start
7.3
10.3
3645
7.2
9.2
44798
Interval from Suspicion
to Program Start
12.4
11.7
9574
12.7
11.1
94321
Interval from Program
3.7
6.4
0250
2.3
4.6
02679
Start to Communication
Methodology Choice
Note:
N = Sample Size
Total children possible = 5,178 for SKI*HI overall.
For Utah, Total children possible = 715.

Table 3
Identification Procedures, 1986-1989
Variable
Utah Overall
ID Procedure
Suspected by People 172 83.9 1106 84.9
ABR 33 16.1 152 11.7
Behavioral Audiometry 31 2.4
Immittance 7 .5
Crib-O-Gram 6 .5
Who Suspected Hearing Loss
Caregivers 87 48.9 835 71.0
Medical Personnel 44 24.7 170 14.5
Educators 9 5.1 51 4.3
Other Specialists 31 17.4 34 2.9
Health/Human Services Personnel 1 .6 16 1.4
No Response/Unknown 6 3.4 70 6.0
Cause of Suspicion of Hearing Loss
Auditory or Language Delay 107 60.1 777 66.1
Heredity 8 4.5 72 6.1
Meningitis 14 7.9 72 6.1
Birth Complications/Defects 16 9.0 64 5.4
Otitis Media/Middle Ear 7 3.9 27 2.3
Medical/School Screening 6 3.4 19 1.6
ADD/Behavior Problem 2 1.1 13 1.1
Health Problems 2 1.1 11 .9
Rubella/CMV 3 1.7 11 .9
High-Risk Register Card 3 1.7 3 .3
No Response/Unknown 10 5.6 107 9.1
Referred to Home-Based Program byScreening Agency
Yes 31 93.9 158 77.5
No 2 6.1 37 18.1
No Response 9 4.4
Type of Referring Agency
Medical 5 16.7 75 40.3
Audiology/Speech-Language Pathology 23 76.7 58 31.2
Educational -- 34 18.3
Health/Human Services 2 6.7 15 8.1
Parents -- 4 2.2
Note: N = Sample Size. Total sample possible = 1,404; for Utah = 211.
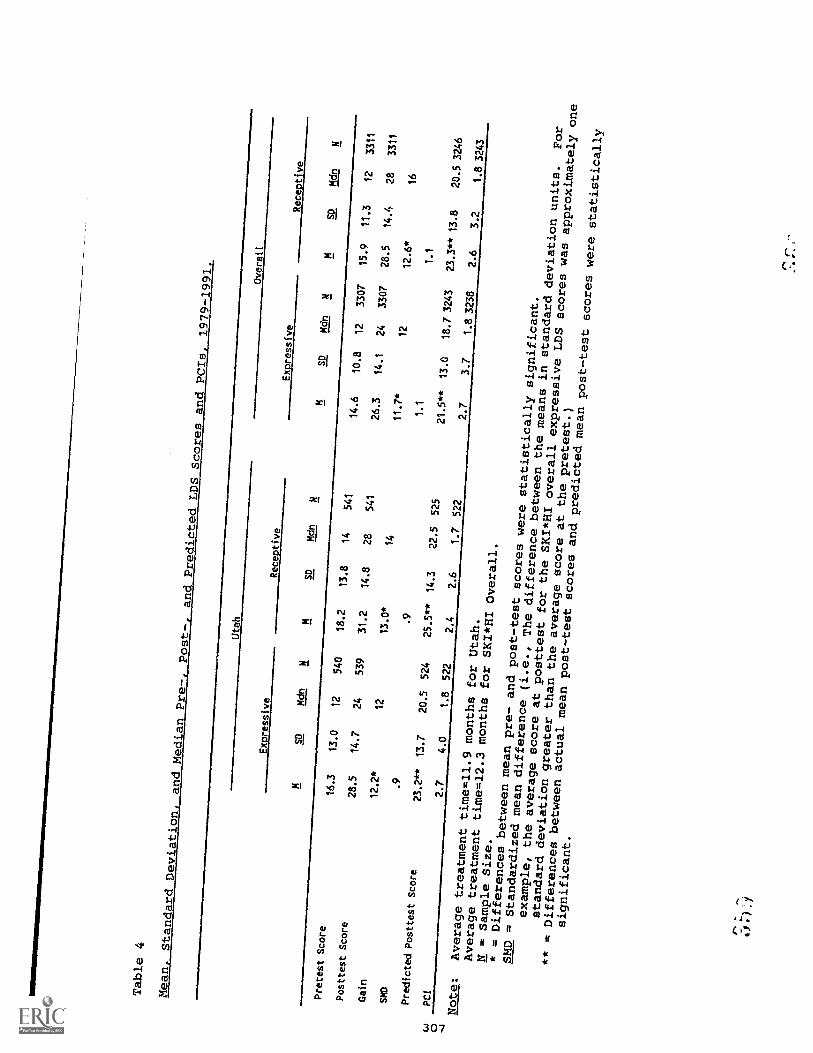
Table 4
Mean, StandardDeviation, andMedian Pre-, Post-, andPredictedLDS Scores
and PCIs,
1979-1991.
Utah
Overall
Expressive
Receptive
Expressive
Receptive
SD
Mdn
NM
SD
Mdn
NM
SD
Mdn
NM
SD
Mdn
N
Pretest Score
16.3
13.0
12
540
18.2
13.8
14
541
14.6
10.8
12
3307
15.9
11.3
12
3311
Posttest Score
28.5
14.7
24
539
31.2
14.8
28
541
26.3
14.1
24
3307
28.5
14.4
28
3311
Cain
12.2*
12
13.0*
14
11.7*
12
12.6*
16
SMD
.9
.9
1.1
1.1
Predicted Posttest
Score
23.2**
13.7
20.5
524
25.5**
14.3
22.5
525
21.5**
13.0
18.73243
23.3**
13.8
20.53246
c.3
PC1
2.7
4.0
1.8
522
2.4
2.6
1.7
522
2.7
3.7
1.83238
2.6
3.2
1.83243
0
Note:
Averagetreatment
time=11.9
months for
Utah.
Averagetreatmenttime=12.3
months for
SKI*HI Overall.
N = Sample
Size.
* = Differences
betweenmean pre- andpost-test
scores were
statistically
significant.
SMD =
Standardizedmean difference
(i.e., The
differencebetween the
means in standarddeviation
units.
For
example, theaverage score
at posttest
for the
SKI*HI overallexpressive LDS
scores was
approximatelyone
standarddeviationgreater thanthe average
score at thepretest.)
** = Differences
between actualmean post-test
scores andpredictedmean post-test
scores were
statistically
significant.

Table 5
Highest Level of Hearing Aid Usage, 1987-1991
Frequencies and Percentages
Time
in Months
to Attain Highest Level of Hearing
Utah
Overall
Aid Use
Overall
Utah
SD
Mdn
MSD
Mdn
Less Than
13
7.2
130
8.8
2.5
2.4
22.3
3.9
01/4 Time
1/4 to 1/2
84.4
111
7.5
2.1
3.8
.5
3.3
5.0
1Time
1/2 to 3/4
15
8.3
153
10.4
3.7
4.7
24.6
5.3
3Time
3/4 to Full
25
13.9
222
15.0
3.9
3.5
34.4
5.4
3Time
Full Time
119
66.1
860
58.3
2.8
4.4
12.8
4.5
10
Total
180
100.0
1476
100.0
3.0
4.1
13.2
4.8
1
Note:
N = Sample Size.

Table 6
Means, Standard Deviations, Medians, and
Ranges for Child Auditory, Communication- Language, and Vocabulary Levels
and Acquisition Times, 1987-1991
Uta
hO
vera
ll
Mea
nSD
Med
ian
Ran
geN
Mea
nSD
Med
ian
Ran
ge
Beg
inni
ng L
evel
End
ing
Lev
el
Dif
fere
nce
Ti:A
e In
terv
al (
inM
onth
s) to
Atta
inE
ndin
g L
evel
4.9
8.2
3.3
5.4
3.7
3.1
5.2
4 10 6 4
Aud
itory
(11
Lev
els)
3.2
6.4
3.2
5.2
3.1
3.5
5.8
2 7 5 30-
3114
220-
2423
8
Com
mun
icat
ion-
Lan
zum
(12
Lev
els)
IAB
egin
ning
Lev
el5.
23.
35
4.0
2.9
30
End
ing
Lev
el8.
13.
19
7.2
3.0
8D
iffe
renc
e2.
94
3.2
5T
ime
Inte
rval
Inte
rval
(in
6.0
5.8
50-
2726
06.
56.
75
0-48
1633
Mon
ths)
to A
ttain
End
ing
Lev
el
Voc
abul
ary
(8 L
evel
s)
Beg
inni
ng L
evel
2.6
2.3
12.
42.
11
End
ing
Lev
el4.
42.
64
4.5
2.6
5
Dif
fere
nce
1.8
32.
14
Tim
e In
terv
al (
in6.
26.
24
0-27
255
6.4
6.6
50-
4115
65M
onth
s) to
Atta
inE
ndin
g L
evel
Note:
N = Sampl-.: Size.
rA
tlt
I

Table 7
Means, Standard Deviations, and Medians for Number
of Skills Acquired by Parents and Time
in Months to Acquire Skills,
1987-1991
Skill
Utah
Overall
MSD
Mdn
NM
SD
Mdn
Number of Skills
Auditory (11 skills)
5.0
3.2
4202
4.6
3.1
41327
Communication (15 skills)
7.6
4.7
7223
8.1
5.0
81493
Aural-Oral (9 skills)
4.2
2.8
4137
4.7
2.9
5702
Total Communication (20 skills)
5.9
4.3
555
6.7
5.0
6607
Cognition (12 skills)
4.0
3.1
350
4.4
3.4
3265
Time in Months
0Auditory
6.6
5.1
5164
6.4
5.9
51057
Communication
5.9
4.R
5197
6.0
5.1
51299
Aural-Oral
4.4
4.0
397
5.0
4.7
4547
Total Communication
5.3
4.0
545
6.4
5.7
5561
Cognition
3.7
3.7
337
4.6
4.9
3200
Note:
N = Sample Size.

Table 8
Means, Standard Deviations, Medians, and Ranges for Treatment Amount, Treatment Density, and Gaintime (in Months)
Var
iabl
e
Uta
hO
vera
ll
MSD
Mdn
Ran
geN
MSD
Mdn
Ran
ge
Am
ount
15.1
9.1
142-
5751
614
.89.
913
1-78
3231
Den
sity
2.9
1.5
3.2
-12
207
2.6
1.4
2.5
.1-1
512
29
Gai
ntim
e11
.98.
110
1-54
526
12.3
8.7
91-
6032
59
Note:
N = Sample Size.
Amount = time between program start and post-test, 1979-1991.
Density = actual number of visits per month, 1987-1991.
Gaintime = time between pre-test and post-test, 1979-1991.

Table 9
Frequencies and Percentages of Children for Placement After Home Programming,
1986-1989
Placement
Utah Overall
Self-Contained Class for the Hearing Impaired 139 66 547 39
Day School for the Hearing Impaired 0 211 15
Mainstreamed-Integrated Classroom 24 11 167 12
Other Services Utah Overall 24 11 83 6
Class for Mentally Handicapped 1 12
Class for Severely Impaired 2 5
Non-Categorical Class 16 46
Developmentally Delayed Class 7
Other 5 13
Individual Speech-Language-Auditory Services 1 <1 78 6
Headstart-Homestart-Preschool 9 4 34 2
Residential Program 0 31 2
In Home-No Services 2 1 22 2
Day Care 2 1 8 1
Transition Program 0 3 <1
Hasn't Graduated 0 73 5
Unknown/Not Reported 10 5 278 20
Total Placements 211 100 1535 110
Note: N = Sample Size.Total children possible SKI*HI overall = 1404; Utah = 211.Total percentages may be greater than 100%, because some children have more than one
placement setting.
312
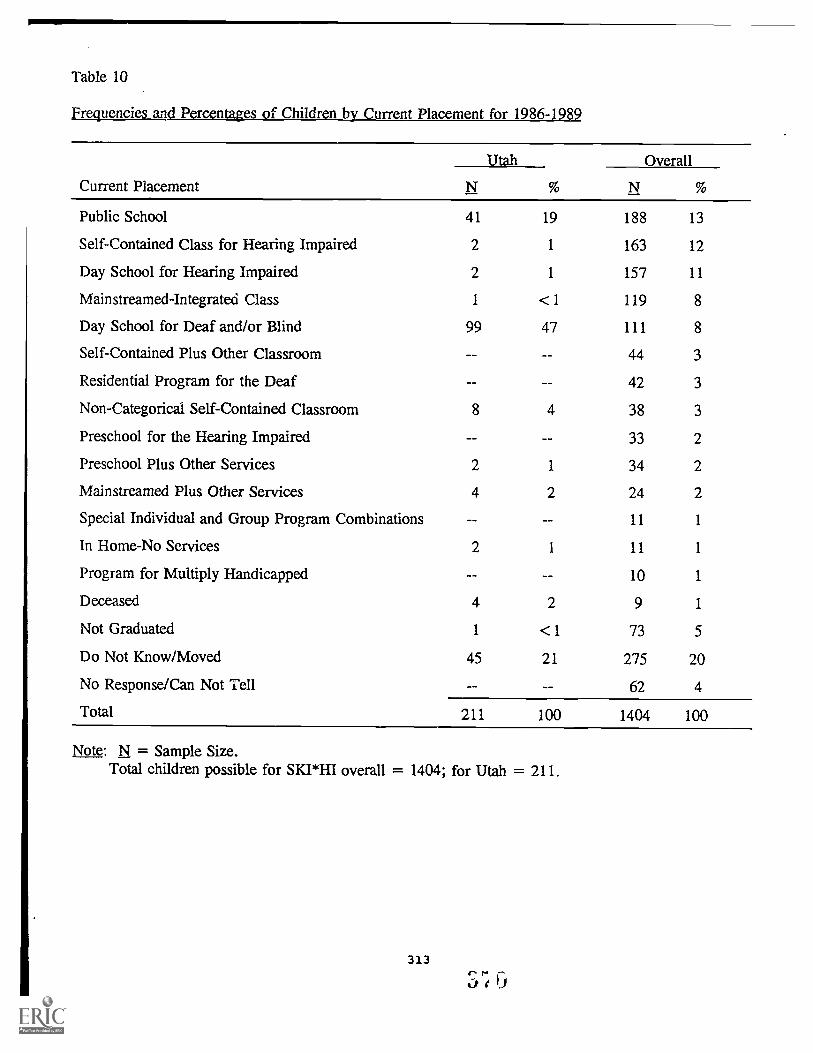
Table 10
Frequencies and Percentages of Children by Current Placement for 1986-1989
Current Placement
Utah Overall
N % N
Public School 41 19 188 13
Self-Contained Class for Hearing Impaired 2 1 163 12
Day School for Hearing Impaired 2 1 157 11
Mainstreamed-Integrated Class 1 <1 119 8
Day School for Deaf and/or Blind 99 47 111 8
Self-Contained Plus Other Classroom 44 3
Residential Program for the Deaf 42 3
Non-Categorical Self-Contained Classroom 8 4 38 3
Preschool for the Hearing Impaired 33 2
Preschool Plus Other Services 2 1 34 2
Mainstreamed Plus Other Services 4 2 24 2
Special Individual and Group Program Combinations 11 1
In Home-No Services 2 I 11 1
Program for Multiply Handicapped 10 1
Deceased 4 2 9 1
Not Graduated 1 <1 73 5
Do Not Know/Moved 45 21 275 20
No Response/Can Not Tell 62 4
Total 211 100 1404 100
Note: N = Sample Size.Total children possible for SKI*HI overall = 1404; for Utah = 211.
313
S;