skid resistance of nontangent sections of roadways · skid resistance, nontangent skid resistance,...
TRANSCRIPT

Skid Resistance of Nontangent Sections of
Roadways
1980
Texas Transportation Institute

Technical keport Documentation Page
1. Report No. 2. Government Accession No. 3. Recipient's Catalog No.
FHWA-RD-80-
4. Ti tie and Subtitle 5. Report Date
February, 1980 SKID RESISTANCE OF NONTANGENT SECTIONS OF ROADWAYS 6. Performing Organization Code
3871 !-:;-~-,-....,....,----------------------; 8. Performing Organization Report No.
7. Authorls)
R. D. Tonda and R. A. Zimmer 9. Performing Organization Name and Addreu
Texas Transportation Institute Texas A&M University
TTI-ARP-3871-1 10. Work Unit No. (TRAIS)
FCP 31W2-014 11. Contract or Grant No.
Contract DOT-FH-ll-9481 College Station, Texas 13. Type of Report and Period Covered
r::-12::-. -S-po-n-.o-rin_g_A_g.-n-cy_N_a_m.-a-n~d ~Ad-:-:-d-re-.. -----------------1 Interim Report (Phase I)
Federal Highway Administration Office of Research and Development HRS-12 Washingtqn, D. C. 20590
15. Supplementary. Notu
September, 1978-February, 1980
14. Sponooring Agency Code
HRS-12
FHWA Contract Manager: Glenn Balmer (HRS-12)
16. Abstract
This report presents the results of a detailed literature review and a limit~ ed testing program analyzing the various methods of skid resistance measurement and their applicability for use on nontangent sections of roadway. Considerable emphasis is placed on the current ASTM E-274 two-wheel skid trailer. Other techniques evaluated include the Mu-Meter, the one-wheel skid trailer, the British Pendulum Tester, the Diagonal Braked Vehicle and the SAAB Friction Tester.
The preliminary analysis indicates that the two-wheel ASTM E-274 skid trailer, with only minor modifications, is a suitable method for nontangent skid resistance measurement. The appropriate modifications are outlined in the text. Additional modifications and design concepts are proposed for the at-speed measurement of highway geometries which may effect the computed skid number. A test plan for the detailed design, development, construction and full-scale validation testing of a suitably modified trailer is presented as the outline for Phase II of the research effort.
17. Key Words
Skid Resistance, Nontangent Skid Resistance, Skid Number, Highway Safety, Pavement'Surface Design, Highway Geometries, Pavements
18. Distribution Statement
No restriction. This document is available through the National Technical Information Service, Springfield, Virginia 22161
19. Security Claui f. (of thi 1 report) 20. Security Clouil. (of thi a page) 21. No. of Pages 22. Price
Unclassified Unclassified 88
Form DOT F 1700.7 <8-72) Reproduction of completed poge author! z:ed

PREFACE.
This is the first report issued in a two-phase study under DOT
Contract FH-11~9481, which deals with 11 Skid Resistance of Nontangent
Sections of Roadways 11 •
This report presents the results of a detailed literature review
and a limited testing program evaluating the measured and projected
nontangent performance of the currently popular and promising methods
of skid resistance measurement.
Recommendations are presented for work to be accomplished in Phase
II of the study which efforts will fill gaps revealed by the investiga
tions of Phase I. develop and construct a modified ASTM E-274 two-wheel
skid trailer and evaluate its performance, both tangent and nontangent,
in considerable detail.
ii

ACKNOWLEDGMENTS
The authors wish to express their appreciation to Mr. Glenn Balmer,
contract representative of the Federal Highway Administration, for his
assistance in securing vital background information for the study and
for his counsel and devoted interest in assuring the successful execu
tion of the objectives of the study.
The secretarial and technical staff of the Safety Division is com
mended for the preparation of the manuscript.
iii

I.
II.
C 0 N T E N T S --------
INTRODUCTION . . . . . . . . . . . . . . . . . .
CAPABILITIES AND LIMITATIONS OF THE TWO-WHEEL ASTM E-274 SKID TRAILER . . . . . . . . . . . .
PAGE NUMBER
1
3
III .. ALTERNATE EQUIPMENT FOR MEASUREMENT OF SKID-RESISTANCE OF NONTANGENT SECTIONS . • . . . . . . . . . 32
IV. EVALUATION OF ALTERNATIVES TO AND RECOMMENDATIONS FOR THE MEASUREMENT OF SKID RESISTANCE OF NONTANGENT SECTIONS . '· . . . . . . . . . . . . . . . . . . . . • . 51
V. TECHNIQUES USING THE TWO-WHEEL ASTM E-274 SKID TRAILER FOR THE WET-PAVEMENT.MEASUREMENT OF SKID RESISTANCE OF NONTANGENT SECTIONS WITH ADDITIONAL INSTRUMENTATION FOR DYNAMICALLY MEASURING HIGHWAY GEOMETRICS ....•. 57
VI. VEHICLE HANDLING TESTS WHICH SHOULD RELATE SKID EQUIPMENT TEST RESULTS TO PASSENGER CAR PERFORMANCE ... 67
VII. RECOMMENDATIONS FOR THE PHASE II PROJECT WORK PLAN ... 72
VIII. REFERENCES ....................... 76
APPENDIX I - COMPUTER PROGRAM
iv

FIGURE NUMBER
1
2
3 4
5 Q 7 8 9
10 11 12 13 14 15 16 17 18 19 20
LIST OF FIGURES
PAGE NUMBER
Highway Friction ~nd Hydroplane Research Tra i 1 er . .. .. .. . .. . . . . ~ . " . . . ": 5 Highway Friction and Hydroplane Research Trai 1 er . . . . . . . . . • . . . . . . . 6 Sample Output of Analytical Program . . . . 9 Typical Roadway Configurations Which Present Length Limitations to the E-274 Trailer . 11 Length Limitation Test Area and Results 13 Curvature Effects on Asphalt Pavement . . . . 16 Curvature Effects on Concrete . . . . . . . . 18 Curvature Effects on Jennite . . . . . . . . . . 19 Side Force Transducer Output . . . . . . . . . . 23 Demand vs. Available Side Force ......... 24 Extrapolation Technique fqr Determining SN65 ... 29 Mu Meter . . . . . . . . . . . . . . . . . . . . 37 Mu Meter on the Asphalt Test Pad . . . . . . . . 39 Results of Mu-Meter Testing Program ....... 40 Diagrammatic Layout of the Meter . . . . . 41 Results of DBV Testing Program . . . . . . . 44 Saab Friction Tester . . . . . . . . . . . . . . 48 Schematic of Operator Warning Device . . . . . . 61 Effect of Adding Weight to Unlocked Wheel .... 63 Block Schematic of Correction Circuit ...... 65
v

TABLE NUMBER
1
2
3
4
5
LIST OF TABLES
Results of the Test Program .
Curvature Testing Results .
Alternate Devices Evaluated During Research Effort • . . . . . . . . . • . . . . . . . .
Comparison of Alternative Measurement Methods .
Project Schedule (Phase II) ..•.......
vi
PAGE NUMBER
14
21
33
35
73

A, a
b
c fl
c
e
F
g
H
h
m
r
s
t
v
=
=
=
=
=
=
=
=
=
=
=
=
=
=
=
LIST OF MATHEMATICAL AND SKID RESISTANCE SYMBOLS
Acceleration
Height of drawbar hitch from level ground
Dry cornering slip riumber/100
Distance from drawbar center to trailer e.g. along the length of the trailer
Distance from center of test wheel contact to e.g. along the length of the trailer
The towing force parallel to the trailer axis supplied by the tow vehicle at the hitch
Available side force
Side •force demand
Side force developed in unlocked wheel due to locking the test wheel
Acceleration of gravity
Height of hitch center from ground level
Height-of e.g. from level ground
Mass acting at trailer e.g.
The radius of curvature of a nontangent section, measured in a horizontal plane
The near vertical reaction (support) perpendicular to F and S supplied by the tow vehicle at the hitch
The side force developed at the tire patch center of the right (unlocked) wheel
The force component parallel and coplaner with S which is developed at the hitch
The track of the measuring wheels (contact patch to contact patch)
The instantaneous forward velocity of the trailer
vii

w
8
]J
~
SN v MuN
SON
LIST OF SYMBOLS (cont.)
= Dynamic test wheel vertical load
= Additional load applied to rolling (unlocked) wheel
= Static test wheel v~rtical load
= Static weight supported by the rolling (unlocked) wheel
= Total static test trailer weight
= The near vertical reaction force supplied by the pavement at the center of the tire patch of the left (locked) wheel
= The near vertical reaction force supplied by the pavement at the center of the tire patch of the right (unlocked) wheel
= The angle of super elevation (positive is upwards to trailer
:::
= = =
=
right)
The (wet) dynamic coefficient of friction
The angle of grade (positive is uphill)
Skid Number obtained by method E-274 at speed v
Mu Number obtained using standard Mu-Meter techniques
Stopping Distance Number obtained from DBV tests
viii

I. INTRODUCTION
The following report was prepared under the sponsorship of the Of~
fice of Research, Structures and Applied Mechanics Division, of the Fed
eral Highway Administration. Mr. Glenn Balmer of this office served as
the technical contract manage~ for the project, and much credit is due
his advice and counsel during the course of the study.
The project began with a thorough literature review of domestic
and foreign papers and study reports. The primary object of the review
was to identify those sources which discuss the measurement of skid re
sistance of nontangent (some not straight and some not level) sections
of roadway. In depth review of over sixty titles uncovered only five
reports that even mention nontangent measurement, and these citiations
are brief and uninformative.
An alternate function of the literature review was to provide back
ground information to be used later in the study evaluations. In this
respect, several of the reviews identified papers which were invaluable
later in the study. This aspect was especially useful since Phase I
of the project, which is the subject of this report, was not structured
and did not allow for large scale physical testing of the various mea
surement methodologies. Therefore, many of the evaluations and recom
mendations of this report are based on a limited testing program combin
ed with detailed study Df the literature as identified early in the pro
ject. These references were especially valuable in determining cost
figures, tangent behavior characteristics, maintenance requirements,
and other evaluation criteria used in analyzing the several methods
examined.
1
It is not considered a difficulty in the present study that more
physical testing was not done. The purpose of the Phase I portion of
the study was to identify the most pr~mising measurement method or
methods to be developed, "fine-tuned 11 , and validated in Phase II. The
last chapter of this report indicate the authors• recommendations for
an extensive physical testing program to validate the proposed measure
ment technique, and it is only during an evaluation of that type that
the true value of the technique can be identified. Hence, it is during
the Phase II effort that the major experimental effort will be expended.
Certainly the most gratifying result of the study thus far is the
satisfactory performance of the popular two-wheel ASTM E-274 trailer.
Such a result implies the effective utilization of a large capital in
vestment by the various states. It also negates the necessity for ad
ditional large investment in a time of ever-tightening budgets. At the
conclusion of the Phase II study, we should be in possession of a docu
mented, cost-effective method for the measurement of skid resistance of
nontangent sections of roadway which is compatible with our current
methods of tangent measurement and can be implemented with short time
delays.
2

II. CAPABILITIES AND LIMITATIONS OF THE TWO-WHEEL ASTM E-274 SKID TRAILER
This chapter discusses the capabilities and limitations of an un-
modified two-wheel ASTM (American Society for Testing and Materials)
E-274 type trailer used for th~ measurement of skid resistance. These
characteristics were determined by evaluating the literature which was
reviewed early in the project, developing and analyzing analytical ex
pressions which predict the forces on the trailer during measurement,
and by a limited testing program which was used to validate the analyt
ical expressions and to identify those limitations which the analytical
approach could not address. This chapter also proposes methods for
overcoming or extending the limitations identified. These methods are
examined later in the report when recommendations for nontangent mea-
surement are developed.
Development of Analytical Expressions
In 1971, the National Bureau of Standards commissioned a study of
the dynamic behavjor of the ASTM E-274 type trailer (~). The resulting
report was one of the first (and only traceable) documents which
attempted a theoretical analysis of the characteristics of such trailers.
The techniques presented in the referenced report are relatively sophis-
ticated and require detailed knowledge of trailer characteristics such
as mass moments of inertia and tire spring and damping constants. The
results presented in the paper do not appear to be based on a sufficient
experimental sampling to draw any valid conclusions and the authors
justifiably avoid doing so.
3

The most interesting conclusion which is drawn in this report is
that the initial transient behavior of the trailer is essentially stable
after about three to four seconds of locked wheel operation. Of course,
those operators of E-274 trailers are aware of this fact and recorder
traces of trailer output exhibit ample support to the statement. The
equations developed in this report, although useful, do not attempt to
answer the fundamental questions regarding performance of the trailer
·in the equilibrium measurement mode since, as the authors state, they
were developed primarily to identify roll, pitch, and vertical motion.
Because of the objections and limitations cited above, it was
necessary to develop a set of governing equations based on the equilib
rium of forces on the trailer when the trailer was in the locked-wheel
measurement mode. We begin this derivation by drawing free-body dia
grams of the trailer on an upward (positive) grade and with an arbi
trary cross-slope (superelevation). These free-body diagrams are illus-
trated in Figures 1 and 2. Note that consideration has been made for a
centrifugal force acting on the center of gravity (e.g.) of the trailer 2 which is proportional to V /ro This term accounts for loads induced
QUe to the nontangent operation of the trailer as encountered in a
curve.
We begin our analysis by summing forces in the x-direction of
Figure 1. 2
F Y . ~ Q mV . Q . m - \1 l - mg Slnp COS - r Sln S1nr- "' rna.
4

Summing forces in the z-direction we find 2
2N + R - mg cos~ cosQ - mV sinQ cos0 = 0. r
And completing our analysis of Figure 1, we sum moments about the e.g.
of the trailer.
2N (e) + ~YL (h) + F (b - h) - R (c) = 0.
Similar analysis of the two diagrams in Figure 2 yield the balance
of the equations necessary to specify the forces acting on the trailer.
The resulting expressions can be reduced to six equations identifying
the six unknown forces acting on the trailer at equilibrium, as follows:
2 (1) F Y g . m mV . g · m - ~ L = mg cos Slnp + --r-- s1n slnp.
2 (2) R + YL + VR cosQ = mg cosQ cos0 + m~ sin9 cos0.
(3) Rc + F (h - b) - YRe cosQ - YL (~h + e) = 0.
2 (4) S - Sf - YR sinQ = m~ cosQ - mg sinQ.
(5) YL (~t/2) + YRe sing - Se - Sfc = 0.
(6) YR (t/2 cos9 + h sin9) - YL (t/2) - Sh + sf (h - b) = 0.
It should be noted that the following assumptions were made in
deriving equations 1-6.
i) The locked wheel of the trailer (in this case, the left wheel) does not develop any out of plane forces, i.e.~ does not experience any side force.
ii) The trailer is in equilibrium at some constant velocity V, i.e., the atceleration (a) is zero.
iii) The compression or extension of tbe trailer and tow vehicle suspension is negligible at equilibrium; i.e., the static trailer dimensions are good approximations of the trailer characteristics at dynamic equilibrium.
7

R
V2 . ~sin8 5111 r
·----------~--1-------------
2N
TEXAS TRANSPORTATION INSTITUTE
TEXAS ASM UNIVERSITY
COLLEGE STATION, TEXAS
PROJECT:
3871
HIGHWAY FRICTION a HYDROPLANE
RESEARCH TRAILER
DATE: DEC,I978 OWN. BY: D.fG. SHEET OF 2

F
mg sin¢co58
+ ml/2 . 8 . ,.... r- s1n sm'+-'
---t
X
f { Y--J
c
TEXAS TRANSPORTATION INSTITUTE
TEXAS ASM UNIVERSITY
COLLEGE STATION 1 TEXAS
PROJECT:
3871
HIGHWAY FRICTION a HYDROPLANE
RESEARCH TRAILER
DATE: DEC,I978 DWN. BY: D.F.G. SHEET 2 OF 2

We now have equations 1-6 determining the equilibrium values of the
following six forces:
F The towing force parallel to the trailer axis supplied by the tow vehicle at the hitch.·
R - The near vertical reaction (support) perpendicular to F supplied by the tow veh;cle at the hitch.
YL -The near vertical reaction force supplied by the pavement at the center of the tire patch of the left (locked) wheel.
YR - The near vertical reaction force supplied by the pavement at the center of the tire patch of the right (un-locked) wheel.
S - The side force developed at the tire patch center of the right (un-locked) wheel.
Sf - The force component parallel to S which is developed at the hitch.
A computer program was developed to solve these equations using
the technique of Gaussian elimination. A listing of this program is
shown in Appendix I of this report, and a sample output for the TTl
Highway Friction and Hydroplane trailer operating in the tangent mode
is shown in Figure 3. Other examples of the use of this program can be
found in the balance of this report.
8

SKID TRAILER DIKENSIONS1
1=1060.5 l~ < 6.06 lb-sec••2/~~>· 8•0.3048 ft (12.00 in> C•2.84J5" (111.~ in)
DA'fA SET I I
H=0.3175 ft <12.50 1nl 1=1.5400 H (60.63 10)
E•0.223~ H ( 8.80 in>
CROSS-SLOPE ANGLE <THETA>• 0.00 dt~rees VERTICAL SLOPE AH6LE <PHI>• 0.00 dt9rte• COEFFICIENT Of FRICTION <MU>• 0.440 RADIUS • -67.1 "< ·-220.0 ft) (+ R.H. CURVE) VEHICLE VELOCITY • 48.3 kR/h ( 30.0 ftphl
VARIABLE OUTPUT f • 22~9.4 M ( ~08.0 lb)
Y<Rl• 4280.6 M ( 962.4 lb) Y<L>• ~J46.6 N ~ 11~7.1 lbl
S • -2069.4 N . < -465.2 lb) S<F>~ 77~.9 N < 174.4 lbl
a· 983.8 N < 221.2 lb>
DATA 6£T I 2
CROSS-SLOPE AH&LE <THETA>• 6.84 dt9rte• VERTICAl SlOPE AMGLE <PHI>• 0.00 degrees COEFFICIENT OF FRICTION <KU>• 0.440 RADIUS a -67.1 H ( -220.0 ft) (t R.H. CURVE> VEHICLE VELOCITY • 48.3 kft/h ( 30.0 •ph>
VARIABLE QUTPUT f • 2277.9 N ( ~12.1 lb)
Y<R>• 3884.~ N < 873.3 lb) Y<L>~ 5188.8 N < 1166.6 lb)
S • -2733.2 M < -614.5 lb) S(f)• 869.4 N < 195.5 lb)
• • 955.7 • .; 214.9 lb)
Figure 3. Sample Output of Analytical Program.
9

Testing Program
A limited series of tests were conducted on an E-274 type trailer
(TTl's Highway Friction and Hydroplane Research Trailer). The program
was aimed at achieving the following two goals:
i) Establishing the validity and accurancy of the analytical expressions developed in the previous section, and
ii) Approaching and confirming the limiting performance characteristics of this particular E-274 trailer and establishing limit characteristics which are not suitable for analytical evaluation.
In the discussions which follow, several factors which limit the
performance arena for the E-274 trailer are identified. Many of the
values of these parameters far exceed the recommended or even remotely
conceivable design value for that parameter in the real world. In such
cases we have attanpted to identify the recommended or reasonable ex-
treme, and demonstrate, either through testing or analytical evaluation,
that such configurations are well within the realm of operation of the
E-274 trailer.
Distance (Length) Limitations
It is a weakness inherent in the ASTM E-274 type trailer that mea
surement of skid resistance be conducted at some speed; usually 65 km/h
(40 mph). The weakness of this measurement scheme becomes apparent
when an attempt is made to make skid measurements near T-type intersections.
Roadway configurations similar to those shown in Figure 4 are examples
of relatively common intersections which present a measurement problem
to the E-274 trailer.
10

-~
' \
-
Figure-4. Roadway Confiqurations Which Present Lenoth Limitations to the E-27~ Trail~r.
11

In order to quantify the limitations of the E-274 trailer in this
measurement mode, physical tests were conducted at the Texas A&M Re
search and Extension Center on the asphalt handling surface. A worst
case T-type intersection was laid out near the center of the pad so
that some extreme braking and acceleration maneuvers could be executed
with ample recovery area for safety of the driver and equipment. The
dimensions of the test area were obtained from AASHTO minimum design
requirements (l,~) and are outlined in Figure 5.
Results of the test program are shown in Table l, and the ~inimum
dimensions are identified in Figure 5. The test program indicated that
accurate, repeatable skid resistance values can be obtained safely at
distances exceeding 105 m from the intersection for an SN65 and at dis
tances over 40 m for an SN32 .
Grade Limitations
Examination of the free body diagrams in Figures 1 and 2 clearly
shows that grade influences only the draw bar force on the trailer.
Further analysis of the equations of trailer behavior previously devel
oped supports this observation, and also establishes that if an E-274
trailer is measuring skid resistance from the ratio o~ locked-wheel
vertical and drag forces, the grade influence will have an insignifi
cant effect on the computed skid number.
Curvature Limitations
Considerable attention was given to the situation of the E-274
trailer in a curve due to the potentially high centrifugal forces act
ing on the mass-center of the trailer. This study was broken down into
12

----------~-~~-~
Scale 1•5
Figure 5. Length Limitation Test Area and Results.
I
~
l3
I I
I I
I I
16km/h 21.33m
32 km/h 39.37m
65km/h 104.99m
..... 3.94m

Table 1. Results of the Test Program
SPEED DISTANCE REQUIRED TO OBTAIN REPEATABLE CORRECT SKID NUMBER (FROM "T" INTERSECTION)
16 km/ h ( 10 mph)
32 km/h (20 mph)
65 km/h (40 mph)
21 • 3m ( 6 5 f t)
39. 4m ( 120 ft)
1 05. ()n ( 320 ft)
MEAN SN
51.2
·46. 6
42.4
In normal, tangent operation on the same section of this particular
skid pad, the following skid resistance values were obtained.
SN16 = 51
SN32 = 46
SN65 = 43
14

two areas of investigation. The first is the introduction of errors
into the skid number data due to these forces. The second is one of
stability or' safety for the equipment and personnel.
The investigation of error producing factors i.nvolved both mathe
matical and test track evaluat\ons of the E-274 system with various
levels of side force. By the nature of their derivation, the mathemat
ical expressions predict that measurement of horizontal and vertical
forces at the locked wheel will be theoretically error-free, even in
curves of extreme degree.
The test-track program involved three homogeneous test surfaces
which were the aforementioned asphalt test pad, a concrete pad, and a
jennite test paa, all being flat. Two E-274 systems were involved in
the study, the T.T.I. Research Test Trailer configured to E-274 speci
fications, and the FHWA ARSMS*. On the test pads, curves were delineated
on the surface with radii of 107 metres and 162 metres. These curves
were chosen to produce 0.3 and 0.2 g's respectively at 65 km/h. The
lateral acceleration could then be varied by adjusting the speed 'through
the curve. It was found, as will be discussed later, that the safe
limit of the system is approximately 0.33 g, and no measurements were
attempted above this limit. Both systems measured both dynamic hori
zontal and vertical forces and calcultated SN by means of an analog
computer. Figure 6 shows the results of the testing on asphalt with
each data point,.being the average of six runs. The overall '±2 standard
deviation points are indicated along with the·±s SN points. Similar
*ARSMS - Area Reference Standard Measurement System
15

55
50
45
~ ~ z·
__, 0\ 040
35
SO= STANDARD DEVIATION SN= SKID NUMBER
eSET I .SET2 .SET3 esET4
--- ....... __ ----------------------.--------------------+5 SN
-------------------------- ---------+250
------250
~ ..-: --------------------- ----4..~- -5 SN
ASPHALT
.3 .2 .I 0 .I .2 .3 LEFT TURN LATERAL ACCELERATION (o's) RIGHT TURN
E-274 SKID TRAILER
Figure 6. Curvature Effects on Asphalt Pavement.

data are presented in Figure 7 and Figure 8 on concrete and asphalt
flush seal (jennite). The apparent slight decrease in skid number at
the higher g levels in Figure 6~ although perhaps not statistically
significant, needs further investigation along with more track testing
which will be conducted in Phase II.
Mathematical evaluation of the E-274 system with respect to error
producing conditions showed, as mentioned previously, that if both
horizontal and vertical measurements of force are made at the locked
whee 1 , theoretically no error wi 11 be in ttoduced by even extreme
curvature. The measurements of real trailer behavior tend to support
this notion. It js important to note however, that the transducers
used to measure these forces indicate valid, repeatable results over
only a portion of their full operating range. A given trailer-trans
ducer combination could best be evaluated by first determining the val
id range for each transducer channel and from this computing a valid
range for the computed skid number. Then a series of extreme condi
tions could be construed and analyzed, using the previously developed
simulation for example, and the predicted force values compared to the
valid ranges. In the case of the TTI Research trailer however, this
approach was fruitless, since instability of the trailer occurred long
before even a 5 percent predicted error was encountered. For this rea
son, it is not anticipated that the above approach would, in general,
be useful.
The stability or instability of the E-274 system in a curve is dir
ectly associated with the lateral acceleration acting on the e.g. of
17

55
45 0 .. -., CD
i _. 00
35
SO·= STANDARD DEVIATION SN = SKID NUMBER
---------- ---------------------------:- +SSN
--- -- -- -- -- ---- -- -- -- -- ------ --- -- +2SD
-- -- -- -- -- -- -- -- -- ----- ---- -- -- -- -2SO
----------------------------- -------SSN
CONCRETE
.3 .2 I 0 I .2 .3 LEFT TURN LATERAL ACCELE~ATION (g's) RIGHT TURN
E-274 SKID TRAILER
Figure 7. Curvature Effects on Concrete.

__, \0
6 ~ -f6
z Cl)
~5
SO = STANDARD DEVIATION SN = SKID NUMBER
-----------------------,.._.--------------------+5SN
------------ -------------- ---+2SD
~. ~------4et-...___
- . __. -·- ---- ---2SD
------.------------------------ ----5SN
JENNITE
.3 .2 0 ,I .2 .3 LEFT TURN LATERAL ACCELERATION (o's) RIGHT TURN
E- 274 SKID TRAILER
Figure 8. Curvature Effects on Jennite.

the trailer in a curve which creates a need for the unlocked wheel to dev
elop additonal, and often cons~derable, side force. With a given radius
and velocity, a flat curve (no superelevation), will produce a greater
lateral acceleration than if the proper positive superelevation is used
(a severe case condition, more severe than the AASHTO design standards)
which is the case in the TTI test pads. This severe case approach was
used because it is a very repeatable condition and the large pad area al
lowed ample recovery room in the event of a spin out. Obviously, a neg
ative superelevation would be an even worse case, but also a highly im
probable one. To investigate the amount of articultaion angle change that
occurred during the locked wheel, non-tangent measurement, a rotational
potentiometer was attached between the tow vehicle and the test trailer
by means of a flexible shaft. This configuration allowed measur~ments in
the yaw plane only. The output of the transducer was conditioned and
placed on a strip chart recorder for evaluation. This measurement also
acted as an indicator of incipient slip out to the veh-icle driver.
An example output from this measurement is shown in Table 2 under
the column Art. Ang. These figures represent the difference between
the steady state.turn, unlocked and locked .cond.itons. It may be noted
that an angular shift occurs even in a tangent or 'TAN' lockup. This
is due to the aligning moment produced as the test wheel exhibits drag
force. The asterisk (*) shows a condition in which the articulation
angle never st..Pbilized but continued to slow_ly increase during the in
terval of lockup. To further investigate the effect of lateral force
on the system a special rim, for the free rolling wheel, was machined.
20

N .......
Table 2. Curvature Testing Results.
TTI RUN #1 TTI RUN #2 ARSMS #I
SKID NO. ART. ANG SKID NO. ART. ANG. SKID NO.
RIGHT TURN AREA -TAN. 43.1 +0. 5° 41.6 +0.3° 44.5 0 = 2.10 0 = 1.90 0 = 1. 01
LEFT TURN AREA - TAN 42.5 +0.4° 42.9 +0.40 42.4 o=l.72 0 = 1. 26 0 = 1.61
LEFT TURN 40 MPH 46.3 +1.2° 41.8 +1.4° 38.5 RADIUS = 162 m ( 533 I ) 0, 20g 0 = 0.91 0 = 1.85 0 = 1.08
RIGHT TURN 40 MPH 44.5 0.0° 40.9 0.0° 42.0 RADIUS = 162 m (533') 0.20g 0 =- 1. 03 0 = l. 88 0 = 1.65
LEFT TURN 36 ~1PH 44.5 +1.7° 41.9 +1. 5° 41.9 RADIUS = 107 m (350 1 ) 0.25g 0 = 1.58 0 = 1.67 0 = 1. 52
RIGHT TURN 36 MPH 38.0 -0.3° 39.1 +0.2° 39.1 RADIUS = 107 m (350') 0.25g 0 = 2.13 0 = 2.36 0 = 1.44
LEFT TURN 40 MPH 46.3 +2.6° 40.3 +2. 2° 37.7 RADIUS = 107 m (350 1 ) 0.30g a = 0.86 a = 3.24 a=l.12
RIGHT TURN 40 MPH 42.4 *-5. 0° 38.2 -0.6° 36.7 RADIUS = 107 m (350 1 ) 0.30g a = 0.68 0 = 0. 77 0 = 1.27
---
Each condition consists of 6 runs. *No equilibrium reached, articulation angle continued to increase during lockup.

This rim was designed to allow a certain amount of bending in the
web due to side force. The web was then strain gaged in one spot so
that the strain converted to force could be accurately read at one point,
each revolution. This transducer then allowed direct side force mea
surements during a locked-wheel test in a curve. A typical output from·
this device is shown in Figure 9. As anticipated the side force capabil
ity provided by the test wheel, as it is locked, disappears and must be
absorbed by the rolling wheel. In this condition the rolling wheel must
provide effectively all the side force necessary to counteract the de
mand placed on the trailer. It was found that if the available side
force is exceedeg by the demand, the system will be unstable and yaw or
spin out. It was discovered that this unstable condition occurs at :ap
proximately half the side force level during a locked wheel test as
would occur if both wheels were rolling. This is the condition that
limits the trailer, in a locked-wheel condition, to a lateral accelera
tion of about 0.33 g on a dry roadway that has a cornering slip number
of 70. These numbers are based on an average E-274 trailer which should
vary only slightly from one trailer to another, since similar weight
configurations are required in order to maintain proper calibration.
A comparison of demand versus availability of side friction is
shown in Figure 10 at various levels of lateral acceleration. It should
be noted that the aligning moment developed hy the locked wheel produces
a side force in the tangent oruzero 9" c<mditiondispla,ces the position
of the demand curves, depending on the direction of turn. This cirtical
level of lateral acceleration has been compared to various highway
22

-
4450 (1000}
3560 (800)
~ 2670 = (600 z . LLI
~ ~ 178q ~ (400)
890 (200'
0
Right Wheel Side Force Left Tum-65km/h (40mph), 107m (350ft) Radius
2 t Stable
in Curve
3 4 5 6
J-L. Wheel Locked --J TIME, sec
Figure 9. Side Force Transducer Output.
7 8 9t Leavino
Curve

N ~
0.6
0.5
-· 0
zOA 0 ~ ct a: IIJ iLl 0.3 0
~ ..J ct ffi ·o.2 ~ ill ..J
>o ct 0.1
/
,"' ,.,
Cornering Slip Number Dry= 10 5~5(40) =50 WR =4828N (10851bs) h/T=0.2
S!iP Out \ _,,."' Raght Tum - L *",.,.
,.,.~-
,.,., ,*"
,""' \ ,"" Right Turn /"' I Demand _,""
/';I'
,"' \ Right Turn \Available
\ ,,.,.
979 (220)
1963 (441)
FORCE I N (lbtl
Figure 10. Demand vs. Available Side Force.
\ \ \ \ \
3925 (882)

design criterion as defined by AASHTO (l). (£). This comparison indi-
cates that if these design practices are followed, one should be able
to make SN65 measurements on ~J!l section of rural highway, except at
intersections, including those curves posted 48 km/h (30 mph) in both
a safe and accurate manner.
On urban highways the expected frequency of sections which could
not be safely measured at 65 km/h would represent a small, but signifi
cant portion of the roadway encountered. Though minor in terms of the
total mileage of urban highway, these sections may be quite significant
in representing the portions of our highway system where accidents occur.
After considera~le discussion and analysis, three methods for overcom
ing this difficulty presented themselves:
l) Physical modification of the trailer to allow it to develop more side force,
2) Procedural modifications which would allow determination of an SN65by other than standard techniques, or
3) Procedural modifications whereby skid resistance measurements would be made at posted (design) speeds.
These three options are discussed on the following pages in light of all
the previous limitations we have discussed.
Physical Modifications
Analysis indicated no physical modification which would extend the
safe limitation of the ~274 trailer in a T-type or other type of length~
limited situation. As noted earlier, the limiting factor here is ade-
quate space in which to maneuver, not the maneuvering capability of the
tow-vehicle trailer combination. In a similar manner, and as previously
25

discussed, it can easily be argued that no physical modif-ications are
necessary to compensate for the effect of grade, since the grade effects
are negligible.
The real problem area with the E-274 trailer is assuring that it
can develop the appropriate level of side force to assure stability.
Several approaches were considered, but by far the most promising tech-
nique is the addition of a trailing wheel. Such a wheel could be as
simple as a damped, hinged frame, pinned to the back of the trailer with
the tire rigidly positioned in the frame so that the tire contact patch
and the weight on the tire are adjusted to enhance the trailer's over-
all side force capacity. Conversely, this trailing wheel could be so
sophisticated as to make use of an electronic servo-control circuit
which would adjust the yaw of the tire to maximize the side force capa
bility with a minimum of additional weight. Both of these approaches
could be made to work, but it will be established later that they re-
present unnecessary extremes.
The following advantages and disadvantages of these approaches
should be noted at this time:
1) The mechanical modifications would be relatively simple, and could be made on virtually~ E-274 type trailer,
2) Not a great deal of mechanical advantage would be required to include all properly designed rural and urban highways in the range of the E-274, however,
3) It has already been noted that these unmeasurable sections are few in number to begin with, and
4) These modifications would almost certainly require a more sophisticated calibration technique.
26

These concepts will be weighed carefully against similar statements
concerning other approaches and techniques in the next two chapters.
Procedural Modifications
Early in the study it was .determined that the. goal in making non
tangent measurements was to achieve a reliable, repeatable, strai'ght
forward technique. Because of our country's vast data bank and experi
ence with the popular SN 65 , it seems reasonable to assume that an ap
proach which measures the skid resistance at 65 km/h, thereby directly
computing an SN65 , would be the most desirable. Another approach would
be to make measurements at some other speed(s), perhaps in conjunction
with another type of measurement, and through some manipulatory tech
nique, compute the SN 65 . A third approach, would be to make measure
ments at some speed other than 65 km/h, such as traffic or posted
speeds and report the skid number with a subscript.
The physical modifications identified in the previous section re
flect an attempt to reach the ideal criteria mentioned first above. It
should be noted that in practice this can probably never be done. The
at speed requirement of measuring the SN 65 directly indicates the vir
tually impossibility of making the measurement within two meters of a
tee intersection. The procedural modifications proposed in this sec
tion will explain an attempt to address the second criteria identified
above, and to "fill-in" those few sections which the physical modifica
tions could not measure. The next section outlines the less desirable
approach of measuring and reporting skid resistance at various speeds.
27

The most logical procedural modification would be to make measure
ments on the nontangent section at speeds as close to 65 km/h as possi
ble. A measurement could then be made at some lower speed and a plot
of the test results developed. This graph could then be linearly ex
trapolated to predict a value ot the SN65 . A graphical representation
of this approach is shown in Figure 11. Alternatively, more elegant
methods of non-linear extrapolation could be developed making use of
more data points or some knowledge of the skid number gradient. These
approaches, although more appealing, would likely be more costly and
time-consuming, whereas the former, more simplistic approach could be
accomplished on site with nothing more than a straight-edge, pencil,
and previously prepared graph paper. Another procedural modification
which holds some promise would choose some convenient speed and then
correct that value to an equivalent SN65 , via some analytical procedure.
Both of these approaches are evaluated in the next two chapters.
Procedural Modifications (Posted Speed)
A final approach whiGh could be used to measure the skid resistance
of nontangent sections is to measure the skid number at the posted or
design speed for the section. In this manner, one would report an SN32
for example, and determine pavement characteristics by some technique
not now commonly employed. This approach would likely use some evalua
tion methodology similar to that described in NCHRP Report 14, entitled
11 Skid Resistance .. (~) on page 10, and in NCHRP. Report 37 (4) by Kummer
and Meyer, on pages 51 through 55.
28

70 OsN Measured By Trailer
~SN Extrapolated By Linear Extension
a:: IIJ m 2 ::J z
---........ [!] ___
--- ............... ...,-:, .
~ ........ -..A
-~--- ........ 0 ~
N U)
\0
~ N
t·. IIJ fk)
0 K) 20 30 40 50 606570 80 90 100
VELOCITY (km/h)
Figure 11. Extrapolation Technique for Determinino SN65 .

Summary
The preceeding pages have detailed an investigation of the capa
bilities and limitations of the ASTM E-274 skid trailer, especially as
related to behavior in the non-tangent measurement mode. To begin with,
it was necessary to develop eq~ilibrium equations for a typical trailer
in the measurement mode which were used to predict the major forces
operating in the system.
Evaluations were then made by both analytical and physical measure
ment techniques. The results are dispersed throughout the chapter along
with several techniques which it appears would extend the performance
range for the trailer. Each of the proposed performance extenders are
evaluated in detail later in the study. Yet the most significant re-
sult of this study, at least through the end of this task, is that even
though the E-274 type trailer possesses the limitations outlined in this
chapter, few of these limitations are within the normal range of high
way design criteria. For example, in measurement up a grade, the limit
ing factor is the ability of the tow vehicle to maintain the proper
speed while measuring. Since grades which are so steep that a speed of
65 km/h could not be maintained are extremely rare, and certainly not
recommended by AASHTO, this very real limitation is not very important
in the real world.
All things considered, the E-274 trailer has demonstrated that it 4
is not only an ~xcellent measurement technique for tangent pavement
sections, but is also versatile in measuring nontangent sections. In
fact, it appears to be far more versatile than most of the literature
30

had even remotely hoped for. Combined with the considerable capital
investment in E-274 trailers and training by the various States, this
investigation represents a strong statement of support for its contin
ued use. These concepts are of course amplified in later chapters of
this report.
31

III. ALTERNATE EQUIPMENT FOR MEASUREMENT OF SKID-RESISTANCE OF NONTANGENT SECTIONS
The literature identifies several methods for the measurement of
skid resistance. The devices and techniques range from relatively sim-
plistic approaches to complex lpboratory instruments which require care
fully ·controlled testing conditions-. During the course of this study
an attempt was made to investigate promising equipment that could be
used for skid-resistance testing of nontangent sections, especially
those which appear infeasible for the current two-wheel E-274 skid
trailer.
Two major criteria were used to determine if an alternate method
was worthy of detailed consideration. These criteria were
1) Availability of the device, and its past use for the measurement of highway skid resistance, and
2) Projected performance in a nontangent measurement mode.
Evaluation of the literature reviewed early in the study, led to detail
ed consideration of five devices other than the two-wheel E-274 type
trailer. The devices considered are listed in Table 3.
The equipment considered for recommendation in the next chapter
was rated in the several areas as requested by the sponsor. Each area
was considered, not only regarding the equipments compliance, but also
considering the relative importance or priority of that area of impor•
tance.
Preliminary Evaluation of the Candidate Techniques
Prior to full-scale evaluation, the candidate techniques identi
fied in Table 3 were evaluated acc~rding to the scope of work as
32
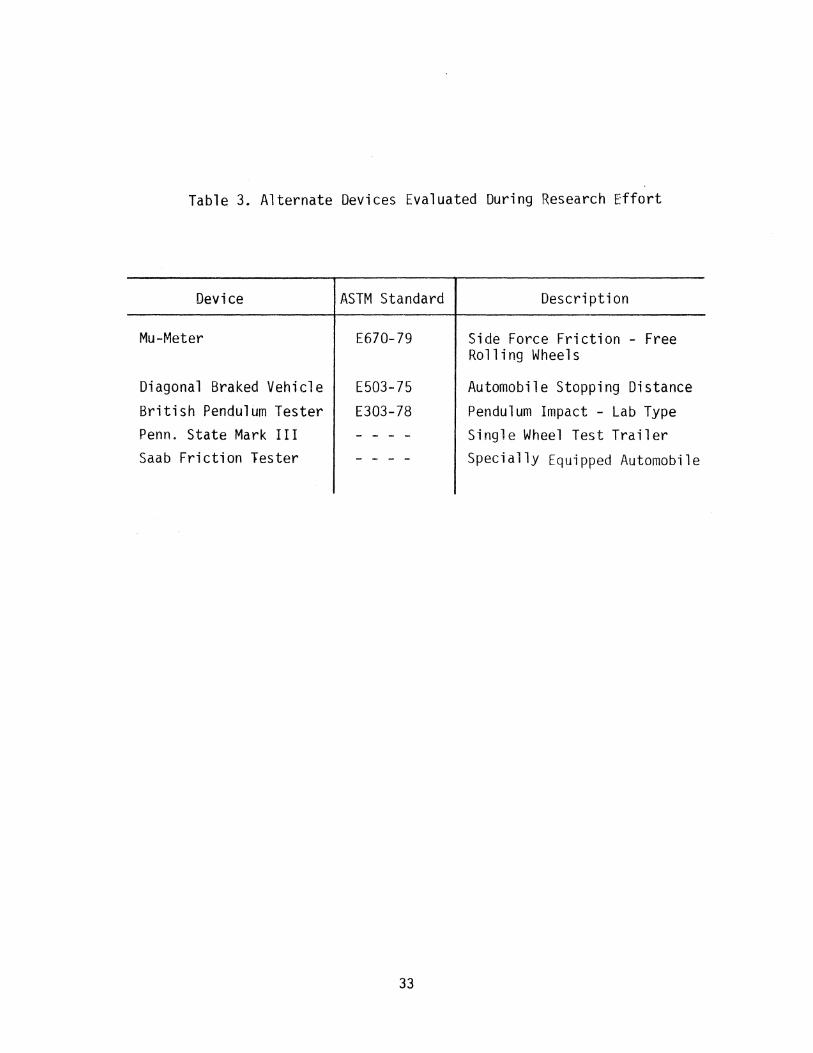
Table 3. Alternate Devices Evaluated During Research Effort
Device
Mu-Meter
Diagonal Braked Vehicle British Pendulum Tester Penn. State Mark III Saab Friction Tester
ASTM Standard
E670-79
E503-75
E303-78
33
Description
Side Force Friction - Free Rolling Wheels
Automobile Stopping Distance Pendulum Impact - Lab Type Single Wheel Test Trailer
Specially Equipped Automobile

identified in the prospectus of the research project:
To p~vide the moat practioal measurement technique for measuring wet-pavement friction for ~ad segments other than tangents~ the equipment or methodology developed shall meet the following oriteria:
1. The equipment shall be an efficient measurement system for road surveys•at traffic speeds.
2. It shall not interfere with traffic flow or at most cause minor interference.
3. It shall be rugged and require a minimum amount of maintenance.
4. The initial and operating costs shall be low for use by State highway departments and similar agencies.
5. The equipment shall not be oomplex but be readily operable by a highway technician.
6. It shall be designed for wet-pavement testing, have its own wetting system~ and be capable of testing under all weather conditions, except possibly below freezing temperatures.
7. It shall contain an efficient data collection and processing system, relatively free from maintenance, and simple enough for operation by a technician. The data processing equipment .shall be compatible with the FHWA computer equipment.
B. Simple, feasible calibration procedures for the equipment shall be thoroughly documented and readily available for use.
To facilitate evaluation of the several alternatives presented in
Table 3, a comparison table was constructed. This is shown in Table 4
with the evaluation criteria listed down the right side and the items to
be evaluated identified across the top. A score of ten is assigned to a
technique if it exactly meets the criteria fdentified or if it repre-'
sents the ultimate available technique. A score of one indicates that
the device or technique does not meet the objectives of the criteria
34
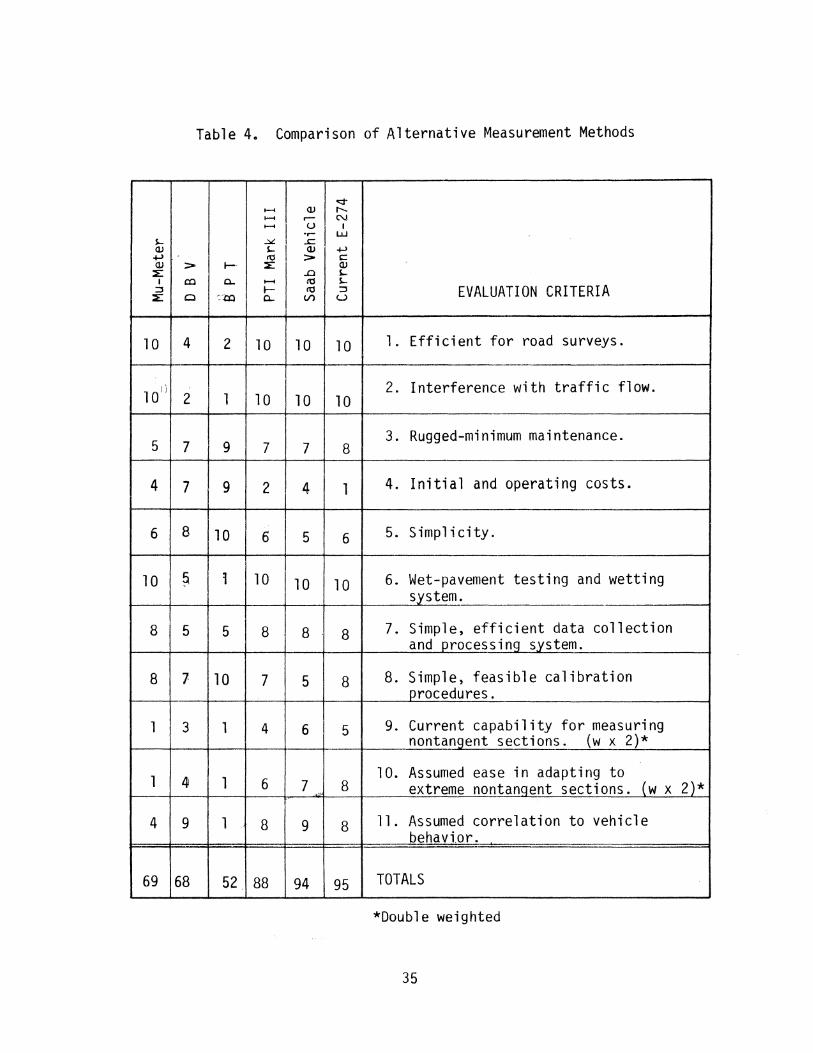
Table 4. Comparison of Alternative Measurement Methods
<;;!" ..... Q) r--.. ._.. r- N .......
I u I
•r- w S- ..:.:: ..J:: Q) S- I Q) +->
+-> n;l I > c:: QJ > 1- ::E: QJ
::E: ..0 s... . I co 0.. ..... n;l S-
:;::, 1- n;l :;::, EVALUATION CRITERIA ~ Q ~ . .l:Q 0.. V') u
10 4 2 10 10 I 1 o l. Efficient for road surveys. ..
10 11 2 1 2. Interference with traffic flow.
10 10 10
5 7 9 7 3. Rugged-minimum maintenance.
7 8
4 7 9 2 4 1 4. Initi a 1 and operating costs.
6 8 10 6 5 6 5. Simplicity.
10 ~ 1 10 ,, 0 10 6. Wet-pavement testing and wetting system.
8 5 5 8 8 8 7. Simple, efficient data collection and processing system.
8 7 10 7 5 8 8. Simple, feasible calibration procedures.
l 3 1 4 6 5 9. Current capability for measuring -- nontangent sections. (w x 2)*
1 4 1 6 1 0. Assumed ease in adapting to
7 8 extreme nontanqent sections. (w x 2)* ,,
4 9 1 8 9 8 11. Assumed correlation to vehicle behavi.or.
69 68 52 ' 88 94 95 TOTALS
*Double weighted
35

and shows no promise of meeting these criteria in a simple or cost
effective manner. Intermediate scores indicate an attempt to rank the
various approaches or to assign a performance estimate for each device.
The chart includes the E-274 trailer, evaluated in a manner similar
to the other devices. The ratings identified in Table 4 were developed
based on the evaluations outlined in this chapter, and the totals devel
oped were the basis of the recommendations at the end of this and the
subsequent chapter. The balance of this chapter presents evaluations
of the various techniques which were used to generate the values in
Table 4.
Mu Meter
The small, trailer-type unit, Figue 12, measures the side force
friction coefficient generated between the test surface and the smooth
tread tires on the two measuring wheels, toed-out to the line of drag.
The friction value is continuously recorded for any length section de
sired and is reported in Mu numbers that range from 0 to 100.
The Mu Meter meets the equipment requir~nents outlined previously
as indicated in Table 4. It is used to perform highway friction measure
ments by several states at this date, though it is commonly used to
measure friction properties on aircraft runways.
No literature was found on the use of the Mu Meter in nontangent
sections except for som~·precautions to be exercised during testing;
i.e., 11 Wherea~ the meter can be towed safel.x at speeds in excess of
65 km/h (40 mph), sharp turns should always be executed at slow speed,
otherwise there is a danger of overturning the meter 11 ([_) and ., Sharp
36

figure 12. Mu Meter.
37

curves'and steep grades shall not be included in a test section with
level tangent sections, nor shall passing lanes be included with traf
fic lanes" (§_).
It was felt that since the Mu Meter is in use by highway depart
ments and had met the initial h~rdware requirements, a unit should be
tested at the TTI Proving Grounds in a nontangent mode of operation.
A used, standard M.L. Mu Meter, less recorder, was borrowed from the
Air Force and recond1t1oned·accord1ng to spec1f1cat1ons (5). The unit
was .attached to the TTI Test Trailer tow vehicle using the on-board
recorder and electronics for data processing. The entire system.was
then calibrated per specifications 01). The test plan involved the run
ning of the Mu Meter over the asphalt test pad, Figure 13, at 65 km/h
(40 mph), in a standard test configuration, in first a tangent mode then
in varying levels of lateral acceleration, left and right, until an un
stable condition was observed. The results of this testing are shown
in Figure 14 and the ±5 MuN points are indicated as faulty test limits
(~~- It is readily apparent that the Mu Meter data becomes unreliable
at a relatively low lateral acceleration level. This effect is due to
the nature of the unit that relies on the vertical load of both left
and right toed-out wheels to be constant. Since the left wheel is at
tached to the pivoting frame member and the right is attached to the re
mainder of the unit, as ihown in Figure 15, a non-symmetrical system
exists. As th~unit traverses a left curve the left wheel is vertically
unloaded reducing the tensile force on the measuring cell. In a right
curve the left wheel vertical force is increased without proportionally
38

Figure 13. Mu Meter on the Asphalt Test Pad.
39

~ 0
MuN
. ---~_!-~ ---------- --+5MuN -------
--------------· _L I ------ ----5MuN
I I I I
' ' ' ' ' \ \
' ' 0~----~----~-----+----~------r-----+-----+-----~----~----~ 0.4 0.3 02
RIGHT 0.1 00 0.1
LATERAL ACCELERATION, Ay(g1s)
MuMETER ASTM E-670
0 .. 2 0.3 LEFT
Figure 14. Results of Mu-Meter Testing Program.
Q4

l'lJL I fOHt,;t.
HI '.lJl IINb l t. N:,tuN fOHCt ON lOAD LELL
HLAN
TOt' I HAMl HEMOIIE ll
UflAG FOR::t.
t HIC I ION MLA~UHINt.>
WHt LL~ ---
•
• -- tRK.: I K JN M J\',, IHIN()
Willi I'
LlAMI'i:.l> ~PH INt.>.....___ ~USPENSION ·-
Figure 15. Dtagnunmatl!· layout ut' t ht• nwlt·t
41
Mu-MI'tl'r
I ll ~IBll llHIVI
f(' Hft. OAL.t.H
Ht AH WHli:.L

decreasing the restraining force so that the Mu numbers increase.
The track testing was terminated at a g level of 0.25 left and
0.2 right due to incipient instability of the unit. It has been cal
culated that the unit should overturn at a level of about 0.37 g in
either direction. This level was determined by calculating the point
at which the inside wheel load goes to zero using a total vertical load
of 2457 N (550 lb), a wheel base of 63.5 em (25 in), a center of grav
ity (e.g.) height of 53 em (21 in), and a test wheel vertical load of
761 fl (171 lb). The extended curve, Figure 14, in the left turn dir~
ection tends to verify this value while the data scatter in the right
hand direction indicates a condition which is too unstable for a proper
conclusion to be drawn.
Grades and superelevations were not tested with the unit due to the
results of the flat curve tests. In addition, these types of nontangent
surfaces produce vertical forces on the system causing significant
changes in the static vertical load which is very critical to a proper
Mu number measurement.
Based on these findings the Mu Meter was found to be unsuitable for
nontangent measurements that produce lateral levels of acceleration
greater than 0.05 g's and greater than 0.02 g's in the vertical axis.
Comparison of these results to those of the previous chapter indicate
that these values are we·l1 below the limits of the E-274 trailer.
Diagonal Braked Vehicle (DBV)
The test device consists of a passenger automobile with four wheels,
of which a diagonal pair are braked for test purposes. The test
42

pavement must be wetted by another vehicle just prior to a test run.
The test vehicle is then brought to speed, usually 65 ~/h (40 mph), the
test wheels are locked up, and the vehicle allowed to skid to a stop.
A velocity deceleration increment may also be used in lieu of coming
to a complete stop, however, if this technique were used a different
procedure and data interpretation method from the applicable ASTM stan
dard would have to be developed. The skid distance is measured along
with the initial and, if necessary, final velocity, and a Stopping Dis
tance Number (SON) computed.
Referring to the equipment criteria in the scope, the DBV does not
meet items 2 or 6 and could not easily be modified to do so. However,
due to the simplicity of the system, and its relatively low cost, a DBV
was configured and evaluated on the asphalt test pad for any insight
into nontangent operation. A limited series of runs was conducted and
the findings shown in Figure 16. The level of stability was first deter
mined by conducting locked-wheel tests at increasing levels of lateral
acceler.ation by varying the speed through a fixed radius curve. The
same pair of wheels were us~d in both the right and left turn testing,
left front and right rear. It was determined that the limit of stabil
ity, or where the vehicle could still stay within the limits of the
curve, were 0.28 g for a left turn and 0.41 g for a right turn. It is
presumed that a properly equipped DBV, which could brake either diagonal
set of wheels; could develop the higher level in either type of turn.
Data (SON) were then taken tangent across the curve and at varying levels
of lateral acceleration through tpe curve, in a left and right direction
43

&4 Lim~t -um I I I I
53+ I I I I I I
52+ I I I I I I 51-J. I I
SON I I I ~ 50f I I ~
I I I 49+ I I
I I I I
48+ I I I I I
47 0.4 0.3 0.2 0.1 0.0 0.1 Q.2 0.3 0.4
Right Turn Left Turn LATERAL ACCELERATION, Ay (g'a)
DIAGONAL BRAKED VEHICLE - E 503
Figure 16. Results of DBV Testing Program.

(Figure 16) up to the preestablished limits. The SDN shows good consis
tency up to about 0.2 g where it seems to diverge. This was apparently
due to the increasing vehicle yaw, developing side force on the rolling
wheels. This yaw was created by the vehicle going into an oversteer,
left turn, or an understeer, rfght turn, condition. These conditions
were observed by the driver, where he had to make steering corrections
to stay within the limits of the curve, starting at 0.23 g right and
0.35 g left.
Based on these tests and published information, no practical appli
cation was found for the DBV in most nontangent measurements. However,
the DBV could be used in special cases such as T-type intersections where
the method of sliding to a complete stop would be a desi.rable measure~
ment mode.
British Pendulum Tester
The British Pendulum Tester is a dynamic pendulum impact-type test
er used to measure the energy loss when a rubber slider edge is propell
ed over a test surface. Being portable, the laboratory type device is
capable of making various field surface friction measurements. The de
~ice is operated in a static condition, in that it does not move over
the surface as a vehicle would, but is placed in position by an operator.
This device was considered not as a primary measurement system, due to
its obvious deficiencies"'relative to items 1, 2 and 6 in Table 4, but
to augment the primary system by providing data where it would be dif
ficult or impossible to operate a vehicle type measurement system.
Based on the literature review the British Pendulum Tester does not
45

meet the criteria items 1, 2, and 6 as shown in Table 4. It was dis
covered that the device must be operated on a level surface (lQ which
eliminated superelevations and grades, although this difficulty could
probably be overcome. This would limit the normal use of the device to
flat curves and low speed areas such as T-type intersections. Further
investigation showed that 11 any correlation with Method E-274 would be
purely fortuitous 11 (~) and 11 is not very satisfactory .. (2.._).
Based on these findings it was decided not to proceed any further
with investigations into the British Pendulum Tester and to consider it
not generally applicable to nontangent pavement friction measurements.
PTI Mark II I
The pennsylvania Transportation Institute (PTI) Mark III Pavement
Friction Tester is a modification of a single wheel tester capable of
operating in the locked~wheel, transien~slip, and yaw modes. The sin
gle wheel tester uses a hydraulic cylinder to force the trailer into a
yaw angle up to 12 degrees from the direction of travel. The force
measurement system consists of a six-component force/moment measuring
hub.
The system agrees, to a large extent, with the equipment criteria
requirements outlined earlier. Item 4, in Table 4, addresses the system
cost which is about $65,000 complete, and to date the only extensive
use is by the State of Pennsylvania and Penn State University. Infor
mation on this system was obtained from a Pennsylvania State University
report (~) that investigates the various modes of friction testing using
the PTI Mark III exclusively. It was not feasible during this phase of
46

the study to obtain a unit for testing at the TTl facility due to the
continuous use of the existing units and the remote distance involved.
With the system able to operate in the locked-wheel mode with an
ASTM E501 (1_3 tire at 4826 N (1085 lb) it should emulate theCASTM
E-274 two wheel system quite well. With the added capability of adjust
ing or locking the articulation angle between truck and trailer hydrau
lically, the acceptable level of lateral forces could be somewhat higher
than the E-274 two wheel system. The same effect of lateral forces
acting on a system with reduced side force capability exists, but the
tow vehicle is used to maintain stability, not a single wheel.
Saab Friction Te?ter
The Saab Friction Tester is a specially equipped Saab 900 Combi
Coupe• with a measuring wheel located between the rear tires, and driven
from the differential at a constant 15 percent slip relative to the
drive wheels. The vehicle is primarily intended for aircraft runway
friction measurements according to ICAO (International Civil Aviation
Organization) regulations. It is also specified as a .. Road Quality
Tester" in a Saab-Scania report (Z) where it is "intended for periodi
cal checking of the road surface conditions.•• Figure 17 shows the basic
operation of the unit and the location of the test wheel. A vertical
load of 982 N (220 1~ is generated by a weight via a sprin9 and shock
absorber. The test wheel can be either set to a free 'Wheeling,Jmode or
to the 15 percent slip condition by the opera~.ior. It is conceivable
that modifications could be made to provide for complete lock-up. Fric
tion numbers, which range from 0 to 10, are recorded on a digital
47

A hydraulically retractable measu· nng whHI ia built in behind the rear axle of the car.
The mea1uring whHI ia driven by a cham tranamiaaion connected to the rear axle, and the dnve ratio providaa 1 constant 16% •lip.
Cutaway sidtlwi•w m•wring arm
Figure 17. Saab Friction Tester.
48
Measuring whHI

printer and on tape recorder cassettes. The system contains an on
board watering system with a pump and 500 litre (130 gal) tank.
Since this is a relatively new device, literature and test results
in relation to highway friction work in the U.S. is quite limited. A
limited testing program was proposed that would involve a typical test
er to be evaluated at the TTI Proving Grounds Research Center, but was
disapproved by the Sponsor based on the positive testing results of the
E-274 system as noted in the previous chapter.
With respect to the previously mentioned Equipment Criteria (Table
4), based on manufacturer's literaturg, the Saab appears to meet all
points at an approximate cost of $40,000. The unit is also claimed to
measure curve radius by using a lateral accelerometer and vehicle speed
to perform the calculations. This technique would work on a flat curve
but would need other inputs, if any superelevation is encountered, to
predict true radius.
The system appears to be capable of making measurements in a non
tangent mode of op,eration with no modifications since it is basically
an automobile with a lightly loaded test wheel underneath. It should
be able to operate at higher g level conditions than a tow vehicle -
test trailer configuration. In fact, modification of the vehicle sus
pension to handle curves at higher speeds would make the Saab vehicle
the most promising all ~ound skid resistance evaluation method en
countered in the study.
Correlation between the Saab Friction Tester and a locked wheel
trailer is not well established at this point. A study by NASA oat
49

Wallops Island recently completed a test sequence involving the Saab
system, Mu Meter, and the DBV in tangent airport runway measurements.
The data from this study have not been processed at this time and no
conclusions have been reached. Walter Wazinski, of the Canadian Minis
try of Transportation, indicated they have a Saab system in use and
have conducted a correlation study, but with a Skidometer tester which
is also a slip-type tester. He indicated his is the only unit involved
in highway measurements in the U.S. or Canada to his knowledge.
If future testing shows the Saab Friction Tester is correlatable
with the E-274 system, it should be considered as a device to measure
nontangent sections which are not feasible for the E-274 skid Trailer.
50

IV. EVALUATION OF ALTERNATIVES TO AND RECOMMENDATIONS FOR THE MEASUREMENT OF SKID RESISTANCE OF NONTANGENT SECTIONS
The following pages present a synopsis recommending equipment
proficient for measuring the wet-pavement skid resistance of nontang
ent sections. The basis of these recommendations can be found in the
previous chapters. The specific recommendations presented are based
on evaluation of the information summarized in Table 4 and on consid
eration of the factors discussed below.
Use of Existing Equipment
This criterion ranks quite high in the selection of a practical
system for friction measurements of nontangent sections. If an exist-
ing system can be used as it is or with slight modification, the modifi-
cation cost factor will be minimal. Also, the systems would be avail
able with relatively large amounts of background data. Since prior
analysis indicated the relative capability of existing measurement sys
tems to perform nontangent measurements, it is recommended that they be
considered for use or further development in measuring skid resistance
of nontangent sections. These systems, listed below, are ranked in
order of existing number of units used for highway testing.
1) Two-wheel E-274 type trailer. 2} Mu Meter. 3) PTI, single wheel trailer. 4) Diagonal-brake{.vehicl~
5) Saab-Frictional Tester.
51

Modification of Existing Equipment
Recommended modifications to existing equipment were treated with
respect to cost and equipment inoperative time involved versus the ,bene
fits gained. The results presented earlier showed that a, properly
configured, two wheel E-274 skid trailer could satisfactorily conduct
nontangent testing within certain limits. These limits, as described,
occur mainly as an instability in the trailer as lateral acceleration
increases producing a hazardous condition at approximately ±0.33 g. If
the system is to used as it is, it is recommended that an audible
visual warning system be developed to alert the operator of a hazardous
condition, if the limit is exceeded. If measurements are planned to be
made above this limit, it is recommended that a method or methods of
stabilizing the trailer unit be developed as outlined earlier (e.g., a
trailing wheel), or that different measurement procedures be adopted.
If E-274 systems that do not measure the dynamic test wheel verti
cal load are to be used in nontangent measurements, it is strongly re
commended that a system be developed to conduct this measurement as de
scribed earlier. Such a system is developed in the next chapter. Other
modifications recommended for the E-274 system would be to provide baf
fles in the water tank and modify the water nozzles to distribute the
water in front of the test wheel even for sharp curves.
The Penn State (PTI1 Mark III single wheel tester, of which there
are only six in use, conforming to ASTM E-27?1- should require only one
major modification. The articulation angle for the yawed wheel should
be held fixed during a test. It is recoiTIIlended this be accomplished by
52

modifying the hydraulic controls associated with the yaw system. This
system could have a higher lateral acceleration limit than the two wheel
E-274. However, substantial testing of the device as modified wo~ld be
required to establish its true behavior pattern since the stability of
such an arrangement is still questionable.
The Diagonal Braked Vehicle, as stated in the last chapter should
be limited to the testing of flat road surfaces at low speeds where a
full stop is normal for traffic operation. T-type intersections are
applicable examples. Recommended modifications for the DBV would be to
add an on-board watering system to eliminate the need for a separate
water truck. An accelerometer should be installed for instantaneous
display of rate of change of vehicle velocity throughout the test.
Due to the sparsity of test data available on the Saab Friction
Tester, no modifications are recommended to improve its nontangent per
formance at this time.
Changes in Testing Procedures
The most economical and expedient method of adapting existing equip
ment to measure nontangent sections would be to develop operating pro
cedures to maximize the strong points and minimize the weak points. The
following outlines several possibilities for such procedural changes.
Test velocity is a major concern since the centrifugal force acting
on the system is increased as the square of the forward velocity. It
is recommended that a method be devised to test at reduced speeds for
high lateral g test sites, and to interpret the results for data to the
accepted 65 km/h (40 mpn) test speed. Another recommended procedural
53
change would be to require a broader range of calibration levels for
the test wheel vertical load data system. This is to accommodate the
higher dynamic range required during nontangent testing.
The same recommendations hold true for the one wheel test trailers,
in that, the same type of forcts would affect it and could be substan
tially reduced by a reduction in test speed. As mentioned in the equip
ment modifications a procedure should be developed to fix the articula
tion angle between tow vehicle and test unit. This should provide
rea~onable stability in a repeatable manner; however, it should again
be ~lphasized that this would be a procedure requiring substantial val
idation, due to the uncertain stability of this configuration.
The Diagonal Braked Vehicle used at T-type intersections would require
the development of special procedures for measuring the deceleration
or stopping distance. It is recommended that a pulsed method be devel
oped using the afore mentioned accelerometer, similar to the DBV system
used by NASA at Wallops Island.
Inadequate information is available to recommend any procedural
changes for the operation of the Saab Friction Tester .
. Conceptual Design of New Equipment
No original design of equipment is recommended for the measurement
of nontangent, wet-pavement skid resistance at this time. This recom
mendation is based on tne findings of the previous chapters regarding
the capability of existing systems.
54

Adequacy for Measuring Tangent Sections as Well as Nontangent Sections
The equipment recommended for measurements of nontangent sections
is basically existing tangent type equipment with some hardware and
procedural modifications. The proposed modifications are intended to
augment the already existing capability and accuracy of the system with
out degrading its designed capabilities in the tangent mode of opera~
tion.
SuiTIIlary
Based on these results, it is recommended that the two wheel, E-274
Skid Trailer be used, with proposed modifications, as the primary meth
od of measuring the wet-pavement skid resistance on nontangent sections.
The proposed modifications include the following:
1)
2)
Incorporation of an audible-visual warnin~ system to alert the operator(s) of a hazardous condition {developed in the next chapter).
Incorporation of an 11 effective dynamic force system11 for trailers which do not now measure these forces directly, as outlined in the Task B report (developed in the next chapter).
3) Provide baffles and reconfiguration of the water-distribution system to prevent catastrophic loss of water during testing.
4) Develop procedural changes for extreme nontangent operation as follows (developed in the next chapter). a} A sequence of 11 Safe11 or n,posted 11 speed operations which
allow extrapolation of an SN65 • b) Posted spee« operation which develops and reports skid
resistance values at arbitrary (posted) speeds. c) Posted speed operation combined'w.ith some other type of
testing which would allow analytical determination of the SN65 , as described in Chapter II.
55

At this time, it does not seem necessary to recommend use of the
other promising methods for nontangent measurement described herein.
The lack of experience with these devices (the PTI one-wheel tester
and the Saab vehicle), their high initial cost, and the prevalance of
the two-wheel E-274 trailer an~ the lack of promise that either of the
alternate approaches could offer better performance, supports these
recommendations.
56

V. TECHNIQUES USING THE TWO-WHEEL ASTM E-274 SKID TRAILER FOR THE WET-PAVEMENT MEASUREMENT OF SKID RESISTANCE OF NONTANGENT SECTIONS WITH ADDITIONAL INSTRUMENTATION FOR DYNAMICALLY MEASURING HIGHWAY GEOMETRICS
With the E-274 Skid Trailer showing the most promise, the follow
ing pages will document detail~ of the recommendations presented at the
end of the last chapter. As the E-274 Skid Trailer is already a
widely used, well documented, and readily available piece of test
equipment, the task of equipment design is greatly simplified. Even
though the performance of the standard E-274 system in nontan9ent
measurement is good, two areas require attention. The first is the
upper limit of the system. This is the point which, if exceeded, pro-
duces not only e·rroneous results, but a condition that is unsafe· to the
system operators and any vehicle or persons close to the system. This
limit is one of stability of either the tow vehicle or the trailer. As
the severity of curvature, slope or geometric condition increases, the
measurement system becomes victim to the very situation it is trying
to measure. Test track testinq, earlier reported, showed that the
trailer is the first part of the system to become unstable. These tests
showed that as the radius of curvature becomes smaller and smaller, and
· the speed is maintained at 65 km/h (40 mph) the trailer starts :to:'yaw
or slide-out due to the greatly reduced side-force capability of the
locked wheel. This event does not happen gradually with warning, but
quite rapidly as the test wheel is locked to take a measurement. This
phenomenon was discussed in earlier chapters. Since the track testing
was terminated at incipient slip-out conditions to prevent damage,
57

jackknifing or complete slip-out did not occur, but could be antici·
pated. The level of incipient slip out is rather high compared to nor
mal highway travel (approximately 0.3g to 0.4g in the trailer's horizon
tal plane). This level also approaches the stability limit of the tow
vehicle.
To increase the upper limit of side force allowable on the
test trailer, the cornedng slip resistance of the system must be in-
creased to meet the increased demand. Based on the findings presented
ear-lier, the standard E-274 system, in a locked-wheel test mode, relies
on the rolling wheel to generate effectively all of the required side
force. The side~force available could be simply expressed as:
(7) F = ell w ya r in which
Fya =Available side force.
ell =Cornering slip number/100, dry.
Wr = Static weight supported by the rolling wheel,
In order to maintain a stable system, this available side force must
never be exceeded by the side force demand produced by lateral acceler
ation caused by cornering or geometries. This demand is simply express-
ed as:
(8) Fyd = Wt Ay
in which
Fyd =Side force demand.
Wt =Static weight supported by both wheels.
AY = Lateral acceleration.
58

There are two other significant forces which affect the limit of
stability. The first of .these is the side force produced as the test
wheel is locked, applying a moment about the hitch point. The contr.ibu
tion of this force in a right turn with the left wheel locked is
(9) Fyd = (Wt Ay) - Fs
in which
Fs =Side force developed due to locked wheel.
It should be noted that this force is dependent on SN.
The other significant force is the overturning moment which in-
creases or decreases the vertical force of the wheels as the lateral
acceleration acts on the center of gravity of the trailer. This effect
adds or subtracts from the available side force.
(10) Fya = C (Wr- Wt Ay h/t)
in which
h = Height of e.g. from ground, and
t = Wheel track.
It is interesting to note that the side force Fs counter balances the
effect of the load variations of the rolling wheel, to some extent, pro
,viding a directionally Synllletrical system. Typical available and demand
side forces are shown in Figure 10 at various lateral accelerations
conditions.
The lateral accelerations (AY) are· measured in a plane parallel to
the trailers axle in the Y axis and are i.ndep~ndent of vertical grade
and cross slope. Since the lateral acceleration measured by an acceler
ometer firmly mounted to the trai.ler axle is a direct indicator of
59

stability level a warning system can be devised from its output.
By applying the output voltage from such an accelerometer tb an
electronic voltage comparator along with a preset level, a warning sig-
nal can be generated. This signal, whether in the form of a bell or
light would indicate to the venicle operator that the skid trailer
could go into an unstable condition if a locked-wheel test is performed
during that particular maneuver. The particular section of roadway
could then be rerun at a lower velocity to reduce the dynamic forces on
the test trailer. A further step in providing a safe system would be
to couple the output of the comparator to the skid-cycle controller as
an inhibit signal to prevent a test-wheel lockup in the event of an un
safe condition. A block diagram of such a system is shown in Figure 18.
The upper limit of stability of the test trailer may be increased
allowing measurements to be made in geometric roadway conditions pro-
ducing high lateral forces. One method of accomplishing this is by in
creasing the vertical force on the rolling wheel allowing a higher cor-
nering force as expressed in Equation 7. To produce this increased
force, weights could be added to the right side of the trailer (assuming
a left test wheel). Since the weights could not realistically be placed
directly over the wheel, some weight would need to be removed from the
left side to maintain test weight. The available side-force capability
would be expressed as:
( 11)
in which:
Wa =Additional load applied to rolling wheel
60

0"1 ._J
LATERAL ACCELEROMETER
Ay
SIGNAL CONDITIONING
CIRCUIT
LEVEL CONTROL
B
t-------tA COMPARATOR
A<B ALARM
DEVICES
LIGHT BELL
• ... SKID CYCLE INHIBIT SIGNAL
Figure 18. Block Schematic of Operator Warninq Device.
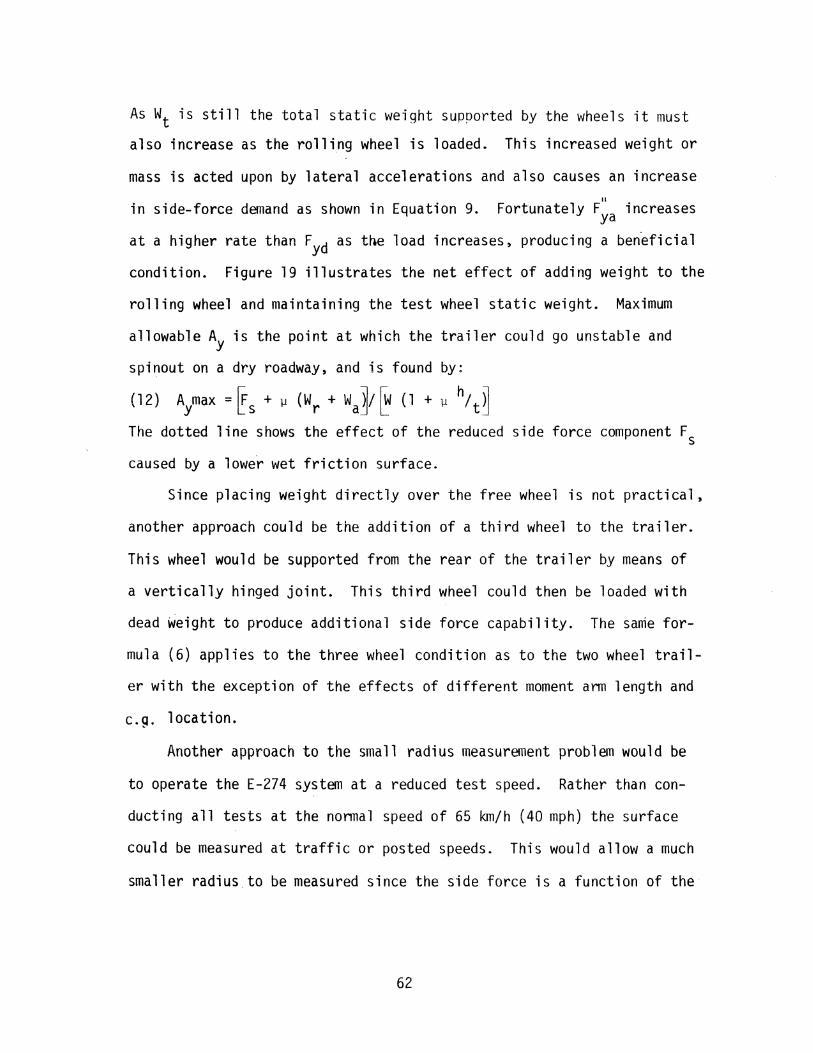
As Wt is still the total static weight supported by the wheels it must
also increase as the rolling wheel is loaded. This increased weight or
mass is acted upon by lateral accelerations and also causes an increase II
in side-force demand as shown in Equation 9. Fortunately F increases ya at a higher rate than Fyd as t~e load increases, producing a ben~ficial
condition. Figure 19 illustrates the net effect of adding weight to the
rolling wheel and maintaining the test wheel static weight. Maximum
allowable AY is the point at which the trailer could go unstable and
spinout on a dry roadway, and is found by:
( 1 2) Aymax = ~ s + ~ ( W r + W a]; ~ ( 1 + ~ hIt~ The dotted line shows the effect of the reduced side force component Fs
caused by a lower wet friction surface.
Since placing weight directly over the free wheel is not practical,
another approach could be the addition of a third wheel to the trailer.
This wheel would be supported from the rear of the trailer by means of
a vertically hinged joint. This third wheel could then be loaded with
dead weight to produce additional side force capability. The same for
mula (6) applies to the three wheel condition as to the two wheel trail
er with the exception of the effects of different moment arm length and
e.g. location.
Another approach to the small radius measurement problem would be
to operate the E-274 system at a reduced test speed. Rather than con
ducting all tests at the normal speed of 65 km/h (40 mph) the surface
could be measured at traffic or posted speeds. This would allow a much
smaller radius to be measured since the side force is a function of the
62

O'l w
0.6
0.5
Ay MAX(g's) I
I I
/ /
/
/ /
/ /
I I
_,-"' o.4, 1
0.
//
//
llt92 kg (1085) lbs
,"" //
1000 (2204)
/ /
/
, "" /
/
LEF~ /
/
LEFT
# R~HT
,.,. ,.,..,. ----------~HT
.,....-.,.
,"""
1500 (33on
--- SN65(40) =20
SN65(40) =50
2000 (4409)
TOTAL ROLLING WHEEL(S) STATIC WEIGHT
Figure 19. Effect of Adding Weight to.Unlocked Wheel.
2500 (5512)

square of the speed. To correct the data back to the standard SN 65 (40)
framework, i.e., to correlate with tangent measurements, a speed gradi
ent would have to be established for each range of Skid Numbers. An
alternative to the gradient approach would be to use a technique similar
to the one outlined in Chapter II on pages '28 'through 29. Evaluation of
these alternatives will be considered during Phase II of the project.
The other required refinement to the E-274 system is the correction
of data at marginal conditions. This correction would be oerformed by
electronic function modules placed in the data processing system. These
modules would produce a voltage proportional to either the angular mis
alignment of the measurement axis to the true forward axis or the side
force applied to the measuring wheel, or both. This error signal will
then be summed with the data to produce a value as though there was no
error. As the errors have been found to be small, based on test
track work, a fairly simple circuit should suffice correcting for the
major of the several error producing factors. Several circuits have
been discussed and will be evaluated in Phase II.
For those E-274 systems which do not presently measure horizontal
and vertical forces directly at the locked wheel, a technique has been
developed to correct the data output. This technique involves using
accelerometer signals to "correct" the.static wheel weight for the errors
induced by nontangent msasurement. A block schematic of a circuit which
can accomplish this correction is shown in Figure 20. The basic purpose
of the circuit, is to co~rect the static wheel weight for the dynamic
vertical and lateral accelerations of the trailer, and to use this
64

0\ Ul
Input Signals
Az
Ay
f
Gain Elements (constants) .., .. - -z .... L -y••T .. , I
X
WL
Summing Circuit
- + X
~ - -WT h/t -
X H/C
Fi9ure 20. Block Schematic of Correction Circuit.
. ' ., ....
~w -
' . ..... -.
f ... -
Dynamic Test Wheel Load
SN= f/W
Drag Force

corrected value to find the skid number. The equations used are as
follows:
( 13) SN = ( f I w )( 100)
Where:
and
SN = Skid number at test speed
f = Draw bar force, N (lbf)
W = Az Wl - Ay Wt h/t- F H/c
W = Dynamic test wheel vertical load, N (lbf)
w1 = Static test wheel vertical load, N (lbf)
Wt = Stati~ test trailer weight, N (lbf)
Az = Vertical acceleration at e.g. of trailer (g)
Ay = Lateral acceleration at e.g. of trailer (g)
h = Height of e.g. from level ground, m (ft)
t = Wheel track of trailer, m (ft)
H = Height of hitch center from level ground, m (ft)
c = Distance from hitch center to axle center, m (ft)
To provide direct, dynamic measurements of the roadway geometry
a system separate from the acceleration measuring system has been de-
veloped. This system will involve a gyroscopic system similar to those
used in aircraft and aerospace work. The gyro is a device using angular
momentum of a spinning rotor to sense angular motion of its case with
respect to inertial space about one or two axes orthogonal to the spin
axis. A vertical gyro will measure angular changes in both the pitch
and roll planes while a directional gyro will measure angular changes
66

in the yaw plane. Systems are commercially available that utilize
aircraft type gyros for land vehicle research. These units provide a
voltage output directly proportional to any angular displacement from
true hori zonta 1 .
The earth 1 s horizontal plahe is sensed by mercury gravity swithches
located on the gyro mechanism. These switches drive low torque motors
to position the gyro mechanism to a perfectly vertical orientation. Based
on past experience with this type of aircraft gyro in land vehicle work,
some modifications need to be made to the commercial units for satis
factory operation. Of the several modifications and refinements required,
the most obvious are the effect of acceleration on the mercury switches
and the angular difference between the trailer frame and the roadway.
With respect to the switches, any lateral or longitudinal acceleration
will act on the mercury causing the gyro to sense an error in horizontal
alignment and start torquing away from true horizontal. TTl engineers
have solved these problems on a similar system for the Texas State Depart
ment of Highways and Public Transportation, and will utilize similar
solution techniques on the specific instrumentation used in the Phase II
effort.
67

VI. VEHICLE HANDLING TESTS WHICH SHOULD RELATE SKID EQUIPMENT TEST RESULTS TO PASSENGER CAR PERFORMANCE .
The fundamental requirement of a routine pavement friction tester
is to provide meaningful measurements related to frictional needs of
traffic. These frictional needs are quite complex being a combination
of skid resistance, where the tire slides, and slip resistance, in
which the sliding speeds experienced by the tire tread are small in
relation to the vehicle speed. There are then three modes of slip;
brake, drive, and cornering.
Each mode of friction resistance measurement requires a separate
test procedure and usually a different test device. The E-274 skid
trailer was desi9ned and specified to measure surface friction in the
skid or locked~wheel mode of operation. Even though this mode of mea
surement does not reflect all the frictional needs of day to day traf-
fie flow, it is an efficient tool for identifying skid-prone sections
of roadway.
The multitude of tire-road system variables affecting vehicle skid
performance makes an absolute measurement of skid resistance very dif
ficult. As vehicle variables such as speed, load, and suspension
~haracteristics are added, reliable measurements become virtually im
possible. For this reason, vehicle handling tests cannot concentrate
on developing comparisons based on absolute numbers, but on evaluating
the ability of the measurement system to rank surfaces in the same order
as an average vehicle.
68

The current two-wheel E-274 systems have demonstrated an ability
to adequately perform this ranking when making tangent measurements.
It therefore seems reasonable to assume that this ability will carry
over into nontangent measurements. However, the influence of combined
mode operation (braking and co~ering, for example) may introduce subtle
variations.
Recommended Procedures
Correlation of nontangent trailer performance would logically be
best with a vehicle operating in a similar, nontangent mode. This im
plies that the developed vehicle handling test procedures should subject
the vehicle to the same or similar maneuvers that the measuring trailer
will experience. From our previous discussions, this would include only
legitimate highway design concepts plus a few thousand situations which
might not be considered legitimate. This presents us with a plethora
of possibilities, the complete evaluation of which would be impossible.
Our task then is to choose a series of representative maneuvers
which should cover the gamut of possible situations or represent the
reasonable extremes of vehicle-trailer operation. It would also be
useful if the procedures chosen correspond to some standardized vehicle
handling test procedures so that the techniques and terminology used as
well as the output parameters, can be uniformly implemented and inter
preted.
The Vehicl£ Handling sub-committee of the Passenger Car activity
within the Society of Automotive Engineers (SAE), has been dealing with
the development of such procedures for several years. To the present
69

date, little has been accomplished toward establishing the unified stan
dard. Major disagreements still exist concerning which maneuvers to
use, and whether the tests should be open-loop (with an automatic con
troller) or closed-loop (with a human driver). It appears that it will
be some time before a consensus decision will be reached.
Other avenues for developing such procedures have been more fruit
ful in producing techniques, but no more successful in obtaining agree
ment on the proposed procedures. Certainly the most successful were
developed by the Highway Safety Research Institute and the Texas Trans
portation Institute under joint contract with the Department of Trans
portation (3). These procedures offer the flexibility of either open
or closed-loop control while identifying limit performance character
istics of the vehicle-tire-pavement combination under evaluation.
Evaluation of the various procedures in the above referenced re
port, identified four techniques which show promise of correlation with
the E-274 type trailer. The procedures identified.are listed below.
l) Straight-line braking
2) Lateral acceleration in a turn
3) Braking in a turn
4) Acceleration in a turn
The first task, straight-line braking, relates to the normal tan
gent operation of the tr~iler. Any evaluation should include this
maneuver to establish the validity and tracability of the tangent per
formance of the measurement technique. The mechanism of evaluation is
the time increment of a velocity c~ange under locked-wheel braking. Two
70

approaches to this mechanism will be evaluated during the Phase II ef
fort; a velocity change from 65 km/h (40 mph) to 0 km/h, and a change
from 75 km/h to 55km/h. The evaluations of Phase II should identify
which of these approaches is most consistent and representative.
The second item, lateral acceleration in a turn, establishes the
unbraked cornering capability ranking of the pavement. Again, two ap
proaches may be used; establishing the minimum curvature negotiable at
65 km/h and the corresponding lateral acceleration, or establishing the
maximum negotiable speed (and lateral acceleration) for a given curve.
Braking in a turn, item three, is a repeat of item two, except
that a certain braking pressure is applied. The level of braking is
usually in the neighborhood of fifty percent slip, the proper pressure
being established through preliminary testing.
Item four, acceleration in a turn, is not strictly a procedure
developed in the referenced report. This procedure should be perfonmed
and evaluated in precisely the same manner as items two and three, ex
cept that the curve should be entered at 55 km/h and the vehicle accel
erated to 75 km/h for a given curve, with the lateral acceleration as
the test output.
As stated earlier in this chapter, these procedures should be used
to rank the various pavement-geometry ·configurations. This ranking
should then be compared -to the ranking by the E-274 trailer to esta.blish
the correlation.
71

VII. RECOMMENDATIONS FOR THE PHASE II PROJECT WORK PLAN
The introduction has already identified the purpose of the Phase
II effort as the implementation, validation, and refinement of there
commendations presented earlier in this report.. It is proposed that
this purpose be accomplished by making use of the nine tasks as outlin
ed in the original prospectus and proposal, with few substantive changes.
Upon approval of the recommendations presented earlier, and·on
notification to proceed, purchase orders for the major items required
to complete tasks A, B, and C will be prepared, and copies submitted
to the contract manager for final approval. Items whtch are supportive
in nature, or which cost less than fifty dollars, will not normally be
submitted to the' contract manager. Procurement procedures for one i tern
required for Task A, the tri-axial wheel force transducer, have already
been instituted on contract manager approval. Delivery of this major
item is anticipated in early February of 1980. The balance of equipment
required for the completion of tasks A, B, and C will be ordered early
and timed for receipt so that the entire modified E-274 trailer will be
completed, checked-out, and ready for calibration within one year of
notification to proceed, as shown in Table 5.
The unique features of the trailer to be developed in Phase II are
listed below:
1) Incorporate warning device for incipient trailer slip-out,
2) Install a two-axis load cell on the measuring wheel and a triaxial load cell on the other,
3) Incorporate the 11 effective dynamic force system11 so that sideby-siQe measurements can be made on the two alternative measuring systems,
72

--....! w
Months after approval to proceed
0 2 4 6 8 1 0 12 14 16 18 20 22 24 26
Task A Assemble Basic ~ ~ ~ System
Task B Assemble Geometric ~ ~ ~ Instrumentation
Task C Assemble Data ~ ?a Eauioment ~
Task D Develop Calibration ~ ~ Techniques
Task E ~evelop Procedures ~ ~ Task F Conduct Measurement ~ ~ Tests
Task G Comparison Tests ~ with Un-mod. E-274
Task H Comparison Tests IJi+h P;ac:c:onnAr (";lr ~ ~
Task r Prepare Report ~ ~ ~ ~ Progress Report •• •• 4 •• 4 • • 4 •• 4 • • 4 • • 4 •• 4 • • 4 •• 4 •• 4 •• 4 • • Final Dr~ft Report • Executive Summary Draft •
Table 5. Project Schedule (Phase II)

4) Provide baffles and reconfiguration of the water-distribution system,
5) Incorporate instrumentation for the dynamic measurement of highway geometries, and
6) Possess separate data handling systems for the two force measurement technique~ and for the highway geometries measurement.
It is proposed that these changes be made on the TTI Research Trailer
which was used in the Phase I testing.
Task D will develop calibration techniques for the modified trail-
er. These will begin by evaluating the current calibration procedures
used at the Central Western Field Test and Evaluation Center. It is
not anticipated that any substantive changes will be required in these
procedures, but careful attention will be paid to any deviations or
difficulties encountered. Calibration techniques and a list of required
equipment for calibration will also be developed at this time for those
additional items installed on the modified trailer.
The efforts of Task E will concentrate on smoothing out and vali-
dating the recommended procedures of earlier chapters. It is during
this effort that a final decision will be made regarding extrapolation
and/or measurement techniques for those borderline sections as identi-
fied in item (4) on page 55.
Task F will involve inventory-type measurements of real world high
way sections by the modified trailer which was validated in Task E.
Particular attention will be paid to validation of the dynamic geometries
measurement. Correlation will also be obtained between the nontangent
sections measured and similar (sam~ material, same construction time and
74

traffic) tangent sections as measured by the modified trailer.
Task G will be used to compare the modified trailer with the be
havior of an unmodified E-274 trailer. If TTl is in possession of
ARSMS #2 when Tasks F and G are conducted, this correlation will i.nvolve
repl-world highway measurements of tangent sections. In any event, the
testing will also involve a full correlation with ARSMS #1 at the CWFTC
in a manner identical to that used for calibration of systems brought
to the Center. The purpose of these tests will be to establish the
deterioration, if any, of the tangent performance of the modified
trailer.
Task H will establish the ranking ability of the procedures devel
oped in the previous chapter. This evaluation will involve testing on
real-world highway sections and at the Research Center. Comparisons
will then be made on the ranking ability of the modified trailer and
the vehicle handling test procedures.
The final report, to be developed in Task I, will document the test
results and present finalized, validated calibration and testing pro
cedures.
75
REFERENCES
1. A Policy on Design of Urban Highways and Arterial Streets, American Association of State Highway and Transportation Officials, Washington, D.C., 1973.
2. A Policy on Geometric Design of Rural Highways, American Association of State Highway and Transportation Officials, Washington, D.C., 1965.
3. Dugoff, H., Erwin, R. D., and Seqel, L., nvehicle Handling Test Procedures .. , Highway Safety Research· Institute, University of Michigan, Ann Arbor, November 1970.
4. KufT!Iller, H. W. and Meyer, W. E., 11 Tentative Skid-Resistance Requireme·nts for Main Rural Highways II,· Highway Research Board, National Cooperative Highway Research Program Report 37, 1967.
5. 11 Mu-Meter Instruction & Servicing Manual 11 , ~1. L. Aviation Company, Limited, Maidenhead, Berkshire, England, January 1975.
6. Saibel, Edward A. and Chiang, Shang-Li, 11 The Skidding of Vehicles, A Dynamic Analysis 11 , Carnegie-Mellon University, Department of Mechanical Engineering, Contract No. FH-11-6090, Pittsburgh, Pa., March 1971.
7. 11 Saab Road Quality Tester11 , Saab-Scania, Saab Car Division Tpp-78.87, 1978.
8. Shah, V. R. and Henry, J. J., 11 Relationship of Locked wheel Friction to That of Other Test Modes 11 , Commonwealth of Pennsylvania, Department of Transportation, Report FHWA-PA-72-7, Harrisburg, Pa., 1977.
9. 11 Skid Resistance .. , Synthesis of Highway Practice 14, National Cooperative Highway Research Program (NCHRP), Transportation Research Board, Washington, D.C., 1972.
10. ..Standard Test Method> for Measuring Pavement Surface Frictional Properties Using the British Portable Tester11 , ASTM E-303.
11 ... Standard Test Method for Side Force Friction on Paved Surfaces Using the Mu-Meter11 , ASTM E-670-79.
12. 11 Standard Tire for Pavement Skid Resistance Tests .. , ASTM E-501-76.
76

Appendix I - Computer Program Listing c C INPUT DUA t»HOULD FOLLOU fHE I /tDA'fA CARD. lAt.:H lHPUT CARD C SHOULD CONTAIN 5 NUHIERS IN FREE-FORHATa C (1) SUPER ELEVATION (degrees>, C <2> SLOPE Cde9r .. 1>, C ( 3) COEFFICIENT OF FRICUON CHU), C (4) RADIUS OF CURVE '"'tera), AND C (~) TRAILER SPEED Ck"/h). C AS IAHY CARDIA& DE&IREI KAY BE INPUT. c
ILOCK DATA REAL VARC6),AC6,7),8l(o),H,HU,TTC7),AUARC6) INT£0ER•4 ILI8TC6) 1 AN8,1LEN,ILCT,lLABLEC6),kllST COtUtON /Blk 1/A ,VAR ,I LADLE, H, BT ,AUAR, I LIST COMKON /BLK2/ILCT,ILEN,EXIT,I,IROT,JLIST,kllST DATA ILABLE /' f ~,~YCR>','YCL>~,~ S ','S(f)',' R '/ DATA ILIST/6•' ~I,KLIST/' ~1
END
c ·············································~···················· REAL UAR(6),AC6,7),BT(o),H,HKG,MU,TJ<7),AVAR<o) INTEGER•4 ILISTC6>,ANS,ILEN,ILCT,ILABLE(6) COKKON /8LK1/A,VAR,ILAILE,TT,BT,AVAR,ILIST COKKON /BLK2/ILCT,l~EM,EXIT,I,IROT,JLI&T,KLIST PiaJ.141~926~4 6•386.4
C••••••••••••••••••••VALUES fOR HI SKID TRAILER••••••t~•••••••'.,*** 11•2340.6 H•12.~
8•12.0 T•60.6J C•111.9~ E•8.8 K•Y/G KKG•H•I7:5.08 HH•H•0.0254 8H•I•0.0254 TH•T•0.0254 CH•C•0.0254 EH•E•0.0254 URITE<,,BOO>IKG,K,HH,H,IH,B,TK,T,CM,C,EK,E IDATA•O
1 IDATA-IDATA+1 DO 890 1•1 ,6
VliHU•O .. lLIST<l)-KllST AVM<I> .. o. BT<I>•O. DO 890 J•1,7
AU,J>•O.

UYU LUNii~UL
lLCf.o.6 EXl I ""0. JLl 51""0 k£Ab <5, ·~ ,HW•999 > TH£TAD,f'HID,ttU,RAIH1,VKMH lH£TA•THETAD~2•PI/360.
PHI ""f'HID ••2•-F'l/JoO. l<AD"'I~AIIM·~J'I. 370 V"'VKMH•to. 936 RADFT•RAP•O.OBJ33J VMPH .. V•0.05682 fiQ;;;;(M~<V••2))/kAD
C·~·~u:;uH•• tiATklX FORMATION tifif•••••••'t'n All,ll"'l A< 1 ,:l>•-IIU tH2, 1 >•H-8 A<2,2>•-E•COS<THETA> A<2,3>•-<HU~Ht£) A<2,6)"'C A <3, 2> "NCOS< TH~TA> fO .5+H•Uii< lKETA) A<J,J);;;;-T:JO.!; . A<3,4>•-H tH3,5)•H-B A<4,2>•E~5IN<TH,TA>
A<4, J>•liU•T••O .:) A<4,4)•-E IH 4, ::D~>-C A<5,2>--SIN(TH~lA> A<5,4>•1 A<5,5) 11 -l A<6,2>~COS<THETA> A<6,3l•l A(6,6)•1 BT<I>-K~G•COS<THETA>•SIH<PHl)t(GO•SIN<THETA>•SIH<PHl>> BT<51•-H•G•SlN<THETAI .. COS<PHI>+<GO•COS<THETA>> IH < 6 I •li•G'•COS( T~PA>•CQS<fHl )t <GO,. SIN CfHETttHCOS<PHl) >
DO 50 1•1,6 ~0 A<I,7> .. 8T(l)
lLEH•UCl + 1 CALL GAUSS IF<EX1T.EQ.99.9100 TO 9~0
c,.,,,,~••• DATA OUTPUT •••••••••••• Wf< ITE < 6, 820 >I~ATA, THE TAll, fHlll ~ KU, &Allft, Kl\l.lfT, Vl(ttH, VttPH DO 940 I• I ,6
VARf'•VAk<I> VAf<N•VAIW~~. ·H8
9•0 URITE <6,52~ ULAPLE< l l ,VARN,VARP 950 liOTO l '199 URITE<6,1H0)
SlOP

) I ~ , .. 11;.; I , I; 6 • 1 , •' ~ ~ ( ·' , F 0 ' ' •
>f5.2,' 1nl' ,I,T5, )'B~',f6.4,~ ~ C',F~.2,' in)',T42,'T~',f6.~,' • t',f5.2,' in)',l, >15, >'C;',F6.4,'" (',F6.2,' inl~,T~2,'E•',F~.~.' ft t',F5.2,' inl',/1
U20 FORIIAJ(///' DATA SET M',ll,// >TS,'CROSS-SLOPE AN6LE <THETAl~',f6.2,' de9reei',/, >T~,'VERTICAL SLOPE AHGLE <PHil~',f6.2,' de9raei',/, >r5,'COEffiClENT Of fRICTlOH <KUl• ',fo.J,I, >T5,'RAPIUS ~',FB.t,' ~ (' 1f7,1 1 ' ft)' 1
)' (t R.H. CURVEl',/ 1
>T5,'VEH1CLE VELOCITY •' 1F:i.1 1 ' ~1'\/b (' 1f6,1 1 " ttpt.>",// 1
>T2,'VAR1ADLE OUTPUT') 825 FORI1A1(2X,A4,'• ',f7.1,' H (' 1f7.1," lb)') tHO FORHAT<//1//'lEND Of DATA',/////)
END C41•H•t<•u•to•U•H GAUSS SU&RO.UHNE ••••Uilltifllflfl(j
SU~ROUTlHE 6AU5S C•••toH•ton•;.ulRANSfEIC VARIA&LES -A, VAR 1 lLCT, ILENtntf
REAL VA~(6l ,A<6,7) ,BH6l, T'ft7) 1AVAR(6) INTEOE"*4 lLlGJ(61,1LA&LE(6) CONnON /&LK1/A,VA~,ILA~LE,TT,8l,AVAR,lll6T COKIION /&LK2/lLCT,ILEM,EX1T,I 1 1ROT,JL1ST 1 K~IST DO 29:i 1~1,11
2'}5
99
10
15
DO 29:5 Jilll1 17 IZOT .. A<I ,JHlOOO ZOT-IZOT A<l,JI~~:ZOTilOOO CONTINUE
HN""lLCTtl ICZOT•O lROT=O DO 99 I=l,ILCT
IF<A<I,l>.ME.O.O)GO TO 9? EXIT•99.9 UkllE<6,444)((A(ll,JJ),JJ~t,7),11~1,o) FOiHAT<"O~,'~••••••••••• ~~~QR-ZERO OM PlA60NAL •"'*•~,
> /'O',o(7(2X,£14.7)/' '), GO TO 999 CONTINUE
DO 2~ l•l,ILCT liNITao~H I, 1)
DO 10 J•1, NN A<l,Jl•A(l,Jl/ZlMlT conuuE ·
lf<l.EQ.l~C1)6Q TO 25 L•l . L:.L+\ C11 A<L,U 00 20 J-l,HH
A(L,Jl=A<L,J)-C~A(l J)

.·v LUNilHUL lfiL.Ll.lLCTIGO 10 15
:.!~ CUtfl !HUE l(.-llCft1
..lO 1(;.;.1\-1
H"'lLCT SUM~O.
IJU J~ J•l ,N SUM~SUMtAIK,J)*VAR<Jl
.5::1 CUtHlNUE VAk<K>~A<K,Ntll-SUN
IfiK.GT .1 IGO TO JO '19 'I 1<£ I Ut<H
E.ND I /~OAT!t '(