skeletal muscle metabolic dysfunction in patients with … · 2016-03-16 · " ii"...
TRANSCRIPT

Skeletal Muscle Metabolic Dysfunction in Patients
with Malignant Hyperthermia
by
Sara J. Thompson
A thesis submitted in conformity with the requirements
for the Degree of Master of Science
Graduate Department of Exercise Sciences,
University of Toronto
© Copyright by Sara J. Thompson, 2016
ii
Skeletal Muscle Metabolic Dysfunction in Patients with Malignant Hyperthermia
Sara J. Thompson
Master of Science
Graduate Department of Exercise Sciences
The University of Toronto
2016
ABSTRACT
Malignant Hyperthermia (MH) is a disorder where susceptible individuals show a
hypermetabolic reaction to anaesthetics. A subset of MH-susceptible (MHS) patients experience
muscle weakness, fatigue and exercise intolerance. Additionally, some individuals with heat or
exercise-induced rhabdomyolysis (MH-like reactions) show MH susceptibility. The purpose of
this study was to assess skeletal muscle metabolism and exercise performance, to define
metabolic phenotypes in MH patients. Phosphorous magnetic resonance spectroscopy (31P-MRS)
and blood oxygen level-dependent fMRI were performed to evaluate skeletal muscle
metabolism. Participants then performed exercise tests to assess aerobic capacity, anaerobic
capacity, and muscle strength. 31P-MRS revealed MH patients, particularly those with severe
muscle symptoms, had significantly lower oxidative phosphorylation ATP production than
healthy controls, accompanied by impaired aerobic and anaerobic capacity. Impairments were
similar between patients with MH-like reaction (MHS-L) and MHS. Chronic mitochondrial
damage is proposed as the pathophysiological mechanism for metabolic and functional
impairment in MHS and MHS-L patients.

iii
ACKNOWLEDGEMENTS
First and foremost I’d like to thank my supervisor Dr. Greg Wells, for his support and
guidance as I developed and executed this project. I owe a lot of my growth over the past two
years to him. I’d also like to thank Dr. Sheila Riazi, Director of the Malignant Hyperthermia
Investigation Unit, who first pursued this project and recruited the participants. She was an
important mentor for me throughout this process. I’d also like to thank my committee member,
Dr. Catherine Amara, for her knowledge and advice as I carried out this study.
Dr. Riazi also received a research award by the Department of Anesthesia. Without this
funding, this project would not have been possible. I’d also like to thank the Canadian Institutes
of Health Research Agency for the Master’s Canadian Graduate Scholarship that was awarded to
me for this project.
I need to express gratitude to Dr. Jane Schneiderman, who supervised the exercise testing
of the participants at the hospital. She has been an integral part of my development as a
researcher over the past few years. I also need to acknowledge Tammy Rayner and Ruth Weiss
who carried out the magnetic resonance imaging and spectroscopy testing. Gratitude must also
be made to Marisa de Souza who worked tirelessly to analyze the 31P-MRS data.
Thank you to the human physiology lab, particularly Gillian White and Jessica Caterini
for their wisdom during my Masters and for helping me carry out a healthy work-life balance.
Finally, thank you to my parents who have always supported my goals and helped me to achieve
them.
iv
TABLE OF CONTENTS
ABSTRACT ii
ACKNOWLEDGEMENTS iii
TABLE OF CONTENTS iv
LIST OF ABBREVIATIONS ix
LIST OF TABLES xi
LIST OF FIGURES xii
LIST OF APPENDICES xv
CHAPTER 1: INTRODUCTION TO MALIGNANT HYPERTHERMIA 1
CHAPTER 2: REVIEW OF LITERATURE 3
2.1 Clinical Features of Malignant Hyperthermia 3
2.1.1 Pathophysiology 3
2.1.2 Triggering agents 4
2.1.3 Diagnostic tests 6
2.1.4 Treatment 6
2.1.5 Genetic mutations 7
2.2 Functional consequences of Malignant Hyperthermia 8
2.2.1 “Awake” episodes and musculoskeletal symptoms 8
2.2.2 Mitochondrial damage 10
2.3 Measures to assess skeletal muscle metabolism 11
2.3.1 31P-magnetic resonance spectroscopy 11
2.3.2 Blood oxygen-level dependent functional magnetic 13
resonance imaging
2.4 Summary 14
2.4.1 Gap in literature 14
2.4.2 Purpose 14
2.4.3 Research questions 15
2.4.4 Hypotheses 15
v
CHAPTER 3: METHODS 16
3.1 Experimental design 16
3.2 Participants 17
3.2.1 Sample size 17
3.2.2 Participant recruitment 18
3.2.3 Consent and patient screening 18
3.2.4 Inclusion criteria 18
3.2.5 Exclusion criteria 18
3.2.6 Group characteristics 19
3.2.7 Dietary restrictions 19
3.3 Measures of assessment 20
3.3.1 Anthropometric measures and physical activity 20
questionnaire
3.3.2 Magnetic resonance imaging and spectroscopy 20
3.3.2.1 31Phosphorous magnetic resonance spectroscopy 21
3.3.2.2 Blood oxygen level-dependent fMRI 23
3.3.3 Functional performance measures 24
3.3.3.1 Aerobic capacity 24
3.3.3.2 Anaerobic capacity 25
3.3.3.3 Lower body strength and power 25
3.3.3.4 Upper body strength 26
3.4 Statistical analysis 27
CHAPTER 4: RESULTS 28
4.1 Comparison of HC to MH group 28
4.1.1 Participants 28
4.1.2 Descriptive characteristics 28
4.1.3 Habitual Activity Estimation Scale 28
4.1.4 31Phosphorous magnetic resonance spectroscopy 30
4.1.4.1 31P-MRS analysis 30
4.1.4.2 31P-MRS results at rest 33
vi
4.1.4.3 Significant 31P-MRS results after exercise 33
4.1.4.4 Non-significant 31P-MRS results after exercise 35
4.1.5 Blood oxygen level-dependent fMRI 36
4.1.5.1 BOLD fMRI analysis 36
4.1.5.2 BOLD fMRI results 38
4.1.6 Work achieved during in vivo exercise 38
4.1.7 Aerobic capacity 39
4.1.7.1 Estimation of VO2max using the YMCA 39
submaximal cycler ergometer test
4.1.7.2 YMCA results 41
4.1.8 Anaerobic capacity 42
4.1.8.1 Wingate Anaerobic Test (WAnT) analysis 42
4.1.8.2 WaNT results 42
4.1.9 Upper and lower body strength 45
4.2 Comparison of HC to MH patients with and without muscle 46
symptoms
4.2.1 Participants 46
4.2.2 Descriptive characteristics 46
4.2.3 Habitual Activity Estimation Scale 46
4.2.4 31Phosphorous magnetic resonance spectroscopy 50
4.2.4.1 31P-MRS results at rest 50
4.2.4.2 Significant 31P-MRS results after exercise 51
4.2.4.3 Non-significant 31P-MRS results after exercise 54
4.2.5 Blood oxygen level-dependent fMRI 56
4.2.6 Work achieved during in vivo exercise 58
4.2.7 Aerobic capacity 59
4.2.8 Anaerobic capacity 61
4.2.9 Upper and lower body strength 65
4.3 Comparison of HC to MHS and MHS-L patients 66
4.3.1 Participants 66
4.3.2 Descriptive characteristics 66
vii
4.3.3 Habitual Activity Estimation Scale 67
4.3.4 31Phosphorous magnetic resonance spectroscopy 67
4.3.4.1 31P-MRS results at rest 67
4.3.4.2 Significant 31P-MRS results after exercise 68
4.3.4.3 Non-significant 31P-MRS results after exercise 68
4.3.5 Blood oxygen level-dependent fMRI 69
4.3.6 Work achieved during in vivo exercise 70
4.3.7 Aerobic capacity 70
4.3.8 Anaerobic capacity 70
4.3.9 Upper and lower body muscle strength 70
4.4 Significant Correlations 71
4.4.1 31P-MRS measures vs. anaerobic capacity 71
4.4.2 31P-MRS measures vs. muscle strength 75
4.4.3 BOLD fMRI measures vs. aerobic capacity 75
4.4.4 BOLD fMRI measures vs. anaerobic capacity 76
4.5 Post hoc sample size calculation 77
CHAPTER 5: DISCUSSION 78
5.1 Introduction 78
5.2 Summary of main findings 79
5.2.1 Impaired skeletal muscle metabolism 79
5.2.1.1 31Phosphorous magnetic resonance spectroscopy 79
5.2.1.2 Blood oxygen level-dependent fMRI 82
5.2.2 Impaired functional exercise performance 84
5.2.2.1 Aerobic capacity 84
5.2.2.2 Anaerobic capacity 85
5.2.2.3 Upper and lower body strength 87
5.2.3 Physical activity level 88
5.2.4 Correlations 89
5.2.4.1 Relationship between 31P-MRS measures 89
and functional performance
viii
5.2.4.2 Relationship between BOLD fMRI measures 89
and functional performance
5.3 Hypothesis for skeletal muscle damage 90
5.4 Hypotheses revisited 94
5.5 Conclusion 94
5.6 Limitations and future directions 95
CHAPTER 6: REFERENCES 97
CHAPTER 7: APPENDICES 105
Appendix 1: Physical Activity Readiness Questionnaire (PAR-Q) 105
Appendix 2: Informed consent form (The Hospital for Sick Children) 107
Appendix 3: Informed consent form (University Health Network) 113
Appendix 4: Data collection sheet (UHN) 118
Appendix 5: Habitual Activity Estimation Scale (HAES) 119
Appendix 6: MRS/BOLD data collection sheet 125
Appendix 7: Functional data collection sheet 129
Appendix 8: Equation list 131
Appendix 9: YMCA test 133
ix
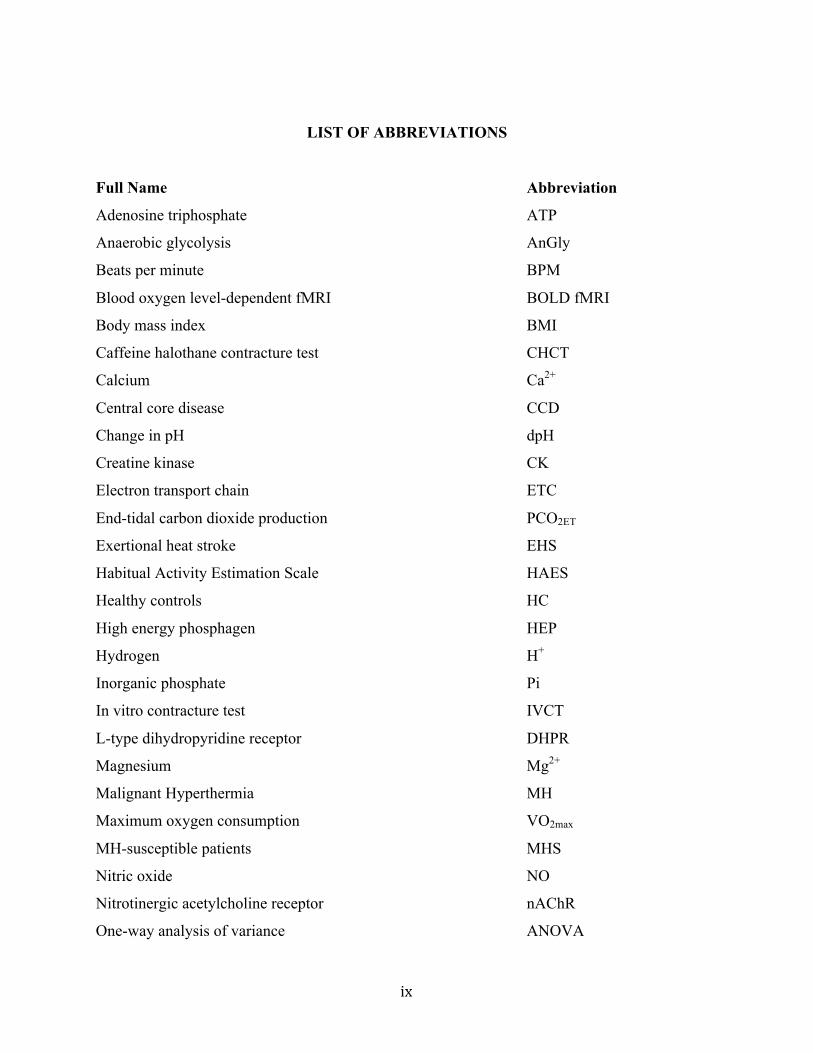
LIST OF ABBREVIATIONS
Full Name Abbreviation
Adenosine triphosphate ATP
Anaerobic glycolysis AnGly
Beats per minute BPM
Blood oxygen level-dependent fMRI BOLD fMRI
Body mass index BMI
Caffeine halothane contracture test CHCT
Calcium Ca2+
Central core disease CCD
Change in pH dpH
Creatine kinase CK
Electron transport chain ETC
End-tidal carbon dioxide production PCO2ET
Exertional heat stroke EHS
Habitual Activity Estimation Scale HAES
Healthy controls HC
High energy phosphagen HEP
Hydrogen H+
Inorganic phosphate Pi
In vitro contracture test IVCT
L-type dihydropyridine receptor DHPR
Magnesium Mg2+
Malignant Hyperthermia MH
Maximum oxygen consumption VO2max
MH-susceptible patients MHS
Nitric oxide NO
Nitrotinergic acetylcholine receptor nAChR
One-way analysis of variance ANOVA
x
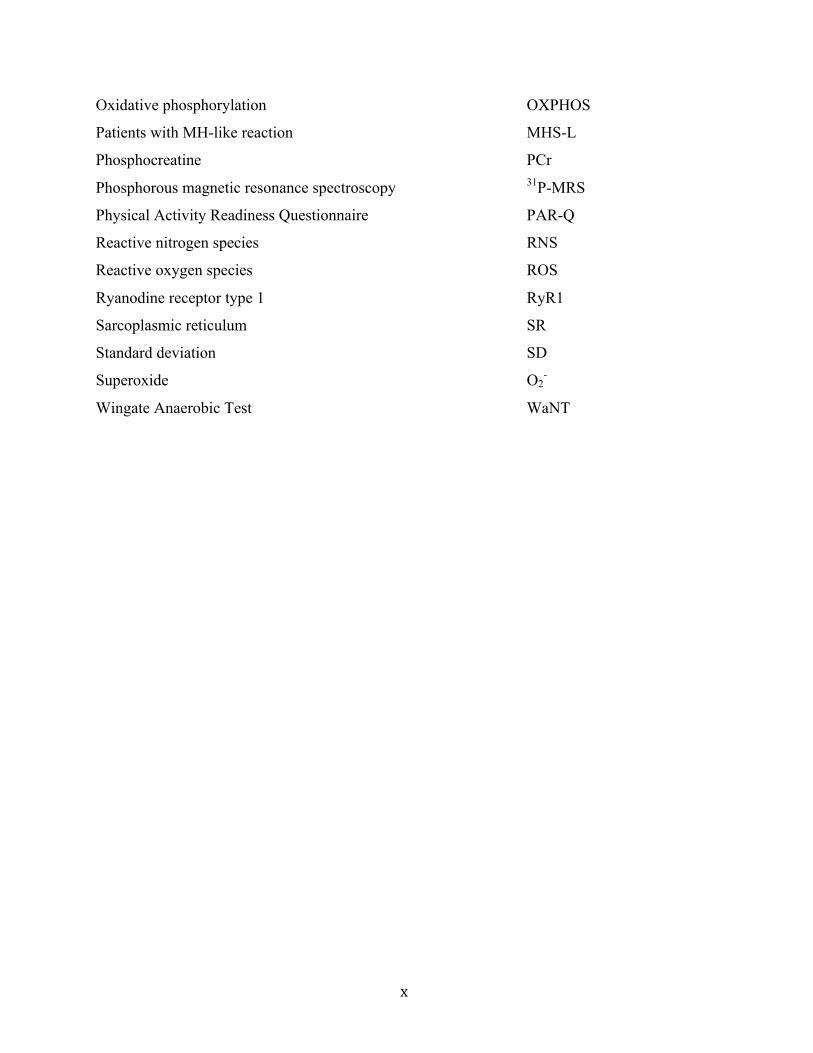
Oxidative phosphorylation OXPHOS
Patients with MH-like reaction MHS-L
Phosphocreatine PCr
Phosphorous magnetic resonance spectroscopy 31P-MRS
Physical Activity Readiness Questionnaire PAR-Q
Reactive nitrogen species RNS
Reactive oxygen species ROS
Ryanodine receptor type 1 RyR1
Sarcoplasmic reticulum SR
Standard deviation SD
Superoxide O2-
Wingate Anaerobic Test WaNT
xi
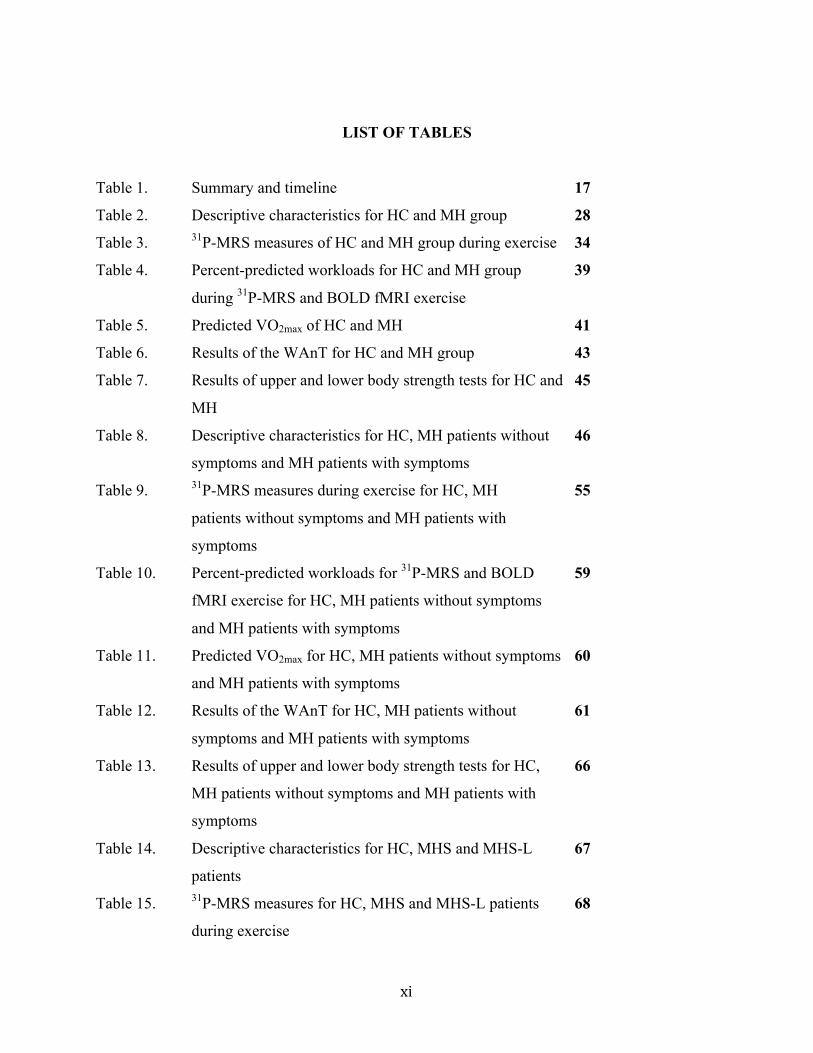
LIST OF TABLES
Table 1. Summary and timeline 17
Table 2. Descriptive characteristics for HC and MH group 28
Table 3. 31P-MRS measures of HC and MH group during exercise 34
Table 4. Percent-predicted workloads for HC and MH group 39
during 31P-MRS and BOLD fMRI exercise
Table 5. Predicted VO2max of HC and MH 41
Table 6. Results of the WAnT for HC and MH group 43
Table 7. Results of upper and lower body strength tests for HC and 45
MH
Table 8. Descriptive characteristics for HC, MH patients without 46
symptoms and MH patients with symptoms
Table 9. 31P-MRS measures during exercise for HC, MH 55
patients without symptoms and MH patients with
symptoms
Table 10. Percent-predicted workloads for 31P-MRS and BOLD 59
fMRI exercise for HC, MH patients without symptoms
and MH patients with symptoms
Table 11. Predicted VO2max for HC, MH patients without symptoms 60
and MH patients with symptoms
Table 12. Results of the WAnT for HC, MH patients without 61
symptoms and MH patients with symptoms
Table 13. Results of upper and lower body strength tests for HC, 66
MH patients without symptoms and MH patients with
symptoms
Table 14. Descriptive characteristics for HC, MHS and MHS-L 67
patients
Table 15. 31P-MRS measures for HC, MHS and MHS-L patients 68
during exercise
xii
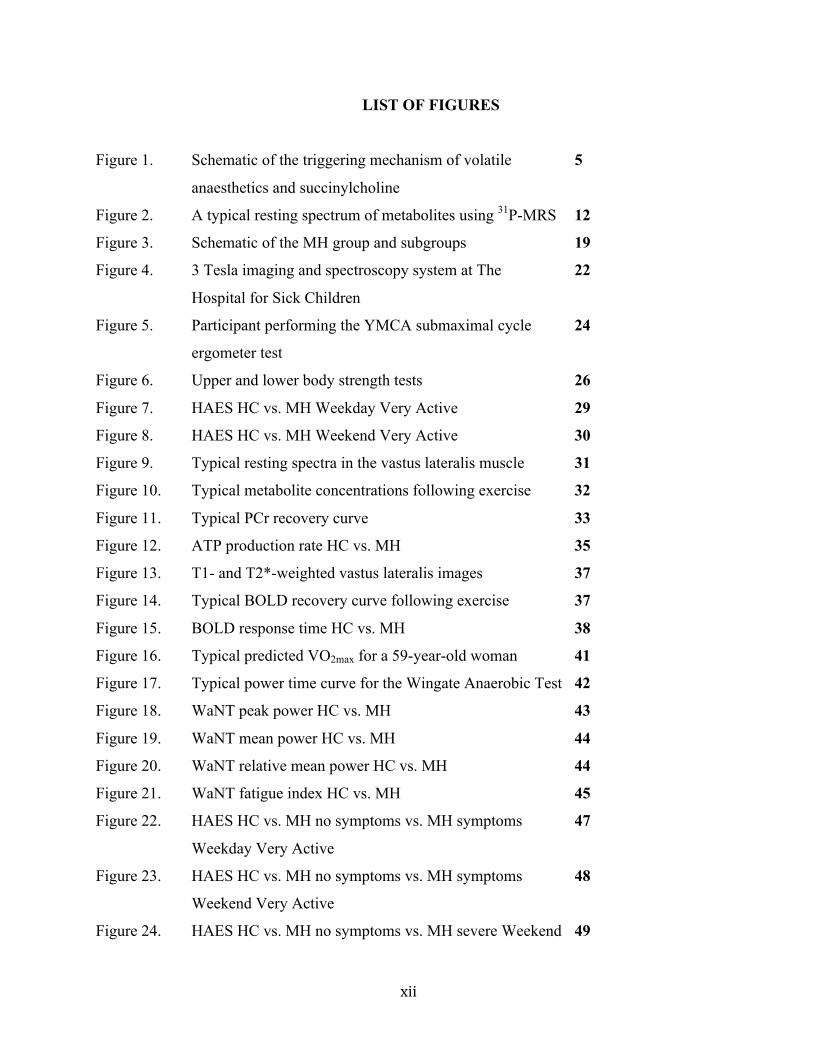
LIST OF FIGURES
Figure 1. Schematic of the triggering mechanism of volatile 5
anaesthetics and succinylcholine
Figure 2. A typical resting spectrum of metabolites using 31P-MRS 12
Figure 3. Schematic of the MH group and subgroups 19
Figure 4. 3 Tesla imaging and spectroscopy system at The 22
Hospital for Sick Children
Figure 5. Participant performing the YMCA submaximal cycle 24
ergometer test
Figure 6. Upper and lower body strength tests 26
Figure 7. HAES HC vs. MH Weekday Very Active 29
Figure 8. HAES HC vs. MH Weekend Very Active 30
Figure 9. Typical resting spectra in the vastus lateralis muscle 31
Figure 10. Typical metabolite concentrations following exercise 32
Figure 11. Typical PCr recovery curve 33
Figure 12. ATP production rate HC vs. MH 35
Figure 13. T1- and T2*-weighted vastus lateralis images 37
Figure 14. Typical BOLD recovery curve following exercise 37
Figure 15. BOLD response time HC vs. MH 38
Figure 16. Typical predicted VO2max for a 59-year-old woman 41
Figure 17. Typical power time curve for the Wingate Anaerobic Test 42
Figure 18. WaNT peak power HC vs. MH 43
Figure 19. WaNT mean power HC vs. MH 44
Figure 20. WaNT relative mean power HC vs. MH 44
Figure 21. WaNT fatigue index HC vs. MH 45
Figure 22. HAES HC vs. MH no symptoms vs. MH symptoms 47
Weekday Very Active
Figure 23. HAES HC vs. MH no symptoms vs. MH symptoms 48
Weekend Very Active
Figure 24. HAES HC vs. MH no symptoms vs. MH severe Weekend 49
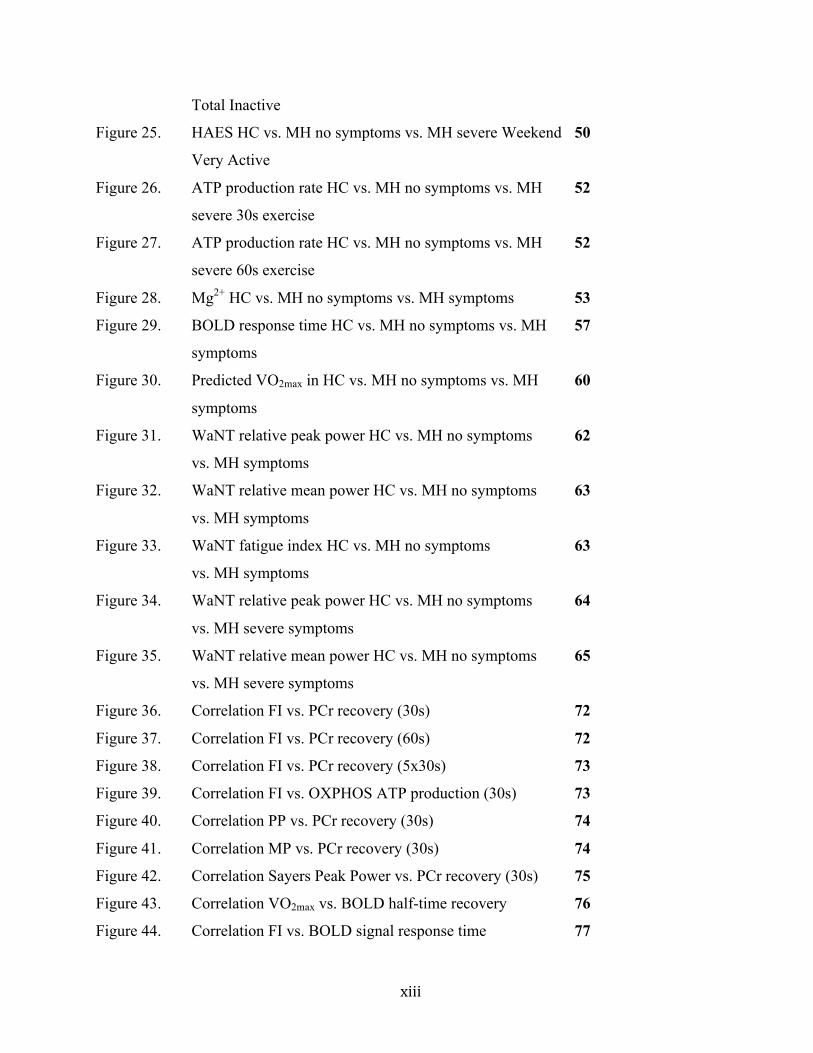
xiii
Total Inactive
Figure 25. HAES HC vs. MH no symptoms vs. MH severe Weekend 50
Very Active
Figure 26. ATP production rate HC vs. MH no symptoms vs. MH 52
severe 30s exercise
Figure 27. ATP production rate HC vs. MH no symptoms vs. MH 52
severe 60s exercise
Figure 28. Mg2+ HC vs. MH no symptoms vs. MH symptoms 53
Figure 29. BOLD response time HC vs. MH no symptoms vs. MH 57
symptoms
Figure 30. Predicted VO2max in HC vs. MH no symptoms vs. MH 60
symptoms
Figure 31. WaNT relative peak power HC vs. MH no symptoms 62
vs. MH symptoms
Figure 32. WaNT relative mean power HC vs. MH no symptoms 63
vs. MH symptoms
Figure 33. WaNT fatigue index HC vs. MH no symptoms 63
vs. MH symptoms
Figure 34. WaNT relative peak power HC vs. MH no symptoms 64
vs. MH severe symptoms
Figure 35. WaNT relative mean power HC vs. MH no symptoms 65
vs. MH severe symptoms
Figure 36. Correlation FI vs. PCr recovery (30s) 72
Figure 37. Correlation FI vs. PCr recovery (60s) 72
Figure 38. Correlation FI vs. PCr recovery (5x30s) 73
Figure 39. Correlation FI vs. OXPHOS ATP production (30s) 73
Figure 40. Correlation PP vs. PCr recovery (30s) 74
Figure 41. Correlation MP vs. PCr recovery (30s) 74
Figure 42. Correlation Sayers Peak Power vs. PCr recovery (30s) 75
Figure 43. Correlation VO2max vs. BOLD half-time recovery 76
Figure 44. Correlation FI vs. BOLD signal response time 77

xiv
Figure 45. Schematic of the electron transport chain 91
Figure 46. The feed-forward mitochondrial damage hypothesis 92
xv
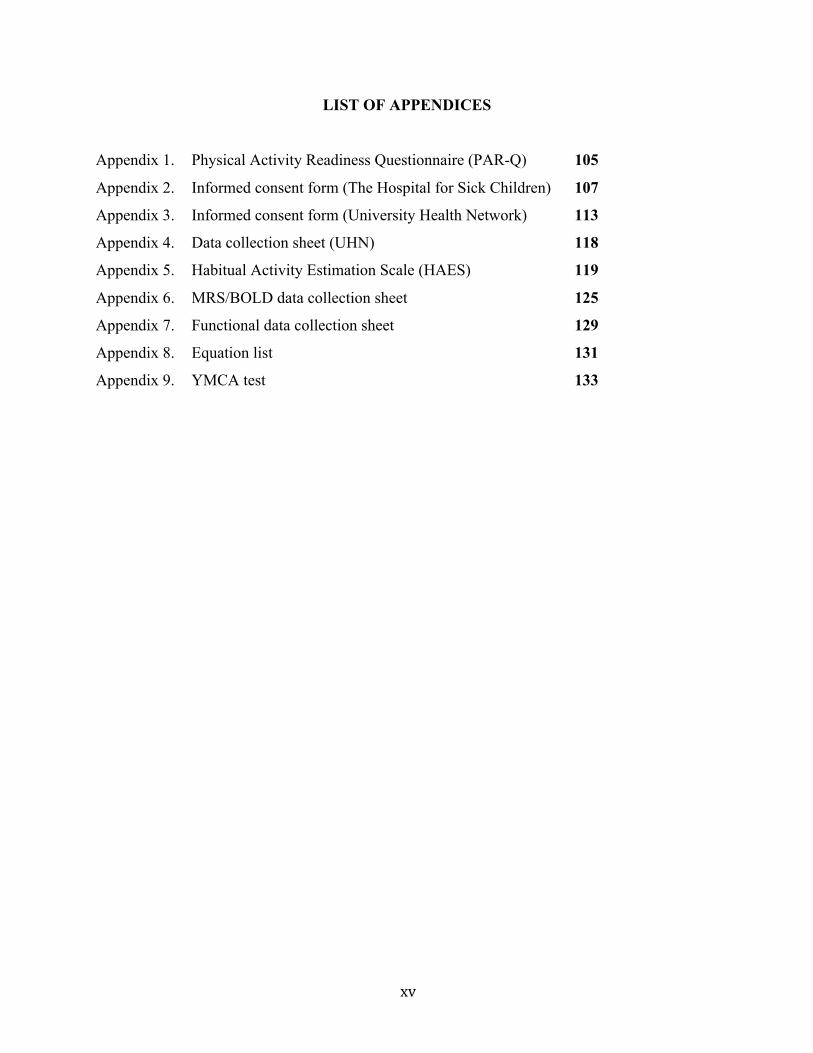
LIST OF APPENDICES
Appendix 1. Physical Activity Readiness Questionnaire (PAR-Q) 105
Appendix 2. Informed consent form (The Hospital for Sick Children) 107
Appendix 3. Informed consent form (University Health Network) 113
Appendix 4. Data collection sheet (UHN) 118
Appendix 5. Habitual Activity Estimation Scale (HAES) 119
Appendix 6. MRS/BOLD data collection sheet 125
Appendix 7. Functional data collection sheet 129
Appendix 8. Equation list 131
Appendix 9. YMCA test 133
1
CHAPTER 1: INTRODUCTION TO MALIGNANT HYPERTHERMIA
Malignant Hyperthermia (MH) is a pharmacogenetic disorder in which susceptible
individuals undergo an adverse reaction to anaesthesia during surgery (Bandschapp & Girard,
2012; Robinson, Carpenter, Shaw, Halsall, & Hopkins, 2006; Rosenberg, Davis, James, Pollock,
& Stowell, 2007). Malignant Hyperthermia Susceptible (MHS) patients experience a
hypermetabolic reaction to all volatile anaesthetics (halothane, isoflurane, sevoflurane,
desflurane) and possibly the depolarizing muscle relaxant, succinylcholine (Bandschapp &
Girard, 2012; Rosenberg et al., 2007; Rosenberg & Rueffert, 2011). Symptoms are variable,
however the most common clinical signs are an increase in end-tidal carbon dioxide production
(PCO2ET), muscle rigidity, hyperthermia, lactic acidosis and tachycardia (Glahn et al., 2010;
Litman & Rosenberg, 2005; McCarthy, Quane, & Lynch, 2000; A. N. Pollock, Langton,
Couchman, Stowell, & Waddington, 2002; Riazi et al., 2013; Rosenberg et al., 2007). When first
discovered, mortality during a reaction was approximately 70-80% (Litman & Rosenberg, 2005;
Robinson et al., 2002; Treves et al., 2005), however with increased awareness, proper monitoring
of clinical signs, and the administration of the drug dantrolene, mortality is now estimated to be
around 5% (Litman & Rosenberg, 2005; Wappler, Fiege, & Schulte, 2001a).
While unexplained deaths were reported since the introduction of anaesthesia, MH was
not recognized as an inherited disease until the 1960’s (Dengorough, Forster, Lovell,
Maplestone, & Villiers, 1962; Gronert, Thompson, & Onofrio, 1980), at which time ten deaths
were reported in a family during general anaesthesia. However it was not until three decades
later that the gene responsible for calcium regulation was mapped and linked to MH (Hopkins,
Ellis, & Halsall, 1991; MacLennan et al., 1990). With the improvement of genetic testing,
currently 34 disease-causing mutations have been identified (Klinger et al., 2014; Poels et al.,
1991).
MH is often considered a Western disease, however this is attributed to greater
anaesthetic practice in these countries (Robinson et al., 2006; Tobin, Jason, Challa, Nelson, &
Sambuughin, 2001). In 1985, Ording estimated that in Denmark the incidence of fulminant, or
life-threatening episodes, is approximately 1 in 250,000 anaesthetic procedures, however was 1
in 62,000 when volatile anaesthetics were used in combination with succinylcholine
(Capacchione et al., 2009; Ording, 1985). More recent studies have estimated the prevalence to

2
be 1 in 73,000 and 1 in 100,000, in Japan and New York State, respectively (J. E. Brady, Sun,
Rosenberg, & Li, 2009; Sumitani et al., 2011; Wappler, Fiege, Steinfath, Agarwal, et al., 2001b).
Evidently, the prevalence of this disease is difficult to determine, as there are variable symptoms
between individuals (Dlamini et al., 2013; Heytens & Vercauteren, 2013), different anaesthetic
practices, and there is often underreporting (Lavezzi et al., 2013; Sumitani et al., 2011).
Although MH is characterized by a potentially lethal hypermetabolic response during
surgery, there have been reports of cases during very intense exercise, extreme heat, or even
emotional stress (Gronert et al., 1980; Hopkins et al., 1991; Lavezzi et al., 2013; Nishio et al.,
2009). Additionally, some MHS patients experience symptoms such as muscle pain, weakness
and cramping in the absence of triggered anesthetics (Riazi et al., 2013). It remains unclear why
only some MHS patients suffer from these functional impairments, however it is noted that these
muscle symptoms tend to worsen over time (Lavezzi et al., 2013; Wappler, Fiege, Antz, &
Schulte, 2000). We hypothesized that this functional impairment is due to mitochondrial damage
however few studies have measured skeletal muscle metabolism in this population.
We used phosphorous magnetic resonance spectroscopy (31P-MRS) and blood oxygen
level-dependent (BOLD) fMRI to measure skeletal muscle metabolism in vivo, and functional
performance measures were assessed using standardized exercise tests. In vivo results revealed
that individuals tested positive with MH have decreased ATP production in the oxidative
phosphorylation pathway, which was accompanied by impairments in exercise performance.
Both the metabolic and functional impairments observed in MH-positive individuals were more
pronounced with worsening symptoms, but did not differ between MHS patients and those who
experience MH-like reactions (MHS-L). These results suggest that functional impairments in this
disease stem from skeletal muscle dysfunction and cause a worsening phenotype over time.
Comparable impairments in MHS and MHS-L patients suggest a similar pathophysiology for
these subgroups of MH-positive patients.
3
CHAPTER 2: REVIEW OF LITERATURE
2.1 Clinical features of Malignant Hyperthermia
2.1.1 Pathophysiology
During normal excitation-contraction coupling, an action potential is propagated along
the t-tubules of the sarcolemma. This depolarization induces a structural change in the voltage-
sensitive L-type dihydropyridine receptor (DHPR), located on the transverse tubule membrane
(Bandschapp & Girard, 2012; Eltit et al., 2012; Inan & Wei, 2010; Litman & Rosenberg, 2005;
Wappler et al., 2000). This conformational change in the DHPR signals the ryanodine receptor
type 1 (RyR1) on the surface of the sarcoplasmic reticulum (SR) to release calcium (Ca2+) (Diaz-
Sylvester, Porta, & Copello, 2008; Eltit et al., 2012; Inan & Wei, 2010; Riazi et al., 2013; Rios &
Brum, 1987) and cross-bridge formation and muscle contraction ensues.
The underlying cause of the hypermetabolic response of MH is due to dysregulation of
this process, specifically, an excessive release of calcium from the SR into the cytosol. When
exposed to volatile anaesthetics, there is increased sensitivity of the RyR1 to release Ca2+,
prolonged opening of the SR and an accumulation of Ca2+ in the cytosol (Avila, 2005;
Bandschapp & Girard, 2012; Inan & Wei, 2010; Louis & Mickelson, 1996; O'Sullivan,
McIntosh, & Heffron, 2001; Treves et al., 2005; Weglinski, Wedel, & Engel, 1997). This rapid
increase of cytosolic Ca2+ causes a potentially lethal cascade of events. An increase in calcium
causes excessive cross-bridge formation, leading to muscular rigidity. To support this increased
muscle contraction, there is a significant increase in anaerobic and aerobic metabolism. An
increase in aerobic metabolism causes increased oxygen consumption and carbon dioxide (CO2)
production, while increased anaerobic glycolysis leads to increased production of lactic acid,
causing acidosis. Finally, the ATP-dependent Ca2+ pump produces heat as it attempts to reuptake
Ca2+ into the SR (Lehmann-Horn, Klingler, & Jurkat-Rott, 2011; Litman & Rosenberg, 2005;
Rosenberg et al., 2007; Weglinski et al., 1997). If not recognized and anaesthesia continues,
muscle damage can occur, progressing to rhabdomyolysis and kidney failure (Glahn et al., 2010;
Rosenberg et al., 2007; Timmins et al., 2015).
4
2.1.2 Triggering agents
Although it is established that halogenated anaesthetics are MH triggers, there is debate
as to the pathophysiology of the muscle relaxant succinylcholine. While there are some reports
of fulminant MH reactions to succinylcholine, results are inconclusive. Larach and colleagues
studied reactions in North America between 1987 and 2006. The researchers discovered that out
of 284 events, 153 cases were due to volatile anaesthetics and succinylcholine combined, 128
cases were due to volatile anaesthetics alone, and only 2 cases were due to succinylcholine alone
(Inan & Wei, 2010; Larach, Gronert, Allen, Brandom, & Lehman, 2010; Raturi & Simmen,
2013). A similar study researched seven centers in Europe and discovered that 1% of cases were
triggered by succinylcholine, 18% by volatile anaesthetics alone, and 81% by the combination of
the two (Giulivi et al., 2010; Klinger et al., 2014). Conversely, Riazi and colleagues recently
published clinical findings of Canadian probands and reported that 20 of 129 total cases were
attributed to succinylcholine only (Giulivi et al., 2010; Riazi et al., 2013). It has been suggested
that succinylcholine administration is more likely to induce masseter spasm, as opposed to a
fulminant MH episode (I. J. Cox, 1996a; Ording, 1985; Sapega, Sokolow, Graham, & Chance,
1987; Wells, Noseworthy, Hamilton, Tarnopolski, & Tein, 2008). However, Klinger and
colleagues discuss that succinylcholine doesn’t cause MH reactions in itself, but can increase the
response of halothane by acting on the nicotinergic acetylcholine receptor (nAChR), causing
continuous depolarization of the sarcolemma (I. J. Cox, 1996a; Klinger et al., 2014; Sapega et
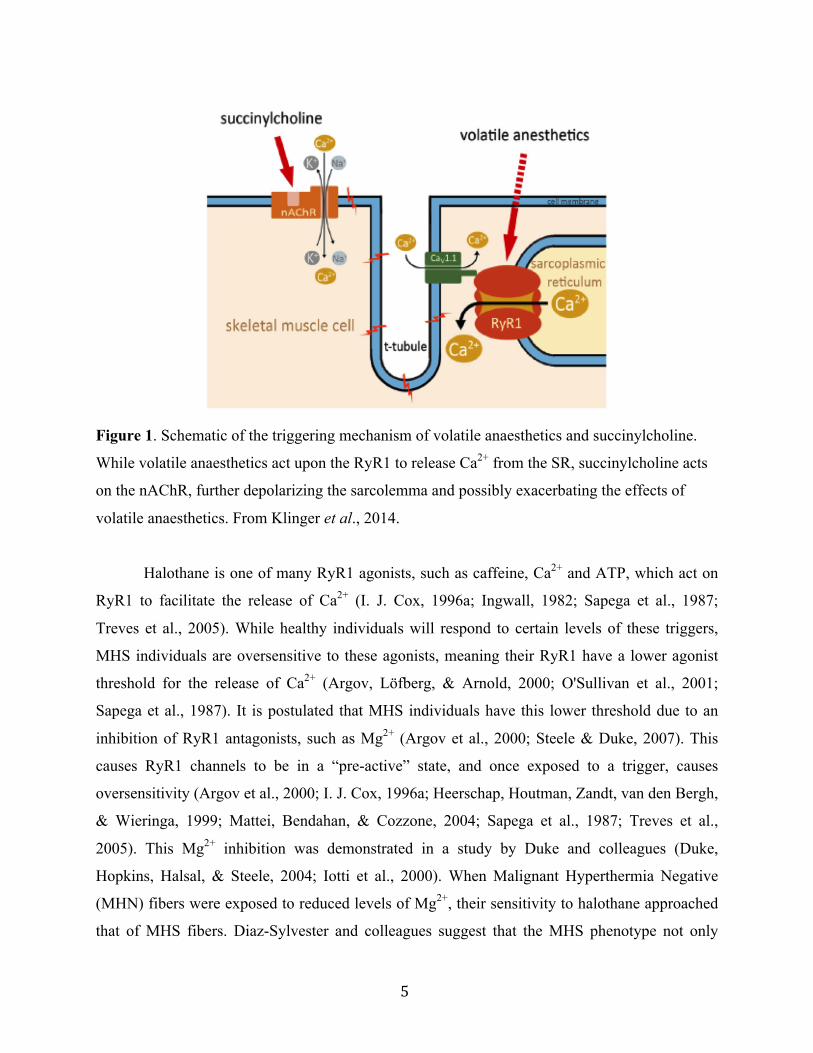
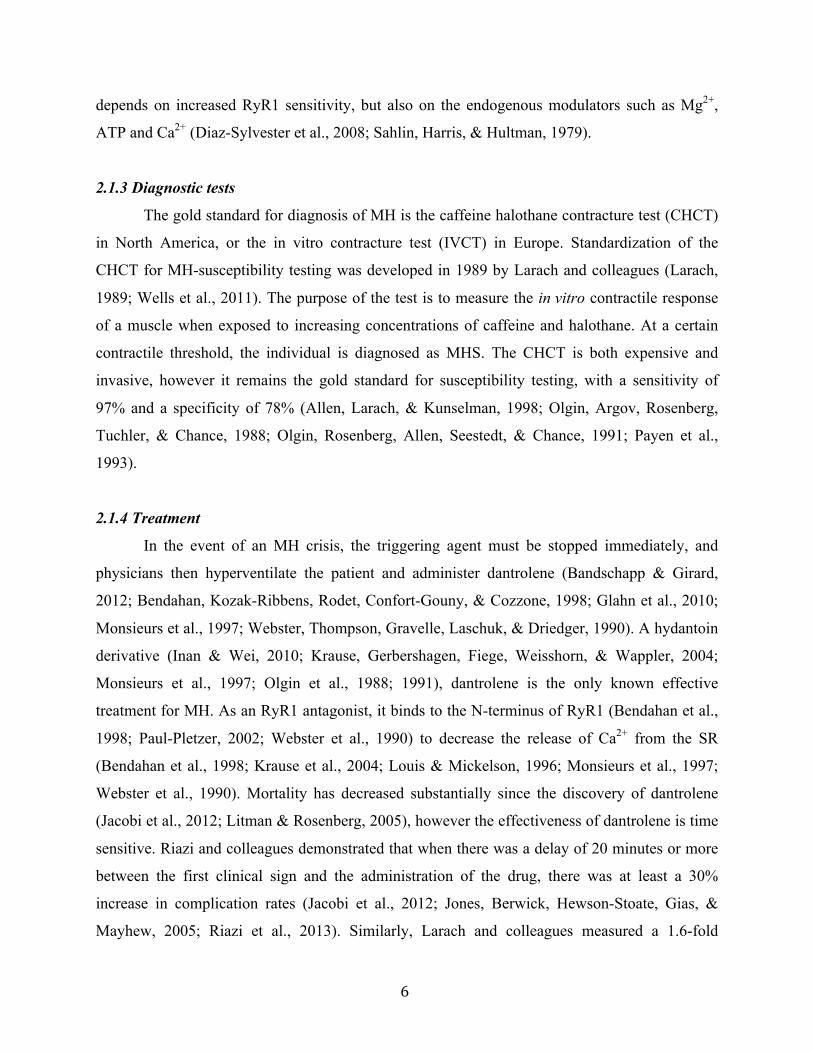
al., 1987). This is depicted in Figure 1. This suggests that the administration of succinylcholine
in conjunction with volatile anaesthetics can exacerbate the symptoms of an MH episode or
decrease the time of onset, compared to if volatile anaesthetics were used alone (I. J. Cox, 1996a;
A. N. Pollock et al., 2002; Sapega et al., 1987).
5
Figure 1. Schematic of the triggering mechanism of volatile anaesthetics and succinylcholine.
While volatile anaesthetics act upon the RyR1 to release Ca2+ from the SR, succinylcholine acts
on the nAChR, further depolarizing the sarcolemma and possibly exacerbating the effects of
volatile anaesthetics. From Klinger et al., 2014.
Halothane is one of many RyR1 agonists, such as caffeine, Ca2+ and ATP, which act on
RyR1 to facilitate the release of Ca2+ (I. J. Cox, 1996a; Ingwall, 1982; Sapega et al., 1987;
Treves et al., 2005). While healthy individuals will respond to certain levels of these triggers,
MHS individuals are oversensitive to these agonists, meaning their RyR1 have a lower agonist
threshold for the release of Ca2+ (Argov, Löfberg, & Arnold, 2000; O'Sullivan et al., 2001;
Sapega et al., 1987). It is postulated that MHS individuals have this lower threshold due to an
inhibition of RyR1 antagonists, such as Mg2+ (Argov et al., 2000; Steele & Duke, 2007). This
causes RyR1 channels to be in a “pre-active” state, and once exposed to a trigger, causes
oversensitivity (Argov et al., 2000; I. J. Cox, 1996a; Heerschap, Houtman, Zandt, van den Bergh,
& Wieringa, 1999; Mattei, Bendahan, & Cozzone, 2004; Sapega et al., 1987; Treves et al.,
2005). This Mg2+ inhibition was demonstrated in a study by Duke and colleagues (Duke,
Hopkins, Halsal, & Steele, 2004; Iotti et al., 2000). When Malignant Hyperthermia Negative
(MHN) fibers were exposed to reduced levels of Mg2+, their sensitivity to halothane approached
that of MHS fibers. Diaz-Sylvester and colleagues suggest that the MHS phenotype not only
6
depends on increased RyR1 sensitivity, but also on the endogenous modulators such as Mg2+,
ATP and Ca2+ (Diaz-Sylvester et al., 2008; Sahlin, Harris, & Hultman, 1979).
2.1.3 Diagnostic tests
The gold standard for diagnosis of MH is the caffeine halothane contracture test (CHCT)
in North America, or the in vitro contracture test (IVCT) in Europe. Standardization of the
CHCT for MH-susceptibility testing was developed in 1989 by Larach and colleagues (Larach,
1989; Wells et al., 2011). The purpose of the test is to measure the in vitro contractile response
of a muscle when exposed to increasing concentrations of caffeine and halothane. At a certain
contractile threshold, the individual is diagnosed as MHS. The CHCT is both expensive and
invasive, however it remains the gold standard for susceptibility testing, with a sensitivity of
97% and a specificity of 78% (Allen, Larach, & Kunselman, 1998; Olgin, Argov, Rosenberg,
Tuchler, & Chance, 1988; Olgin, Rosenberg, Allen, Seestedt, & Chance, 1991; Payen et al.,
1993).
2.1.4 Treatment
In the event of an MH crisis, the triggering agent must be stopped immediately, and
physicians then hyperventilate the patient and administer dantrolene (Bandschapp & Girard,
2012; Bendahan, Kozak-Ribbens, Rodet, Confort-Gouny, & Cozzone, 1998; Glahn et al., 2010;
Monsieurs et al., 1997; Webster, Thompson, Gravelle, Laschuk, & Driedger, 1990). A hydantoin
derivative (Inan & Wei, 2010; Krause, Gerbershagen, Fiege, Weisshorn, & Wappler, 2004;
Monsieurs et al., 1997; Olgin et al., 1988; 1991), dantrolene is the only known effective
treatment for MH. As an RyR1 antagonist, it binds to the N-terminus of RyR1 (Bendahan et al.,
1998; Paul-Pletzer, 2002; Webster et al., 1990) to decrease the release of Ca2+ from the SR
(Bendahan et al., 1998; Krause et al., 2004; Louis & Mickelson, 1996; Monsieurs et al., 1997;
Webster et al., 1990). Mortality has decreased substantially since the discovery of dantrolene
(Jacobi et al., 2012; Litman & Rosenberg, 2005), however the effectiveness of dantrolene is time
sensitive. Riazi and colleagues demonstrated that when there was a delay of 20 minutes or more
between the first clinical sign and the administration of the drug, there was at least a 30%
increase in complication rates (Jacobi et al., 2012; Jones, Berwick, Hewson-Stoate, Gias, &
Mayhew, 2005; Riazi et al., 2013). Similarly, Larach and colleagues measured a 1.6-fold
7
increase in complication rate for every 30-minute delay in dantrolene administration (Damon,
Wadington, Hornberger, & Lansdown, 2007; Larach et al., 2010; Partovi et al., 2012). Therefore,
proper monitoring and recognition of clinical signs, and promptness of treatment are imperative.
2.1.5 Genetic mutations
Once MacLennan and colleagues mapped the RyR1 gene in 1990 (Caterini et al., 2014;
Jacobi et al., 2012; MacLennan et al., 1990), MH was recognized as an autosomal dominant
disease. However, while over 300 mutations have been identified, only 34 are known disease-
causing mutations (Caterini et al., 2014; Klinger et al., 2014), and much of the genotype remains
a mystery. Most of the genetic mutations are found on three “hot spots” of the RyR1 gene (Avila,
2005; Litman & Rosenberg, 2005; West et al., 2015), however some MH-causing mutations are
found outside of these areas (Sambuughin et al., 2005; Wells, O'Gorman, et al., 2013a). If the
entire RyR1 gene is sequenced, a disease-causing mutation is found in approximately 70% of
MH cases (Larach, 1989; Sambuughin et al., 2005). Some mutations are more common than
others, and vary depending on the population (Brandom et al., 2013; Hay & Cairney, 2006;
Robinson et al., 2006; Sambuughin et al., 2005).
There is also evidence to suggest that some mutations are associated with more severe
phenotypes than others (Robinson et al., 2002; Ruf et al., 2012; Wells et al., 2007). Fiege and
colleagues tested this hypothesis and observed significantly different thresholds and time course
of muscle contracture in response to caffeine, halothane and ryanodine, depending on the RyR1
mutation that was tested (Fiege et al., 2002; Marieb & Hoehn, 2010). Yang and colleagues
suggest that the more severe phenotypes are due to a more “leaky” calcium channel (Wells et al.,
2011; Wells, O'Gorman, et al., 2013a; Yang, 2003), while Robinson and colleagues propose that
phenotype isn’t just confined to one mutation, and that several “modifier” genes could play a role
(Naressi, Couturier, Castang, de Beer, & Graveron-Demilly, n.d.; Robinson et al., 2003). Indeed,
several mutations in the CACNA1S gene, encoding for the DHPR have been linked to MH as
well (Eltit et al., 2012; Zanconato, Buchthal, Barstow, & Cooper, 2002), as have several cases of
homozygous and compound heterozygous RyR1 mutations (Carpenter et al., 2009; Tyler,
Hudsmith, Clarke, Neubauer, & Robson, 2008).
This genotype-phenotype variability is complicated further with the association of central
core disease (CCD). CCD is a myopathy in which individuals lack mitochondria and oxidative
8
enzymes in areas of type I muscle fibers called “cores” (Avila, 2005; Boska, 1994; Robinson et
al., 2006). These individuals are presented with symptoms such as muscle atrophy, and skeletal
deformities and weakness (Iotti et al., 2000; Robinson et al., 2006). CCD is often associated with
MH as it shares the same locus (R. W. Cox, 1996b; Rosenberg & Rueffert, 2011). In fact, almost
everyone who has CCD tests positive for MH according to a muscle contracture test (Jenkinson,
Beckmann, Behrens, Woolrich, & Smith, 2012; McCarthy et al., 2000). Individuals with the
combined MH/CCD genotype have greater muscle contracture responses during a CHCT and
tend to have more severe phenotypes (Jenkinson, Bannister, Brady, & Smith, 2002; Robinson et
al., 2002).
2.2 Functional consequences of MH
2.2.1 “Awake” episodes and musculoskeletal symptoms
Until recently, MH was considered a subclinical disease, as patients appeared healthy
until exposed to volatile anaesthetics during surgery. However, over the past few decades, there
has been a shift in literature as more cases of “awake” MH episodes have been reported. Awake,
or non-anaesthesia induced MH episodes, are when an individual reacts to triggers such as
intense exercise, extreme heat, or even emotional stress. This was first noted in MHS pigs as
“porcine stress syndrome”, as pigs triggered to heat, apprehension and excitement (Golding,
Myers, & Sinning, 1989; Wappler, Fiege, & Schulte, 2001a). Due to the similarity of this disease
between humans and pigs, awake episodes are often referred to as “human stress syndrome”.
In 1980, a man was reported to have recurring fevers triggered by physical or emotional
stress (Gronert et al., 1980; Inbar, Bar-Or, & Skinner, 1996). He tested positive to a combined
caffeine-halothane contracture test and his fevers were significantly improved with dantrolene. A
decade later, two soldiers experienced exertional heat stroke and subsequently tested positive for
halothane during a contracture test (Hopkins et al., 1991; Zupan et al., 2009), while in another
study five out of six patients with recurring rhabdomyolysis had a positive in vitro contracture
test (Bar-Or, 1987; Poels et al., 1991). Despite these cases, it wasn’t until 2001 that there was a
report of an awake incident that occurred in a patient who had a previous fulminant reaction
during anaesthesia (Sayers, Harackiewicz, Harman, Frykman, & Rosenstein, 1999; Tobin et al.,
9
2001), confirming the association between awake cases and MH. Since then, there has been a
strong focus on the association between exertional rhabdomyolysis (ER) and MH.
ER is a potentially fatal occurrence in which very strenuous exercise can damage the
muscle to the point of degeneration (Capacchione et al., 2009; Wells, Elmi, & Thomas, 2009a;
Wells, Wilkes, et al., 2013b). Since rhabdomyolysis can present itself during a fulminant MH
reaction, it has been speculated that the pathophysiology of these two maladies are related. To
test this theory, Wappler and colleagues tested 12 patients with a history of exercise-induced
rhabdomyolysis (Iotti et al., 2000; Wappler, Fiege, Steinfath, Agarwal, et al., 2001b). The
researchers discovered that 10 out of the 12 patients tested positive for MH according to an in
vitro contracture test. Similarly, Dlamini and colleagues identified five known MH-causing
RyR1 mutations in 39 families with a history of rhabdomyolysis and exertional myalgia
(Dlamini et al., 2013; Iotti et al., 2000).
MH-suspicious reactions to extreme heat have also been reported. A healthy 6-year-old
boy died after developing symptoms of MH while playing in a splash pool on a hot day (Lavezzi
et al., 2013; Newcomer & Boska, 1997). Later, he was found to have a RyR1 mutation and his
father had a positive contracture test. In another case, a 2-year old child was left in a car for 5
hours in over 40 degree weather (Caterini et al., 2014; Nishio et al., 2009). The child was
diagnosed of dying of heat stroke, however a compound heterozygous mutation was identified
following her death. Similar to ER, there is a definite association between heat stroke and MH.
Indeed, there are several reports in which individuals with heat stroke tested positive for MH
according to standardized testing (either CHCT or IVCT) (Figarella-Branger et al., 1993; Groom
et al., 2011; Tobin, Jason, Chalia, Nelson, & Sambuughin, 2001), and it is possible that many
cases of apparent heat stroke have been misdiagnosed in the past.
In addition to these non-anaesthesia induced MH-like reactions, there is a subset of MHS
individuals who experience symptoms such as muscle pain, weakness, and cramping regularly in
the absence of triggered anesthetics. In a study of 129 survivors of fulminant anaesthetic
episodes, 11% of the patients reported muscle symptoms prior to the adverse reaction (Riazi et
al., 2013; West et al., 2015). The 6-year-old who died of an MH reaction while playing outside
on a hot day had a history of persistent leg pain (Lavezzi et al., 2013; Newcomer & Boska,
1997). Wappler and colleagues report a case of a 34-year-old man who had muscle cramping and
aching following mild exercise or emotional stress, which worsened over time (Wappler et al.,

10
2000; Wells, Selvadurai, & Tein, 2009b). High serum creatine kinase (CK) is a common clinical
sign during an MH reaction (Riazi et al., 2013; Sagui et al., 2014), due to muscle damage and
rhabdomyolysis. However, chronic elevation of CK in the absence of a fulminant episode has
been documented in MHS individuals as well (Argov et al., 2000; Bandschapp & Girard, 2012;
Mattei et al., 2004; Weglinski et al., 1997). Weglinski and colleagues studied 49 individuals who
had persistently high serum CK levels but no apparent neurologic or muscular disorder (Sahlin et
al., 1979; Weglinski et al., 1997). Twenty-four out of the 49 patients tested positive for MHS
according to an in vitro contracture test, and of those, fourteen had a history of muscle pain and
cramping. Similarly, Timmins and colleagues tested 136 patients who were referred to a clinic
for high CK levels, exercise-induced rhabdomyolysis, exercise intolerance, muscle weakness and
chronic fatigue (Timmins et al., 2015; Wells et al., 2011). Eighty-seven of the 136 patients tested
positive for MH, according to the CHCT.
2.2.2 Mitochondrial damage
Several researchers have investigated the pathophysiology that might lead to these non-
anaesthesia related incidents. During an MH episode when there is a rapid increase in cytosolic
Ca2+, mitochondria rapidly take up this excess Ca2+ (Inan & Wei, 2010; Monsieurs et al., 1997;
Olgin et al., 1988; 1991; Raturi & Simmen, 2013). However, it has been suggested that even in
the absence of an MH episode, there is an increase in cytosolic, and therefore mitochondrial,
Ca2+ in these individuals due to a “leaky” RyR1. Indeed, Giulivi and colleagues measured a 5.7-
fold greater concentration of mitochondrial Ca2+ in RyR1 mutated mice compared to wild-type
(wt) mice (Giulivi et al., 2010; Sahlin et al., 1979). This mitochondrial Ca2+ overload was
associated with a decrease in mitochondrial mass and impaired metabolism. Specifically, there
was a decrease in oxygen uptake, greater mitochondrial uncoupling and lower activation of
Complex I, III and IV in MH-mutated mitochondria compared to wt mice. There was also
significantly greater production of ROS from Complex III in MH-mutated mice compared to wt
mice. This resulted in 39% lower oxidative phosphorylation ATP production in these mice
(Giulivi et al., 2010; Mitchelson & Hird, 1973).
Taking these results into consideration, it has since been hypothesized that there is
mitochondrial damage in MH patients, which stems from the dysregulation of Ca2+. This
mitochondrial dysfunction might explain the musculoskeletal symptoms and exercise intolerance
11
present in some MHS individuals. However, it remains unclear why only some individuals
experience these functional impairments, and limited studies have assessed skeletal muscle
metabolism in this population.
2.3 Measures to assess skeletal muscle metabolism
2.3.1 31P-magnetic resonance spectroscopy
Magnetic resonance spectroscopy (MRS) is an in vivo technique that exploits the
magnetic properties of atomic nuclei to make inferences regarding the metabolic composition of
a tissue (I. J. Cox, 1996a; Radda, 1986; Sapega et al., 1987; Wells et al., 2008). By probing these
nuclei with a pulse of radio frequency energy, the nuclei absorb energy as they enter an “excited”
state (Bendahan et al., 2001; I. J. Cox, 1996a; Sapega et al., 1987). The nuclei within different
molecules will then emit this energy at different resonance frequencies as they return back to
their resting state and it is this magnetic resonance absorption that is detected by MRS (I. J. Cox,
1996a; Sapega et al., 1987; Webster et al., 1990). Using a calculation known as a Fourier
transformation, the different metabolites can then appear as a frequency spectrum and the area
under each peak is calculated to determine its relative concentration for that tissue (I. J. Cox,
1996a; Ingwall, 1982; Sapega et al., 1987; van den Broek, De Feyter, Graaf, Nicolay, &
Prompers, 2007). 31Phosphorous magnetic resonance spectroscopy (31P-MRS) is a useful method of
assessing muscle metabolism due to the important phosphate-containing compounds involved in
energy metabolism (Argov et al., 2000; Arnold, Matthews, & Radda, 1984; Roussel, Bendahan,
Mattei, Le Fur, & Cozzone, 2000; Sapega et al., 1987). In order to be MR-visible, the
phosphorous-containing compounds must have a high enough concentration to produce an
adequate signal-to-noise ratio (Argov et al., 2000; Newcomer & Boska, 1997). Resonances that
are consistently detected with MR are phosphocreatine (PCr), inorganic phosphate (Pi) and the
three phosphate groups (gamma γ; alpha α; and beta β) in adenine triphosphate (ATP) (Argov et
al., 2000; I. J. Cox, 1996a; Heerschap et al., 1999; Mattei et al., 2004; Newcomer & Boska,
1997; Sapega et al., 1987). It is also possible to measure changes in pH and Mg2+ during exercise
through shifts in the resonance frequencies of Pi and β –ATP (Bendahan et al., 2001; Iotti et al.,
2000; Monsieurs et al., 1997; Webster et al., 1990). As the cellular environment becomes more
12
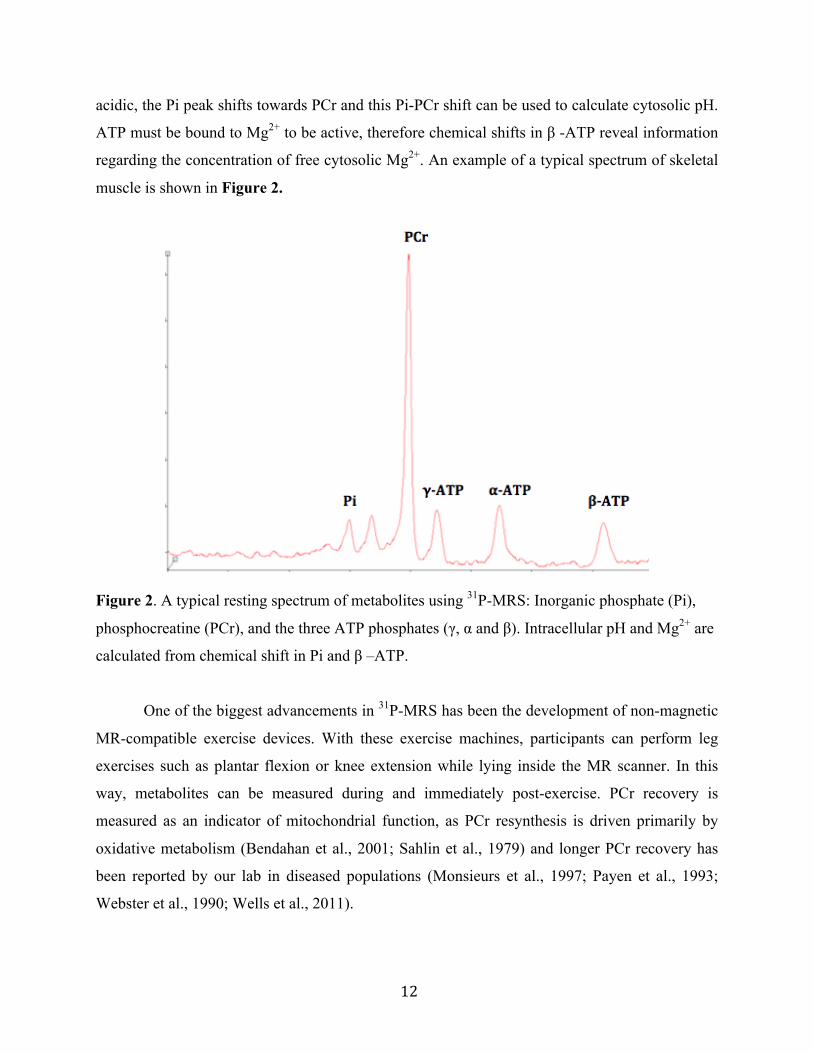
acidic, the Pi peak shifts towards PCr and this Pi-PCr shift can be used to calculate cytosolic pH.
ATP must be bound to Mg2+ to be active, therefore chemical shifts in β -ATP reveal information
regarding the concentration of free cytosolic Mg2+. An example of a typical spectrum of skeletal
muscle is shown in Figure 2.
Figure 2. A typical resting spectrum of metabolites using 31P-MRS: Inorganic phosphate (Pi),
phosphocreatine (PCr), and the three ATP phosphates (γ, α and β). Intracellular pH and Mg2+ are
calculated from chemical shift in Pi and β –ATP.
One of the biggest advancements in 31P-MRS has been the development of non-magnetic
MR-compatible exercise devices. With these exercise machines, participants can perform leg
exercises such as plantar flexion or knee extension while lying inside the MR scanner. In this
way, metabolites can be measured during and immediately post-exercise. PCr recovery is
measured as an indicator of mitochondrial function, as PCr resynthesis is driven primarily by
oxidative metabolism (Bendahan et al., 2001; Sahlin et al., 1979) and longer PCr recovery has
been reported by our lab in diseased populations (Monsieurs et al., 1997; Payen et al., 1993;
Webster et al., 1990; Wells et al., 2011).
13
There have been very few studies that have used 31P-MRS to study muscle metabolism in
MHS and results are equivocal. While some researchers observed higher Pi:PCr ratio at rest in
MHS patients versus controls, an indication of greater metabolic stress, (Olgin et al., 1988; 1991;
Payen et al., 1993; Steele & Duke, 2007), other researchers did not (Bendahan et al., 1998;
Monsieurs et al., 1997; Treves et al., 2005; Webster et al., 1990). Similarly, some studies showed
slower PCr recovery in MHS patients, an indication of impaired oxidative metabolism
(Monsieurs et al., 1997; O'Sullivan et al., 2001; Olgin et al., 1988; 1991), whereas other
researchers measured no impairment (Bendahan et al., 1998; Steele & Duke, 2007; Webster et
al., 1990). A consistent finding was a significantly greater decrease in pH during exercise
(Bendahan et al., 1998; Monsieurs et al., 1997; Treves et al., 2005; Webster et al., 1990), an
indication that MHS patients are relying more on anaerobic glycolysis, possibly as a result of
impaired mitochondrial dysfunction.
With the use of magnetic resonance spectroscopy in conjunction with leg-extension
exercise, a better understanding of skeletal muscle metabolism in MHS patients using 31P-MRS
can be elucidated. As the pathophysiology of Malignant Hyperthermia is not well understand,
using this technique to study skeletal muscle in vivo is a viable option.
2.3.2 Blood oxygen-level dependent functional magnetic resonance imaging
Blood oxygen-level dependent functional magnetic resonance imaging (BOLD fMRI) is a
type of functional neuroimaging that was originally developed to assess changes in neuronal
activation by measuring changes in blood flow. While oxyhaemoglobin is diamagnetic,
deoxyhaemoglobin is paramagnetic (Bendahan et al., 2001; Jacobi et al., 2012; Monsieurs et al.,
1997; Webster et al., 1990). Therefore, changes in the ratio of deoxy and oxyhaemoglobin during
neuronal activity can be detected by changes in magnetization (Caterini et al., 2014; Jacobi et al.,
2012; Jones et al., 2005; Partovi et al., 2012). This increase in magnetization (or BOLD signal)
represents the local increase in blood flow during neuronal activation.
More recently, BOLD fMRI has been used to assess tissue perfusion in skeletal muscle.
Using the same principle as brain fMRI, changes in muscle oxygenation can be detected by the
changes in the ratio of deoxy- to oxyhaemoglobin. One way to elicit changes in muscle
oxygenation is through exercise. The accumulation of metabolites during exercise elicits a local
14
increase in muscle blood flow due to vasodilation of microvessels (Damon et al., 2007; Jacobi et
al., 2012; Jones et al., 2005; Partovi et al., 2012).
Using BOLD fMRI to assess skeletal muscle hemodynamics following exercise is useful
in assessing potential perfusion deficiency in individuals with chronic disease (Caterini et al.,
2014; Jacobi et al., 2012). A sigmoidal equation to characterize post-exercise BOLD signal
recovery was recently developed by our group (Caterini et al., 2014; Frostig, 2009; McGrath et
al., 2008) and has been used to assess microvascular perfusion in girls with Turner Syndrome
(Damon et al., 2007; Partovi et al., 2012; West et al., 2015).
To our knowledge, there have been no previous studies that have used BOLD fMRI to
study skeletal muscle oxygenation following exercise in MHS patients. This method was used to
assess if the differences that might be observed in skeletal muscle metabolism are due to
differences in oxygen delivery, as opposed to utilization.
2.4 Summary
2.4.1 Gap in literature
Some individuals who experience MH-like reactions (exercise- or heat-induced) test
positive for MH, according to standardized testing. However, the pathophysiology of MH-like
reactions remains unclear and no study has assessed the metabolic and functional differences
between MH susceptible patients (MHS) and those susceptible to MH-like reactions (MHS-L).
Similarly, some MH-positive individuals experience persistent symptoms such as muscle
pain, weakness, and cramping in the absence of a fulminant MH episode. While different RyR1
mutants, modifier genes and endogenous agonists might explain the variability in the progression
and severity of symptoms between individuals, it remains unclear why only some individuals
suffer from these impairments, and if there are any metabolic similarities between MHS patients
with persistent musculoskeletal symptoms and MHS-L patients.
2.4.2 Purpose
The purpose of this study was to assess skeletal muscle metabolism in patients tested
positive for MH, to better understand the pathophysiological mechanisms that can lead to
15
function impairments and exercise intolerance. To test this 31Phosphorous magnetic resonance
spectroscopy (31P-MRS) and blood oxygen level-dependent (BOLD) fMRI were used to measure
skeletal muscle metabolism in vivo, and functional performance was assessed using standardized
exercise tests.
2.4.3 Research questions
1) Are there detectable differences in skeletal muscle metabolism, as measured in vivo and
as functional exercise performance, between patients tested positive for MH and healthy
controls?
2) Do MH patients with persistent muscle symptoms differ from MH patients without
symptoms, as measured by skeletal muscle metabolism in vivo and functional exercise
performance?
3) Do patients with a history of MH-like reactions who tested positive for MH (MHS-L)
differ from MH-susceptible (MHS) patients who had a previous reaction under
anaesthesia, as measured by skeletal muscle metabolism in vivo and functional exercise
performance?
2.4.4 Hypotheses
1) MH patients have impaired skeletal muscle metabolism as measured in vivo, which is
accompanied by functional muscle impairments and exercise intolerance.
2) Dysfunctional metabolism and functional impairments are more severe in the MH
patients who experience persistent musculoskeletal symptoms.
3) MHS-L patients have a similar metabolic and functional impairment as MHS who suffer
from persistent musculoskeletal symptoms.
16
CHAPTER 3: METHODS
3.1 Experimental design
A cross-sectional observational research design was used to compare measures between
different experimental groups. There were three main parts to the study (based on the three
research questions listed in section 2.4.3):
Part I: Comparison of healthy controls (HC) to MH group
Part II: Comparison of HC to MH patients with and without muscle symptoms
Part III: Comparison of HC to MHS and MHS-L patients
The study involved a single 4-hour visit at the Hospital for Sick Children that was
divided into two main parts:
1) Magnetic resonance imaging and spectroscopy to assess muscle bioenergetics and blood-
oxygen haemodynamics during leg-extension exercise; and
2) Physical testing to assess aerobic capacity, anaerobic capacity, and muscle strength.
The study was performed in the following order (Table 1) to be as time efficient as
possible while still allowing the participants to recover between each exercise. Each participant
performed the magnetic resonance imaging and spectroscopy first. After an hour break,
participants completed a submaximal endurance bike test (YMCA), upper and lower body
strength tests, and a maximal sprint bike test (Wingate Anaerobic Test). A physical activity
questionnaire [the Habitual Activity Estimation Scale (HAES)] was also administered following
the endurance bike test, as participants needed time to rest before the strength and sprint bike
tests.
17
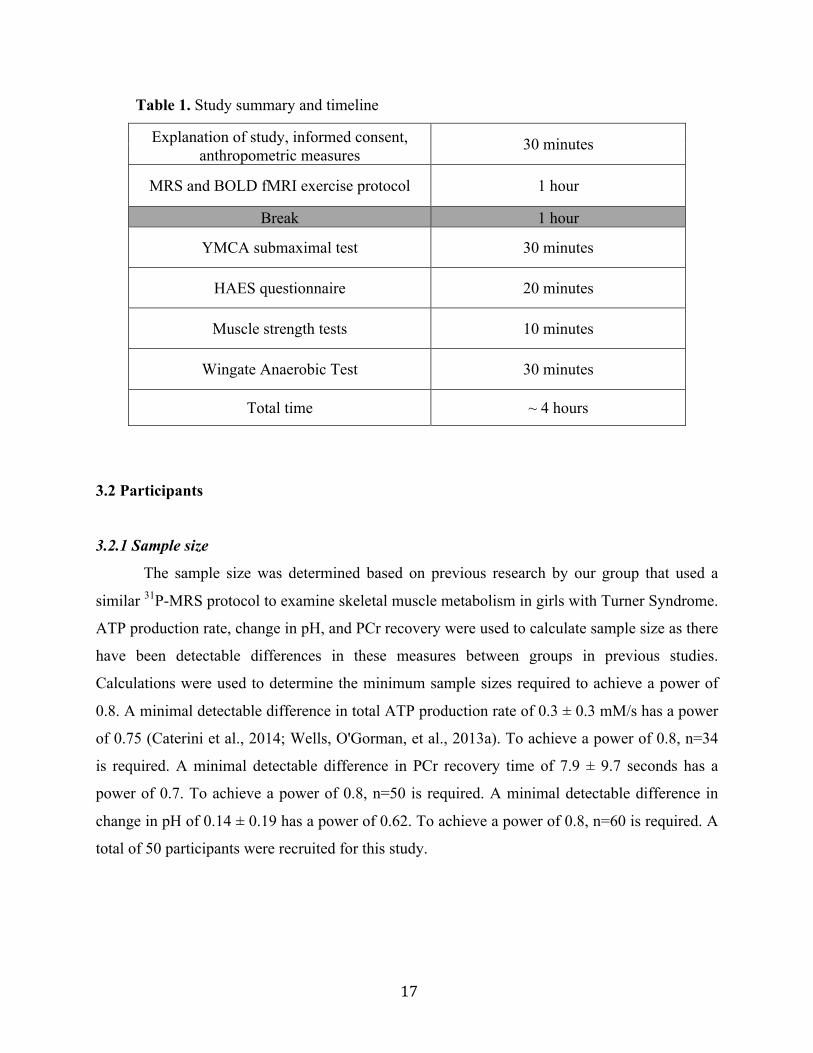
Table 1. Study summary and timeline
Explanation of study, informed consent, anthropometric measures
30 minutes
MRS and BOLD fMRI exercise protocol 1 hour
Break 1 hour
YMCA submaximal test 30 minutes
HAES questionnaire 20 minutes
Muscle strength tests 10 minutes
Wingate Anaerobic Test 30 minutes
Total time ~ 4 hours
3.2 Participants
3.2.1 Sample size
The sample size was determined based on previous research by our group that used a
similar 31P-MRS protocol to examine skeletal muscle metabolism in girls with Turner Syndrome.
ATP production rate, change in pH, and PCr recovery were used to calculate sample size as there
have been detectable differences in these measures between groups in previous studies.
Calculations were used to determine the minimum sample sizes required to achieve a power of
0.8. A minimal detectable difference in total ATP production rate of 0.3 ± 0.3 mM/s has a power
of 0.75 (Caterini et al., 2014; Wells, O'Gorman, et al., 2013a). To achieve a power of 0.8, n=34
is required. A minimal detectable difference in PCr recovery time of 7.9 ± 9.7 seconds has a
power of 0.7. To achieve a power of 0.8, n=50 is required. A minimal detectable difference in
change in pH of 0.14 ± 0.19 has a power of 0.62. To achieve a power of 0.8, n=60 is required. A
total of 50 participants were recruited for this study.
18
3.2.2. Participant recruitment
Patients were recruited directly by Dr. Riazi, director of the Malignant Hyperthermia
Investigation Unit (MHIU) at Toronto General Hospital. Individuals were referred to this clinic
either because they experienced an MH-suspected reaction or because they have family members
who are MH-susceptible. All participants recruited had already tested positive for MH, according
to the North American caffeine-halothane contracture test (Caterini et al., 2014; Jacobi et al.,
2012; Jones et al., 2005; Larach, 1989; Partovi et al., 2012). To eliminate the association with
other morbidities, only MH patients with no neurologic or other muscular disorder were
recruited.
The healthy controls were recruited from around University of Toronto and the
surrounding community. Individuals were sent an introductory letter, inviting them to participate
in the research study.
3.2.3 Consent and patient screening
Dr. Riazi screened all of the MH patients prior to recruitment, verifying that they did not
have a predisposing medical condition that deemed them unsafe to participate in the study. All of
the participants completed a Physical Activity Readiness Questionnaire (PAR-Q) (Appendix 1)
prior to testing to ensure that they were safe to perform physical activity. Participants were
informed of the risks and benefits associated with this study and signed an informed consent,
approved by the institutional research boards of The Hospital for Sick Children and the
University Health Network (Appendix 2 & 3).
3.2.4 Inclusion criteria
MH patients and healthy individuals were invited to participate if they were between the
ages of 18 and 65 years old and were able to tolerate moderate to hard exercise. MH patients
must have also tested positive according to the caffeine halothane contracture test.
3.2.5 Exclusion criteria
Individuals were excluded if they were deemed unsafe to perform physical activity, had
any neurological or muscular disease besides MH, had a history of cardiac problems, were taking
19
anti-cholesterol medication, or had any metal implants or devices that are not MR-compatible.
The complete list of exclusion criteria is shown in the data collection sheet (Appendix 4).
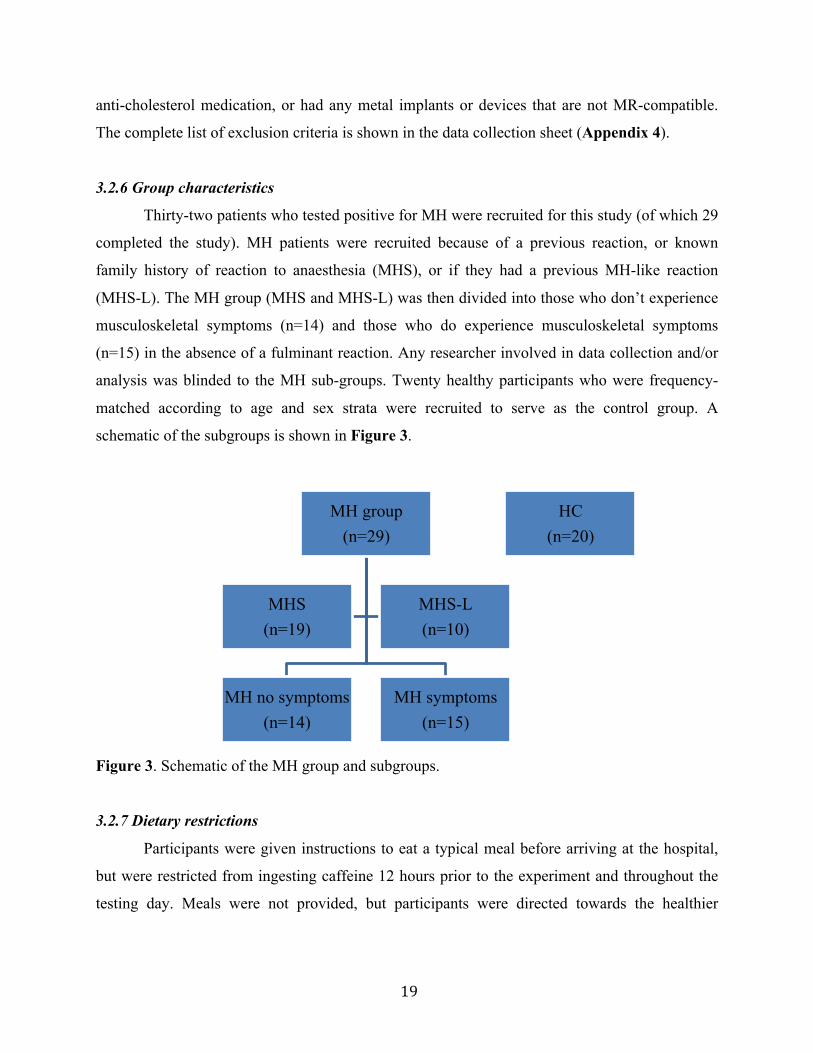
3.2.6 Group characteristics
Thirty-two patients who tested positive for MH were recruited for this study (of which 29
completed the study). MH patients were recruited because of a previous reaction, or known
family history of reaction to anaesthesia (MHS), or if they had a previous MH-like reaction
(MHS-L). The MH group (MHS and MHS-L) was then divided into those who don’t experience
musculoskeletal symptoms (n=14) and those who do experience musculoskeletal symptoms
(n=15) in the absence of a fulminant reaction. Any researcher involved in data collection and/or
analysis was blinded to the MH sub-groups. Twenty healthy participants who were frequency-
matched according to age and sex strata were recruited to serve as the control group. A
schematic of the subgroups is shown in Figure 3.
Figure 3. Schematic of the MH group and subgroups.
3.2.7 Dietary restrictions
Participants were given instructions to eat a typical meal before arriving at the hospital,
but were restricted from ingesting caffeine 12 hours prior to the experiment and throughout the
testing day. Meals were not provided, but participants were directed towards the healthier
MH group (n=29)
MH no symptoms (n=14)
MH symptoms (n=15)
MHS (n=19)
MHS-L (n=10)
HC (n=20)
20
options available at the hospital after they had completed the MRI portion of the experiment. All
food and drink ingested on the day of study was recorded.
3.3 Measures of assessment
3.3.1 Anthropometric measures and physical activity questionnaire
Height and weight were measured by a wall-mounted stadiometer (Scale-Tronix) and a
bariatric scale (Scale-Tronix, 5122, Low-Profile, Stand-on Scale), and age was recorded. The
Habitual Activity Estimation Scale (HAES) was administered to assess physical activity level.
This questionnaire is used to estimate hours spent “inactive”, “somewhat inactive”, “somewhat
active” and “very active” during a typical weekday and weekend (Damon et al., 2007; Hay &
Cairney, 2006; Towse, 2005) (Appendix 5). “Inactive” is defined as time spent lying down (e.g.
napping), “somewhat inactive” is defined as time spent sitting (e.g. watching television),
“somewhat active” is defined as time spent standing or walking (e.g. household chores), and
“very active” is defined as any activity in which someone is sweating or breathing hard (e.g.
running). This questionnaire has been validated in children and adults with Cystic Fibrosis
(Damon et al., 2007; Jacobi et al., 2012; Ruf et al., 2012; Towse, 2005; Wells et al., 2007).
3.3.2 Magnetic resonance imaging and spectroscopy
All magnetic resonance imaging and spectroscopy were collected on a Tim® SIEMONS
MAGNETOM TrioTM Vb17 3 Tesla imaging and spectroscopy system (Siemens AG, Medical
Solutions, Erlangen, Germany) at The Hospital for Sick Children. Anatomical images were
acquired, followed by 31P-MRS and BOLD fMRI sequences. T1-weighted anatomical images
were acquired axially from the mid-quadriceps region (spin echo sequence, 10 slices, 5 mm
thick, FOV 220 mm, TE/TR 16/600 ms, 150° flip angle, total acquisition time = 2 minutes). 31P-
MRS spectra were obtained under partially saturated conditions with the following parameters:
spin-echo sequence, 0.25 ms pulse duration, 40° flip angle, TE/TR 0.225/1000 ms, 10
measurements, (total acquisition time = 8 seconds per spectrum). T2*-weighted BOLD images
were obtained using a gradient echo sequence (1 slice, slice thickness 10 mm, FOV 250 mm,
TE/TR 20/250 ms, 90° flip angle, 2400 temporal points, total scan duration = 10 min).
21
3.3.2.1 31Phosphorous magnetic resonance spectroscopy
Exercise protocol
A 31P/1H surface RAPID biomedical coil (31P loop coil mean diameter = 110mm, surface
penetration depth = 55mm) was placed on the thigh to obtain 31P-MRS spectra in the vastus
lateralis muscle. Patients lay supine in the magnet. Following resting measurements, patients
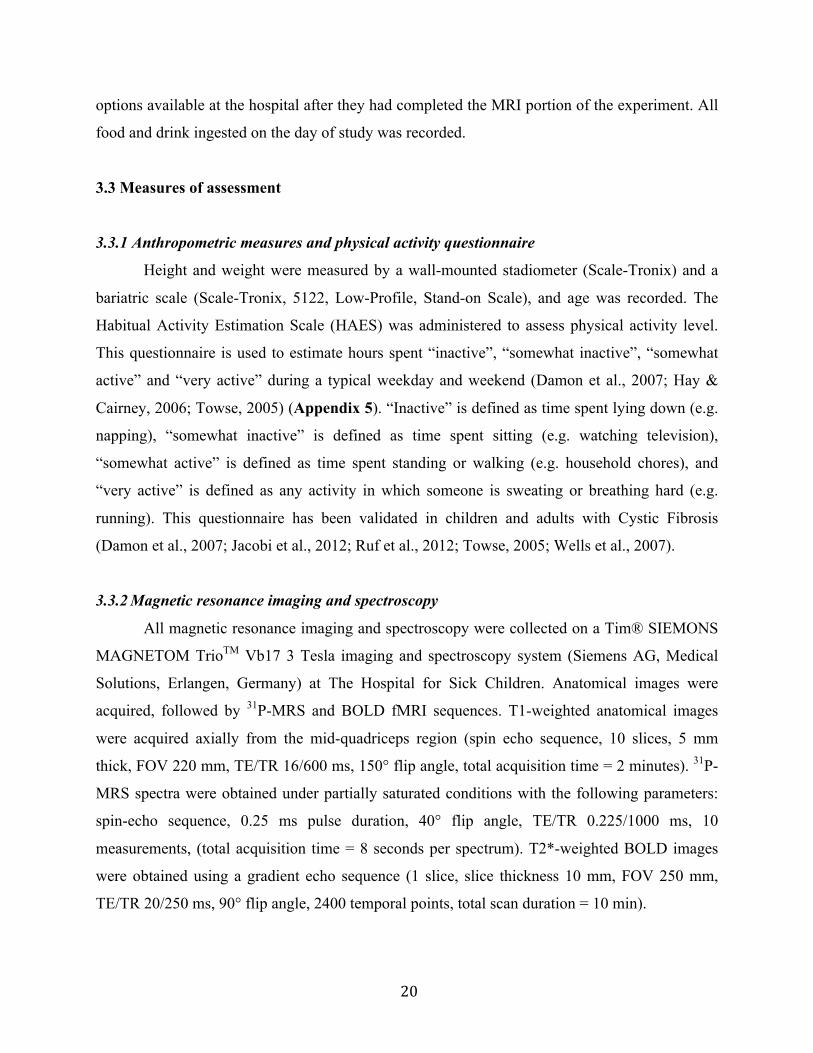
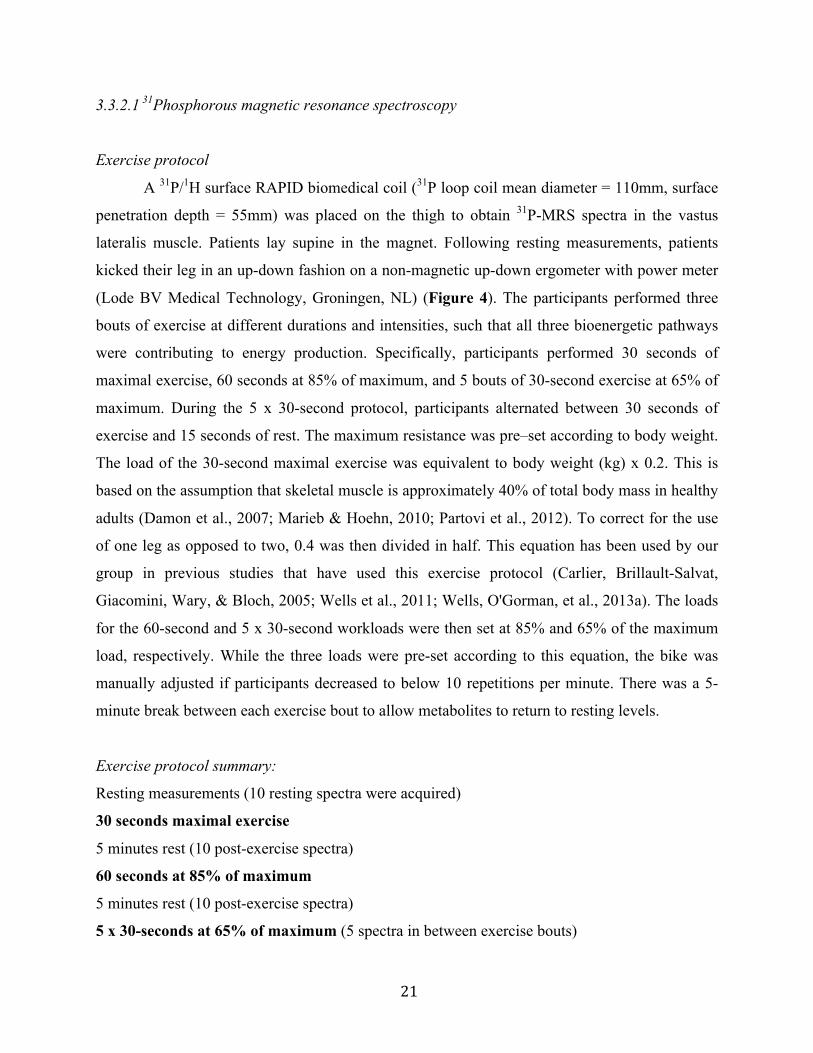
kicked their leg in an up-down fashion on a non-magnetic up-down ergometer with power meter
(Lode BV Medical Technology, Groningen, NL) (Figure 4). The participants performed three
bouts of exercise at different durations and intensities, such that all three bioenergetic pathways
were contributing to energy production. Specifically, participants performed 30 seconds of
maximal exercise, 60 seconds at 85% of maximum, and 5 bouts of 30-second exercise at 65% of
maximum. During the 5 x 30-second protocol, participants alternated between 30 seconds of
exercise and 15 seconds of rest. The maximum resistance was pre–set according to body weight.
The load of the 30-second maximal exercise was equivalent to body weight (kg) x 0.2. This is
based on the assumption that skeletal muscle is approximately 40% of total body mass in healthy
adults (Damon et al., 2007; Marieb & Hoehn, 2010; Partovi et al., 2012). To correct for the use
of one leg as opposed to two, 0.4 was then divided in half. This equation has been used by our
group in previous studies that have used this exercise protocol (Carlier, Brillault-Salvat,
Giacomini, Wary, & Bloch, 2005; Wells et al., 2011; Wells, O'Gorman, et al., 2013a). The loads
for the 60-second and 5 x 30-second workloads were then set at 85% and 65% of the maximum
load, respectively. While the three loads were pre-set according to this equation, the bike was
manually adjusted if participants decreased to below 10 repetitions per minute. There was a 5-
minute break between each exercise bout to allow metabolites to return to resting levels.
Exercise protocol summary:
Resting measurements (10 resting spectra were acquired)
30 seconds maximal exercise
5 minutes rest (10 post-exercise spectra)
60 seconds at 85% of maximum
5 minutes rest (10 post-exercise spectra)
5 x 30-seconds at 65% of maximum (5 spectra in between exercise bouts)
22
5 minutes rest (10 post-exercise spectra)
Figure 4. 3 Tesla imaging and spectroscopy system at The Hospital for Sick Children.
Participants had their leg strapped to an up-down ergometer such that they could exercise while
in the scanner.
Data analysis
Spectral analysis was performed using java-based magnetic resonance user interface
(jMRUI) (v. 4.0) (Naressi et al., n.d.; Wells, Selvadurai, & Tein, 2009b). Fourier transformation
was performed to acquire a frequency spectrum of the magnetic resonance signal. In order to see
visible peaks, the data were processed using functions of the jMRUI program to improve signal
to noise ratio. Areas under Pi, PCr, and β –ATP were calculated with an AMARES (advanced
method of accurate, robust and efficient spectroscopic fitting) algorithm, according to the
parameters of Lorentzian line shapes (Golding et al., 1989; Zanconato et al., 2002) and from
prior knowledge of metabolite peaks from the University of Oxford (Astrand & Ryhming, 1954;
Tyler et al., 2008). The concentrations of each peak was normalized to 41.3 mmol, the total sum
of muscle phosphate (Beekley et al., 2004; Boska, 1994). Changes in intracellular [Mg2+] and pH

23
during exercise were calculated from the chemical shift of β-ATP with respect to PCr and Pi with
respect to PCr, respectively (Beekley et al., 2004; Iotti et al., 2000).
3.3.2.2 Blood oxygen level-dependent fMRI
Exercise protocol
Following 31P-MRS data acquisition, participants remained in the MRI to undergo blood
oxygen level-dependent functional magnetic resonance imaging (BOLD fMRI). Participants had
a transmit-receive coil placed on their mid thigh for signal acquisition. Measures were taken
before and after three 1-minute bouts of exercise separated by two minutes of rest, using the
same up-down ergometer used during the 31P-MRS protocol.
Exercise protocol summary:
1 min exercise at 65% of maximum
2 minutes rest (BOLD data collection)
1 min exercise at 65% of maximum
2 minutes rest (BOLD data collection)
1 min exercise at 65% of maximum
2 minutes rest (BOLD data collection)
See Appendix 6 for the data collection checklist for the MRS and BOLD protocol.
Data analysis
Data were analyzed with Analysis of Functional Neuroimages (AFNI) software (Beekley
et al., 2004; R. W. Cox, 1996b; Fitchett, 1985) and the FMRIB Software Library (FSL) (Beekley
et al., 2004; Jenkinson et al., 2012). Blood vessels were masked using FSL and then the BOLD
images were motion corrected with the MCFLIRT script (Brooks, 2000; Jenkinson et al., 2002).
The motion corrected BOLD images were reopened in AFNI and regions of interest were drawn
in the vastus lateralis muscle. The BOLD signal during recovery was analyzed according to the
parameters of the Levenburg-Marquardt algorithm, using a curve-fitting program in MATLAB
24
(The Mathworks, Inc.). Inferences regarding muscle oxygenation were based on the parameters
of the recovery curve.
3.3.3 Functional performance measures
Standard laboratory measures of functional performance were used to assess possible
functional impairments and exercise intolerance that accompanies this disease. The data
collection sheet used for these measures is in Appendix 7.
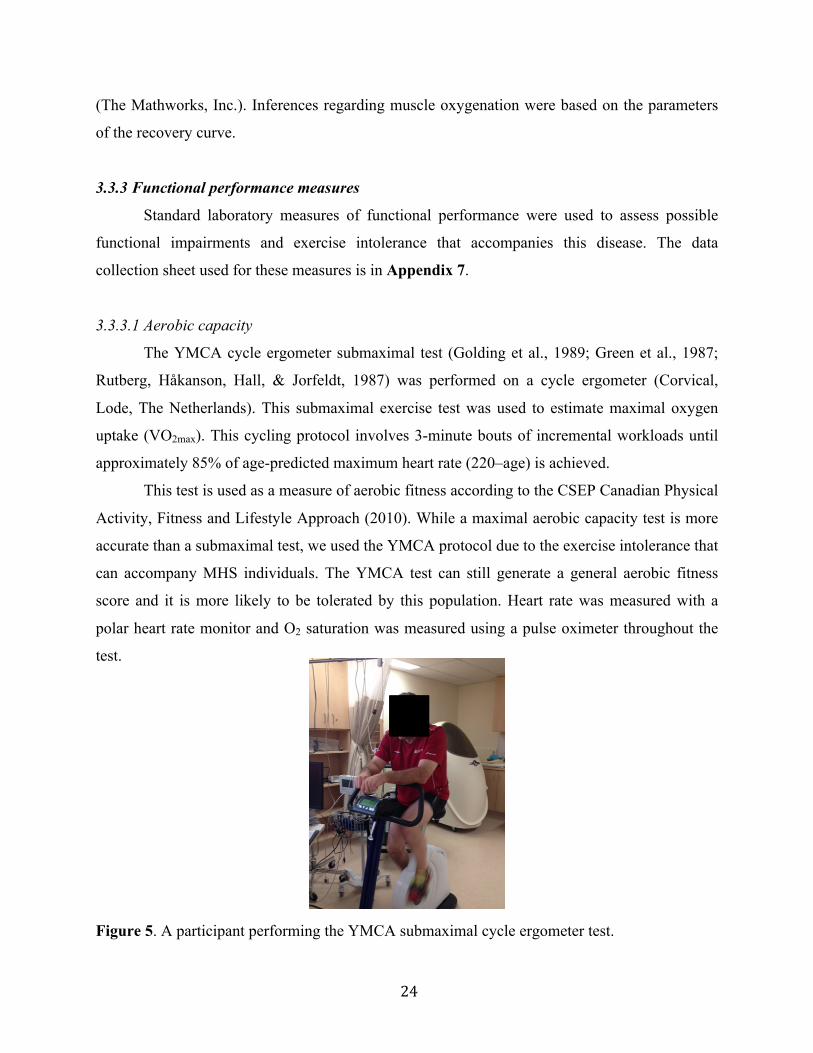
3.3.3.1 Aerobic capacity
The YMCA cycle ergometer submaximal test (Golding et al., 1989; Green et al., 1987;
Rutberg, Håkanson, Hall, & Jorfeldt, 1987) was performed on a cycle ergometer (Corvical,
Lode, The Netherlands). This submaximal exercise test was used to estimate maximal oxygen
uptake (VO2max). This cycling protocol involves 3-minute bouts of incremental workloads until
approximately 85% of age-predicted maximum heart rate (220–age) is achieved.
This test is used as a measure of aerobic fitness according to the CSEP Canadian Physical
Activity, Fitness and Lifestyle Approach (2010). While a maximal aerobic capacity test is more
accurate than a submaximal test, we used the YMCA protocol due to the exercise intolerance that
can accompany MHS individuals. The YMCA test can still generate a general aerobic fitness
score and it is more likely to be tolerated by this population. Heart rate was measured with a
polar heart rate monitor and O2 saturation was measured using a pulse oximeter throughout the
test.
Figure 5. A participant performing the YMCA submaximal cycle ergometer test.
25
3.3.3.2 Anaerobic capacity
Anaerobic capacity was assessed using the Wingate Anaerobic Test (WAnT) (Green et
al., 1987; Inbar et al., 1996) on a cycle ergometer (Ergomedic 849E, Monark, Sweden).
Participants performed a standardized warm-up. The first portion of the warm-up consisted of 3
minutes of cycling at 20% of their pre-determined load they used during the test, at around 50-60
rpm. The second portion of the warm-up involved sprints in which they cycled at maximum
pedaling speed for 10 seconds (5 seconds without resistance and 5 seconds at 20% of their
testing load), followed by 50 seconds of easy pedaling. These sprints were repeated three times.
The purpose of these 5-second sprints was to recruit motor units without causing fatigue. This
warm-up is similar to the warm-up used to develop classification values for National Collegiate
Athletic Association (NCAA) Division I athletes (Rutberg et al., 1987; Zupan et al., 2009).
Following the warm-up, participants were given five minutes to recover and prepare for
the test. During the test, the participants were instructed to cycle as fast as possible with zero
resistance on the bike. As soon as the participant reached maximum pedaling speed, determined
during warm-up, the weight basket automatically dropped and the participant biked as hard as
they could for 30 seconds. Load was set at 8% of body weight in kilograms. This is an estimate
of optimal load for an adult population that is recreationally active, based on recommendations
by Bar-Or and colleagues (Bar-Or, 1987; Christou & Seals, 2008).
3.3.3.3 Lower body strength and power
To assess lower body strength and power, the vertical jump test was performed using a
vertical measuring device (Vertec, Sports Imports, Hilliard, OH). Participants stood directly
parallel to the device with their feet together. Keeping their feet flat on the floor they reached up
as far up as possible to determine the height of their standard reach. Participants then performed
a countermovement jump by squatting and then jumping in one fluid motion. Participants were
allowed to swing their arms for momentum but were not allowed to take any steps prior to
jumping. As they jumped, they reached up as far as possible with their arm and vertical height
was recorded as the difference between their maximal jump height and standard reach in
centimeters. Participants repeated the vertical jump test until they were unable to improve their
jump height. Sayers Peak Power was calculated as a measure of lower body power. The
26
equation, developed by Sayers and colleagues (Sayers et al., 1999; Wappler et al., 2000), is used
to correct for differences in jump height due to body mass:
Peak Power (W) = (60.7) × (jump height [cm]) + 45.3 × (body mass [kg]) – 2055.
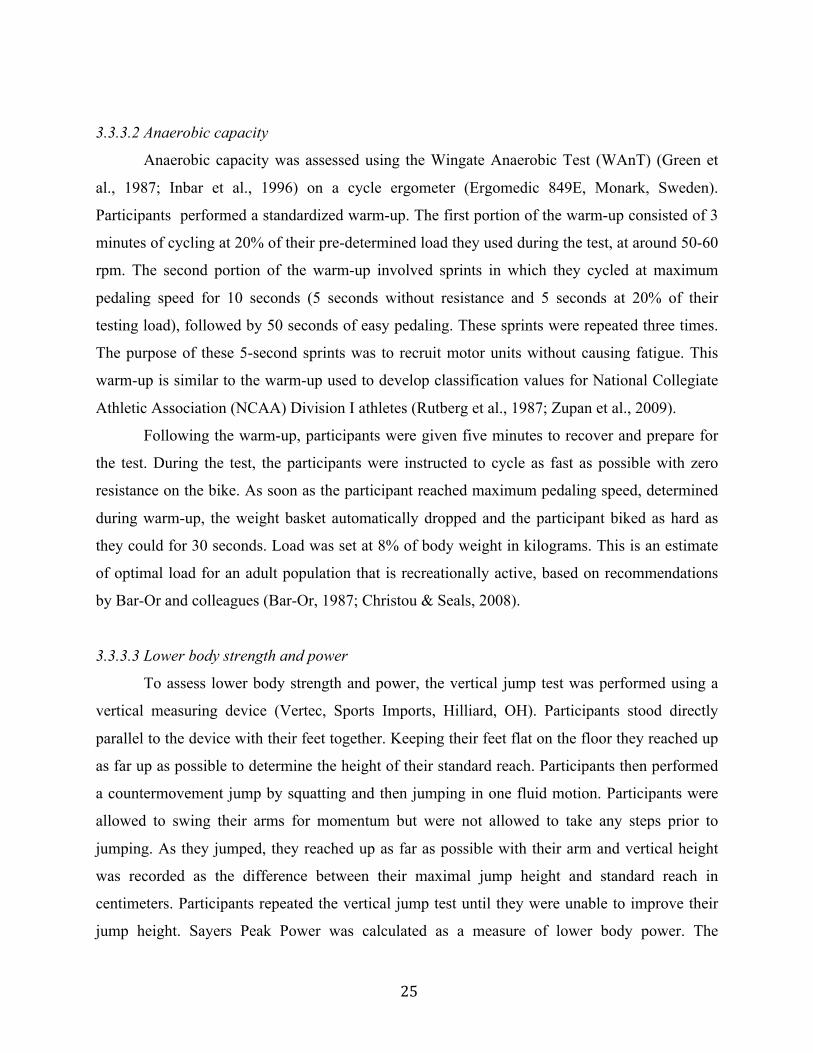
3.3.3.4 Upper body strength
To assess upper body strength, participants used a handgrip dynamometer (Lafayette
Instrument Company model 78010). Participants stood with the handheld device close but not
touching their body. The participants adjusted the dynamometer so that they gripped the handle
with the second joint of their fingers. With their dominant hand, they squeezed the dynamometer
in a maximal isometric contraction for 5 seconds without moving any other part of their body.
The highest and average score after 3 trials were recorded (in kg). This test has been used in the
assessment of adult golf performance and in children with cystic fibrosis (Bar-Or, 1987; Wells,
Elmi, & Thomas, 2009a; Wells, Wilkes, et al., 2013b).
Figure 6. Upper and lower body strength tests. A) A Vertec (vertical measuring device to
measure lower body muscle strength. B) A handgrip dynamometer (to measure upper body
muscle strength).

27
3.4 Statistical analysis
All statistical analyses were performed with SPSS Statistics v. 22.0. Descriptive statistics
are reported as mean ± standard deviation (SD). Independent samples t tests were used to
compare means between healthy control subjects and patients tested positive for MH. One-way
Analysis of Variance (ANOVA) tests were performed for any of the MH subgroup analyses in
which more than two groups were compared. Tukey’s HSD test was used for post hoc analysis.
Levene’s test of equality of variance was used and in the case of high variability, non-parametric
tests were performed. Kruskal-Wallis independent samples test was used in lieu of ANOVA, and
bonferroni corrected Mann-Whitney U test was used in lieu of t tests as the post hoc.
Correlational analysis was performed to determine the relationship between measures of
functional exercise capacity and in vivo measures of metabolism. The null hypothesis was
rejected at an alpha level of 0.05.
28
CHAPTER 4: RESULTS
4.1 Comparison of HC to MH group
4.1.1 Participants
Twenty Healthy Controls (HC) and 32 individuals who tested positive for MH according
to the CHCT (MH group) were recruited for the study. Three MH patients didn’t complete the
study, yielding 29 participants for the MH group.
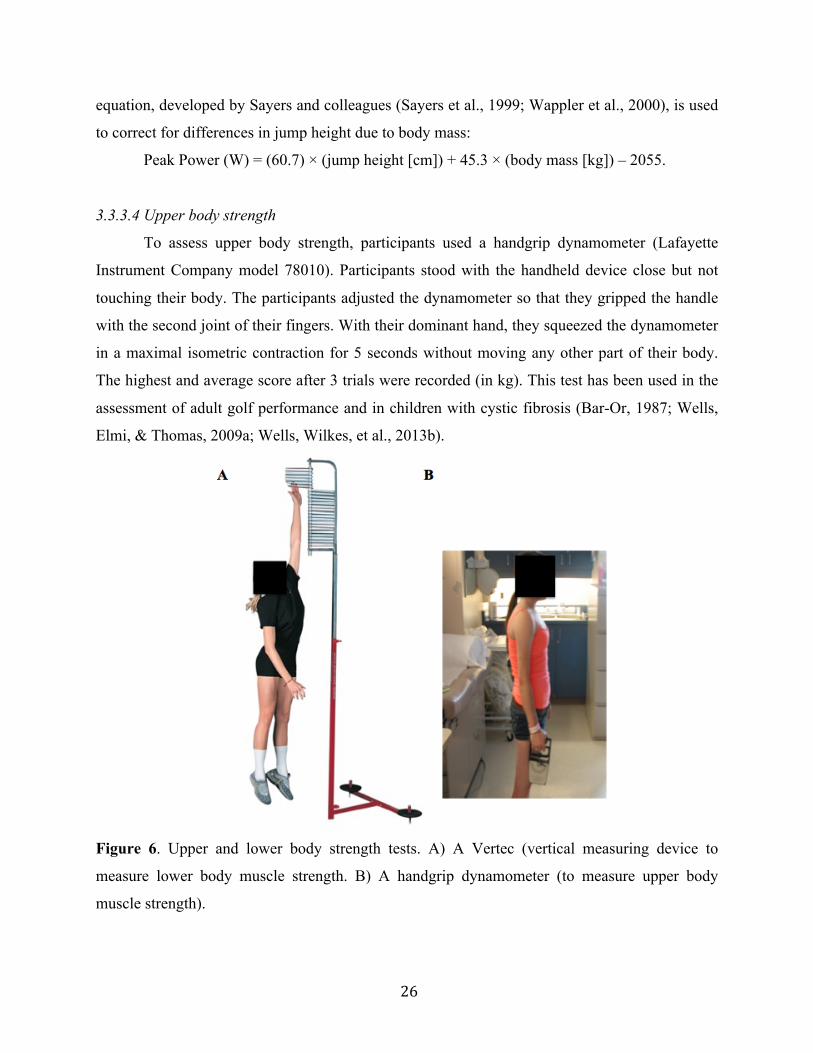
4.1.2 Descriptive characteristics
There were no significant differences in age (p>0.05), height (p>0.05), weight (p>0.05),
or BMI (p>0.05) between HC and MH patients (Table 2).
Table 2. Descriptive characteristics for HC and MH patients.
Measures are expressed as mean ± SD.
Descriptive characteristic HC (n=20) MH group (n=29) Gender (F/M) 11 F/ 9 M 15 F/ 15 M Age (years) 39.7 ± 14.6 39.6 ± 13.9 Height (cm) 171.3 ± 8.7 171.4 ± 8.1 Weight (kg) 75.2 ± 14.7 75.3 ± 20.6 BMI (kg/m2) 25.5 ± 4.0 25.5 ± 6.5
4.1.3 Habitual Activity Estimation Scale
Non-parametric tests were performed due to significant variability of the HAES data. The
Mann-Whitney U Independent Samples test was used to compare measures between HC and MH
patients.
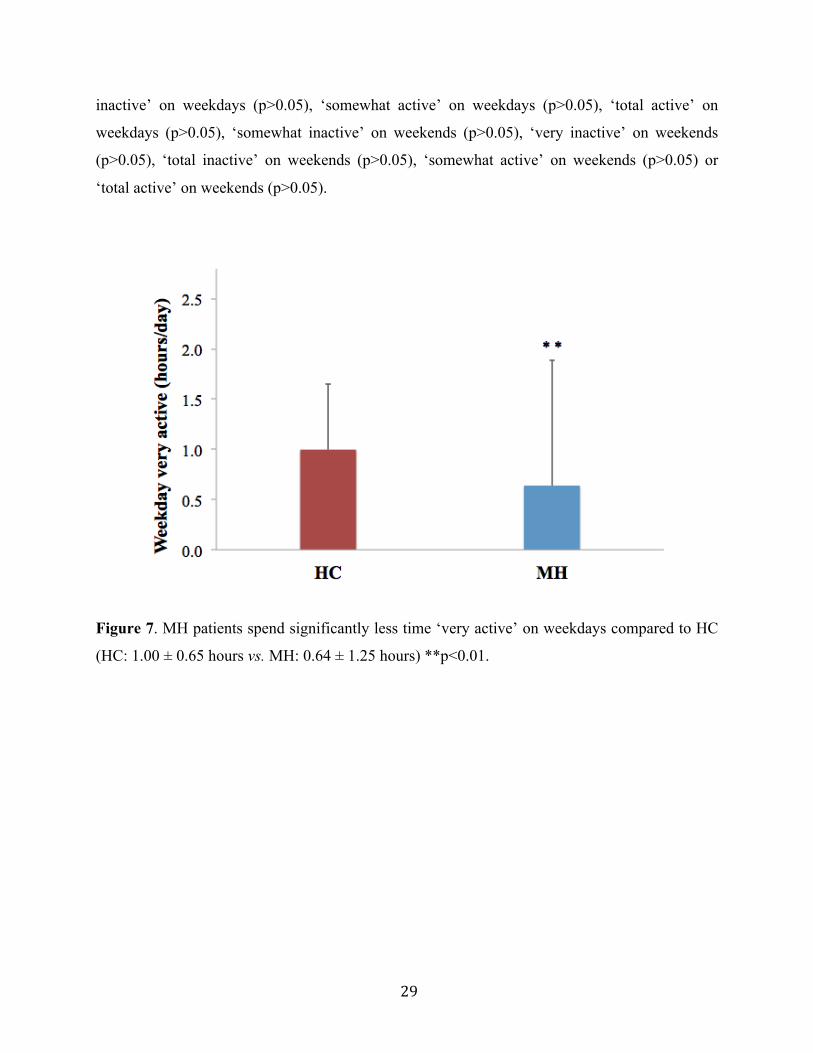
There were significant differences between HC and MH patients for hours spent ‘very
active’ on weekdays (HC: 1.0 ± 0.65 hours vs. MH: 0.64 ± 1.25 hours, p<0.01) (Figure 7) and
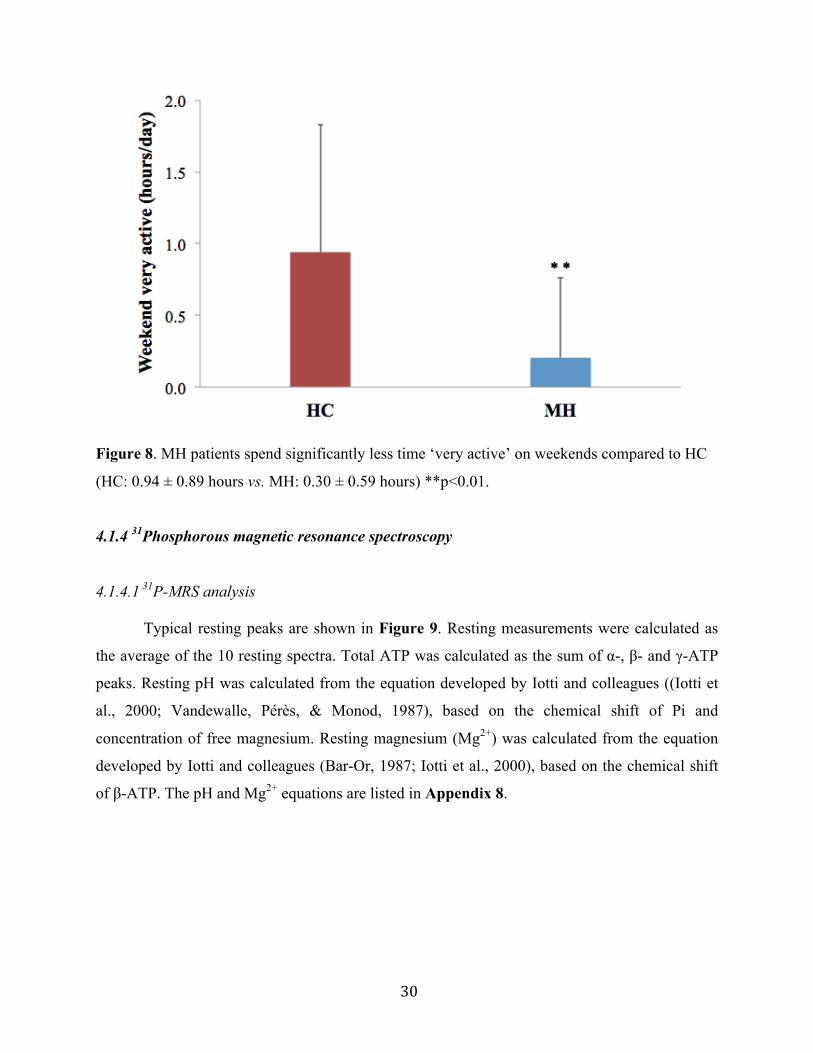
hours spent ‘very active’ on weekends (HC: 0.94 ± 0.89 hours vs. MH: 0.30 ± 0.59 hours,
p<0.01) (Figure 8). No significant differences were observed between groups for hours spent
‘somewhat inactive’ on weekdays (p>0.05), ‘very inactive’ on weekdays (p>0.05), ‘total
29
inactive’ on weekdays (p>0.05), ‘somewhat active’ on weekdays (p>0.05), ‘total active’ on
weekdays (p>0.05), ‘somewhat inactive’ on weekends (p>0.05), ‘very inactive’ on weekends
(p>0.05), ‘total inactive’ on weekends (p>0.05), ‘somewhat active’ on weekends (p>0.05) or
‘total active’ on weekends (p>0.05).
Figure 7. MH patients spend significantly less time ‘very active’ on weekdays compared to HC
(HC: 1.00 ± 0.65 hours vs. MH: 0.64 ± 1.25 hours) **p<0.01.
30
Figure 8. MH patients spend significantly less time ‘very active’ on weekends compared to HC
(HC: 0.94 ± 0.89 hours vs. MH: 0.30 ± 0.59 hours) **p<0.01.
4.1.4 31Phosphorous magnetic resonance spectroscopy
4.1.4.1 31P-MRS analysis
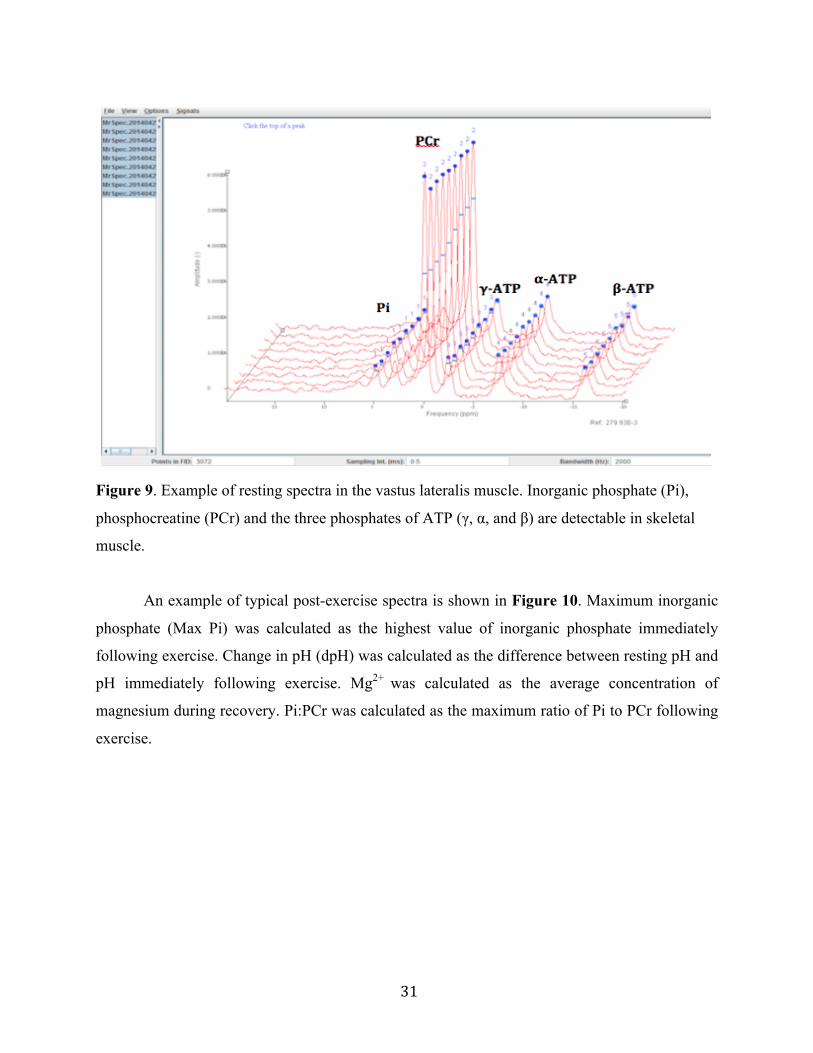
Typical resting peaks are shown in Figure 9. Resting measurements were calculated as
the average of the 10 resting spectra. Total ATP was calculated as the sum of α-, β- and γ-ATP
peaks. Resting pH was calculated from the equation developed by Iotti and colleagues ((Iotti et
al., 2000; Vandewalle, Pérès, & Monod, 1987), based on the chemical shift of Pi and
concentration of free magnesium. Resting magnesium (Mg2+) was calculated from the equation
developed by Iotti and colleagues (Bar-Or, 1987; Iotti et al., 2000), based on the chemical shift
of β-ATP. The pH and Mg2+ equations are listed in Appendix 8.
31
Figure 9. Example of resting spectra in the vastus lateralis muscle. Inorganic phosphate (Pi),
phosphocreatine (PCr) and the three phosphates of ATP (γ, α, and β) are detectable in skeletal
muscle.
An example of typical post-exercise spectra is shown in Figure 10. Maximum inorganic
phosphate (Max Pi) was calculated as the highest value of inorganic phosphate immediately
following exercise. Change in pH (dpH) was calculated as the difference between resting pH and
pH immediately following exercise. Mg2+ was calculated as the average concentration of
magnesium during recovery. Pi:PCr was calculated as the maximum ratio of Pi to PCr following
exercise.

32
Figure 10. Example of post-exercise spectra in a typical participant. Note the increase in Pi and
decrease in PCr immediately following exercise and the gradual return to baseline levels.
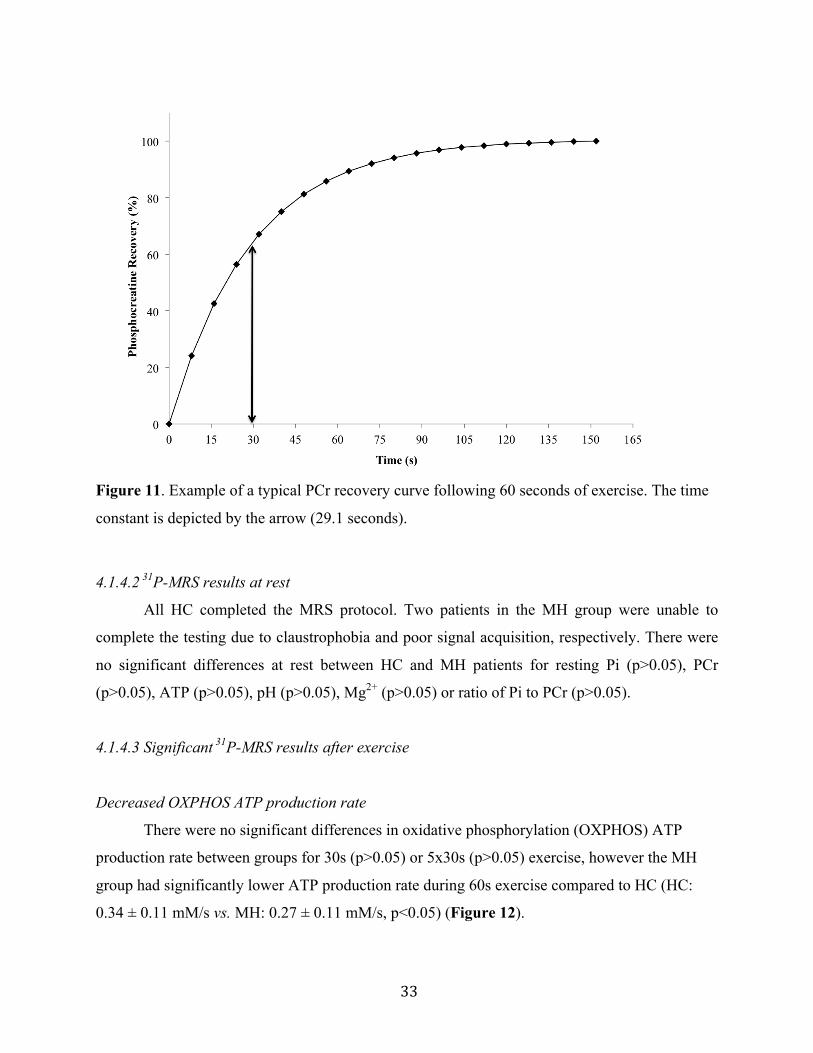
The PCr recovery time constant was calculated with a curve-fitting program (LabVIEW
2012, National Instruments, Texas, USA) and the exponential function: b+a*exp(-(x/c)), where b
is the baseline PCr, a is the difference between end-exercise and baseline, c is the time constant,
and x is time. PCr time constant is the time it takes for approximately 63.2% of the original
stores to be replenished. A typical result of PCr recovery curve is illustrated in Figure 11.
ATP production rate (ATPprodrate) was calculated from the three bioenergetics pathways
used during exercise, using the formulas developed by Newcomer and colleagues ((Bar-Or,
1987; Newcomer & Boska, 1997)). ATP production rate from the high energy phosphagen
(creatine kinase) system was based on the change in concentration of PCr during exercise. ATP
production rate from anaerobic glycolysis was based on changes in concentration of PCr, and pH
during exercise. ATP production rate from oxidative phosphorylation is based on the change in
PCr during the first 8 seconds of recovery following exercise. These equations are listed in
Appendix 8.
33
Figure 11. Example of a typical PCr recovery curve following 60 seconds of exercise. The time
constant is depicted by the arrow (29.1 seconds).
4.1.4.2 31P-MRS results at rest
All HC completed the MRS protocol. Two patients in the MH group were unable to
complete the testing due to claustrophobia and poor signal acquisition, respectively. There were
no significant differences at rest between HC and MH patients for resting Pi (p>0.05), PCr
(p>0.05), ATP (p>0.05), pH (p>0.05), Mg2+ (p>0.05) or ratio of Pi to PCr (p>0.05).
4.1.4.3 Significant 31P-MRS results after exercise
Decreased OXPHOS ATP production rate
There were no significant differences in oxidative phosphorylation (OXPHOS) ATP
production rate between groups for 30s (p>0.05) or 5x30s (p>0.05) exercise, however the MH
group had significantly lower ATP production rate during 60s exercise compared to HC (HC:
0.34 ± 0.11 mM/s vs. MH: 0.27 ± 0.11 mM/s, p<0.05) (Figure 12).
34
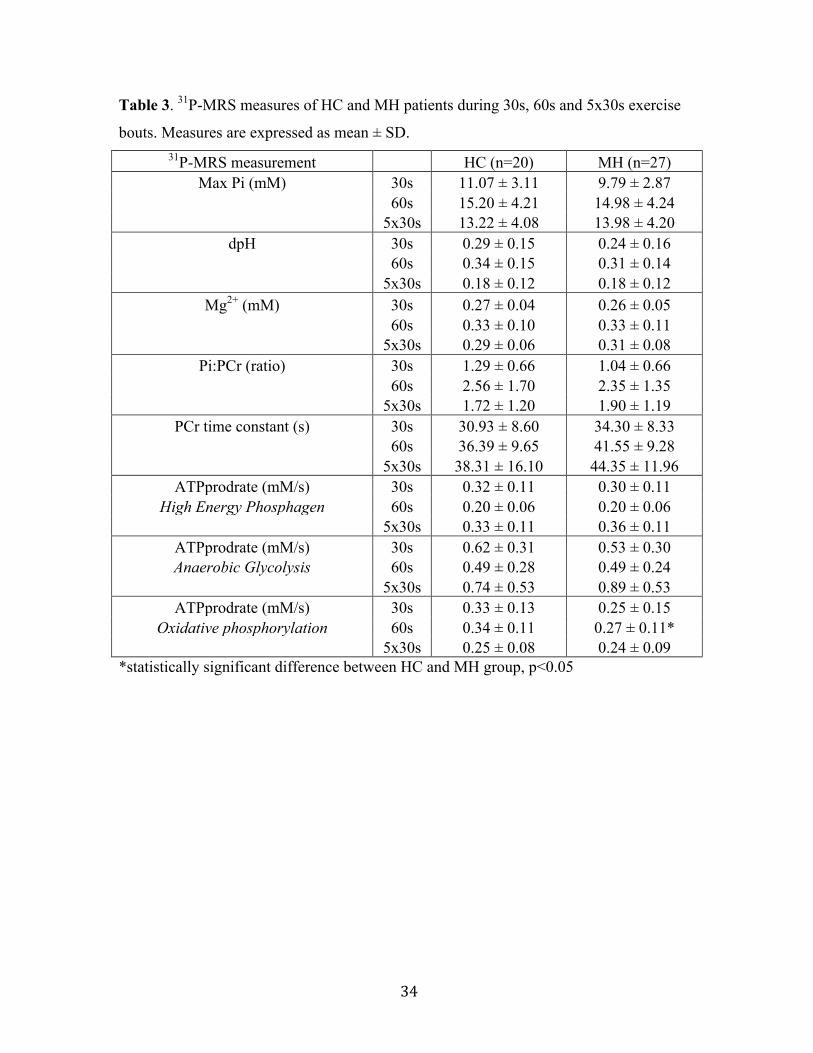
Table 3. 31P-MRS measures of HC and MH patients during 30s, 60s and 5x30s exercise
bouts. Measures are expressed as mean ± SD. 31P-MRS measurement HC (n=20) MH (n=27)
Max Pi (mM) 30s 11.07 ± 3.11 9.79 ± 2.87 60s 15.20 ± 4.21 14.98 ± 4.24 5x30s 13.22 ± 4.08 13.98 ± 4.20
dpH 30s 0.29 ± 0.15 0.24 ± 0.16 60s 0.34 ± 0.15 0.31 ± 0.14 5x30s 0.18 ± 0.12 0.18 ± 0.12
Mg2+ (mM) 30s 0.27 ± 0.04 0.26 ± 0.05 60s 0.33 ± 0.10 0.33 ± 0.11 5x30s 0.29 ± 0.06 0.31 ± 0.08
Pi:PCr (ratio) 30s 1.29 ± 0.66 1.04 ± 0.66 60s 2.56 ± 1.70 2.35 ± 1.35 5x30s 1.72 ± 1.20 1.90 ± 1.19
PCr time constant (s) 30s 30.93 ± 8.60 34.30 ± 8.33 60s 36.39 ± 9.65 41.55 ± 9.28 5x30s 38.31 ± 16.10 44.35 ± 11.96
ATPprodrate (mM/s) 30s 0.32 ± 0.11 0.30 ± 0.11 High Energy Phosphagen 60s 0.20 ± 0.06 0.20 ± 0.06
5x30s 0.33 ± 0.11 0.36 ± 0.11 ATPprodrate (mM/s) 30s 0.62 ± 0.31 0.53 ± 0.30 Anaerobic Glycolysis 60s 0.49 ± 0.28 0.49 ± 0.24
5x30s 0.74 ± 0.53 0.89 ± 0.53 ATPprodrate (mM/s) 30s 0.33 ± 0.13 0.25 ± 0.15
Oxidative phosphorylation 60s 0.34 ± 0.11 0.27 ± 0.11* 5x30s 0.25 ± 0.08 0.24 ± 0.09 *statistically significant difference between HC and MH group, p<0.05

35
Figure 12. MH patients have lower oxidative phosphorylation ATP production rates than HC
during 60-second exercise (HC: 0.34 ± 0.11 mM/s vs. MH: 0.27 ± 0.11 mM/s) *p<0.05.
4.1.4.4 Non-significant 31P-MRS results after exercise
Max Pi and Pi:PCr
There were no significant differences between HC and MH patients for Max Pi during
30s (p>0.05), 60s (p>0.05) or 5x30s exercise (p>0.05). Similarly, Pi:PCr ratio was similar
between groups during 30s (p>0.05), 60s (p>0.05) and 5x30s exercise (p>0.05).
Change in pH
There were no significant differences in change in pH (dpH) between HC and MH
patients during 30s (p>0.05), 60s (p>0.05) or 5x30s exercise (p>0.05).
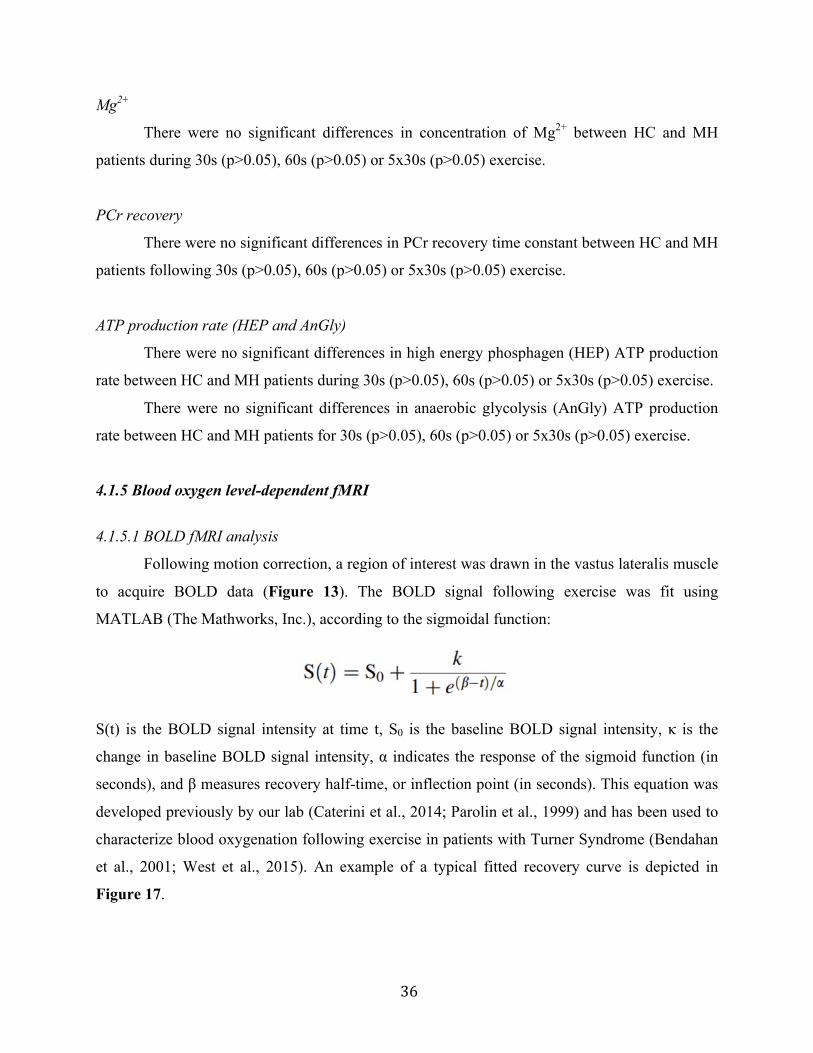
36
Mg2+
There were no significant differences in concentration of Mg2+ between HC and MH
patients during 30s (p>0.05), 60s (p>0.05) or 5x30s (p>0.05) exercise.
PCr recovery
There were no significant differences in PCr recovery time constant between HC and MH
patients following 30s (p>0.05), 60s (p>0.05) or 5x30s (p>0.05) exercise.
ATP production rate (HEP and AnGly)
There were no significant differences in high energy phosphagen (HEP) ATP production
rate between HC and MH patients during 30s (p>0.05), 60s (p>0.05) or 5x30s (p>0.05) exercise.
There were no significant differences in anaerobic glycolysis (AnGly) ATP production
rate between HC and MH patients for 30s (p>0.05), 60s (p>0.05) or 5x30s (p>0.05) exercise.
4.1.5 Blood oxygen level-dependent fMRI
4.1.5.1 BOLD fMRI analysis
Following motion correction, a region of interest was drawn in the vastus lateralis muscle
to acquire BOLD data (Figure 13). The BOLD signal following exercise was fit using
MATLAB (The Mathworks, Inc.), according to the sigmoidal function:
S(t) is the BOLD signal intensity at time t, S0 is the baseline BOLD signal intensity, κ is the
change in baseline BOLD signal intensity, α indicates the response of the sigmoid function (in
seconds), and β measures recovery half-time, or inflection point (in seconds). This equation was
developed previously by our lab (Caterini et al., 2014; Parolin et al., 1999) and has been used to
characterize blood oxygenation following exercise in patients with Turner Syndrome (Bendahan
et al., 2001; West et al., 2015). An example of a typical fitted recovery curve is depicted in
Figure 17.
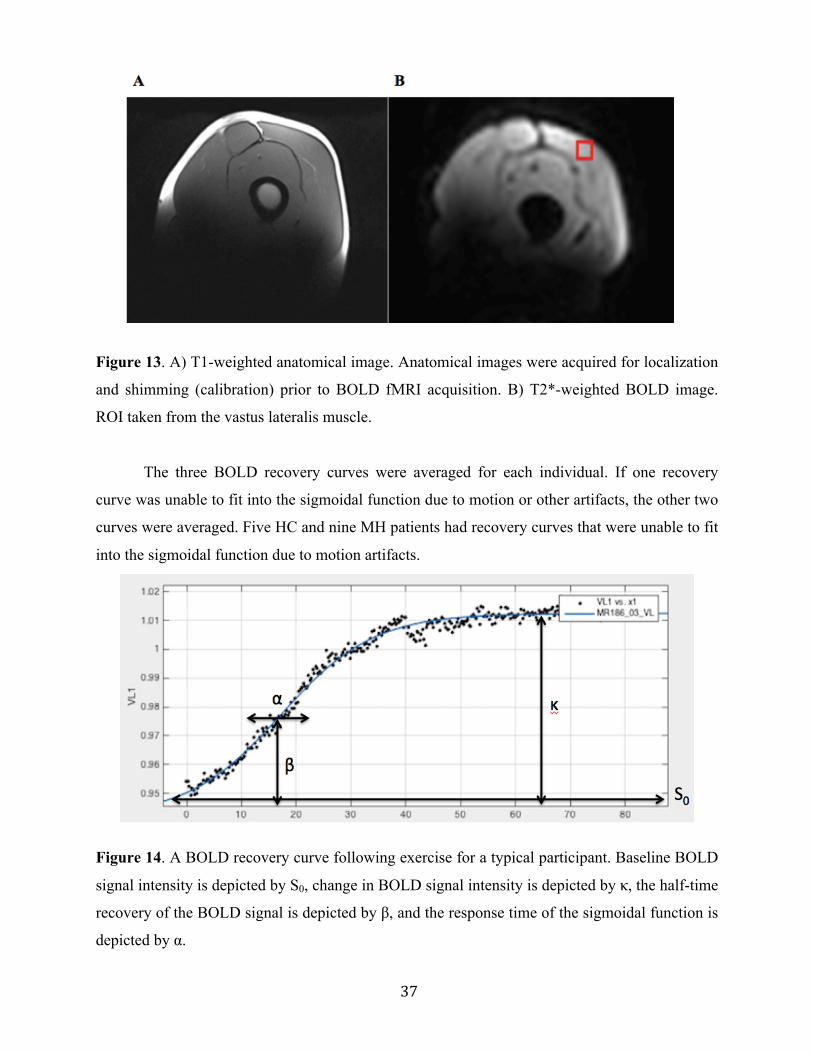
37
Figure 13. A) T1-weighted anatomical image. Anatomical images were acquired for localization
and shimming (calibration) prior to BOLD fMRI acquisition. B) T2*-weighted BOLD image.
ROI taken from the vastus lateralis muscle.
The three BOLD recovery curves were averaged for each individual. If one recovery
curve was unable to fit into the sigmoidal function due to motion or other artifacts, the other two
curves were averaged. Five HC and nine MH patients had recovery curves that were unable to fit
into the sigmoidal function due to motion artifacts.
Figure 14. A BOLD recovery curve following exercise for a typical participant. Baseline BOLD
signal intensity is depicted by S0, change in BOLD signal intensity is depicted by κ, the half-time
recovery of the BOLD signal is depicted by β, and the response time of the sigmoidal function is
depicted by α.
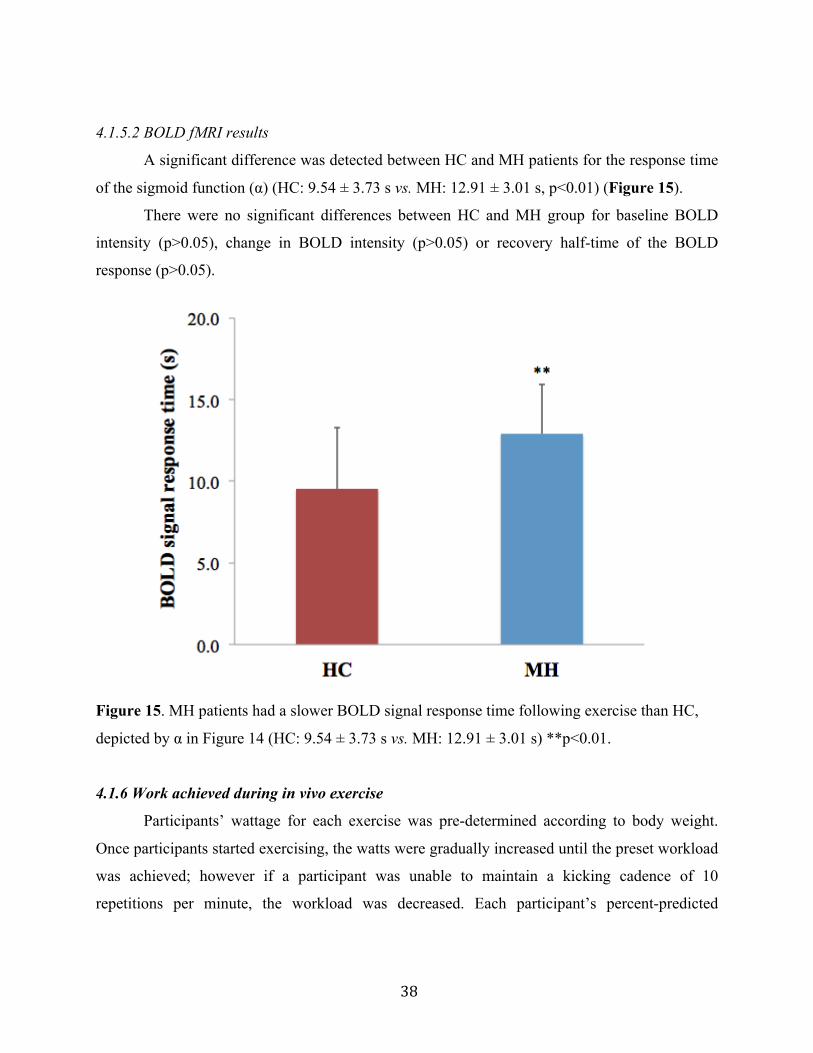
38
4.1.5.2 BOLD fMRI results
A significant difference was detected between HC and MH patients for the response time
of the sigmoid function (α) (HC: 9.54 ± 3.73 s vs. MH: 12.91 ± 3.01 s, p<0.01) (Figure 15).
There were no significant differences between HC and MH group for baseline BOLD
intensity (p>0.05), change in BOLD intensity (p>0.05) or recovery half-time of the BOLD
response (p>0.05).
Figure 15. MH patients had a slower BOLD signal response time following exercise than HC,
depicted by α in Figure 14 (HC: 9.54 ± 3.73 s vs. MH: 12.91 ± 3.01 s) **p<0.01.
4.1.6 Work achieved during in vivo exercise
Participants’ wattage for each exercise was pre-determined according to body weight.
Once participants started exercising, the watts were gradually increased until the preset workload
was achieved; however if a participant was unable to maintain a kicking cadence of 10
repetitions per minute, the workload was decreased. Each participant’s percent-predicted

39
workload (percentage of their predicted workload based on weight) was then recorded for each
exercise.
Table 4. Percent-predicted workloads for 31P-MRS and BOLD fMRI exercise.
Measures are expressed as mean ± SD.
Exercise HC (n=20) MH (n=27) 30s (% predicted
watts) 87.90 ± 26.03 83.39 ± 25.67 60s (% predicted
watts) 81.15 ± 33.31 66.07 ± 40.18 5x30s (% predicted
watts) 61.90 ± 47.52 31.78 ± 41.78 * BOLD (%
predicted watts) 62.65 ± 43.50 28.78 ± 39.20 ** *statistically significant difference between HC and MH, p<0.05.
**statistically significant difference between HC and MH, p<0.01.
Results are summarized in Table 4. Significant differences in percent-predicted workload
were detected between HC and MH group for 5x30s (HC: 61.90 ± 47.52 % vs. MH: 31.78 ±
41.78 %, p<0.05) and BOLD (3x60s) (HC: 62.65 ± 43.50 % vs. MH: 28.78 ± 39.20 %, p<0.01)
exercise bouts. No significant difference was detected during the 30s (p>0.05) and 60s (p>0.05)
exercise bouts.
4.1.7 Aerobic capacity
4.1.7.1 Estimation of VO2max using the YMCA submaximal cycler ergometer test
Participants performed 3-minute incremental workloads on the cycle ergometer until
approximately 85% of age-predicted maximum heart rate was reached. The loads (watts) of the
submaximal workloads were based on the participants’ heart rate (HR) during the first workload.
For the detailed explanation of the protocol see Appendix 9. The final two 3-minute stages were
used to calculate an estimate for maximum oxygen uptake. Oxygen uptake (VO2) for each stage
was calculated based on the participant’s weight, workload and HR during that stage:
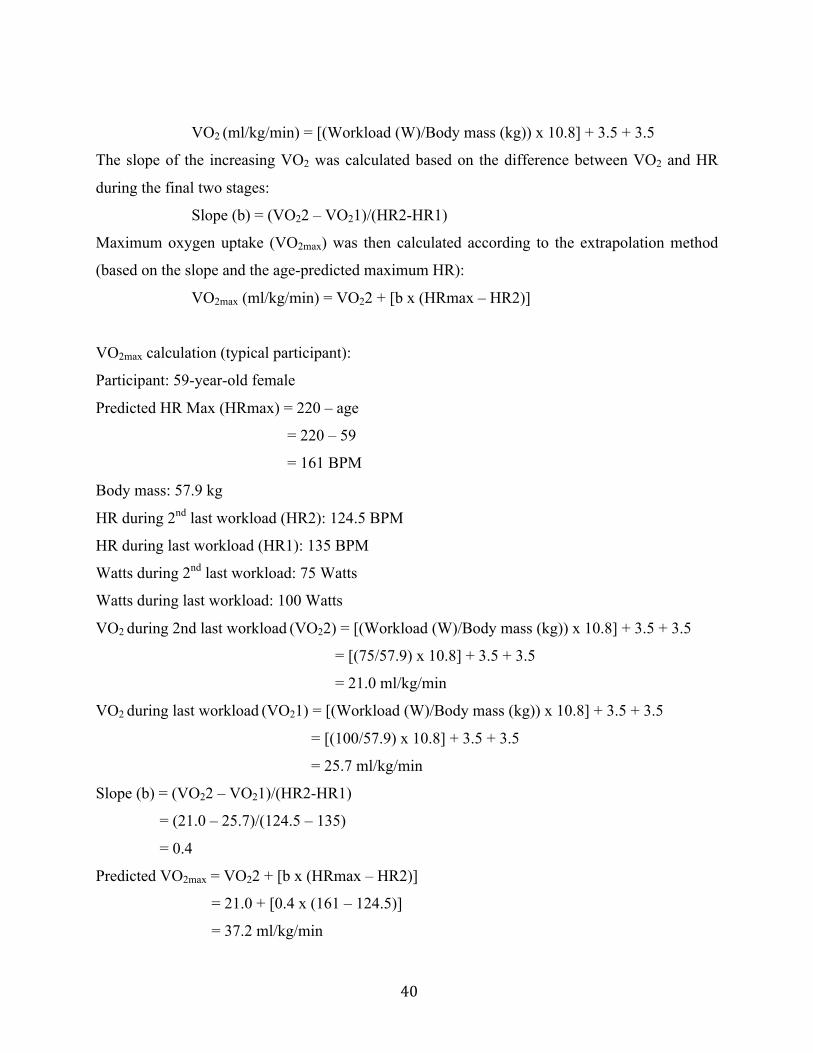
40
VO2 (ml/kg/min) = [(Workload (W)/Body mass (kg)) x 10.8] + 3.5 + 3.5
The slope of the increasing VO2 was calculated based on the difference between VO2 and HR
during the final two stages:
Slope (b) = (VO22 – VO21)/(HR2-HR1)
Maximum oxygen uptake (VO2max) was then calculated according to the extrapolation method
(based on the slope and the age-predicted maximum HR):
VO2max (ml/kg/min) = VO22 + [b x (HRmax – HR2)]
VO2max calculation (typical participant):
Participant: 59-year-old female
Predicted HR Max (HRmax) = 220 – age
= 220 – 59
= 161 BPM
Body mass: 57.9 kg
HR during 2nd last workload (HR2): 124.5 BPM
HR during last workload (HR1): 135 BPM
Watts during 2nd last workload: 75 Watts
Watts during last workload: 100 Watts
VO2 during 2nd last workload (VO22) = [(Workload (W)/Body mass (kg)) x 10.8] + 3.5 + 3.5
= [(75/57.9) x 10.8] + 3.5 + 3.5
= 21.0 ml/kg/min
VO2 during last workload (VO21) = [(Workload (W)/Body mass (kg)) x 10.8] + 3.5 + 3.5
= [(100/57.9) x 10.8] + 3.5 + 3.5
= 25.7 ml/kg/min
Slope (b) = (VO22 – VO21)/(HR2-HR1)
= (21.0 – 25.7)/(124.5 – 135)
= 0.4
Predicted VO2max = VO22 + [b x (HRmax – HR2)]
= 21.0 + [0.4 x (161 – 124.5)]
= 37.2 ml/kg/min
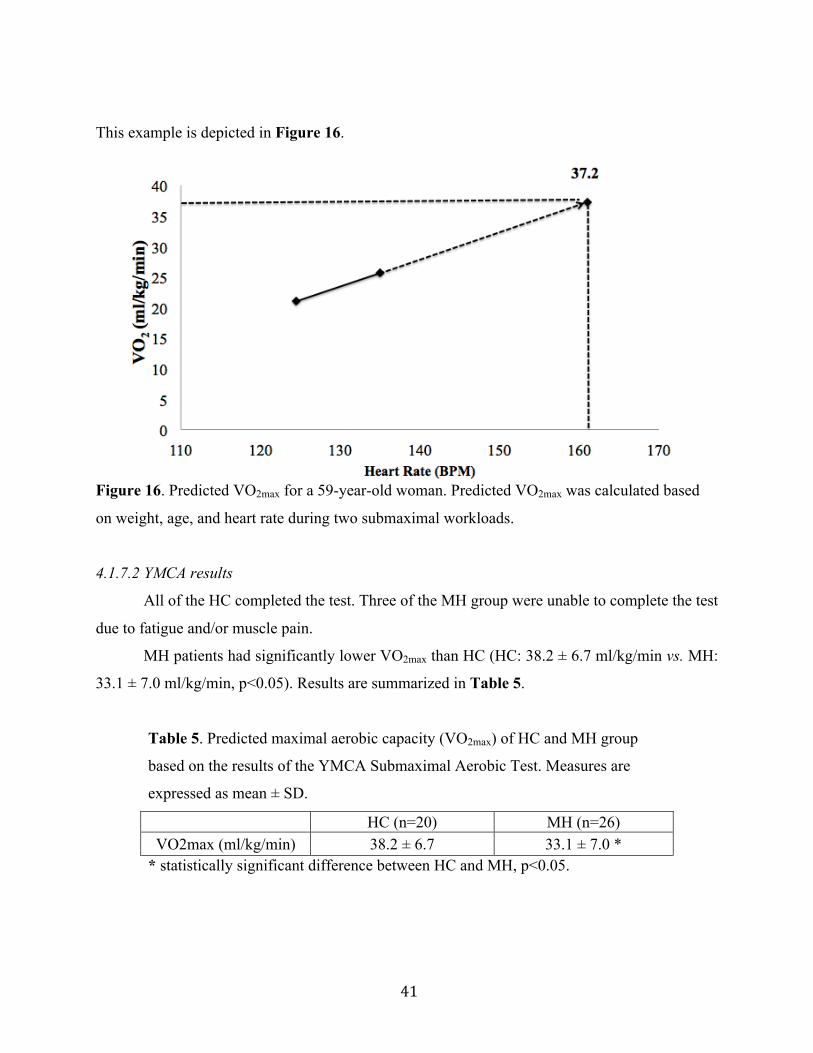
41
This example is depicted in Figure 16.
Figure 16. Predicted VO2max for a 59-year-old woman. Predicted VO2max was calculated based
on weight, age, and heart rate during two submaximal workloads.
4.1.7.2 YMCA results
All of the HC completed the test. Three of the MH group were unable to complete the test
due to fatigue and/or muscle pain.
MH patients had significantly lower VO2max than HC (HC: 38.2 ± 6.7 ml/kg/min vs. MH:
33.1 ± 7.0 ml/kg/min, p<0.05). Results are summarized in Table 5.
Table 5. Predicted maximal aerobic capacity (VO2max) of HC and MH group
based on the results of the YMCA Submaximal Aerobic Test. Measures are
expressed as mean ± SD.
HC (n=20) MH (n=26) VO2max (ml/kg/min) 38.2 ± 6.7 33.1 ± 7.0 *
* statistically significant difference between HC and MH, p<0.05.
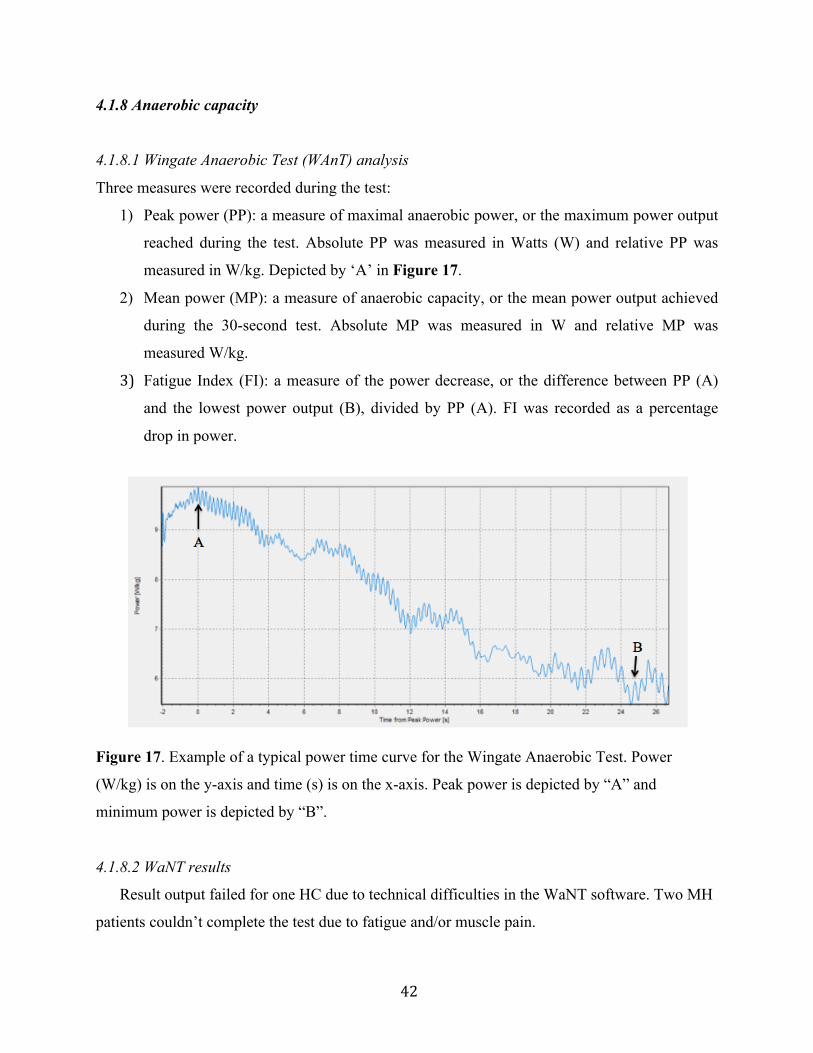
42
4.1.8 Anaerobic capacity
4.1.8.1 Wingate Anaerobic Test (WAnT) analysis
Three measures were recorded during the test:
1) Peak power (PP): a measure of maximal anaerobic power, or the maximum power output
reached during the test. Absolute PP was measured in Watts (W) and relative PP was
measured in W/kg. Depicted by ‘A’ in Figure 17.
2) Mean power (MP): a measure of anaerobic capacity, or the mean power output achieved
during the 30-second test. Absolute MP was measured in W and relative MP was
measured W/kg.
3) Fatigue Index (FI): a measure of the power decrease, or the difference between PP (A)
and the lowest power output (B), divided by PP (A). FI was recorded as a percentage
drop in power.
Figure 17. Example of a typical power time curve for the Wingate Anaerobic Test. Power
(W/kg) is on the y-axis and time (s) is on the x-axis. Peak power is depicted by “A” and
minimum power is depicted by “B”.
4.1.8.2 WaNT results
Result output failed for one HC due to technical difficulties in the WaNT software. Two MH
patients couldn’t complete the test due to fatigue and/or muscle pain.
43
Table 6. Results of the WAnT for HC and MH patients. Measures are
expressed as mean ± SD.
WAnT measurement HC (n=19) MH (n=27) Peak power (W) 734.5 ± 218.6 620.3 ± 166.1 *
Peak power (W/kg) 9.7 ± 2.1 8.6 ± 1.8 Mean power (W) 544.7 ± 144.6 439.8 ± 121.9 *
Mean power (W/kg) 7.2 ±1.3 6.2 ± 1.2 ** Fatigue Index (%) 51.7 ± 8.4 59.5 ± 8.6 **
*statistically significant difference between HC and MH, p<0.05.
**statistically significant difference between HC and MH, p<0.01.
Significant differences were detected between HC and MH patients for absolute peak
power (HC: 734.5 ± 218.6 W vs. MH: 620.3 ± 166.1, p<0.05) (Figure 18), absolute mean power
(HC: 544.7 ± 144.6 W vs. MH: 439.8 ± 121.9 W, p<0.05) (Figure 19), relative mean power
(HC: 7.2 ±1.3 W/kg vs. MH: 6.2 ± 1.2 W/kg, p<0.01) (Figure 20) and fatigue index (HC: 51.7 ±
8.4 % vs. MH: 59.5 ± 8.6 %, p<0.01) (Figure 21). No significant difference was detected in
relative peak power between HC and MH patients (p>0.05). Results are summarized in Table 6.
Figure 18. Significantly lower peak power (W) in MH patients compared to HC (HC: 734 ±
218.6 watts vs. MH: 620.3 ± 166.1 watts) *p<0.05.
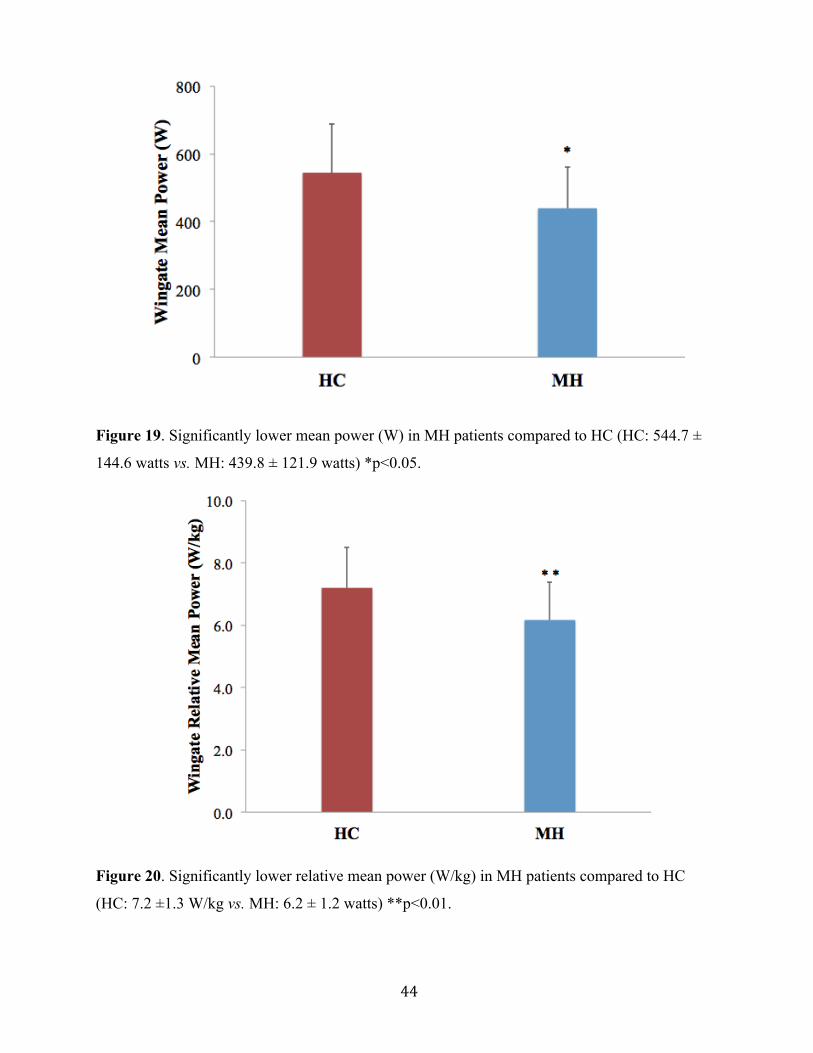
44
Figure 19. Significantly lower mean power (W) in MH patients compared to HC (HC: 544.7 ±
144.6 watts vs. MH: 439.8 ± 121.9 watts) *p<0.05.
Figure 20. Significantly lower relative mean power (W/kg) in MH patients compared to HC
(HC: 7.2 ±1.3 W/kg vs. MH: 6.2 ± 1.2 watts) **p<0.01.
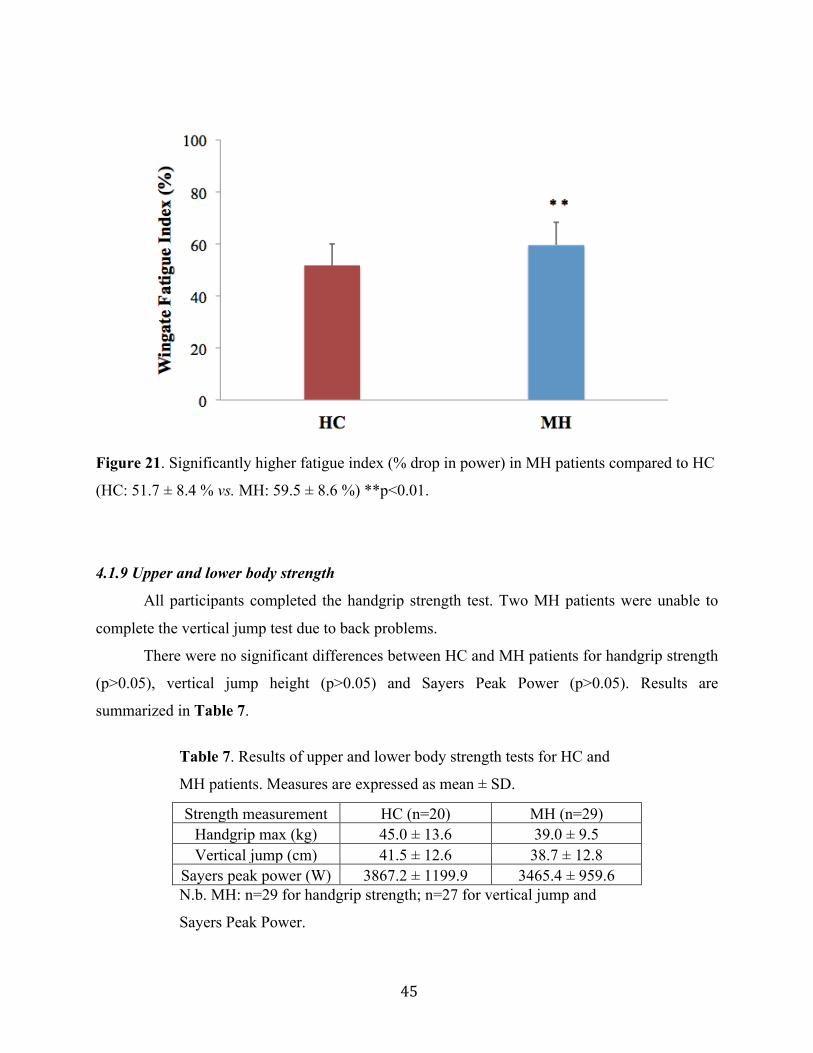
45
Figure 21. Significantly higher fatigue index (% drop in power) in MH patients compared to HC
(HC: 51.7 ± 8.4 % vs. MH: 59.5 ± 8.6 %) **p<0.01.
4.1.9 Upper and lower body strength
All participants completed the handgrip strength test. Two MH patients were unable to
complete the vertical jump test due to back problems.
There were no significant differences between HC and MH patients for handgrip strength
(p>0.05), vertical jump height (p>0.05) and Sayers Peak Power (p>0.05). Results are
summarized in Table 7.
Table 7. Results of upper and lower body strength tests for HC and
MH patients. Measures are expressed as mean ± SD.
Strength measurement HC (n=20) MH (n=29) Handgrip max (kg) 45.0 ± 13.6 39.0 ± 9.5 Vertical jump (cm) 41.5 ± 12.6 38.7 ± 12.8
Sayers peak power (W) 3867.2 ± 1199.9 3465.4 ± 959.6 N.b. MH: n=29 for handgrip strength; n=27 for vertical jump and
Sayers Peak Power.
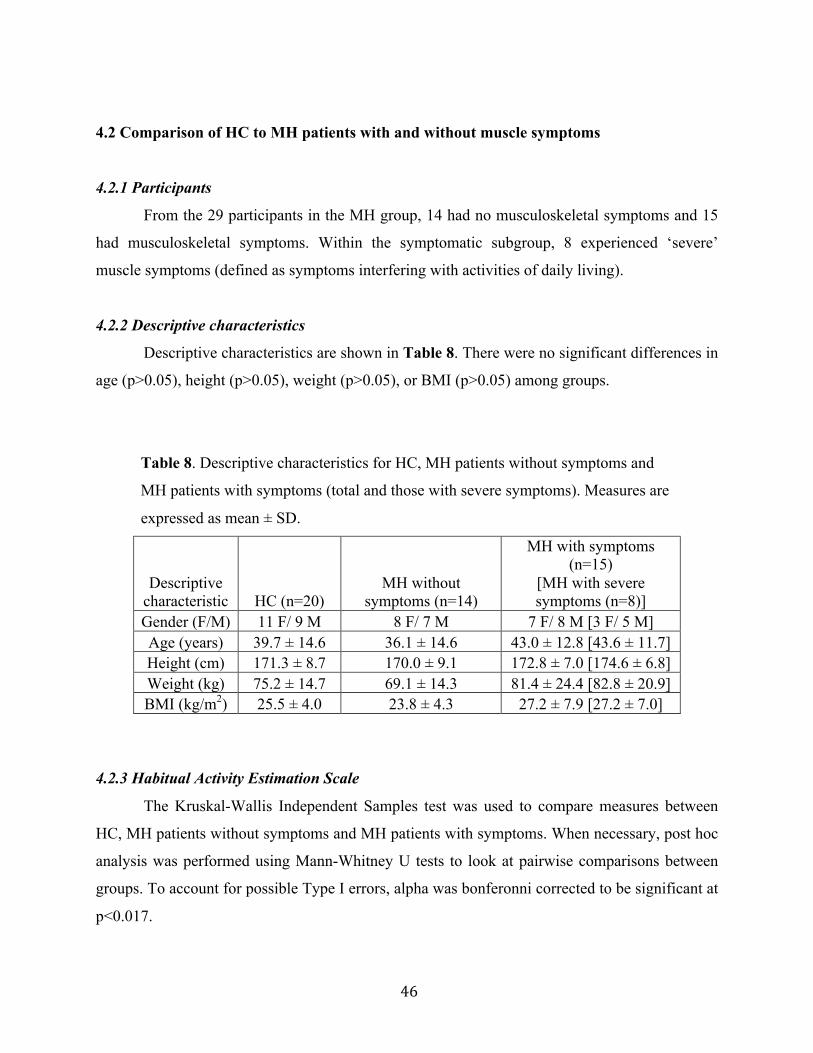
46
4.2 Comparison of HC to MH patients with and without muscle symptoms
4.2.1 Participants
From the 29 participants in the MH group, 14 had no musculoskeletal symptoms and 15
had musculoskeletal symptoms. Within the symptomatic subgroup, 8 experienced ‘severe’
muscle symptoms (defined as symptoms interfering with activities of daily living).
4.2.2 Descriptive characteristics
Descriptive characteristics are shown in Table 8. There were no significant differences in
age (p>0.05), height (p>0.05), weight (p>0.05), or BMI (p>0.05) among groups.
Table 8. Descriptive characteristics for HC, MH patients without symptoms and
MH patients with symptoms (total and those with severe symptoms). Measures are
expressed as mean ± SD.
Descriptive characteristic HC (n=20)
MH without symptoms (n=14)
MH with symptoms (n=15)
[MH with severe symptoms (n=8)]
Gender (F/M) 11 F/ 9 M 8 F/ 7 M 7 F/ 8 M [3 F/ 5 M] Age (years) 39.7 ± 14.6 36.1 ± 14.6 43.0 ± 12.8 [43.6 ± 11.7] Height (cm) 171.3 ± 8.7 170.0 ± 9.1 172.8 ± 7.0 [174.6 ± 6.8] Weight (kg) 75.2 ± 14.7 69.1 ± 14.3 81.4 ± 24.4 [82.8 ± 20.9] BMI (kg/m2) 25.5 ± 4.0 23.8 ± 4.3 27.2 ± 7.9 [27.2 ± 7.0]
4.2.3 Habitual Activity Estimation Scale
The Kruskal-Wallis Independent Samples test was used to compare measures between
HC, MH patients without symptoms and MH patients with symptoms. When necessary, post hoc
analysis was performed using Mann-Whitney U tests to look at pairwise comparisons between
groups. To account for possible Type I errors, alpha was bonferonni corrected to be significant at
p<0.017.
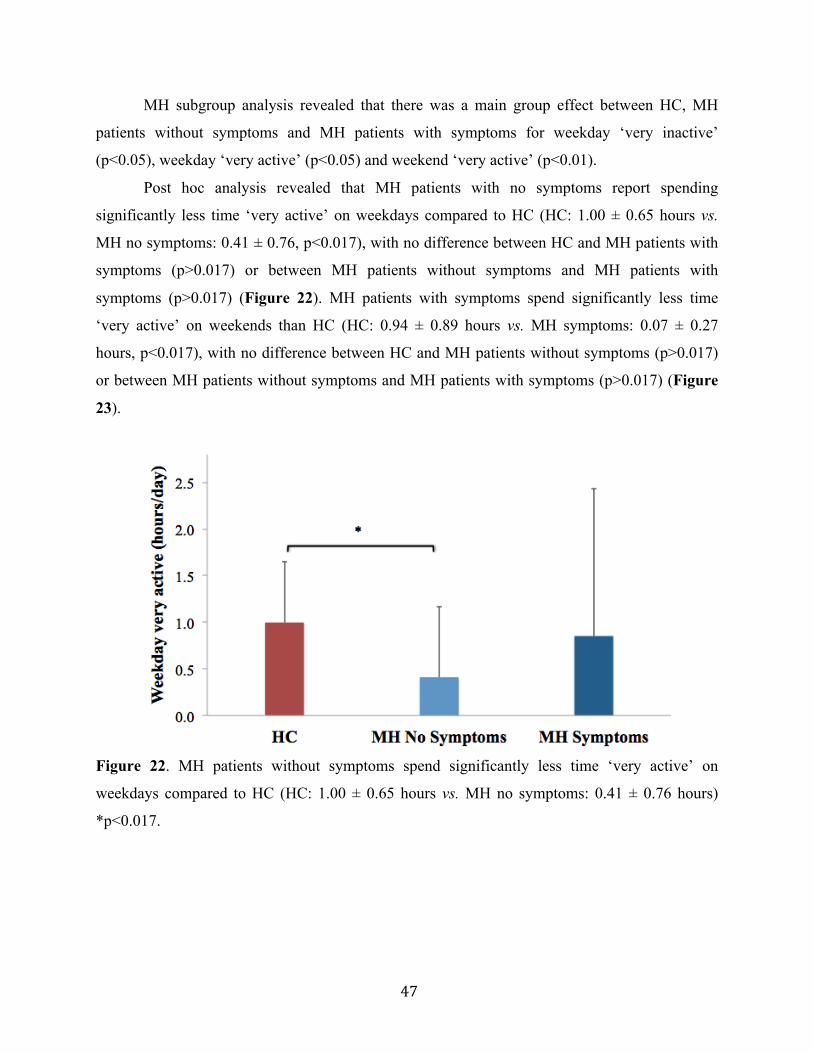
47
MH subgroup analysis revealed that there was a main group effect between HC, MH
patients without symptoms and MH patients with symptoms for weekday ‘very inactive’
(p<0.05), weekday ‘very active’ (p<0.05) and weekend ‘very active’ (p<0.01).
Post hoc analysis revealed that MH patients with no symptoms report spending
significantly less time ‘very active’ on weekdays compared to HC (HC: 1.00 ± 0.65 hours vs.
MH no symptoms: 0.41 ± 0.76, p<0.017), with no difference between HC and MH patients with
symptoms (p>0.017) or between MH patients without symptoms and MH patients with
symptoms (p>0.017) (Figure 22). MH patients with symptoms spend significantly less time
‘very active’ on weekends than HC (HC: 0.94 ± 0.89 hours vs. MH symptoms: 0.07 ± 0.27
hours, p<0.017), with no difference between HC and MH patients without symptoms (p>0.017)
or between MH patients without symptoms and MH patients with symptoms (p>0.017) (Figure
23).
Figure 22. MH patients without symptoms spend significantly less time ‘very active’ on
weekdays compared to HC (HC: 1.00 ± 0.65 hours vs. MH no symptoms: 0.41 ± 0.76 hours)
*p<0.017.

48
Figure 23. MH patients with symptoms spend significantly less time ‘very active’ on weekends
compared to HC (HC: 0.94 ± 0.89 hours vs. MH symptoms: 0.07 ± 0.27 hours) *p<0.017.
No differences were observed between groups for hours spent ‘somewhat inactive’ on
weekdays (p>0.05), ‘total inactive’ on weekdays (p>0.05), ‘somewhat active’ on weekdays
(p>0.05), ‘total active’ on weekdays (p>0.05), ‘somewhat inactive’ on weekends (p>0.05), ‘very
inactive’ on weekends (p>0.05), ‘total inactive’ on weekends (p>0.05), ‘somewhat active’ on
weekends (p>0.05) or ‘total active’ on weekends (p>0.05).
The symptomatic MH group was broken down even further into those who had ‘severe’
muscle symptoms. This subgroup analysis revealed that there was a main group effect between
HC, MH patients without symptoms and MH patients with severe symptoms for weekday
‘somewhat active’ (p<0.05), weekday ‘very active’ (p<0.05), weekend ‘total inactive’ (p<0.05)
and weekend ‘very active’ (p<0.05).
Post hoc analysis revealed MH patients with no symptoms spend significantly less time
‘very active’ on weekdays compared to HC (HC: 1.00 ± 0.65 hours vs. MH no symptoms: 0.41 ±
0.76, p<0.017), with no difference between HC and MH patients with severe symptoms
(p>0.017) or between MH patients without symptoms and MH patients with severe symptoms
(p>0.017). MH patients with severe symptoms report spending significantly more ‘total inactive’
time on weekends compared with HC (HC: 7.73 ± 1.64 hours vs. MH severe symptoms: 9.98 ±
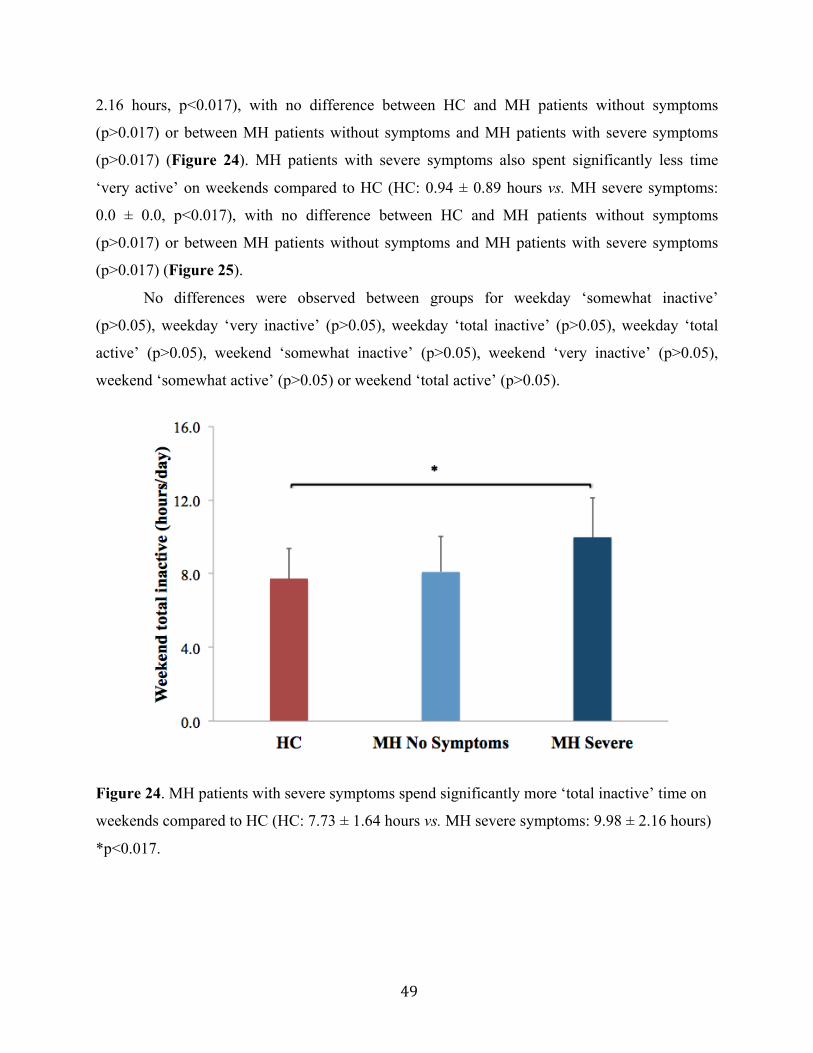
49
2.16 hours, p<0.017), with no difference between HC and MH patients without symptoms
(p>0.017) or between MH patients without symptoms and MH patients with severe symptoms
(p>0.017) (Figure 24). MH patients with severe symptoms also spent significantly less time
‘very active’ on weekends compared to HC (HC: 0.94 ± 0.89 hours vs. MH severe symptoms:
0.0 ± 0.0, p<0.017), with no difference between HC and MH patients without symptoms
(p>0.017) or between MH patients without symptoms and MH patients with severe symptoms
(p>0.017) (Figure 25).
No differences were observed between groups for weekday ‘somewhat inactive’
(p>0.05), weekday ‘very inactive’ (p>0.05), weekday ‘total inactive’ (p>0.05), weekday ‘total
active’ (p>0.05), weekend ‘somewhat inactive’ (p>0.05), weekend ‘very inactive’ (p>0.05),
weekend ‘somewhat active’ (p>0.05) or weekend ‘total active’ (p>0.05).
Figure 24. MH patients with severe symptoms spend significantly more ‘total inactive’ time on
weekends compared to HC (HC: 7.73 ± 1.64 hours vs. MH severe symptoms: 9.98 ± 2.16 hours)
*p<0.017.
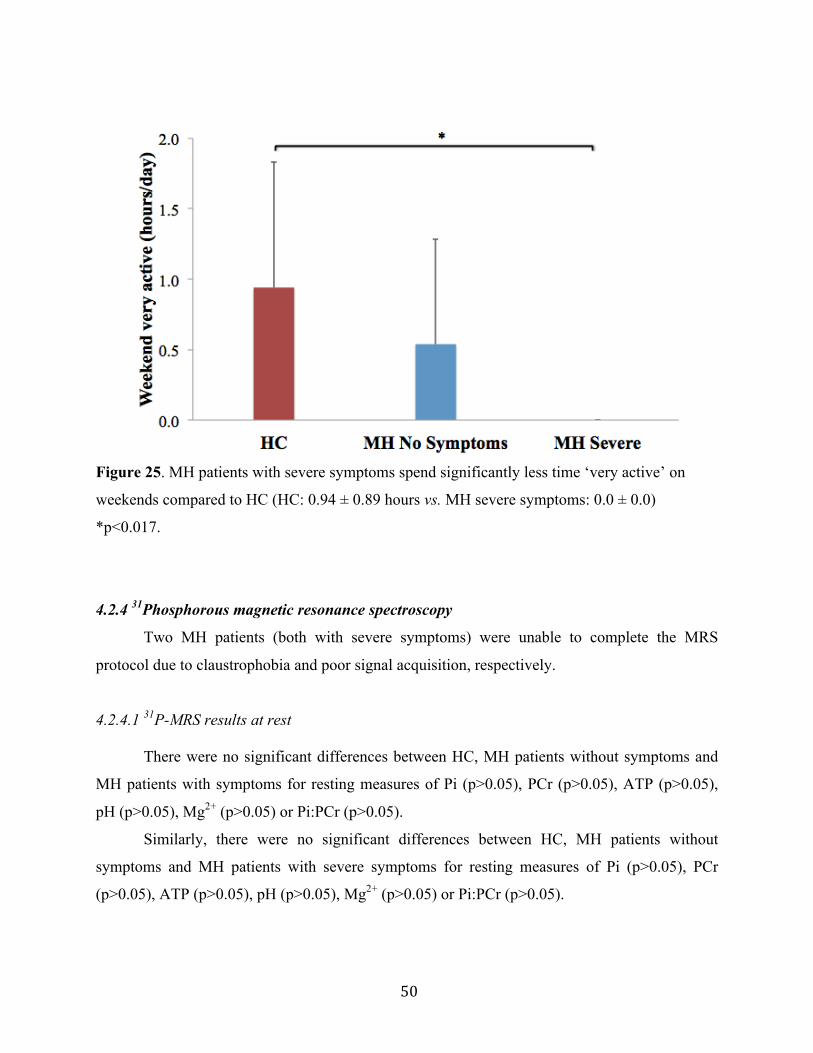
50
Figure 25. MH patients with severe symptoms spend significantly less time ‘very active’ on
weekends compared to HC (HC: 0.94 ± 0.89 hours vs. MH severe symptoms: 0.0 ± 0.0)
*p<0.017.
4.2.4 31Phosphorous magnetic resonance spectroscopy
Two MH patients (both with severe symptoms) were unable to complete the MRS
protocol due to claustrophobia and poor signal acquisition, respectively.
4.2.4.1 31P-MRS results at rest
There were no significant differences between HC, MH patients without symptoms and
MH patients with symptoms for resting measures of Pi (p>0.05), PCr (p>0.05), ATP (p>0.05),
pH (p>0.05), Mg2+ (p>0.05) or Pi:PCr (p>0.05).
Similarly, there were no significant differences between HC, MH patients without
symptoms and MH patients with severe symptoms for resting measures of Pi (p>0.05), PCr
(p>0.05), ATP (p>0.05), pH (p>0.05), Mg2+ (p>0.05) or Pi:PCr (p>0.05).
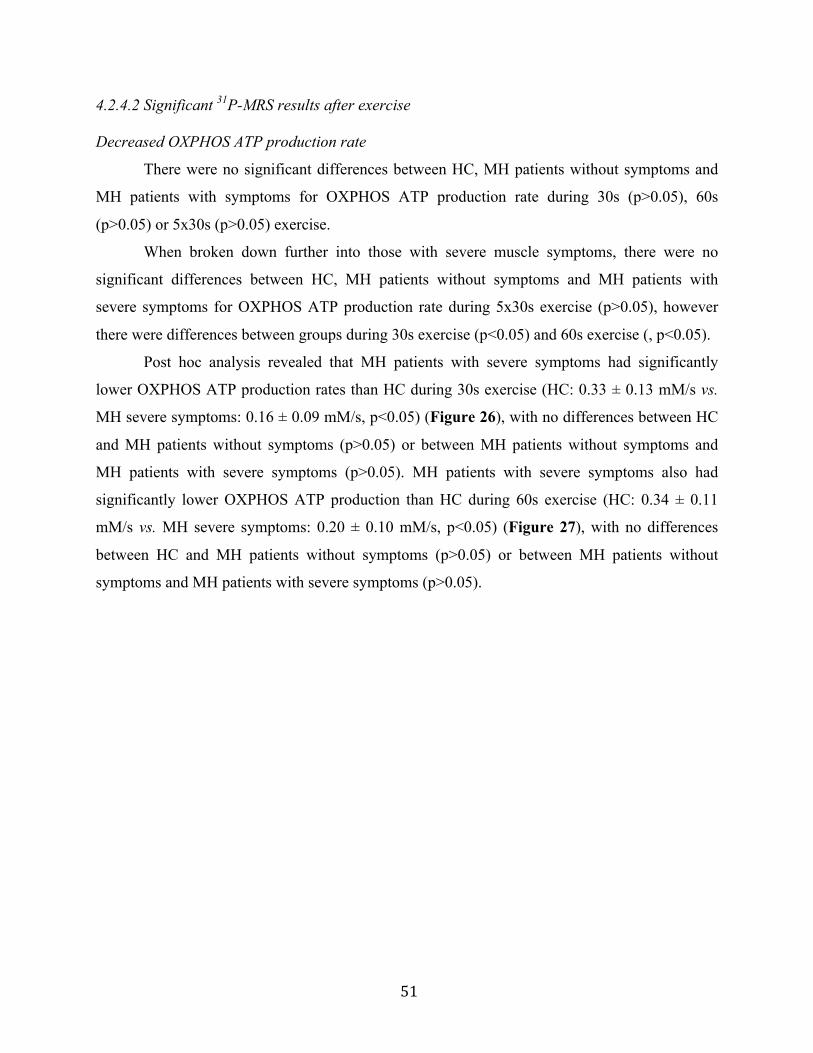
51
4.2.4.2 Significant 31P-MRS results after exercise
Decreased OXPHOS ATP production rate
There were no significant differences between HC, MH patients without symptoms and
MH patients with symptoms for OXPHOS ATP production rate during 30s (p>0.05), 60s
(p>0.05) or 5x30s (p>0.05) exercise.
When broken down further into those with severe muscle symptoms, there were no
significant differences between HC, MH patients without symptoms and MH patients with
severe symptoms for OXPHOS ATP production rate during 5x30s exercise (p>0.05), however
there were differences between groups during 30s exercise (p<0.05) and 60s exercise (, p<0.05).
Post hoc analysis revealed that MH patients with severe symptoms had significantly
lower OXPHOS ATP production rates than HC during 30s exercise (HC: 0.33 ± 0.13 mM/s vs.
MH severe symptoms: 0.16 ± 0.09 mM/s, p<0.05) (Figure 26), with no differences between HC
and MH patients without symptoms (p>0.05) or between MH patients without symptoms and
MH patients with severe symptoms (p>0.05). MH patients with severe symptoms also had
significantly lower OXPHOS ATP production than HC during 60s exercise (HC: 0.34 ± 0.11
mM/s vs. MH severe symptoms: 0.20 ± 0.10 mM/s, p<0.05) (Figure 27), with no differences
between HC and MH patients without symptoms (p>0.05) or between MH patients without
symptoms and MH patients with severe symptoms (p>0.05).
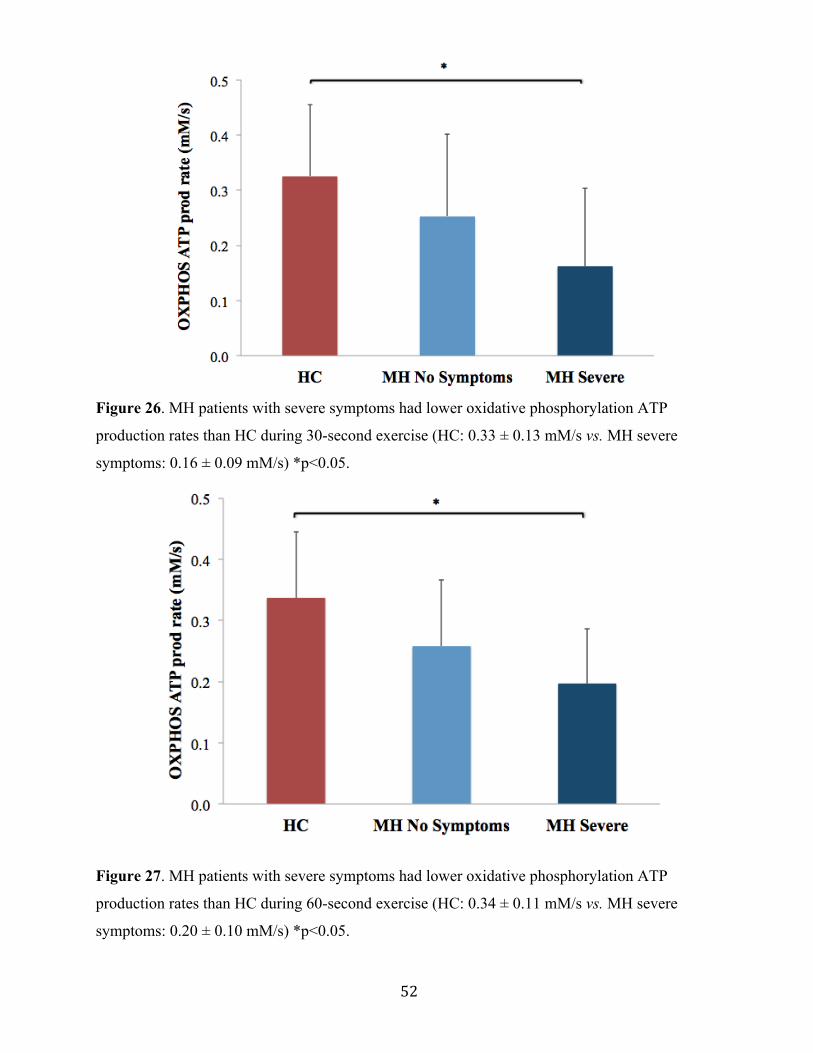
52
Figure 26. MH patients with severe symptoms had lower oxidative phosphorylation ATP
production rates than HC during 30-second exercise (HC: 0.33 ± 0.13 mM/s vs. MH severe
symptoms: 0.16 ± 0.09 mM/s) *p<0.05.
Figure 27. MH patients with severe symptoms had lower oxidative phosphorylation ATP
production rates than HC during 60-second exercise (HC: 0.34 ± 0.11 mM/s vs. MH severe
symptoms: 0.20 ± 0.10 mM/s) *p<0.05.
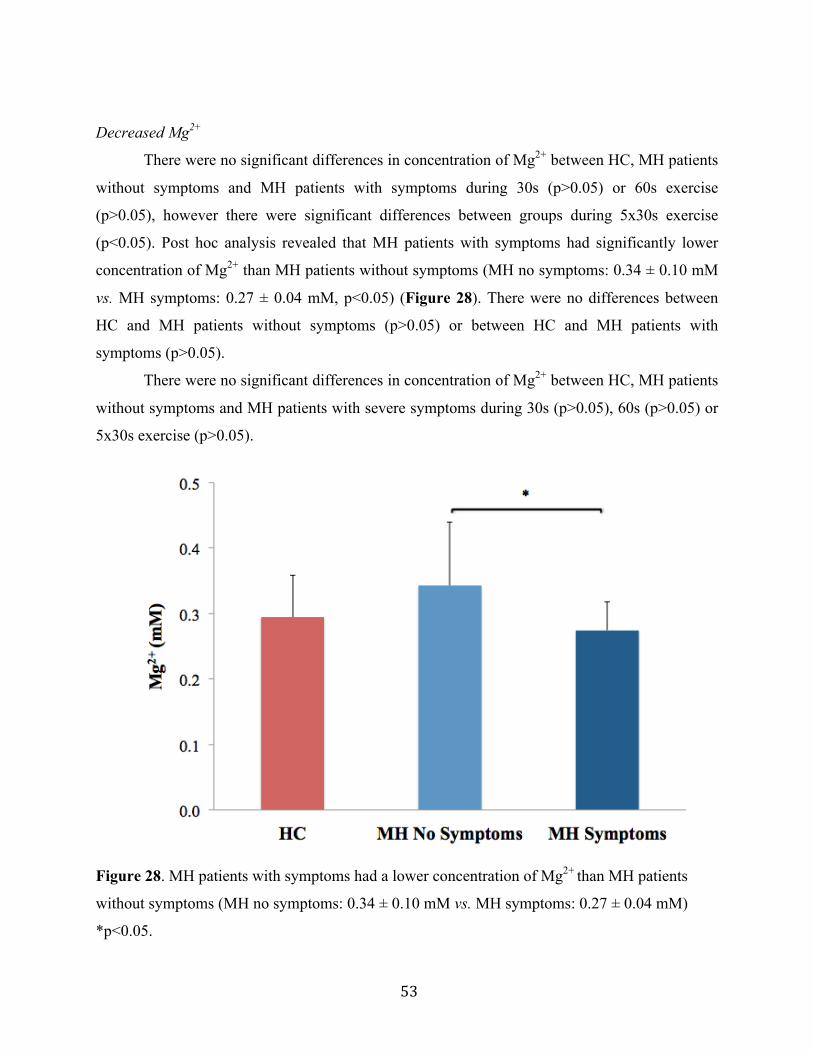
53
Decreased Mg2+
There were no significant differences in concentration of Mg2+ between HC, MH patients
without symptoms and MH patients with symptoms during 30s (p>0.05) or 60s exercise
(p>0.05), however there were significant differences between groups during 5x30s exercise
(p<0.05). Post hoc analysis revealed that MH patients with symptoms had significantly lower
concentration of Mg2+ than MH patients without symptoms (MH no symptoms: 0.34 ± 0.10 mM
vs. MH symptoms: 0.27 ± 0.04 mM, p<0.05) (Figure 28). There were no differences between
HC and MH patients without symptoms (p>0.05) or between HC and MH patients with
symptoms (p>0.05).
There were no significant differences in concentration of Mg2+ between HC, MH patients
without symptoms and MH patients with severe symptoms during 30s (p>0.05), 60s (p>0.05) or
5x30s exercise (p>0.05).
Figure 28. MH patients with symptoms had a lower concentration of Mg2+ than MH patients
without symptoms (MH no symptoms: 0.34 ± 0.10 mM vs. MH symptoms: 0.27 ± 0.04 mM)
*p<0.05.

54
4.2.4.3 Non-significant 31P-MRS results after exercise
Max Pi and Pi:PCr
There were no significant differences between HC, MH patients without symptoms and
MH patients with symptoms for maximum Pi during 30s (p>0.05), 60s (p>0.05) or 5x30s
exercise (p>0.05). Similarly, Pi:PCr was similar between groups during 30s (p>0.05), 60s
(p>0.05) and 5x30s exercise (p>0.05).
Subgroup analysis of symptomatic patients revealed that there were no significant
differences between HC, MH patients without symptoms and MH patients with severe symptoms
for maximum Pi during 30s (p>0.05), 60s (p>0.05) or 5x30s exercise (p>0.05). Similarly, Pi:PCr
was similar between groups during 30s (p>0.05), 60s (p>0.05) and 5x30s exercise (p>0.05).
Change in pH
There were no significant differences in dpH between HC, MH patients without
symptoms and MH patients with symptoms during 30s (p>0.05), 60s (p>0.05) or 5x30s exercise
(p>0.05).
Analysis of symptomatic patients revealed there were no significant differences in dpH
between HC, MH patients without symptoms and MH patients with severe symptoms during 30s
(p>0.05), 60s (p>0.05) or 5x30s exercise (p>0.05).
PCr recovery
There were no significant differences in PCr recovery time constant between HC, MH
patients without symptoms and MH patients with symptoms following 30s (p>0.05), 60s
(p>0.05) or 5x30s (p>0.05) exercise.
Analysis of severely symptomatic patients revealed that there were no significant
differences in PCr recovery between HC, MH patients without symptoms and MH patients with
severe symptoms following 30s (p>0.05), 60s (p>0.05) or 5x30s (p>0.05) exercise.
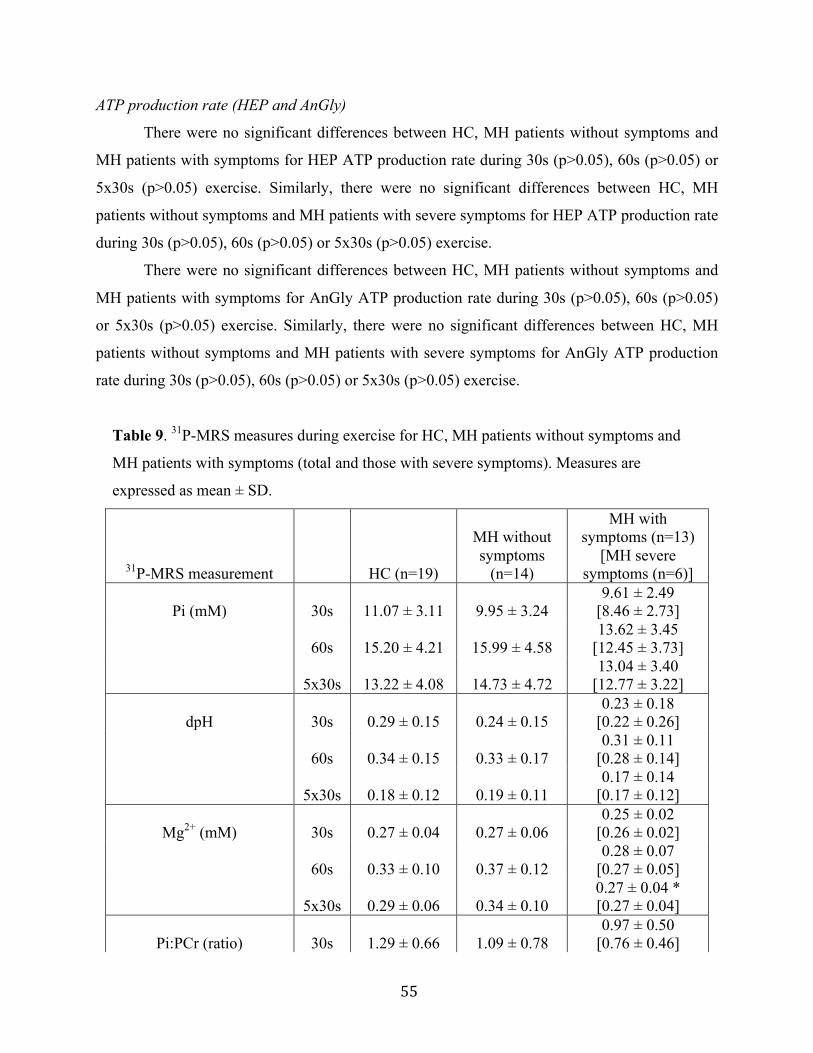
55
ATP production rate (HEP and AnGly)
There were no significant differences between HC, MH patients without symptoms and
MH patients with symptoms for HEP ATP production rate during 30s (p>0.05), 60s (p>0.05) or
5x30s (p>0.05) exercise. Similarly, there were no significant differences between HC, MH
patients without symptoms and MH patients with severe symptoms for HEP ATP production rate
during 30s (p>0.05), 60s (p>0.05) or 5x30s (p>0.05) exercise.
There were no significant differences between HC, MH patients without symptoms and
MH patients with symptoms for AnGly ATP production rate during 30s (p>0.05), 60s (p>0.05)
or 5x30s (p>0.05) exercise. Similarly, there were no significant differences between HC, MH
patients without symptoms and MH patients with severe symptoms for AnGly ATP production
rate during 30s (p>0.05), 60s (p>0.05) or 5x30s (p>0.05) exercise.
Table 9. 31P-MRS measures during exercise for HC, MH patients without symptoms and
MH patients with symptoms (total and those with severe symptoms). Measures are
expressed as mean ± SD.
31P-MRS measurement HC (n=19)
MH without symptoms
(n=14)
MH with symptoms (n=13)
[MH severe symptoms (n=6)]
Pi (mM) 30s 11.07 ± 3.11 9.95 ± 3.24 9.61 ± 2.49
[8.46 ± 2.73]
60s 15.20 ± 4.21 15.99 ± 4.58 13.62 ± 3.45
[12.45 ± 3.73]
5x30s 13.22 ± 4.08 14.73 ± 4.72 13.04 ± 3.40
[12.77 ± 3.22]
dpH 30s 0.29 ± 0.15 0.24 ± 0.15 0.23 ± 0.18
[0.22 ± 0.26]
60s 0.34 ± 0.15 0.33 ± 0.17 0.31 ± 0.11
[0.28 ± 0.14]
5x30s 0.18 ± 0.12 0.19 ± 0.11 0.17 ± 0.14
[0.17 ± 0.12]
Mg2+ (mM) 30s 0.27 ± 0.04 0.27 ± 0.06 0.25 ± 0.02
[0.26 ± 0.02]
60s 0.33 ± 0.10 0.37 ± 0.12 0.28 ± 0.07
[0.27 ± 0.05]
5x30s 0.29 ± 0.06 0.34 ± 0.10 0.27 ± 0.04 * [0.27 ± 0.04]
Pi:PCr (ratio) 30s 1.29 ± 0.66 1.09 ± 0.78 0.97 ± 0.50
[0.76 ± 0.46]
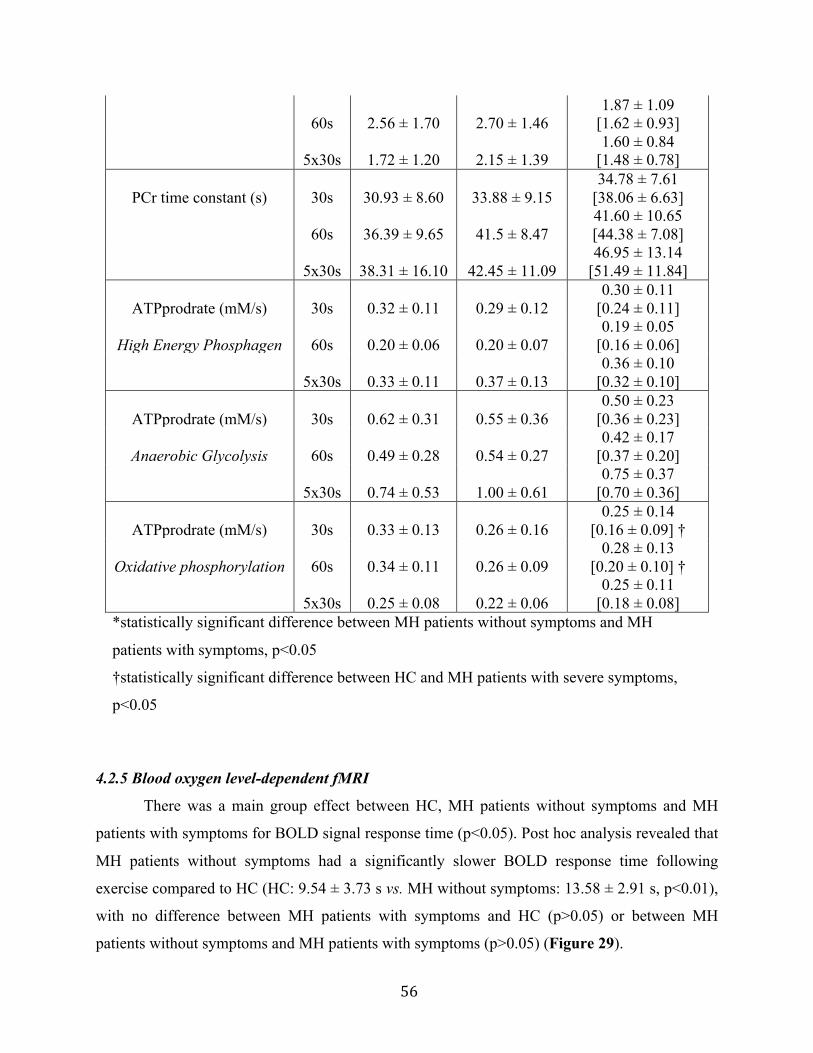
56
60s 2.56 ± 1.70 2.70 ± 1.46 1.87 ± 1.09
[1.62 ± 0.93]
5x30s 1.72 ± 1.20 2.15 ± 1.39 1.60 ± 0.84
[1.48 ± 0.78]
PCr time constant (s) 30s 30.93 ± 8.60 33.88 ± 9.15 34.78 ± 7.61
[38.06 ± 6.63]
60s 36.39 ± 9.65 41.5 ± 8.47 41.60 ± 10.65 [44.38 ± 7.08]
5x30s 38.31 ± 16.10 42.45 ± 11.09 46.95 ± 13.14
[51.49 ± 11.84]
ATPprodrate (mM/s) 30s 0.32 ± 0.11 0.29 ± 0.12 0.30 ± 0.11
[0.24 ± 0.11]
High Energy Phosphagen 60s 0.20 ± 0.06 0.20 ± 0.07 0.19 ± 0.05
[0.16 ± 0.06]
5x30s 0.33 ± 0.11 0.37 ± 0.13 0.36 ± 0.10
[0.32 ± 0.10]
ATPprodrate (mM/s) 30s 0.62 ± 0.31 0.55 ± 0.36 0.50 ± 0.23
[0.36 ± 0.23]
Anaerobic Glycolysis 60s 0.49 ± 0.28 0.54 ± 0.27 0.42 ± 0.17
[0.37 ± 0.20]
5x30s 0.74 ± 0.53 1.00 ± 0.61 0.75 ± 0.37
[0.70 ± 0.36]
ATPprodrate (mM/s) 30s 0.33 ± 0.13 0.26 ± 0.16 0.25 ± 0.14
[0.16 ± 0.09] †
Oxidative phosphorylation 60s 0.34 ± 0.11 0.26 ± 0.09 0.28 ± 0.13
[0.20 ± 0.10] †
5x30s 0.25 ± 0.08 0.22 ± 0.06 0.25 ± 0.11
[0.18 ± 0.08] *statistically significant difference between MH patients without symptoms and MH
patients with symptoms, p<0.05
†statistically significant difference between HC and MH patients with severe symptoms,
p<0.05
4.2.5 Blood oxygen level-dependent fMRI
There was a main group effect between HC, MH patients without symptoms and MH
patients with symptoms for BOLD signal response time (p<0.05). Post hoc analysis revealed that
MH patients without symptoms had a significantly slower BOLD response time following
exercise compared to HC (HC: 9.54 ± 3.73 s vs. MH without symptoms: 13.58 ± 2.91 s, p<0.01),
with no difference between MH patients with symptoms and HC (p>0.05) or between MH
patients without symptoms and MH patients with symptoms (p>0.05) (Figure 29).
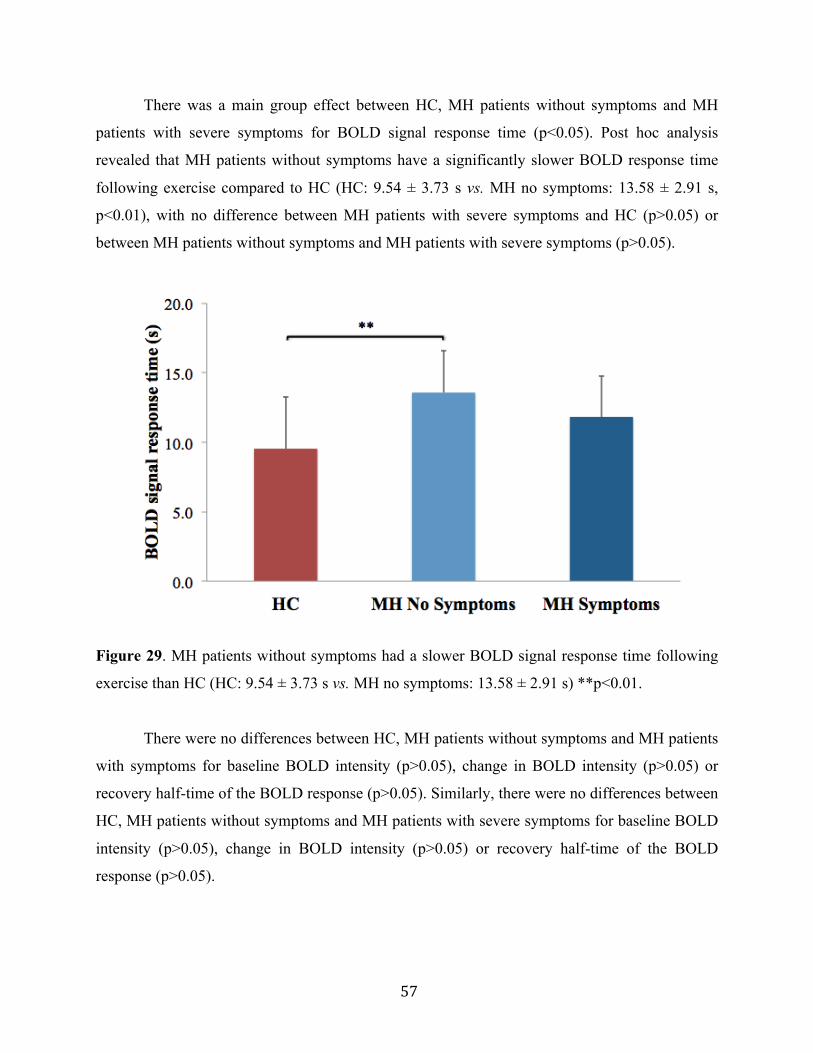
57
There was a main group effect between HC, MH patients without symptoms and MH
patients with severe symptoms for BOLD signal response time (p<0.05). Post hoc analysis
revealed that MH patients without symptoms have a significantly slower BOLD response time
following exercise compared to HC (HC: 9.54 ± 3.73 s vs. MH no symptoms: 13.58 ± 2.91 s,
p<0.01), with no difference between MH patients with severe symptoms and HC (p>0.05) or
between MH patients without symptoms and MH patients with severe symptoms (p>0.05).
Figure 29. MH patients without symptoms had a slower BOLD signal response time following
exercise than HC (HC: 9.54 ± 3.73 s vs. MH no symptoms: 13.58 ± 2.91 s) **p<0.01.
There were no differences between HC, MH patients without symptoms and MH patients
with symptoms for baseline BOLD intensity (p>0.05), change in BOLD intensity (p>0.05) or
recovery half-time of the BOLD response (p>0.05). Similarly, there were no differences between
HC, MH patients without symptoms and MH patients with severe symptoms for baseline BOLD
intensity (p>0.05), change in BOLD intensity (p>0.05) or recovery half-time of the BOLD
response (p>0.05).
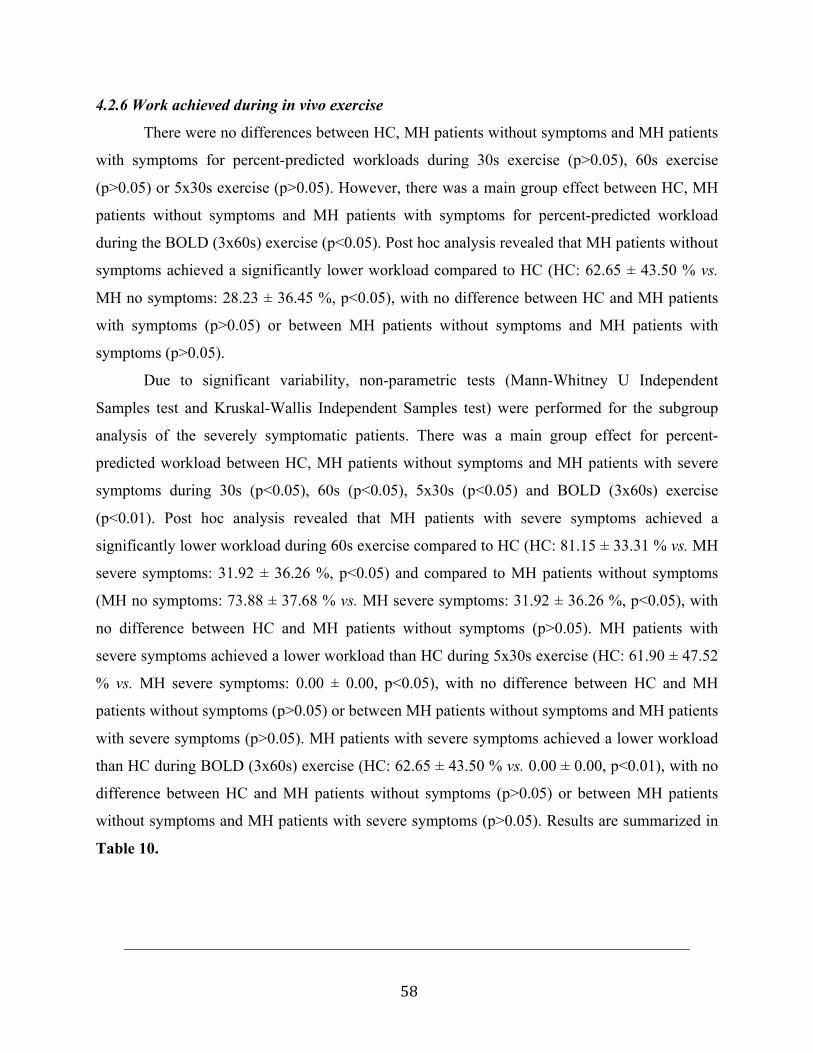
58
4.2.6 Work achieved during in vivo exercise
There were no differences between HC, MH patients without symptoms and MH patients
with symptoms for percent-predicted workloads during 30s exercise (p>0.05), 60s exercise
(p>0.05) or 5x30s exercise (p>0.05). However, there was a main group effect between HC, MH
patients without symptoms and MH patients with symptoms for percent-predicted workload
during the BOLD (3x60s) exercise (p<0.05). Post hoc analysis revealed that MH patients without
symptoms achieved a significantly lower workload compared to HC (HC: 62.65 ± 43.50 % vs.
MH no symptoms: 28.23 ± 36.45 %, p<0.05), with no difference between HC and MH patients
with symptoms (p>0.05) or between MH patients without symptoms and MH patients with
symptoms (p>0.05).
Due to significant variability, non-parametric tests (Mann-Whitney U Independent
Samples test and Kruskal-Wallis Independent Samples test) were performed for the subgroup
analysis of the severely symptomatic patients. There was a main group effect for percent-
predicted workload between HC, MH patients without symptoms and MH patients with severe
symptoms during 30s (p<0.05), 60s (p<0.05), 5x30s (p<0.05) and BOLD (3x60s) exercise
(p<0.01). Post hoc analysis revealed that MH patients with severe symptoms achieved a
significantly lower workload during 60s exercise compared to HC (HC: 81.15 ± 33.31 % vs. MH
severe symptoms: 31.92 ± 36.26 %, p<0.05) and compared to MH patients without symptoms
(MH no symptoms: 73.88 ± 37.68 % vs. MH severe symptoms: 31.92 ± 36.26 %, p<0.05), with
no difference between HC and MH patients without symptoms (p>0.05). MH patients with
severe symptoms achieved a lower workload than HC during 5x30s exercise (HC: 61.90 ± 47.52
% vs. MH severe symptoms: 0.00 ± 0.00, p<0.05), with no difference between HC and MH
patients without symptoms (p>0.05) or between MH patients without symptoms and MH patients
with severe symptoms (p>0.05). MH patients with severe symptoms achieved a lower workload
than HC during BOLD (3x60s) exercise (HC: 62.65 ± 43.50 % vs. 0.00 ± 0.00, p<0.01), with no
difference between HC and MH patients without symptoms (p>0.05) or between MH patients
without symptoms and MH patients with severe symptoms (p>0.05). Results are summarized in
Table 10.
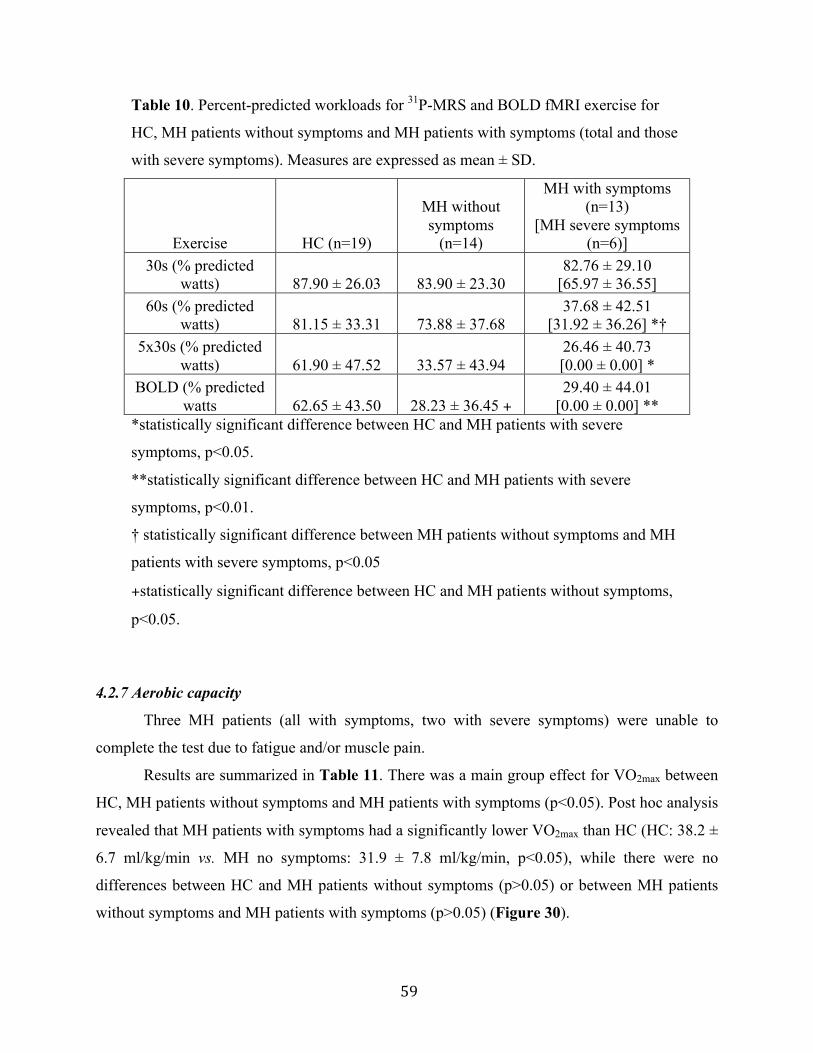
59
Table 10. Percent-predicted workloads for 31P-MRS and BOLD fMRI exercise for
HC, MH patients without symptoms and MH patients with symptoms (total and those
with severe symptoms). Measures are expressed as mean ± SD.
Exercise HC (n=19)
MH without symptoms
(n=14)
MH with symptoms (n=13)
[MH severe symptoms (n=6)]
30s (% predicted watts) 87.90 ± 26.03 83.90 ± 23.30
82.76 ± 29.10 [65.97 ± 36.55]
60s (% predicted watts) 81.15 ± 33.31 73.88 ± 37.68
37.68 ± 42.51 [31.92 ± 36.26] *†
5x30s (% predicted watts) 61.90 ± 47.52 33.57 ± 43.94
26.46 ± 40.73 [0.00 ± 0.00] *
BOLD (% predicted watts 62.65 ± 43.50 28.23 ± 36.45 +
29.40 ± 44.01 [0.00 ± 0.00] **
*statistically significant difference between HC and MH patients with severe
symptoms, p<0.05.
**statistically significant difference between HC and MH patients with severe
symptoms, p<0.01.
† statistically significant difference between MH patients without symptoms and MH
patients with severe symptoms, p<0.05
+statistically significant difference between HC and MH patients without symptoms,
p<0.05.
4.2.7 Aerobic capacity
Three MH patients (all with symptoms, two with severe symptoms) were unable to
complete the test due to fatigue and/or muscle pain.
Results are summarized in Table 11. There was a main group effect for VO2max between
HC, MH patients without symptoms and MH patients with symptoms (p<0.05). Post hoc analysis
revealed that MH patients with symptoms had a significantly lower VO2max than HC (HC: 38.2 ±
6.7 ml/kg/min vs. MH no symptoms: 31.9 ± 7.8 ml/kg/min, p<0.05), while there were no
differences between HC and MH patients without symptoms (p>0.05) or between MH patients
without symptoms and MH patients with symptoms (p>0.05) (Figure 30).
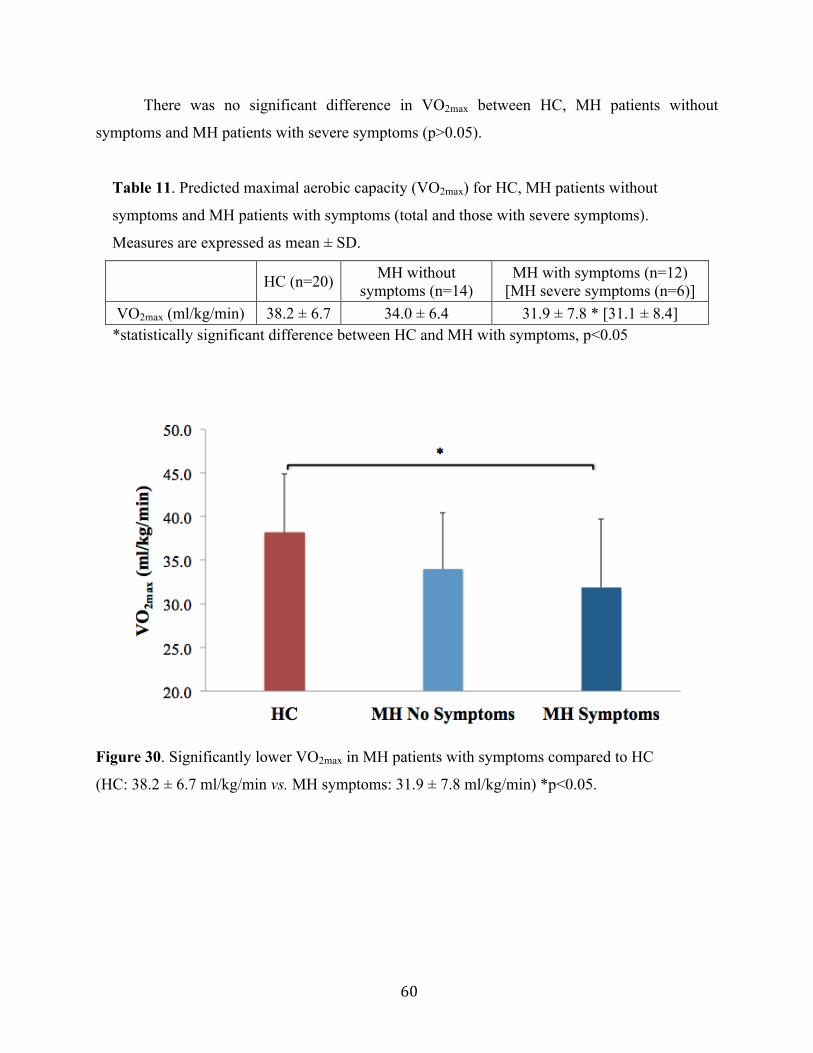
60
There was no significant difference in VO2max between HC, MH patients without
symptoms and MH patients with severe symptoms (p>0.05).
Table 11. Predicted maximal aerobic capacity (VO2max) for HC, MH patients without
symptoms and MH patients with symptoms (total and those with severe symptoms).
Measures are expressed as mean ± SD.
HC (n=20) MH without symptoms (n=14)
MH with symptoms (n=12) [MH severe symptoms (n=6)]
VO2max (ml/kg/min) 38.2 ± 6.7 34.0 ± 6.4 31.9 ± 7.8 * [31.1 ± 8.4] *statistically significant difference between HC and MH with symptoms, p<0.05
Figure 30. Significantly lower VO2max in MH patients with symptoms compared to HC
(HC: 38.2 ± 6.7 ml/kg/min vs. MH symptoms: 31.9 ± 7.8 ml/kg/min) *p<0.05.
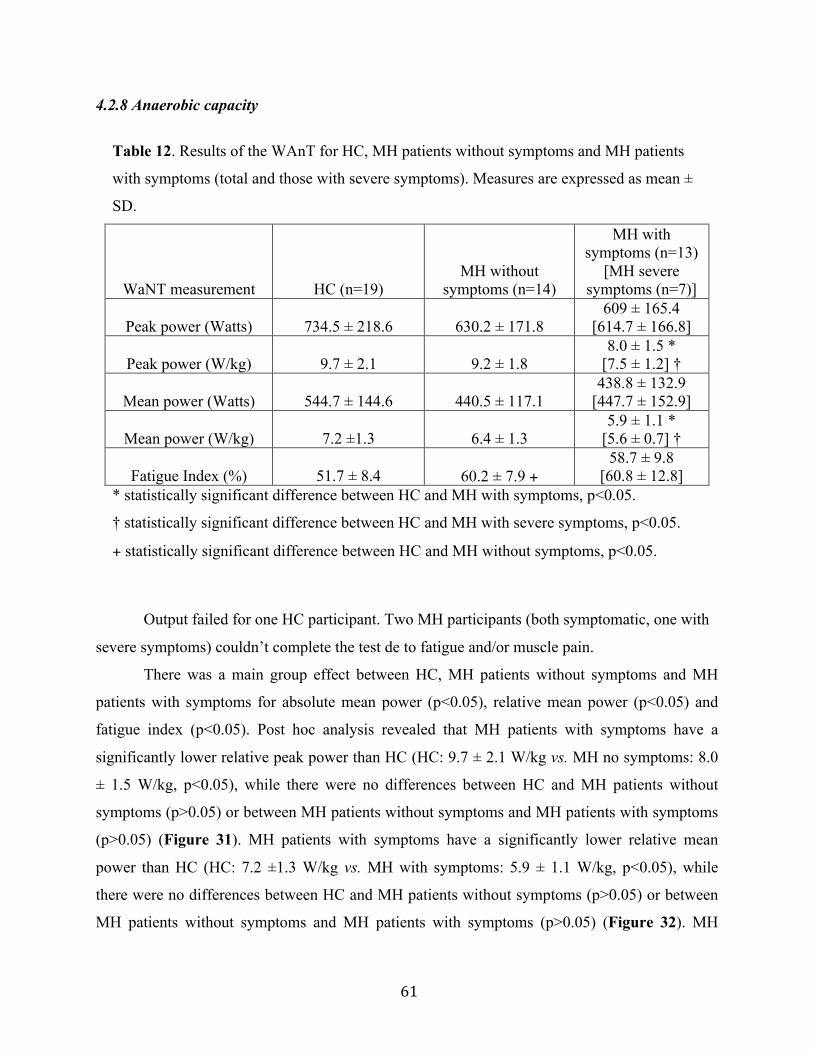
61
4.2.8 Anaerobic capacity
Table 12. Results of the WAnT for HC, MH patients without symptoms and MH patients
with symptoms (total and those with severe symptoms). Measures are expressed as mean ±
SD.
WaNT measurement HC (n=19) MH without
symptoms (n=14)
MH with symptoms (n=13)
[MH severe symptoms (n=7)]
Peak power (Watts) 734.5 ± 218.6 630.2 ± 171.8 609 ± 165.4
[614.7 ± 166.8]
Peak power (W/kg) 9.7 ± 2.1 9.2 ± 1.8 8.0 ± 1.5 *
[7.5 ± 1.2] †
Mean power (Watts) 544.7 ± 144.6 440.5 ± 117.1 438.8 ± 132.9
[447.7 ± 152.9]
Mean power (W/kg) 7.2 ±1.3 6.4 ± 1.3 5.9 ± 1.1 *
[5.6 ± 0.7] †
Fatigue Index (%) 51.7 ± 8.4 60.2 ± 7.9 + 58.7 ± 9.8
[60.8 ± 12.8] * statistically significant difference between HC and MH with symptoms, p<0.05.
† statistically significant difference between HC and MH with severe symptoms, p<0.05.
+ statistically significant difference between HC and MH without symptoms, p<0.05.
Output failed for one HC participant. Two MH participants (both symptomatic, one with
severe symptoms) couldn’t complete the test de to fatigue and/or muscle pain.
There was a main group effect between HC, MH patients without symptoms and MH
patients with symptoms for absolute mean power (p<0.05), relative mean power (p<0.05) and
fatigue index (p<0.05). Post hoc analysis revealed that MH patients with symptoms have a
significantly lower relative peak power than HC (HC: 9.7 ± 2.1 W/kg vs. MH no symptoms: 8.0
± 1.5 W/kg, p<0.05), while there were no differences between HC and MH patients without
symptoms (p>0.05) or between MH patients without symptoms and MH patients with symptoms
(p>0.05) (Figure 31). MH patients with symptoms have a significantly lower relative mean
power than HC (HC: 7.2 ±1.3 W/kg vs. MH with symptoms: 5.9 ± 1.1 W/kg, p<0.05), while
there were no differences between HC and MH patients without symptoms (p>0.05) or between
MH patients without symptoms and MH patients with symptoms (p>0.05) (Figure 32). MH

62
patients without symptoms have a significantly higher fatigue index than HC (HC: 51.7 ± 8.4 %
vs. MH no symptoms: 60.2 ± 7.9 %, p<0.05), while there were no differences between HC and
MH patients with symptoms (p>0.05) or between MH patients without symptoms and MH
patients with symptoms (p>0.05) (Figure 33).
Figure 31. MH patients with symptoms had lower relative peak power than HC (HC: 9.7 ± 2.1
W/kg vs. MH symptoms: 8.0 ± 1.5 W/kg) *p<0.05.

63
Figure 32. MH patients with symptoms had lower relative mean power than HC (HC: 7.2 ± 1.3
W/kg vs. MH symptoms: 5.9 ± 1.1 W/kg) *p<0.05.
Figure 33. MH patients without symptoms had higher fatigue index than HC (HC: 51.7 ± 8.4 %
vs. MH no symptoms: 60.2 ± 7.9 %) *p<0.05.
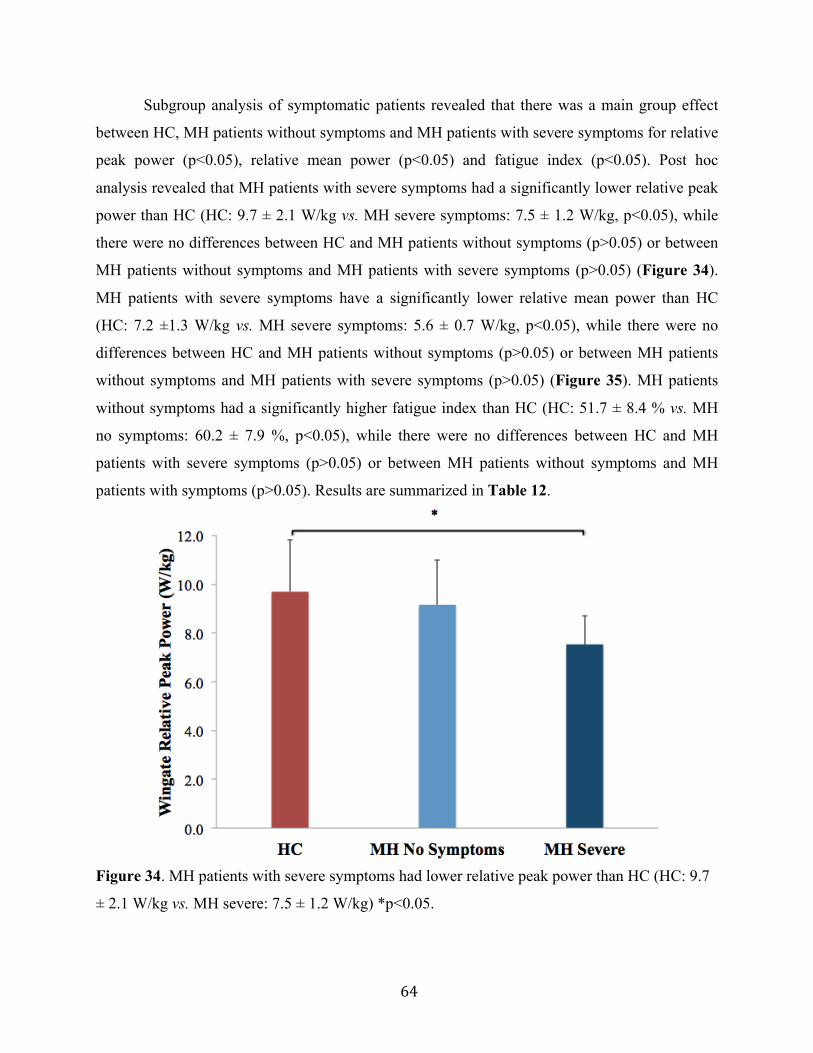
64
Subgroup analysis of symptomatic patients revealed that there was a main group effect
between HC, MH patients without symptoms and MH patients with severe symptoms for relative
peak power (p<0.05), relative mean power (p<0.05) and fatigue index (p<0.05). Post hoc
analysis revealed that MH patients with severe symptoms had a significantly lower relative peak
power than HC (HC: 9.7 ± 2.1 W/kg vs. MH severe symptoms: 7.5 ± 1.2 W/kg, p<0.05), while
there were no differences between HC and MH patients without symptoms (p>0.05) or between
MH patients without symptoms and MH patients with severe symptoms (p>0.05) (Figure 34).
MH patients with severe symptoms have a significantly lower relative mean power than HC
(HC: 7.2 ±1.3 W/kg vs. MH severe symptoms: 5.6 ± 0.7 W/kg, p<0.05), while there were no
differences between HC and MH patients without symptoms (p>0.05) or between MH patients
without symptoms and MH patients with severe symptoms (p>0.05) (Figure 35). MH patients
without symptoms had a significantly higher fatigue index than HC (HC: 51.7 ± 8.4 % vs. MH
no symptoms: 60.2 ± 7.9 %, p<0.05), while there were no differences between HC and MH
patients with severe symptoms (p>0.05) or between MH patients without symptoms and MH
patients with symptoms (p>0.05). Results are summarized in Table 12.
Figure 34. MH patients with severe symptoms had lower relative peak power than HC (HC: 9.7
± 2.1 W/kg vs. MH severe: 7.5 ± 1.2 W/kg) *p<0.05.

65
Figure 35. MH patients with severe symptoms had lower relative mean power than HC
(HC: 7.2 ± 1.3 W/kg vs. MH severe: 5.6 ± 0.7 W/kg) *p<0.05.
4.2.9 Upper and lower body strength
There were no significant differences between HC, MH patients without symptoms
and MH patients with symptoms for handgrip strength (p>0.05), vertical jump height
(p>0.05) and Sayers Peak Power (p>0.05). Similarly, there were no significant differences
between HC, MH patients without symptoms and MH patients with severe symptoms for
handgrip strength (p>0.05), vertical jump height (p>0.05) and Sayers Peak Power
(p>0.05). Results are summarized in Table 13.
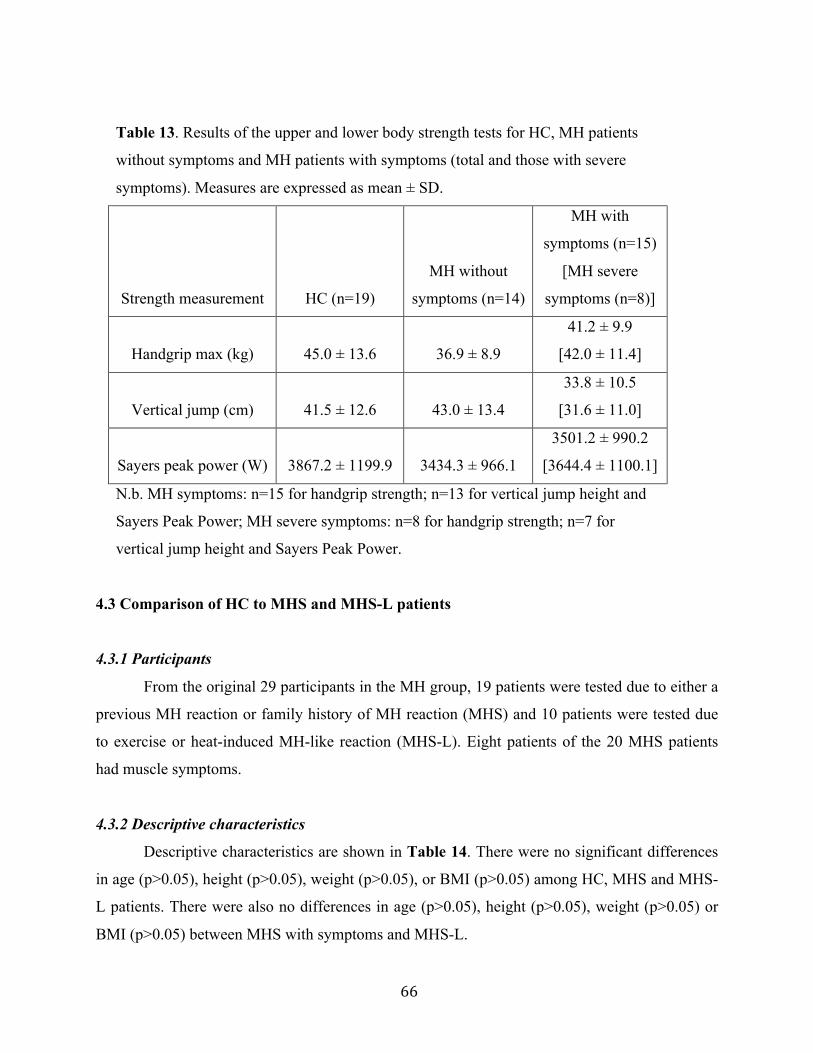
66
Table 13. Results of the upper and lower body strength tests for HC, MH patients
without symptoms and MH patients with symptoms (total and those with severe
symptoms). Measures are expressed as mean ± SD.
Strength measurement HC (n=19)
MH without
symptoms (n=14)
MH with
symptoms (n=15)
[MH severe
symptoms (n=8)]
Handgrip max (kg) 45.0 ± 13.6 36.9 ± 8.9
41.2 ± 9.9
[42.0 ± 11.4]
Vertical jump (cm) 41.5 ± 12.6 43.0 ± 13.4
33.8 ± 10.5
[31.6 ± 11.0]
Sayers peak power (W) 3867.2 ± 1199.9 3434.3 ± 966.1
3501.2 ± 990.2
[3644.4 ± 1100.1]
N.b. MH symptoms: n=15 for handgrip strength; n=13 for vertical jump height and
Sayers Peak Power; MH severe symptoms: n=8 for handgrip strength; n=7 for
vertical jump height and Sayers Peak Power.
4.3 Comparison of HC to MHS and MHS-L patients
4.3.1 Participants
From the original 29 participants in the MH group, 19 patients were tested due to either a
previous MH reaction or family history of MH reaction (MHS) and 10 patients were tested due
to exercise or heat-induced MH-like reaction (MHS-L). Eight patients of the 20 MHS patients
had muscle symptoms.
4.3.2 Descriptive characteristics
Descriptive characteristics are shown in Table 14. There were no significant differences
in age (p>0.05), height (p>0.05), weight (p>0.05), or BMI (p>0.05) among HC, MHS and MHS-
L patients. There were also no differences in age (p>0.05), height (p>0.05), weight (p>0.05) or
BMI (p>0.05) between MHS with symptoms and MHS-L.
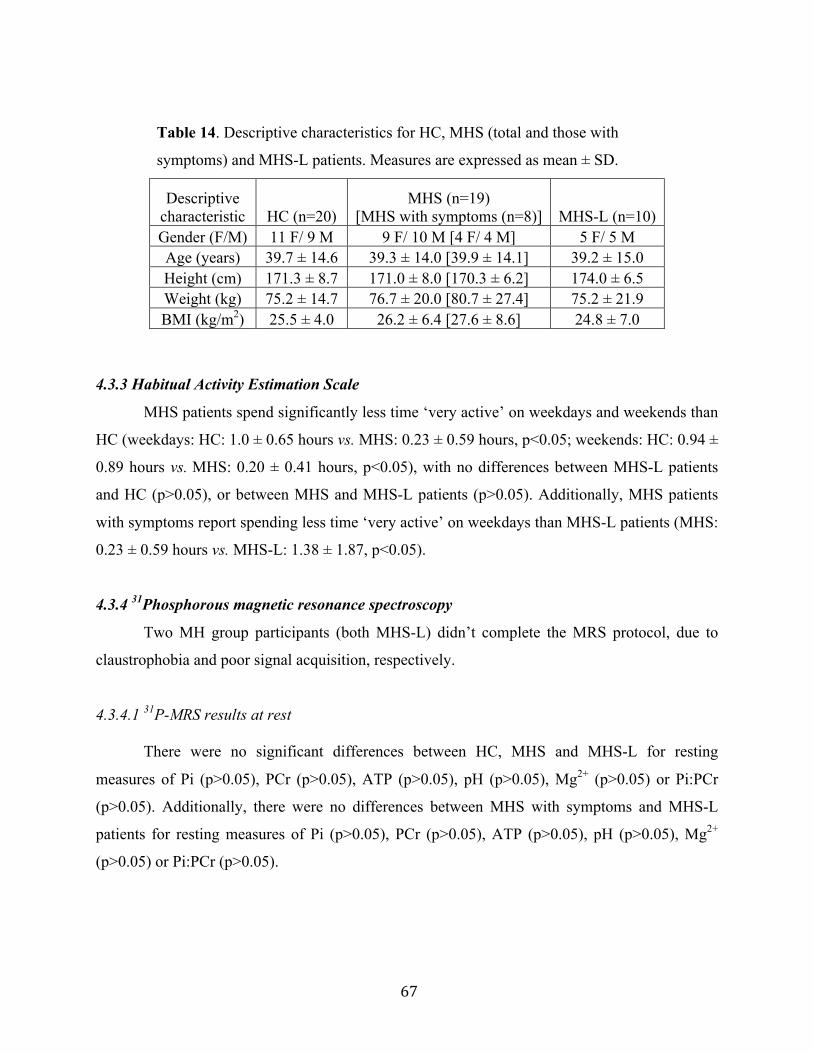
67
Table 14. Descriptive characteristics for HC, MHS (total and those with
symptoms) and MHS-L patients. Measures are expressed as mean ± SD.
Descriptive characteristic HC (n=20)
MHS (n=19) [MHS with symptoms (n=8)] MHS-L (n=10)
Gender (F/M) 11 F/ 9 M 9 F/ 10 M [4 F/ 4 M] 5 F/ 5 M Age (years) 39.7 ± 14.6 39.3 ± 14.0 [39.9 ± 14.1] 39.2 ± 15.0 Height (cm) 171.3 ± 8.7 171.0 ± 8.0 [170.3 ± 6.2] 174.0 ± 6.5 Weight (kg) 75.2 ± 14.7 76.7 ± 20.0 [80.7 ± 27.4] 75.2 ± 21.9 BMI (kg/m2) 25.5 ± 4.0 26.2 ± 6.4 [27.6 ± 8.6] 24.8 ± 7.0
4.3.3 Habitual Activity Estimation Scale
MHS patients spend significantly less time ‘very active’ on weekdays and weekends than
HC (weekdays: HC: 1.0 ± 0.65 hours vs. MHS: 0.23 ± 0.59 hours, p<0.05; weekends: HC: 0.94 ±
0.89 hours vs. MHS: 0.20 ± 0.41 hours, p<0.05), with no differences between MHS-L patients
and HC (p>0.05), or between MHS and MHS-L patients (p>0.05). Additionally, MHS patients
with symptoms report spending less time ‘very active’ on weekdays than MHS-L patients (MHS:
0.23 ± 0.59 hours vs. MHS-L: 1.38 ± 1.87, p<0.05).
4.3.4 31Phosphorous magnetic resonance spectroscopy
Two MH group participants (both MHS-L) didn’t complete the MRS protocol, due to
claustrophobia and poor signal acquisition, respectively.
4.3.4.1 31P-MRS results at rest
There were no significant differences between HC, MHS and MHS-L for resting
measures of Pi (p>0.05), PCr (p>0.05), ATP (p>0.05), pH (p>0.05), Mg2+ (p>0.05) or Pi:PCr
(p>0.05). Additionally, there were no differences between MHS with symptoms and MHS-L
patients for resting measures of Pi (p>0.05), PCr (p>0.05), ATP (p>0.05), pH (p>0.05), Mg2+
(p>0.05) or Pi:PCr (p>0.05).
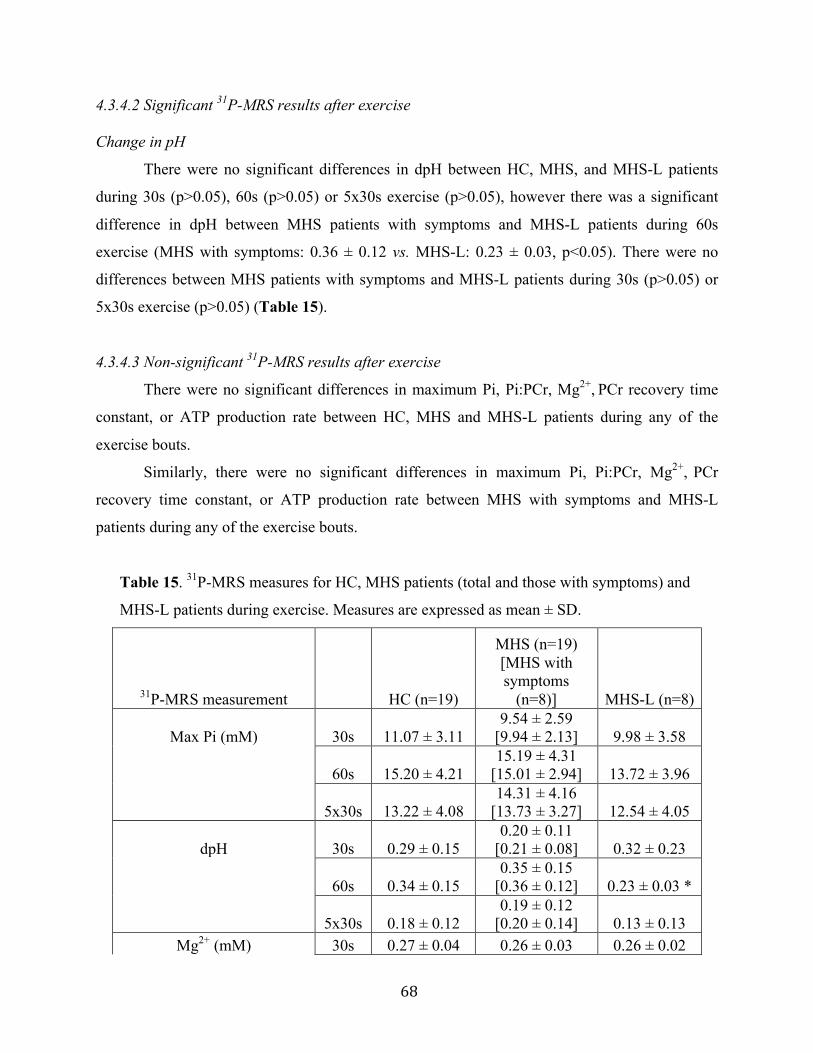
68
4.3.4.2 Significant 31P-MRS results after exercise
Change in pH
There were no significant differences in dpH between HC, MHS, and MHS-L patients
during 30s (p>0.05), 60s (p>0.05) or 5x30s exercise (p>0.05), however there was a significant
difference in dpH between MHS patients with symptoms and MHS-L patients during 60s
exercise (MHS with symptoms: 0.36 ± 0.12 vs. MHS-L: 0.23 ± 0.03, p<0.05). There were no
differences between MHS patients with symptoms and MHS-L patients during 30s (p>0.05) or
5x30s exercise (p>0.05) (Table 15).
4.3.4.3 Non-significant 31P-MRS results after exercise
There were no significant differences in maximum Pi, Pi:PCr, Mg2+, PCr recovery time
constant, or ATP production rate between HC, MHS and MHS-L patients during any of the
exercise bouts.
Similarly, there were no significant differences in maximum Pi, Pi:PCr, Mg2+, PCr
recovery time constant, or ATP production rate between MHS with symptoms and MHS-L
patients during any of the exercise bouts.
Table 15. 31P-MRS measures for HC, MHS patients (total and those with symptoms) and
MHS-L patients during exercise. Measures are expressed as mean ± SD.
31P-MRS measurement HC (n=19)
MHS (n=19) [MHS with symptoms
(n=8)] MHS-L (n=8)
Max Pi (mM) 30s 11.07 ± 3.11 9.54 ± 2.59
[9.94 ± 2.13] 9.98 ± 3.58
60s 15.20 ± 4.21 15.19 ± 4.31
[15.01 ± 2.94] 13.72 ± 3.96
5x30s 13.22 ± 4.08 14.31 ± 4.16
[13.73 ± 3.27] 12.54 ± 4.05
dpH 30s 0.29 ± 0.15 0.20 ± 0.11
[0.21 ± 0.08] 0.32 ± 0.23
60s 0.34 ± 0.15 0.35 ± 0.15
[0.36 ± 0.12] 0.23 ± 0.03 *
5x30s 0.18 ± 0.12 0.19 ± 0.12
[0.20 ± 0.14] 0.13 ± 0.13 Mg2+ (mM) 30s 0.27 ± 0.04 0.26 ± 0.03 0.26 ± 0.02
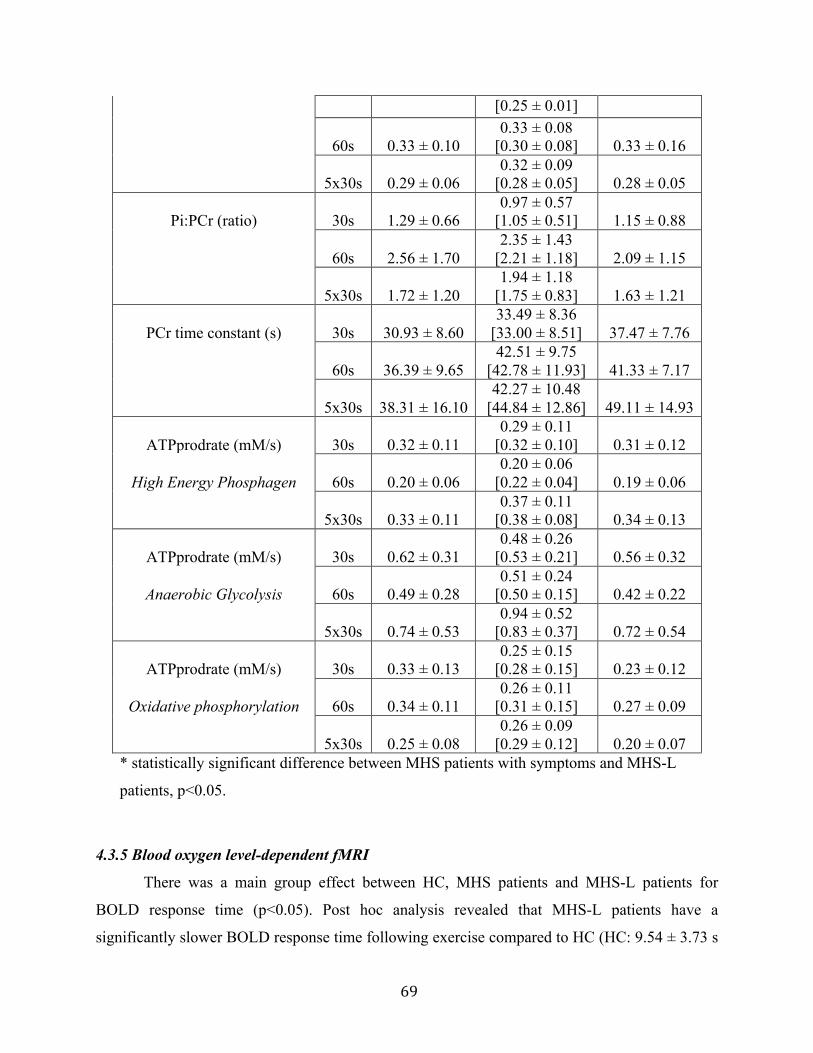
69
[0.25 ± 0.01]
60s 0.33 ± 0.10 0.33 ± 0.08
[0.30 ± 0.08] 0.33 ± 0.16
5x30s 0.29 ± 0.06 0.32 ± 0.09
[0.28 ± 0.05] 0.28 ± 0.05
Pi:PCr (ratio) 30s 1.29 ± 0.66 0.97 ± 0.57
[1.05 ± 0.51] 1.15 ± 0.88
60s 2.56 ± 1.70 2.35 ± 1.43
[2.21 ± 1.18] 2.09 ± 1.15
5x30s 1.72 ± 1.20 1.94 ± 1.18
[1.75 ± 0.83] 1.63 ± 1.21
PCr time constant (s) 30s 30.93 ± 8.60 33.49 ± 8.36
[33.00 ± 8.51] 37.47 ± 7.76
60s 36.39 ± 9.65 42.51 ± 9.75
[42.78 ± 11.93] 41.33 ± 7.17
5x30s 38.31 ± 16.10 42.27 ± 10.48
[44.84 ± 12.86] 49.11 ± 14.93
ATPprodrate (mM/s) 30s 0.32 ± 0.11 0.29 ± 0.11
[0.32 ± 0.10] 0.31 ± 0.12
High Energy Phosphagen 60s 0.20 ± 0.06 0.20 ± 0.06
[0.22 ± 0.04] 0.19 ± 0.06
5x30s 0.33 ± 0.11 0.37 ± 0.11
[0.38 ± 0.08] 0.34 ± 0.13
ATPprodrate (mM/s) 30s 0.62 ± 0.31 0.48 ± 0.26
[0.53 ± 0.21] 0.56 ± 0.32
Anaerobic Glycolysis 60s 0.49 ± 0.28 0.51 ± 0.24
[0.50 ± 0.15] 0.42 ± 0.22
5x30s 0.74 ± 0.53 0.94 ± 0.52
[0.83 ± 0.37] 0.72 ± 0.54
ATPprodrate (mM/s) 30s 0.33 ± 0.13 0.25 ± 0.15
[0.28 ± 0.15] 0.23 ± 0.12
Oxidative phosphorylation 60s 0.34 ± 0.11 0.26 ± 0.11
[0.31 ± 0.15] 0.27 ± 0.09
5x30s 0.25 ± 0.08 0.26 ± 0.09
[0.29 ± 0.12] 0.20 ± 0.07 * statistically significant difference between MHS patients with symptoms and MHS-L
patients, p<0.05.
4.3.5 Blood oxygen level-dependent fMRI
There was a main group effect between HC, MHS patients and MHS-L patients for
BOLD response time (p<0.05). Post hoc analysis revealed that MHS-L patients have a
significantly slower BOLD response time following exercise compared to HC (HC: 9.54 ± 3.73 s
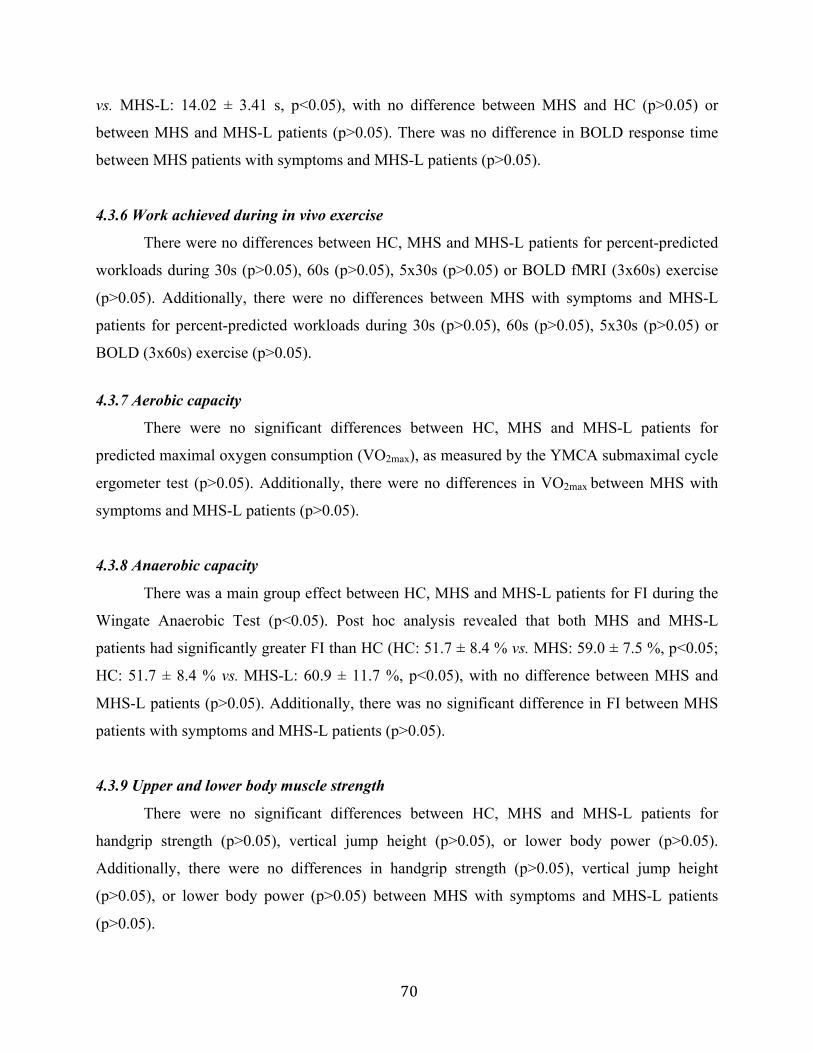
70
vs. MHS-L: 14.02 ± 3.41 s, p<0.05), with no difference between MHS and HC (p>0.05) or
between MHS and MHS-L patients (p>0.05). There was no difference in BOLD response time
between MHS patients with symptoms and MHS-L patients (p>0.05).
4.3.6 Work achieved during in vivo exercise
There were no differences between HC, MHS and MHS-L patients for percent-predicted
workloads during 30s (p>0.05), 60s (p>0.05), 5x30s (p>0.05) or BOLD fMRI (3x60s) exercise
(p>0.05). Additionally, there were no differences between MHS with symptoms and MHS-L
patients for percent-predicted workloads during 30s (p>0.05), 60s (p>0.05), 5x30s (p>0.05) or
BOLD (3x60s) exercise (p>0.05).
4.3.7 Aerobic capacity
There were no significant differences between HC, MHS and MHS-L patients for
predicted maximal oxygen consumption (VO2max), as measured by the YMCA submaximal cycle
ergometer test (p>0.05). Additionally, there were no differences in VO2max between MHS with
symptoms and MHS-L patients (p>0.05).
4.3.8 Anaerobic capacity
There was a main group effect between HC, MHS and MHS-L patients for FI during the
Wingate Anaerobic Test (p<0.05). Post hoc analysis revealed that both MHS and MHS-L
patients had significantly greater FI than HC (HC: 51.7 ± 8.4 % vs. MHS: 59.0 ± 7.5 %, p<0.05;
HC: 51.7 ± 8.4 % vs. MHS-L: 60.9 ± 11.7 %, p<0.05), with no difference between MHS and
MHS-L patients (p>0.05). Additionally, there was no significant difference in FI between MHS
patients with symptoms and MHS-L patients (p>0.05).
4.3.9 Upper and lower body muscle strength
There were no significant differences between HC, MHS and MHS-L patients for
handgrip strength (p>0.05), vertical jump height (p>0.05), or lower body power (p>0.05).
Additionally, there were no differences in handgrip strength (p>0.05), vertical jump height
(p>0.05), or lower body power (p>0.05) between MHS with symptoms and MHS-L patients
(p>0.05).

71
4.4 Significant Correlations
Pearson’s r coefficient was used to examine the relationship between in vivo measures of
metabolism and functional exercise performance.
4.4.1 31P-MRS measures vs. anaerobic capacity
There was a positive correlation between fatigue index during the Wingate Anaerobic
Test and PCr recovery time constant during 30s (r=0.460, p<0.01) (Figure 36), 60s (r=0.427,
p<0.01) (Figure 37), and 5x30s (r=0.400, p<0.01) (Figure 38) exercise. There was a negative
correlation between fatigue index during the Wingate Anaerobic Test and oxidative
phosphorylation ATP production rate during 30s exercise (r=-0.375, p<0.05) (Figure 39),
however not during 60s (r=-0.196, p>0.05) or 5x30s exercise (r=-0.066, p>0.05). There was a
positive correlation between peak power during the Wingate Anaerobic Test and PCr recovery
time constant during 30s exercise (r=0.396, p<0.01) (Figure 40), however not during 60s
(r=0.111, p>0.05) or 5x30s (r=-0.004, p>0.05) exercise. Finally, there was a positive correlation
between mean power during the Wingate Anaerobic Test and PCr recovery time constant during
30s exercise (r=0.318, p<0.05) (Figure 41), however not during 60s (r=0.031, p>0.05) or 5x30s
(r=-0.056, p>0.05) exercise.

72
Figure 36. There was a positive correlation between Fatigue Index during the WaNT and PCr
time constant during the 31P-MRS 30s exercise bout (r=0.460, p<0.01).
Figure 37. There was a positive correlation between Fatigue Index during the WaNT and PCr
time constant during the 31P-MRS 60s exercise bout (r=0.427, p<0.01).
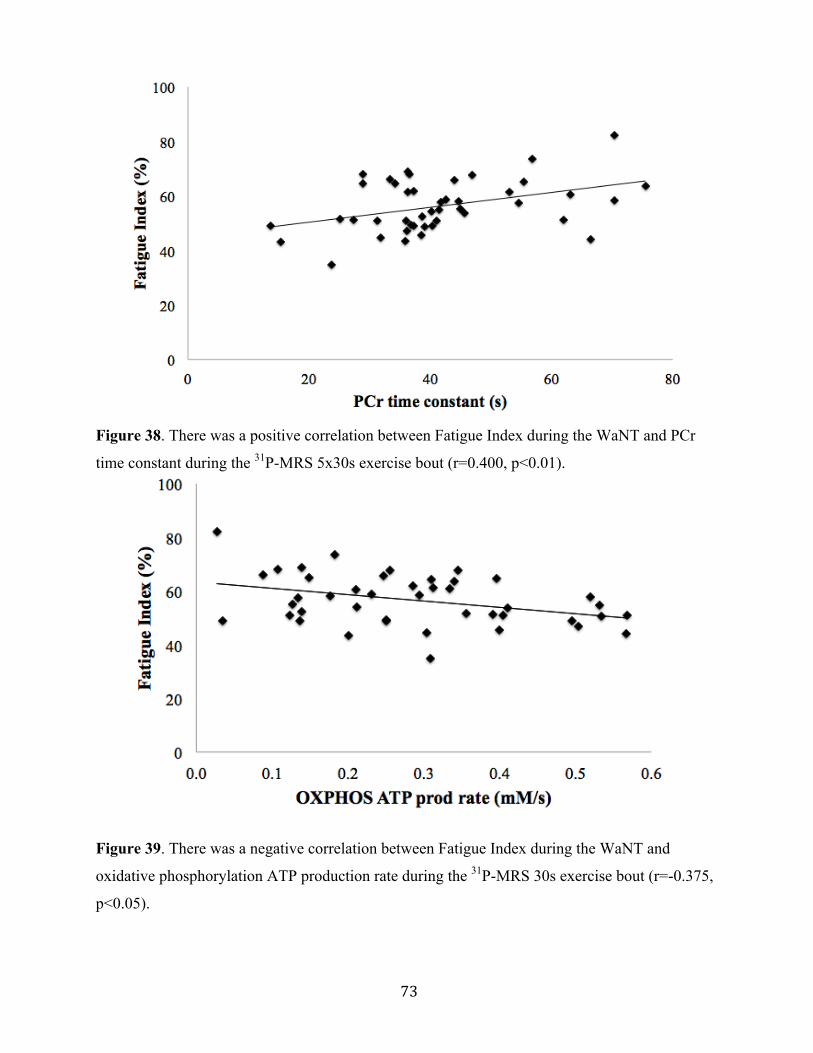
73
Figure 38. There was a positive correlation between Fatigue Index during the WaNT and PCr
time constant during the 31P-MRS 5x30s exercise bout (r=0.400, p<0.01).
Figure 39. There was a negative correlation between Fatigue Index during the WaNT and
oxidative phosphorylation ATP production rate during the 31P-MRS 30s exercise bout (r=-0.375,
p<0.05).

74
Figure 40. There was a positive correlation between peak power during the WaNT and PCr time
constant during the 31P-MRS 30s exercise bout (r=0.396, p<0.01).
Figure 41. There was a positive correlation between mean power during the WaNT and PCr time
constant during the 31P-MRS 30s exercise bout (r=0.318, p<0.05).

75
4.4.2 31P-MRS measures vs. muscle strength
There was a positive correlation between Sayers Peak Power and PCr recovery time
constant during 30s exercise (r=0.342, p<0.05) (Figure 42), however not during 60s (r=0.015,
p>0.05) or 5x30s (r=0.006, p>0.05) exercise. There was no relationship between handgrip
muscle strength and any of the 31P-MRS measures.
Figure 42. There was a positive correlation between Sayers peak power and PCr time constant
during the 31P-MRS 30s exercise bout (r=0.342, p<0.05).
4.4.3 BOLD fMRI measures vs. aerobic capacity
There was a positive correlation between VO2peak and the half-time recovery of BOLD
signal following exercise (r=0.435, p<0.01) (Figure 43), with no relationship between VO2peak
and baseline BOLD signal (r=0.016, p>0.05), change in BOLD signal (r=0.263, p>0.05) and
BOLD signal response time (r=-0.140, p>0.05).
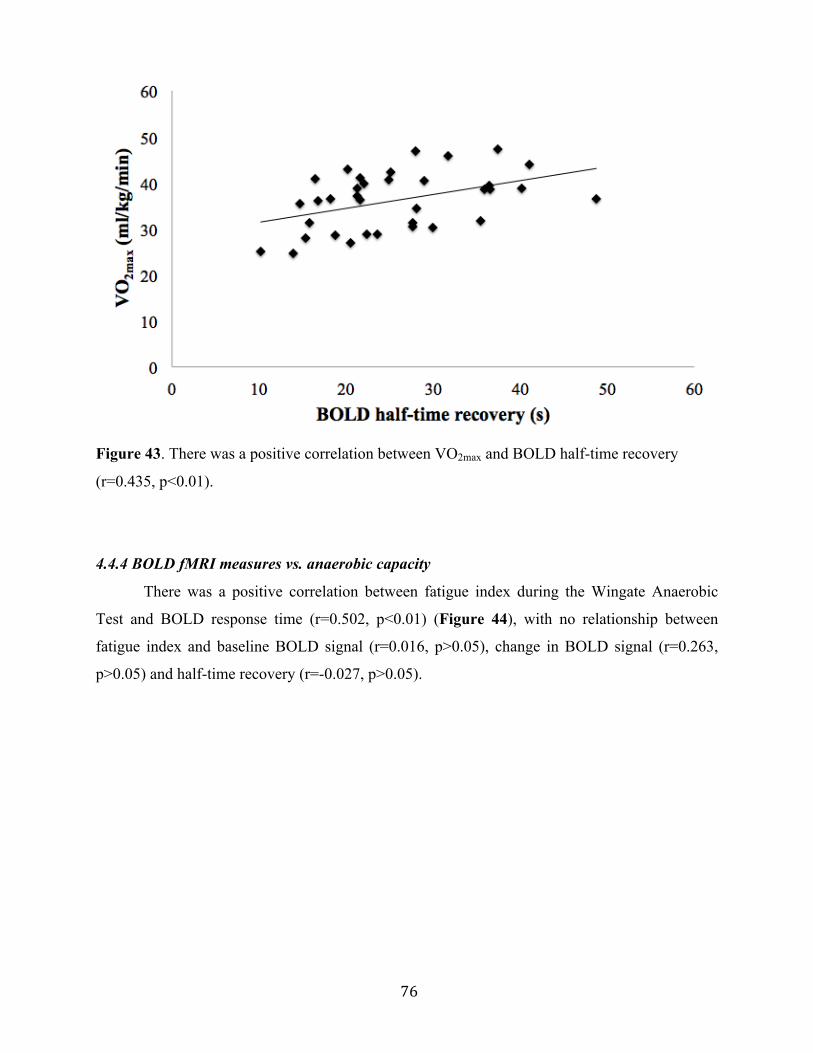
76
Figure 43. There was a positive correlation between VO2max and BOLD half-time recovery
(r=0.435, p<0.01).
4.4.4 BOLD fMRI measures vs. anaerobic capacity
There was a positive correlation between fatigue index during the Wingate Anaerobic
Test and BOLD response time (r=0.502, p<0.01) (Figure 44), with no relationship between
fatigue index and baseline BOLD signal (r=0.016, p>0.05), change in BOLD signal (r=0.263,
p>0.05) and half-time recovery (r=-0.027, p>0.05).
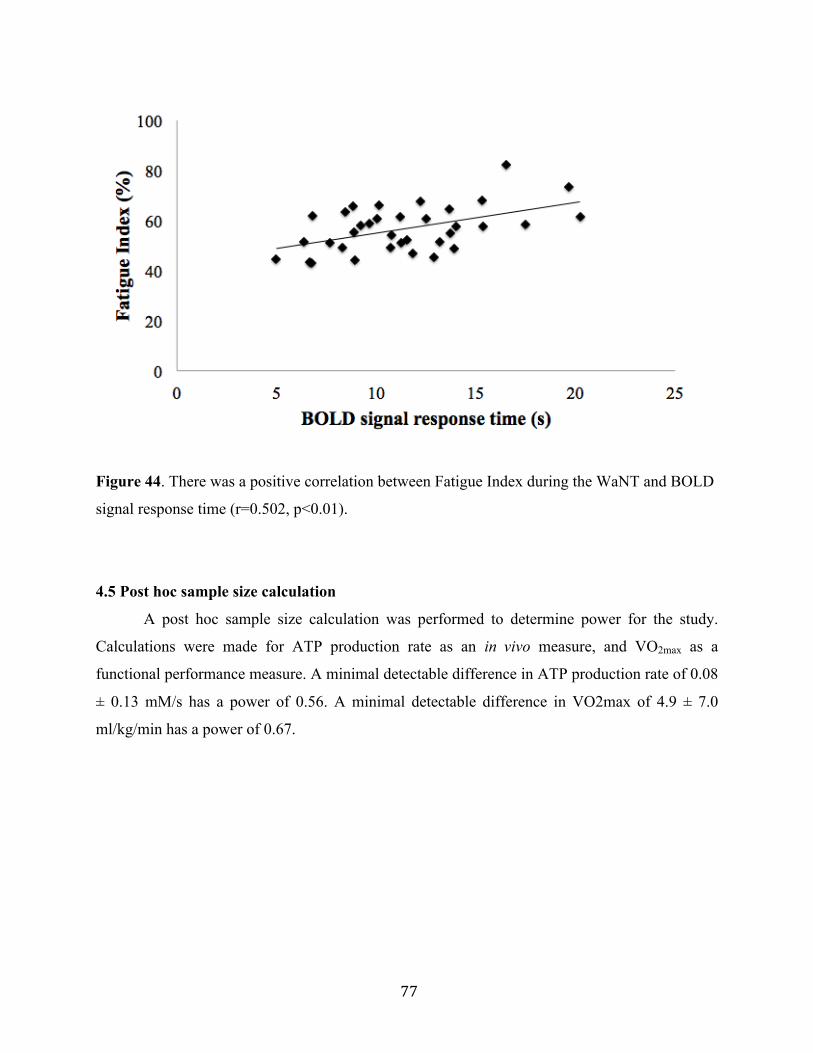
77
Figure 44. There was a positive correlation between Fatigue Index during the WaNT and BOLD
signal response time (r=0.502, p<0.01).
4.5 Post hoc sample size calculation
A post hoc sample size calculation was performed to determine power for the study.
Calculations were made for ATP production rate as an in vivo measure, and VO2max as a
functional performance measure. A minimal detectable difference in ATP production rate of 0.08
± 0.13 mM/s has a power of 0.56. A minimal detectable difference in VO2max of 4.9 ± 7.0
ml/kg/min has a power of 0.67.
78
CHAPTER 5: DISCUSSION
5.1 Introduction
Malignant Hyperthermia is a disease historically regarded as subclinical. However,
increasing reports of non-anaesthesia induced (MH-like) reactions, as well as persistent
musculoskeletal symptoms in the absence of a reaction, have changed the perception of it. It has
been suggested that mitochondrial damage is a potential cause for musculoskeletal symptoms
and exercise intolerance in this population, however limited studies have assessed skeletal
muscle metabolism in humans.
The purpose of this study was to assess skeletal muscle metabolism in vivo and to
measure functional exercise performance in patients tested positive for MH. In order to better
assess the phenotypic variability that accompanies this disease, individuals who had a previous,
or family history of MH reaction to anaesthesia (MHS) were compared to those who had an
exercise- or heat-induced MH-like reaction (MHS-L). Finally, MH patients who experience
musculoskeletal symptoms on a regular basis such as weakness, pain and cramping, were
compared to those MH individuals who are asymptomatic.
Results of this study suggest that patients tested positive for MH have impaired aerobic
metabolism as measured by lower ATP production from the oxidative phosphorylation
bioenergetic system. This dysfunction is further exemplified during exercise, in which MH
patients have impaired aerobic and anaerobic capacity compared to healthy individuals. There
appears to be greater impairment with increasing severity of muscle symptoms, however
impairments are similar between individuals with a history of MH reaction and those who
experience MH-like reactions.
This study is novel for several reasons:
1) It integrated in vivo techniques (31P-MRS and BOLD fMRI) with traditional exercise
testing to obtain a comprehensive assessment of skeletal muscle metabolism and
functional performance.
2) Using 31P-MRS, we were able to assess energy contribution from the three bioenergetic
pathways used during exercise (high energy phosphagen, anerobic glycolysis, and
oxidative phosphorylation).
79
3) This study was the first to compare skeletal muscle metabolism and exercise performance
between MH patients with various degrees of clinical and functional impairment
5.2 Summary of main findings
5.2.1 Impaired skeletal muscle metabolism
5.2.1.1 31Phosphorous magnetic resonance spectroscopy
ATP production rate was calculated in the three bioenergetic pathways used during
exercise, using the equations developed by Newcomer and colleagues (Newcomer & Boska,
1997; Wells, Selvadurai, & Tein, 2009b). To our knowledge, this is the first study to specifically
measure energy contribution from the different bioenergetics pathways. Results revealed that
MH patients had decreased oxidative phosphorylation ATP production rate following exercise,
most notably in those with severe muscle symptoms. There were no significant differences in the
high energy phosphagen or glycolytic system between groups. This suggests that functional and
metabolic impairment likely stem from the oxidative system. Oxidative phosphorylation uses
oxygen to break down substrates and is the main source of energy at rest and low-moderate
intensity exercise (Balog, Enzmann, & Gallant, 2000; Corona, Rouviere, Hamilton, & Ingalls,
2008; Wells, Selvadurai, & Tein, 2009b; Williams, Holland, Ward, & Lee, 1992). Impairment in
this system prevents the body from keeping up with energy demands. Therefore, decreased ATP
production in this energy pathway might be the cause of muscle weakness, cramping and
exercise intolerance in this population.
While impaired oxidative phosphorylation ATP production was observed in the MH
group compared to healthy individuals, there were no differences between MHS and MHS-L
patients, indicating a similar metabolic impairment between these two groups. To our
knowledge, this is the first study to compare MHS compared to individuals who experience MH-
like reactions. However, in a recent study by Sagui and colleagues (Balog et al., 2000; Sagui et
al., 2014; Williams et al., 1992), the researchers used 31P-MRS to assess muscle bioenergetics in
individuals with a history of exertional heat stroke (EHS). They observed that while some EHS
individuals had impaired muscle bioenergetics, there was no apparent relation between those
who tested positive for MH (according to IVCT) and those who had normal calcium handling.
80
The researchers concluded that impaired skeletal muscle bioenergetics are not associated with
EHS, and that the phenotypic association between MH and EHS remains unclear. There are
several possible explanations for the equivocal results. First, the researchers in this group used a 31P-MRS “score” to evaluate the muscle bioenergetics in each participant. Individuals were
assessed on 19 different measures, and given a score of either 0 or 1, depending on if they were
in a normal range or not. The score was then tallied up and those who had a score of greater than
2 were considered to have “abnormal” bioenergetics. The researchers admit that this
dichotomization of variables does not take into account the wide range of abnormalities present
in this population, therefore the quantitative measures used in the current study might be a more
accurate way to assess the impaired metabolism associated with MH. Additionally, that study
used finger flexion as the exercise protocol. It is possible that, as MH is a skeletal muscle
disorder, this wasn’t a large enough muscle mass to exhibit abnormalities during exercise.
Upon cessation of exercise, energy production from glycolysis stops, however oxidative
metabolism continues to replenish the high-energy phosphates that have decreased during
exercise (Argov et al., 2000; Balog et al., 2000; Mattei et al., 2004). This is most apparent in the
blood occlusion study by Sahlin and colleagues, in which the researchers observed that PCr
resynthesis could not occur without oxygen availability (Corona et al., 2008; Sahlin et al., 1979).
Since then, researchers have used PCr recovery as an indicator of mitochondrial function, in both
healthy and diseased populations, and longer PCr recovery has been reported by our group in
diseased populations (Corona et al., 2008; Wells et al., 2011; Williams et al., 1992), as well as a
handful of studies looking at MHS (Corona et al., 2008; Monsieurs et al., 1997; Olgin et al.,
1988; 1991). Surprisingly, in the current study, we did not detect a difference between MH
patients and HC for PCr recovery time constant following exercise. Although PCr recovery is
driven primarily by oxidative metabolism, the rate of the slow phase of recovery is largely
dependent upon pH (Sahlin et al., 1979; Wells, Selvadurai, & Tein, 2009b). It has been
suggested that pH alters oxidative phosphorylation through mitochondrial uncoupling
(Mitchelson & Hird, 1973; Tartaglia et al., 2000) and that hydrogen (H+) can inhibit PCr
resynthesis (Damon et al., 2007; Jacobi et al., 2012; Radda, 1986; Towse, 2005). Indeed,
Bendahan and colleagues observed that with higher pH post-exercise, there was faster PCr
recovery (Bendahan et al., 2001; Ruf et al., 2012; Wells et al., 2007). Alternatively, Webster and
colleagues observed normal recovery of PCr in MHS patients, despite a drastic drop in pH during
81
exercise (Bendahan et al., 2001; Webster et al., 1990). Several researchers suggest that even after
correcting for pH, PCr time constant can be inaccurate due to individual H+ flux rates (Sahlin et
al., 1979; van den Broek et al., 2007) and that measuring initial PCr recovery is more accurate
(Arnold et al., 1984; Frostig, 2009; McGrath et al., 2008; Roussel et al., 2000). In this study,
oxidative phosphorylation ATP production rate was calculated by the recovery of PCr during the
first eight seconds of recovery (Damon et al., 2007; Newcomer & Boska, 1997; Partovi et al.,
2012). Using the calculation for ATP production rate provided by Newcomer and colleagues
(Adam-Vizi & Starkov, 2010; Inan & Wei, 2010; Newcomer & Boska, 1997), we were able to
measure PCr resynthesis independent of pH, thereby providing a more accurate measure of
aerobic metabolism.
Previous 31P-MRS studies of MHS patients observed greater drop and slower recovery of
pH during exercise (Bendahan et al., 2001; Giulivi et al., 2010; Inan & Wei, 2010; Monsieurs et
al., 1997; Raturi & Simmen, 2013; Webster et al., 1990). This might be due to hyperactivation of
the anaerobic glycolytic system from excessive Ca2+ concentration (Bendahan et al., 2001;
Brookes, Yoon, Robotham, Anders, & Sheu, 2004). Alternatively, it is suggestive of greater
reliance on anaerobic metabolism to compensate for impaired aerobic metabolism. Similarly,
increased Pi:PCr ratio during exercise, a marker of metabolic stress has been shown in previous
MHS studies (Huang & Manton, 2004; Monsieurs et al., 1997; Payen et al., 1993; Webster et al.,
1990; Wells et al., 2008). Interestingly, there were no differences in recovery of pH, or Pi:PCr
ratio between MH patients and HC in our study. While this appears to be inconsistent with
previous studies, it is important to note that in the current study MH patients were unable to
maintain the same workload as HC. Participants’ wattage for each exercise bout was pre-
determined according to body weight, however watts were manually decreased if participants
were unable to maintain a kicking cadence of 10 repetitions per minute (RPM). MH patients,
particularly those with severe symptoms, were unable to maintain the same workload as HC.
Therefore, while MH groups exhibited similar metabolic stress, they completed significantly less
work (as measured by percent predicted workload) than healthy individuals.
Cytosolic Mg2+ was lower in the MH group with symptoms during 5x30s exercise.
Altered Mg2+ handling has previously been reported in MHS patients (Steele & Duke, 2007;
Wells et al., 2008), however no study to our knowledge has used 31P-MRS to measure Mg2+
concentration in this population. MHS patients are oversensitive to certain agonists such as
82
halothane, caffeine, Ca2+ and ATP (Adam-Vizi & Starkov, 2010; Brookes et al., 2004; Inan &
Wei, 2010; Treves et al., 2005), meaning their RyR1 have a lower agonist threshold for the
release of Ca2+ (Andersson et al., 2011; Inan & Wei, 2010; O'Sullivan et al., 2001). It is
postulated that MHS individuals have this lower threshold due to inhibition of RyR1 antagonists,
such as Mg2+, which compete with agonist bindings sites on RyR1 (Inan & Wei, 2010; Steele &
Duke, 2007). Decreased Mg2+ levels cause RyR1 channels to be in a “pre-active” state, and once
exposed to a trigger, causes oversensitivity (Andersson et al., 2011; Treves et al., 2005).
Interestingly, we didn’t measure lower Mg2+ concentrations in the MH group during resting
conditions, but rather during 5x30s exercise bouts. Another possible detriment of lower Mg2+
levels is its effect on muscle bioenergetics, as ATP must be bound to Mg2+ to be active.
Decreased Mg2+ in symptomatic MH group suggests that there is less ATP available for
mechanical work in the muscle. However, further research is needed to determine the
relationship between lower Mg2+ concentration and its possible detrimental effects on muscle
function.
Finally, there were no differences in resting measures of 31P-MRS between HC and MH
patients (or any of the MH subgroups). These results are consistent with previous 31P-MRS
studies that observed no muscle abnormalities at rest in MHS patients (Bendahan et al., 2001;
Durham et al., 2008; Monsieurs et al., 1997; Webster et al., 1990). It is possible that the
metabolic impairments are not detectable at rest, but are present under conditions of stress, when
the oxidative system is struggling to maintain energy requirements.
5.2.1.2 Blood oxygen level-dependent fMRI
To our knowledge, this is the first study to look at tissue perfusion using BOLD fMRI in
patients tested positive for MH. BOLD signal is a measure of the ratio of oxy- to
deoxyhaemoglobin, and is largely dependent on three main factors: blood volume, blood flow,
and muscle oxygenation (Caterini et al., 2014; Durham et al., 2008; Jacobi et al., 2012; Jones et
al., 2005; Partovi et al., 2012). However, evidence suggests that the majority of the change in
signal following exercise is due to differences in muscle oxygenation (Andersson et al., 2011;
Jacobi et al., 2012; Jones et al., 2005; Partovi et al., 2012). In this way, BOLD fMRI is a good
indicator of skeletal muscle tissue perfusion.
83
We used BOLD fMRI to assess skeletal muscle hemodynamics following exercise using
a sigmoidal equation developed by our group (Caterini et al., 2014; Durham et al., 2008). We
observed a significantly longer response time of the sigmoidal function in MH patients compared
to HC. The response time represents the washout time of deoxyhemoblogin (Frostig, 2009;
McGrath et al., 2008; Wappler et al., 2000), and a longer response time suggests MH patients
have impaired perfusion and take longer to recover oxygen parameters. The accumulation of
metabolites during exercise such as CO2, H+ and Pi elicits a local increase in muscle blood flow
due to vasodilation of micro vessels (Damon et al., 2007; Partovi et al., 2012; Riazi et al., 2013).
Decreased perfusion impairs the body’s ability to eliminate these waste products from the
working muscle (Caterini et al., 2014; Larach et al., 2010) and could be one explanation for
impaired metabolic function and decreased functional performance in this population.
Interestingly, MH patients without symptoms had the greatest delay in BOLD signal
response following exercise, compared to MH patients with symptoms and HC. When analyzing
those individuals with MH-like reactions, MHS-L patients had the greatest delay in BOLD signal
compared to HC and MHS. This is counterintuitive, as these two groups didn’t have the greatest
impairment as observed during 31P-MRS and during the functional performance tests. However,
it must be noted that while bulk of BOLD signal is due to changes in tissue oxygenation, as
stated above, other factors affect BOLD signal such as blood flow, blood volume, capillary
architecture and alignment to the magnetic field (Caterini et al., 2014; Jacobi et al., 2012; Jones
et al., 2005; Partovi et al., 2012; Porter, 2003). Differences in any one of these factors could
explain these inconsistencies.
Individual factors can also affect the BOLD signal response. Individuals who are
physically active have been shown to have larger increases in BOLD signal following exercise
compared to inactive individuals (Damon et al., 2007; Towse, 2005). It is hypothesized that this
is due to improved capillarization from regular exercise training (Damon et al., 2007; Jacobi et
al., 2012; Towse, 2005). MH patients in the current study were overall less ‘active’ and more
‘inactive’ than HC. It is possible that the delay in BOLD signal response is due to decreased
capillarization from physical inactivity.
Correspondingly, due to the metabolic by-products which cause vasodilation, BOLD
signal response is highly determined by exercise intensity (Damon et al., 2007; Partovi et al.,
2012). As mentioned earlier, exercise workload for 31P-MRS and BOLD fMRI was determined

84
based on weight, however some individuals (particularly symptomatic MH patients) had to
reduce their load as they couldn’t maintain the required kicking cadence. Differences in
vasodilation between groups might be due to differences in metabolic by-products (i.e. a patient
who is working harder will have a greater BOLD response). 31P-MRS results indicate that HC
and MH patients had similar metabolic stress (as indicated by similar pH and Pi:PCr values),
however conclusions regarding metabolic stress cannot be made during the BOLD fMRI
protocol as 31P-MRS was not measured in conjunction with it. Measuring both oxygen delivery
(via BOLD fMRI) and oxygen utilization (via 31P-MRS) simultaneously, as demonstrated by
Carlier and colleagues (Carlier et al., 2005), would elicit a more comprehensive and clear picture
as to the metabolic limiting factor in this population.
5.2.2 Impaired functional exercise performance
5.2.2.1 Aerobic capacity
MH patients, particularly those with musculoskeletal symptoms, exhibited lower aerobic
capacity than HC during the endurance cycle ergometer test. Similarly, symptomatic patients had
the greatest decrease in oxidative phosphorylation ATP production measured in vivo. It is
therefore possible that the impairment at the molecular level is responsible for the diminished
exercise performance and skeletal muscle symptoms present in MH patients. Maximum oxygen
uptake (VO2max) is a measure of the maximal rate of oxygen that the body is able to use for
mechanical and metabolic work. As oxygen is delivered via the blood to the working muscles,
VO2max is determined by both central (cardiorespiratory) and peripheral (skeletal muscle) factors
(Wells, Selvadurai, & Tein, 2009b). In other words, in order to obtain an optimal VO2max, there
needs to be both adequate delivery and utilization of oxygen. A decrease in oxidative
phosphorylation ATP production observed in vivo suggests that there is dysfunction in MH
patients at the skeletal muscle level, thereby impairing oxygen utilization.
A submaximal protocol was performed on a cycle ergometer to predict VO2max (Golding
et al., 1989). This method estimates VO2 at two submaximal workloads and then the slope is
extrapolated to the age-predicted maximal HR to predict VO2max. This extrapolation method is
based off of early models by Astrand and Rhyming (Astrand & Ryhming, 1954) and is aimed to
predict maximum VO2 when the participant’s heart rate is between 110 and 150 beats per

85
minute, when heart rate and VO2 are linear (Beekley et al., 2004). While this protocol is a valid
predictor of maximal aerobic capacity (Beekley et al., 2004), significant variations in predicted
VO2max can occur due to factors such as differences in individuals’ maximal heart rate, the
curvilinear nature of the HR-VO2 curve, and how accustomed individuals are to exercise
(Beekley et al., 2004; Fitchett, 1985). In order to control for some of these factors, all
participants had a small meal or snack one hour before the test to control for individual
variability in heart rate. In order to control for mechanical efficiency, seat height and RPM were
standardized for the test. Keeping this in mind, there can still be up to 6% difference in VO2max
prediction based on mechanical efficiency (Beekley et al., 2004) and biking can elicit peripheral
fatigue in some individuals more than others (e.g. if someone is more or less accustomed to
biking) (Brooks, 2000). A maximal test would elicit greater accuracy, however due to the
physical constraints of this disease, a submaximal test was necessary.
The limited studies that previously measured maximal aerobic capacity in MHS detected
no difference between MH patients and HC (Green et al., 1987; Rutberg et al., 1987). Reasons
for these equivocal results are unclear. It is possible that the sample sizes in the previous studies
were too small to detect a significant difference between MH patients and HC. Additionally,
while Green and colleagues (Green et al., 1987) utilized a similar protocol as the current study,
Rutberg and colleagues (Rutberg et al., 1987) used a protocol which didn’t take age into account.
Using an age-corrected protocol, as in the current study, corrects for the decline in heart rate that
naturally occurs with age (Christou & Seals, 2008). Finally, in both of these previous studies,
there was no mention of the phenotypes. Wappler and colleagues suggest that inconsistency in
exercise testing of MH patients is due to the variability of triggers, symptoms and severity
between individuals (Wappler et al., 2000). It is possible that the individuals in the previous
studies had less severe phenotypes than the MH group in the current study. Indeed, three patients
in the current study were unable to complete the appropriate stages required for the test due to
musculoskeletal symptoms and it is likely that the impaired aerobic capacity is slightly
underestimated in the MH group.
5.2.2.2 Anaerobic capacity
The Wingate Anaerobic Test (WAnT) was developed by Bar-Or (Bar-Or, 1987) and is
used universally from clinical to high performance populations. While other factors can affect
86
the results of this test such as mechanical efficiency and motivation (Vandewalle et al., 1987), it
has a test-retest reliability of 0.89-0.98 (Bar-Or, 1987) and is the gold standard for the
measurement of anaerobic capacity. To our knowledge, no study has previously assessed
anaerobic capacity in MH patients using the WAnT.
MH patients exhibited impaired anaerobic capacity, as measured by decreased peak
power, decreased mean power and greater fatigue compared to HC during the WAnT.
Specifically, this means that MH patients reached a lower maximal power, had lower power
throughout the duration of the 30-second sprint, and had a greater drop in fatigue (or difference
between maximum and minimum power). There was a trend for greater impairment with
increasing symptoms MH patients with severe symptoms had the greatest impairment. MH
patients without symptoms had greater fatigue during the test than those with symptoms,
however the difference in the two groups was almost negligible. Indeed, MH patients with severe
symptoms had slightly greater fatigue than MH patients without symptoms (MH severe
symptoms: 60.8 ± 12.8 % vs. MH no symptoms: 60.2 ± 7.9 %), however this group was not
significantly different from HC (likely due to the small sample size the severely symptomatic
group). Similar to the aerobic test, three symptomatic patients were unable to attempt or
complete the test due to musculoskeletal symptoms, and impaired anaerobic capacity was likely
underestimated in the MH group.
Peak power is a measure of the mechanical power of an individual’s muscles and mean
power is how well the muscles can sustain this power (Bar-Or, 1987). A decrease in either of
these measures is suggestive of impairment in the anaerobic systems. However, while this test is
a good assessment of the anaerobic energy systems (phosphagen and glycolysis), it is also an
assessment of oxidative phosphorylation. Parolin and colleagues assessed the energy
contribution from the three bioenergetic systems using muscle samples obtained during a WAnT
(Parolin et al., 1999). The researchers observed that during the second half of the test (15-30
seconds), 50% of the energy contribution was from the oxidative system. This suggests that the
decrease in mean power and greater fatigue index observed in the MH group are indicators of
impaired oxidative function.
It has been suggested that MH patients have a greater reliance on anaerobic metabolism
to compensate for impaired aerobic function (Bendahan et al., 2001). This would in turn lead to
decreased power and faster fatigue as the accumulation of metabolites from anaerobic glycolysis

87
can impede contractile function and enzymatic activity (Wells, Selvadurai, & Tein, 2009b).
Indeed, a positive correlation was observed between fatigue index during the WAnT and
oxidative phosphorylation ATP production rate during the 30-second exercise bout. This
suggests that decreased production of ATP from oxidative metabolism leads to greater reliance
on anaerobic glycolysis, greater buildup of metabolites, and faster onset of fatigue. If this is the
case, a greater drop in pH would occur during exercise, and the in vivo results showed no
difference in pH between HC and MH patients. However, as stated previously, it was observed
that the MH group didn’t complete the same amount of work as HC during the 31P-MRS
protocol. As the WAnT is a maximal test, it is possible that workload was better controlled, as all
participants were working at maximal exertion.
5.2.2.3 Upper and lower body strength
No differences were detected between MH patients and HC in either upper or lower body
strength. While there are no known differences in muscle strength in this population, abnormal
muscle function has been observed previously in animal studies. Studies of MH-mutated mice
and pigs have observed greater resistance to fatigue during repetitive electric muscle stimulation
(Balog et al., 2000; Corona et al., 2008; Williams et al., 1992). Both Balog and colleauges and
Williams et al. observed differences in fatigue between MHS and MHN pigs during twitch and
tetanic (continuous) muscle stimulation (Balog et al., 2000; Williams et al., 1992), however
Balog and colleagues conclude from their experiment that the differences are so subtle that there
would be no differences in functional measures of muscle performance (Balog et al., 2000).
Corona and colleagues measured recovery following eccentric muscle contractions in
mice and, paradoxically, observed that MH-mutated mice were able to recover faster than wild
type mice (Corona et al., 2008). It is suggested that the Ca2+ overload in MHS patients might
offset the decrease in contraction that occurs with fatigue (Corona et al., 2008; Williams et al.,
1992). The researchers also observed that MH-mutated mice exhibited less muscle damage
following eccentric muscle contractions. Therefore, it is also speculated that the cytokine
production that is apparent during an MH reaction might partially protect MH muscle from
muscle damage, as it mediates the acute immune response (Corona et al., 2008). In the current
study, we observed that there were no differences between HC and MH patients in muscle
strength, however we didn’t measure sustained muscle contraction, nor did we measure acute
88
and short-term muscle damage. Future studies are warranted to assess both force decline and
measures of inflammation during sustained contractions in MH patients with varying degrees of
phenotype severity.
5.2.3 Physical activity level
Results of the Habitual Activity Estimation Scale reveal that in general MH patients
spend more time ‘inactive’ (time spent lying down) and less time ‘very active’ (activities that
makes someone breathe hard or sweat) than HC. Additionally, there was a general trend for
greater inactivity and decreased activity in symptomatic patients. In fact, severely symptomatic
MH patients report spending zero time ‘very active’ on weekends. Whether this inactivity is a
cause, or consequence of their symptoms, is unclear.
Differences in habitual physical activity can affect physiological processes and health
status. Exercise leads to improved lung function and increased cardiac output and
vascularization. At the skeletal muscle level, exercise training can increase mitochondrial size
and number, and increase enzymatic activity, leading to greater skeletal muscle oxidative
metabolism (Wells, Selvadurai, & Tein, 2009b). This could be a contributing factor for the
difference in ATP production rate observed between MH patients and HC in vivo. Indeed,
Tartaglia and colleagues measured a faster initial recovery of PCr in conditioned versus
deconditioned individuals (Tartaglia et al., 2000). As mentioned earlier, differences in physical
activity can also affect BOLD signal response following exercise due to changes in
capillarization that can occur due to exercise training (Damon et al., 2007; Jacobi et al., 2012;
Towse, 2005).
Whether the metabolic and functional impairments observed in MH patients are due to
physical inactivity (particularly those individuals with severe symptoms who are very inactive)
remain to be determined. Although the habitual physical activity scale has been validated (Ruf et
al., 2012; Wells et al., 2007), future studies that utilize more robust measurements of activity,
such as accelerometry, are needed to make more definite conclusions regarding the etiology of
metabolic and functional impairments in this disease.
89
5.2.4 Correlations
Correlational analyses were performed to assess if the in vivo metabolic impairments
(specifically lower OXPHOS ATP production rate and impaired perfusion) were associated with
decreased exercise performance.
5.2.4.1 Relationship between 31P-MRS measures and functional performance
Positive correlations were observed between fatigue index during the WAnT and PCr
recovery time constant during all three 31P-MRS exercise bouts (30s, 60s and 5x30s exercise).
Similarly, a negative correlation was observed between fatigue index during the WAnT and
OXPHOS ATP production rate during the 31P-MRS 30-second exercise bout. This suggests that
impaired aerobic metabolism (as measured by longer PCr recovery and decreased OXPHOS
ATP production) is associated with faster onset of fatigue. As stated earlier, it is possible that
MH patients have greater reliance on anaerobic metabolism, leading to a faster onset of
metabolites and the fatigue that accompanies them (Bendahan et al., 2001).
A positive correlation was observed between both peak and mean power during the
WAnT and PCr recovery during the 31P-MRS 30-second exercise bout. The reason for this
relationship is unclear, as a longer PCr recovery is indicative of impaired oxidative metabolism
(Sahlin et al., 1979). However, it is important to note that this correlation was only significant for
absolute values of peak and mean power (measured in watts). When corrected for body mass
(watts/kg), there was no relationship between either peak or mean power and fatigue index.
Relative power is a better indicator than absolute power, as it takes into account different body
sizes in our heterogeneous population.
5.2.4.2 Relationship between BOLD fMRI measures and functional performance
Fatigue index during the WAnT was positively correlated with the response time of the
BOLD recovery curve. The response time of the sigmoidal recovery curve is a measure of the
washout time of deoxyhaemoglobin (Frostig, 2009; McGrath et al., 2008). A longer response
time is indicative of impaired perfusion and an impaired ability to remove metabolites during
exercise. This can cause individuals to fatigue faster, leading to a greater drop in power during
the WAnT.
90
Interestingly, maximal oxygen uptake was also positively correlated with the half-time
recovery of the BOLD recovery curve. A delayed half-time recovery is also an indicator of
impaired perfusion, and the reason for this relationship remains unclear. However as mentioned
previously, many factors such as age, exercise intensity, muscle fiber type and physical activity
(Damon et al., 2007; Partovi et al., 2012) can also affect the BOLD signal response.
Additionally, more studies are needed to develop normative values for the sigmoidal recovery
curve developed in our lab recently.
5.3 Hypothesis for skeletal muscle damage
It has been postulated that metabolic impairments stem from the chronic Ca2+ accumulation in
MH individuals. Previous animal studies have shown that Ca2+ overload causes metabolic
insufficiency of the mitochondria (Adam-Vizi & Starkov, 2010; Inan & Wei, 2010), causing the
production of reactive oxygen species (ROS) and subsequent decrease in mitochondrial mass and
oxidative phosphorylation (Giulivi et al., 2010; Inan & Wei, 2010; Raturi & Simmen, 2013).
The electron transport chain (ETC), which is situated in the mitochondria, is the final step
in the oxidative phosphorylation pathway. Following the Krebs cycle, electrons are transferred
from the substrates nicotinamide adenine dinucleotide (NADH) and flavin adenine dinucleotide
(FADH2) to oxygen. The electrons released go through a series of H+ pumps (Complexes I-IV).
This creates an electrochemical gradient across the inner mitochondrial membrane which drives
ATP synthesis (Brookes et al., 2004). Reactive oxygen species (ROS), either as superoxide (O2-)
or hydroxyl radicals (-OH), are natural metabolic by-products from the electron transport chain
due to electron leak (Huang & Manton, 2004; Wells et al., 2008) (Figure 45). However,
excessive ROS production (oxidative stress) can impair oxidative metabolism, through
peroxidative injury to mitochondrial membranes and decreased enzyme function (Wells et al.,
2008). It is suggested that Ca2+ overload can increase ROS production due to greater electron
leak that accompanies increased metabolism (Adam-Vizi & Starkov, 2010; Brookes et al., 2004;
Inan & Wei, 2010).
Nitric oxide (NO) synthesis is activated by Ca2+ and when combined with superoxide
(O2-) forms the reactive nitrogen species (RNS) peroxynitrite, a highly toxic molecule
(Andersson et al., 2011; Inan & Wei, 2010). RNS can be harmful in a number of ways. First, it
can damage DNA and proteins, leading to decreased ATP, increased ROS production and
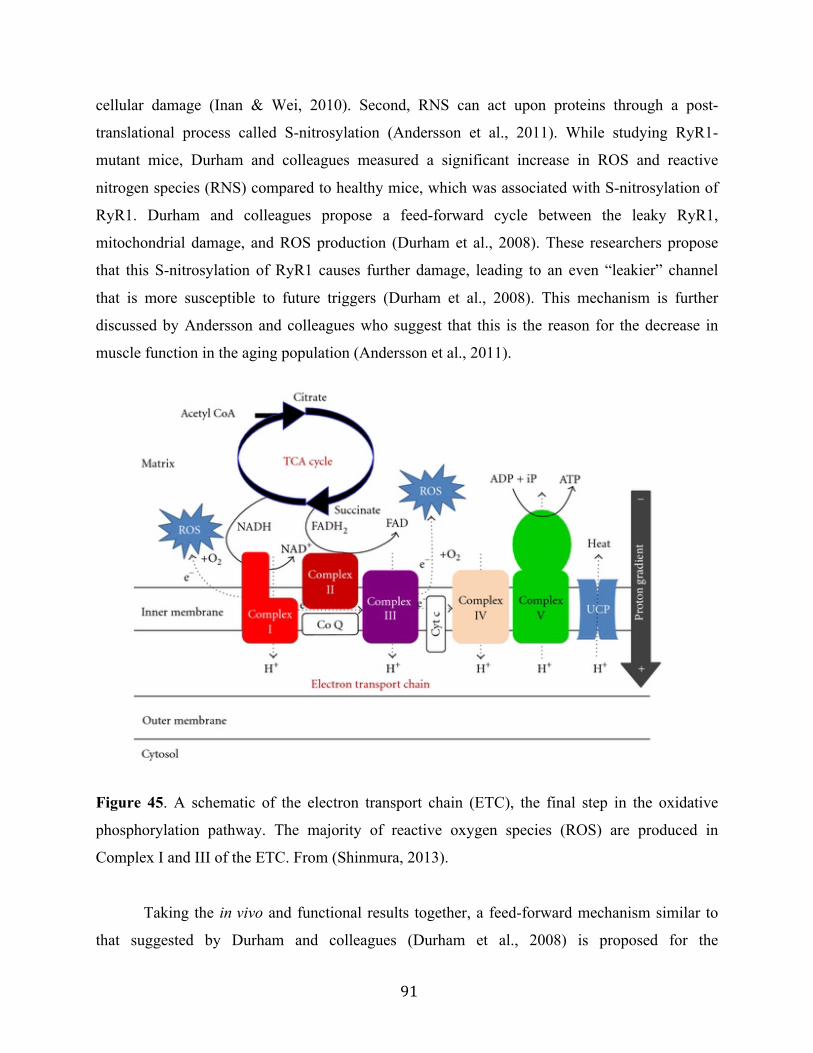
91
cellular damage (Inan & Wei, 2010). Second, RNS can act upon proteins through a post-
translational process called S-nitrosylation (Andersson et al., 2011). While studying RyR1-
mutant mice, Durham and colleagues measured a significant increase in ROS and reactive
nitrogen species (RNS) compared to healthy mice, which was associated with S-nitrosylation of
RyR1. Durham and colleagues propose a feed-forward cycle between the leaky RyR1,
mitochondrial damage, and ROS production (Durham et al., 2008). These researchers propose
that this S-nitrosylation of RyR1 causes further damage, leading to an even “leakier” channel
that is more susceptible to future triggers (Durham et al., 2008). This mechanism is further
discussed by Andersson and colleagues who suggest that this is the reason for the decrease in
muscle function in the aging population (Andersson et al., 2011).
Figure 45. A schematic of the electron transport chain (ETC), the final step in the oxidative
phosphorylation pathway. The majority of reactive oxygen species (ROS) are produced in
Complex I and III of the ETC. From (Shinmura, 2013).
Taking the in vivo and functional results together, a feed-forward mechanism similar to
that suggested by Durham and colleagues (Durham et al., 2008) is proposed for the
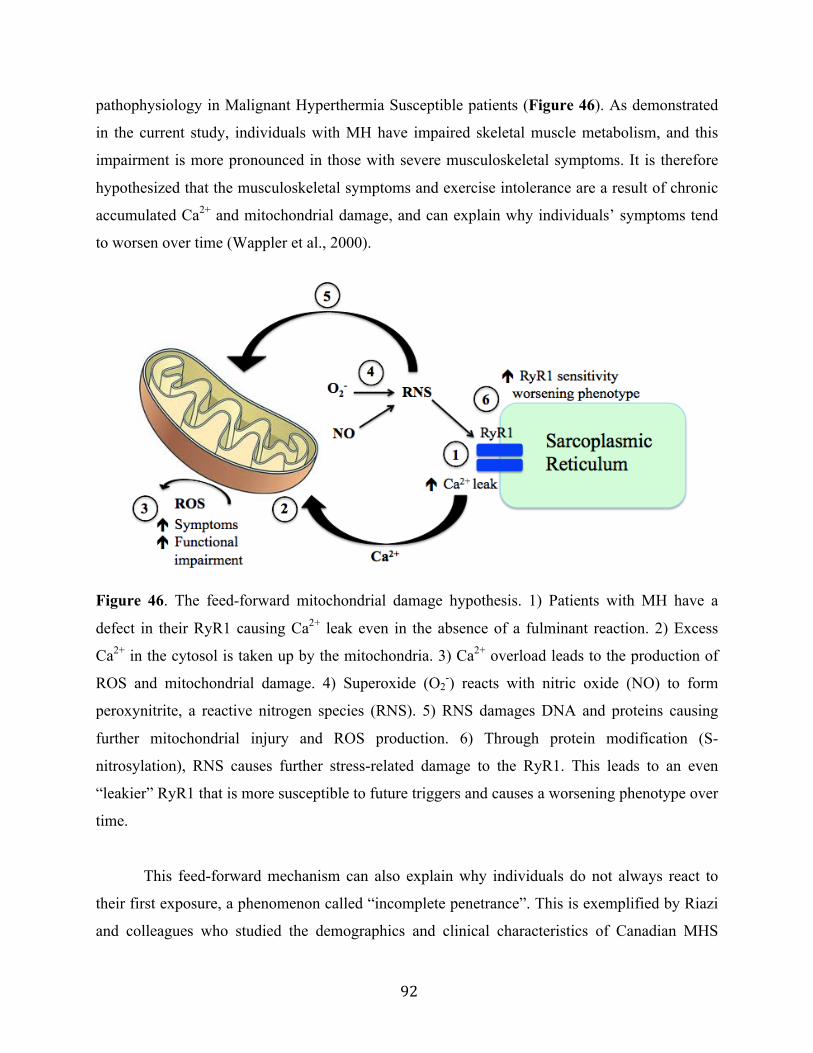
92
pathophysiology in Malignant Hyperthermia Susceptible patients (Figure 46). As demonstrated
in the current study, individuals with MH have impaired skeletal muscle metabolism, and this
impairment is more pronounced in those with severe musculoskeletal symptoms. It is therefore
hypothesized that the musculoskeletal symptoms and exercise intolerance are a result of chronic
accumulated Ca2+ and mitochondrial damage, and can explain why individuals’ symptoms tend
to worsen over time (Wappler et al., 2000).
Figure 46. The feed-forward mitochondrial damage hypothesis. 1) Patients with MH have a
defect in their RyR1 causing Ca2+ leak even in the absence of a fulminant reaction. 2) Excess
Ca2+ in the cytosol is taken up by the mitochondria. 3) Ca2+ overload leads to the production of
ROS and mitochondrial damage. 4) Superoxide (O2-) reacts with nitric oxide (NO) to form
peroxynitrite, a reactive nitrogen species (RNS). 5) RNS damages DNA and proteins causing
further mitochondrial injury and ROS production. 6) Through protein modification (S-
nitrosylation), RNS causes further stress-related damage to the RyR1. This leads to an even
“leakier” RyR1 that is more susceptible to future triggers and causes a worsening phenotype over
time.
This feed-forward mechanism can also explain why individuals do not always react to
their first exposure, a phenomenon called “incomplete penetrance”. This is exemplified by Riazi
and colleagues who studied the demographics and clinical characteristics of Canadian MHS
93
patients between 1992 and 2011 (Riazi et al., 2013). The researchers showed that 13.2% of the
MHS patients had successful anaesthesia prior to having a fulminant episode. Similarly, in a
study looking at the North American MH registry, 50% of patients had a history of 2 or more
successful anaesthetics prior to their fulminant reaction (Larach et al., 2010). We propose that in
addition to worsening musculoskeletal symptoms, with increased mitochondrial damage over
time, there is increased ROS and RNS, leading to modification of the RyR1 and causing it to
become more susceptible to future triggers.
One of the most noteworthy findings is that there were similar impairments in MHS and
MHS-L patients. This suggests that there is a similar feed-forward mechanism in patients who
experience exercise- or heat-induced MH-like reactions. This can explain the similarities
between muscle symptoms present in some MHS patients and the progression of symptoms
during the onset of heat- or exercise-induced MH-like reactions. These results suggest that
phenotypic expression of individuals who test positive for MH lies in the damaged skeletal
muscle. More specifically, it is not the trigger per se (anaesthesia versus heat/exercise), but rather
the accumulated mitochondrial damage that is the main determinant of both disease severity and
the likelihood of having a reaction. There appears to be no relation between type of reaction and
disease severity, and reasons for the significant variations in phenotype need to be further
evaluated.
This hypothesis is consistent with views by Porter, who states that it’s difficult to
determine the relationship between EHS and MH, as someone with EHS is likely to test positive
for MH due to skeletal muscle damage that occurred during EHS (Porter, 2003). This researcher
suggests that regardless of etiology, the muscle damage accumulated during an MH or MH-like
reaction (e.g. rhabdomyolysis) will ultimately lead to a similar phenotype. Continuous
mitochondrial damage and subsequent RyR1 remodeling can lead to increased susceptible to
both anesthetic and heat- and exercise-induced triggers, and ultimately a worsening phenotype
over time.
94
5.4 Hypotheses revisited
The following conclusions can be made regarding the original hypotheses:
1) MH patients have impaired skeletal muscle metabolism as measured in vivo, which is
accompanied by functional muscle impairments and exercise intolerance.
ü Individuals tested positive for MH had impaired skeletal muscle metabolism measured by 31P-MRS, specifically in the oxidative phosphorylation pathway (demonstrated by lower
OXPHOS ATP production following exercise)
ü MH patients also exhibited impaired aerobic and anaerobic capacity, as measured by
standardized endurance and sprint cycle ergometer tests
2) Dysfunctional metabolism and functional impairments are more severe in the MH
patients who experience persistent musculoskeletal symptoms.
ü MH patients with musculoskeletal symptoms had lower OXPHOS ATP production,
however significance was only reached in those with severe symptoms
ü Symptomatic patients also exhibited lower aerobic and anaerobic capacity, with even
greater impairment in those patients with severe symptoms
3) MHS-L patients have a similar metabolic and functional impairment as MHS who
suffer from persistent musculoskeletal symptoms
ü There was no differences in skeletal muscle metabolism, as measured in vivo, between
MHS-L and MHS patients (both with symptoms and without)
ü There were no differences in aerobic or anaerobic capacity between MHS-L and MHS
patients (both with symptoms and without)
5.5 Conclusion
This study is the first step in improving our understanding of the pathophysiology of
exercise intolerance and bioenergetic compromise in patients tested positive for MH.
Additionally, these results provide insight into the metabolic differences between not only
healthy controls and MH patients, but also into the clinical variability within the MH group.
While we didn’t perform direct measurements via muscle biopsies, our in vivo results suggest
95
that there is mitochondrial dysfunction in patients tested positive for MH, as exhibited by
decreased ATP production in the oxidative phosphorylation pathway. This impairment was
accompanied by decreased aerobic and anaerobic capacity, suggesting the functional
impairments in this population are a result of the impairments measured in vivo. Additionally,
these metabolic and functional impairments are more pronounced with worsening
musculoskeletal symptoms. Most notably, we demonstrated that patients with MH-like reactions
(MHS-L) exhibited similar metabolic and functional impairments as MHS patients. A feed-
forward cycle of accumulated Ca2+ and mitochondrial damage can explain a worsening
phenotype over time, and is proposed as the pathophysiological mechanism behind both MHS
and MHS-L patients.
5.6 Limitations and future directions
This research provides insight into not only the functional impairments of this disease, but
also the pathophysiology of this condition. This will help future researchers to develop evidence-
based physical activity and exercise interventions aimed at treating muscle symptoms and
exercise intolerance. However, there are several limitations to this study and future studies are
warranted to address these issues.
1) In this current study we separated the patients into groups depending on the severity of
their symptoms, however this was somewhat subjective as the degrees of phenotypic
severity are better represented as a continuous progression rather than a classification
system. Longitudinal studies that measure individuals’ symptomatic and metabolic
progression over time with a larger number of patients might draw more accurate
conclusions regarding the relationship between metabolic dysfunction and muscle
symptoms in this population.
2) It has been suggested that some genotypes yield more severe phenotypes, which would be
a confounding factor in this study. Additionally, not all mutations are known to be
disease causing, further complicating this issue. Due to these reasons, it was decided that
genotypic data would not be included in the current study. With a greater understanding
96
of the genetic/phenotype relationship, a clearer picture of the phenotypic variability can
be obtained.
3) Post hoc sample size calculations revealed that the current study had low power. Based
on the in vivo results, in order to achieve a power of 0.8, 86 patients are required. Based
on the functional testing results, in order to achieve a power of 0.8, 68 patients are
required. Additionally, some data was excluded due to poor signal acquisition/motion
artifacts (as was the case during MRS and BOLD fMRI testing), or non-compliance
(during the exercise testing), further decreasing the power of the study.
4) With many MH patients (particularly symptomatic patients) leading an inactive lifestyle,
it’s difficult to tease out if the metabolic and functional impairments are a result of the
disease itself, or if they are partly a consequence of physical inactivity. With the addition
of accelerometry, more accurate measurements of habitual physical activity can be
obtained.
5) While impairments were observed in both skeletal muscle metabolic and functional
performance, these tests were not performed at the same time. Until skeletal muscle
metabolism and functional measures are measured simultaneously, definitive conclusions
cannot be made regarding the cause of functional impairment in this population.
6) Finally, no mitochondrial or inflammatory markers were measured directly from the
muscle tissue. With the addition of skeletal muscle biopsies in the future, researchers will
be able to directly assess and analyze mitochondrial function in MH patients.

97
CHAPTER 6: REFERENCES
Adam-Vizi, V., & Starkov, A. A. (2010). Calcium and mitochondrial reactive oxygen species generation: how to read the facts. Journal of Alzheimer's Disease : JAD, 20 Suppl 2, S413–26.
Allen, G. C., Larach, M. G., & Kunselman, A. R. (1998). The sensitivity and specificity of the caffeine-halothane contracture test: a report from the North American Malignant Hyperthermia Registry. The North American Malignant Hyperthermia Registry of MHAUS. Anesthesiology, 88(3), 579–588.
Andersson, D. C., Betzenhauser, M. J., Reiken, S., Meli, A. C., Umanskaya, A., Xie, W., et al. (2011). Ryanodine Receptor Oxidation Causes Intracellular Calcium Leak and Muscle Weakness in Aging. Cell Metabolism, 14(2), 196–207.
Argov, Z., Löfberg, M., & Arnold, D. L. (2000). Insights into muscle diseases gained by phosphorus magnetic resonance spectroscopy. Muscle & Nerve, 23(9), 1316–1334.
Arnold, D. L., Matthews, P. M., & Radda, G. K. G. (1984). Metabolic recovery after exercise and the assessment of mitochondrial function in vivo in human skeletal muscle by means of 31P NMR. Magnetic Resonance in Medicine, 1(3), 307–315.
Astrand, P. O., & Ryhming, I. (1954). A Nomogram for Calculation of Aerobic Cpacity (Physical Fitness) From Pulse Rate During Submaximal Work. Special Communications, 7, 218–221.
Avila, G. (2005). Intracellular Ca2+ dynamics in malignant hyperthermia and central core disease: established concepts, new cellular mechanisms involved. Cell Calcium, 37(2), 121–127.
Balog, E. M., Enzmann, N. R., & Gallant, E. M. (2000). Malignant hyperthermia: fatigue characteristics of skeletal muscle. Muscle & Nerve, 23(2), 223–230.
Bandschapp, O., & Girard, T. (2012). Malignant hyperthermia. Swiss Medical Weekly. Bar-Or, O. (1987). The Wingate anaerobic test. An update on methodology, reliability and
validity. Sports Medicine (Auckland, N.Z.), 4(6), 381–394. Beekley, M. D., Brechue, W. F., deHoyos, D. V., Garzarella, L., Werber-Zion, G., & Pollock, M.
L. (2004). Cross-validation of the YMCA submaximal cycle ergometer test to predict VO2max. Research Quarterly for Exercise and Sport, 75(3), 337–342.
Bendahan, D., Kozak-Ribbens, G., Confort-Gouny, S., Ghattas, B., Figarella-Branger, D., Aubert, M., & Cozzone, P. J. (2001). A Noninvasive Investigation of Muscle Energetics Supports Similarities Between Exertional Heat Stroke andMalignant Hyperthermia. Anesthesia & Analgesia, 93, 683–689.
Bendahan, D., Kozak-Ribbens, G., Rodet, L., Confort-Gouny, S., & Cozzone, P. J. (1998). 31Phosphorus magnetic resonance spectroscopy characterization of muscular metabolic anomalies in patients with malignant hyperthermia: application to diagnosis. Anesthesiology, 88(1), 96–107.
Boska, M. (1994). ATP production rates as a function of force level in the human gastrocnemius/soleus using 31P MRS. Magnetic Resonance in Medicine, 32(1), 1–10.
Brady, J. E., Sun, L. S., Rosenberg, H., & Li, G. (2009). Prevalence of Malignant Hyperthermia Due to Anesthesia in New York State, 2001–2005. Anesthesia & Analgesia, 109(4), 1162–1166.
Brandom, B. W., Bina, S., Wong, C. A., Wallace, T., Visoiu, M., Isackson, P. J., et al. (2013).
98
Ryanodine Receptor Type 1 Gene Variants in the Malignant Hyperthermia-Susceptible Population of the United States. Anesthesia & Analgesia, 116(5), 1078–1086.
Brookes, P. S., Yoon, Y., Robotham, J. L., Anders, M. W., & Sheu, S. S. (2004). Calcium, ATP, and ROS: a mitochondrial love-hate triangle. American Journal of Physiology. Cell Physiology, 287(4), C817–C833.
Brooks, G. A. (2000). Exercise physiology: human bioenergetics and its applications. Mountain View, Calif: Mayfield Pub.
Capacchione, J. F., Sambuughin, N., Bina, S., Mulligan, L. P., Lawson, T. D., & Muldoon, S. M. (2009). Exertional rhabdomyolysis and malignant hyperthermia in a patient with ryanodine receptor type 1 gene, L-type calcium channel alpha-1 subunit gene, and calsequestrin-1 gene polymorphisms. Anesthesiology, 112(1), 239–244.
Carlier, P. G., Brillault-Salvat, C., Giacomini, E., Wary, C., & Bloch, G. (2005). How to investigate oxygen supply, uptake, and utilization simultaneously by interleaved NMR imaging and spectroscopy of the skeletal muscle. Magnetic Resonance in Medicine, 54(4), 1010–1013.
Carpenter, D., Ringrose, C., Leo, V., Morris, A., Robinson, R. L., Halsall, P. J., et al. (2009). The role of CACNA1S in predisposition to malignant hyperthermia. BMC Medical Genetics, 10(1), 104.
Caterini, J. E., Elzibak, A. H., Michel, E. J. S., McCrindle, B. W., Redington, A. N., Thompson, S., et al. (2014). Characterizing blood oxygen level-dependent (BOLD) response following in-magnet quadriceps exercise. Magnetic Resonance Materials in Physics, Biology and Medicine, 28(3), 271–278.
Christou, D. D., & Seals, D. R. (2008). Decreased maximal heart rate with aging is related to reduced B-adrenergic responsiveness but is largely explained by a reduction in intrinsic heart rate. Journal of Applied Physiology, 105(1), 24–29.
Corona, B. T., Rouviere, C., Hamilton, S. L., & Ingalls, C. P. (2008). Eccentric contractions do not induce rhabdomyolysis in malignant hyperthermia susceptible mice. Journal of Applied Physiology, 105(5), 1542–1553.
Cox, I. J. (1996a). Development and applications of in vivo clinical magnetic resonance spectroscopy. Progress in Biophysics and Molecular Biology, 65(1-2), 45–81.
Cox, R. W. (1996b). AFNI: software for analysis and visualization of functional magnetic resonance neuroimages. Computers and Biomedical Research, an International Journal, 29(3), 162–173.
Damon, B. M., Wadington, M. C., Hornberger, J. L., & Lansdown, D. A. (2007). Absolute and relative contributions of BOLD effects to the muscle functional MRI signal intensity time course: Effect of exercise intensity. Magnetic Resonance in Medicine, 58(2), 335–345.
Dengorough, M. A., Forster, J. F., Lovell, R. R., Maplestone, P. A., & Villiers, J. D. (1962). Anaesthetic deaths in a family. British Journal of Anaesthesia, 34, 395–396.
Diaz-Sylvester, P. L., Porta, M., & Copello, J. A. (2008). Halothane modulation of skeletal muscle ryanodine receptors: dependence on Ca2+, Mg2+, and ATP. American Journal of Physiology. Cell Physiology, 294(4), C1103–12.
Dlamini, N., Voermans, N. C., Lillis, S., Stewart, K., Kamsteeg, E. J., Drost, G., et al. (2013). Mutations in RYR1 are a common cause of exertional myalgia and rhabdomyolysis. Neuromuscular Disorders, 23(7), 540–548.
Duke, A. M., Hopkins, P. M., Halsal, J. P., & Steele, D. S. (2004). Mg2+ dependence of halothane-induced Ca2+ release from the sarcoplasmic reticulum in skeletal muscle from
99
humans susceptible to malignant hyperthermia. Anesthesiology, 101(6), 1339–1346. Durham, W. J., Aracena-Parks, P., Long, C., Rossi, A. E., Goonasekera, S. A., Boncompagni, S.,
et al. (2008). RyR1 S-Nitrosylation Underlies Environmental Heat Stroke and Sudden Death in Y522S RyR1 Knock-in Mice. Cell, 133(1), 53–65.
Eltit, J. M., Bannister, R. A., Moua, O., Altamirano, F., Hopkins, P. M., Pessah, I. N., et al. (2012). Malignant hyperthermia susceptibility arising from altered resting coupling between the skeletal muscle L-type Ca2+ channel and the type 1 ryanodine receptor. Proceedings of the National Academy of Sciences, 109(20), 7923–7928.
Fiege, M., Wappler, F., Weisshorn, R., Ulrich Gerbershagen, M., Steinfath, M., & Schulte Am Esch, J. (2002). Results of contracture tests with halothane, caffeine, and ryanodine depend on different malignant hyperthermia-associated ryanodine receptor gene mutations. Anesthesiology, 97(2), 345–350.
Fitchett, M. A. (1985). Predictability of VO2 max from submaximal cycle ergometer and bench stepping tests. British Journal of Sports Medicine, 19(2), 85–88.
Frostig, R. (Ed.). (2009). In Vivo Optical Imaging of Brain Function, Second Edition (Vol. 20024445). Taylor and Francis Group, CRC Press.
Giulivi, C., Ross-Inta, C., Omanska-Klusek, A., Napoli, E., Sakaguchi, D., Barrientos, G., et al. (2010). Basal Bioenergetic Abnormalities in Skeletal Muscle from Ryanodine Receptor Malignant Hyperthermia-susceptible R163C Knock-in Mice. Journal of Biological Chemistry, 286(1), 99–113.
Glahn, K. P. E., Ellis, F. R., Halsall, P. J., Muller, C. R., Snoeck, M. M. J., Urwyler, A., & Wappler, F. (2010). Recognizing and managing a malignant hyperthermia crisis: guidelines from the European Malignant Hyperthermia Group. British Journal of Anaesthesia, 105(4), 417–420.
Golding, L. A., Myers, C. R., & Sinning, W. E. (1989). Y's way to physical fitness : the complete guide to fitness testing and instruction (3rd ed.). Champaign, IL: Human Kinetics Publishers.
Green, J. H., Ellis, F. R., Halsall, P. J., Campbell, I. T., Currie, S., & Caddy, J. (1987). Thermoregulation, plasma catecholamine and metabolite levels during submaximal work inindividuals susceptible to malignant hyperpyrexia. Acta Anaesthesiologica Scandinavica, 31, 122–126.
Gronert, G. A., Thompson, R. L., & Onofrio, B. M. (1980). Human malignant hyperthermia: awake episodes and correction by dantrolene. Anesthesia & Analgesia, 59(5), 377–378.
Hay, J., & Cairney, J. (2006). Development of the habitual activity estimation scale for research: a systematic approach. Pediatric Exercise Science, 18, 193–202.
Heerschap, A., Houtman, C., Zandt, H., van den Bergh, A. J., & Wieringa, B. (1999). Introduction to in vivo 31P-MRS of (human) skeletal muscle. Proceedings of the Nutrition Society, 58, 861–870.
Heytens, L., & Vercauteren, M. (2013). Clinical variability in the onset of life threatening malignant hyperthermia. European Journal of Anaesthesiology, 30(4), 187–194.
Hopkins, P. M., Ellis, F. R., & Halsall, P. J. (1991). Evidence for related myopathies in exertional heat stroke and malignant hyperthermia. Lancet, 338, 1491–1492.
Huang, H., & Manton, K. G. (2004). The role of oxidative damage in mitochondria during aging: a review. Frontiers in Bioscience, 9, 1100–1117.
Inan, S., & Wei, H. (2010). The Cytoprotective Effects of Dantrolene. Anesthesia & Analgesia, 111(6), 1400–1410.
Inbar, O., Bar-Or, O., & Skinner, J. S. (1996). The Wingate Anaerobic Test. Champaign, IL:

100
Human Kinetics Publishers. Ingwall, J. S. (1982). Phosphorus nuclear magnetic resonance spectroscopyof cardiac and
skeletal muscles. The American Journal of Physiology, 242(5), H729–H744. Iotti, S., Frassineti, C., Alderighi, L., Sabatini, A., Vacca, A., & Barbiroli, B. (2000). In vivo
31P-MRS assessment of cytosolic [Mg21] in the human skeletal muscle in different metabolic conditions. Magnetic Resonance Imaging, 18, 607–614.
Jacobi, B., Bongartz, G., Partovi, S., Schulte, A.-C., Aschwanden, M., Lumsden, A. B., et al. (2012). Skeletal muscle BOLD MRI: From underlying physiological concepts to its usefulness in clinical conditions. Journal of Magnetic Resonance Imaging, 35(6), 1253–1265.
Jenkinson, M., Bannister, P., Brady, M., & Smith, S. (2002). Improved Optimization for the Robust and Accurate Linear Registration and Motion Correction of Brain Images. NeuroImage, 17(2), 825–841.
Jenkinson, M., Beckmann, C. F., Behrens, T. E. J., Woolrich, M. W., & Smith, S. M. (2012). FSL. NeuroImage, 62(2), 782–790.
Jones, M., Berwick, J., Hewson-Stoate, N., Gias, C., & Mayhew, J. (2005). The effect of hypercapnia on the neural and hemodynamic responses to somatosensory stimulation. NeuroImage, 27(3), 609–623.
Klinger, W., Heirderich, S., Girard, T., Gravino, E., Heffron, J. J., Johannsen, S., et al. (2014). Functional and genetic characterization of clinical malignant hyperthermia crises: a multi-centre study. Orphanet Journal of Rare Diseases, 9(8), 1–15.
Krause, T., Gerbershagen, M. U., Fiege, M., Weisshorn, R., & Wappler, F. (2004). Dantrolene--a review of its pharmacology, therapeutic use and new developments. Anaesthesia, 59(4), 364–373.
Larach, M. G. (1989). Standardization of the Caffeine Halothane Muscle Contracture Test. Anaesthesiology and Analgesia, 69, 511–515.
Larach, M. G., Gronert, G. A., Allen, G. C., Brandom, B. W., & Lehman, E. B. (2010). Clinical Presentation, Treatment, and Complications of Malignant Hyperthermia in North America from 1987 to 2006. Anesthesia & Analgesia, 110(2), 498–507.
Lavezzi, W. A., Capacchione, J. F., Muldoon, S. M., Sambuughin, N., Bina, S., Steele, D., & Brandom, B. W. (2013). Death in the Emergency Department. Anesthesia & Analgesia, 116(2), 420–423.
Lehmann-Horn, F., Klingler, W., & Jurkat-Rott, K. (2011). Nonanesthetic malignant hyperthermia. Anesthesiology, 115(5), 915–917.
Litman, R. S., & Rosenberg, H. (2005). Malignant hyperthermia: update on susceptibility testing. JAMA : the Journal of the American Medical Association, 293(23), 2918–2924.
Louis, C. F., & Mickelson, J. R. (1996). Malignant hyperthermia: excitation-contraction coupling, Ca2+ release channel, and cell Ca2+ regulation defects. Physiological Reviews, 76(2), 537-592.
MacLennan, D. H. D., Duff, C. C., Zorzato, F. F., Fujii, J. J., Phillips, M. M., Korneluk, R. G. R., et al. (1990). Ryanodine receptor gene is a candidate for predisposition to malignant hyperthermia. Nature, 343(6258), 559–561.
Marieb, E., & Hoehn, K. (2010). Human anatomy & physiology (8 ed.). San Francisco: Benjamin Cummings.
Mattei, J. P., Bendahan, D., & Cozzone, P. (2004). P-31 Magnetic Resonance Spectroscopy. A tool for diagnostic purposes and pathophysiological insights in muscle diseases.
101
Reumatismo, 56(1), 9–14. McCarthy, T. V., Quane, K. A., & Lynch, P. J. (2000). Ryanodine receptor mutations in
malignant hyperthermia and central core disease. Human Mutation, 15(5), 410–417. McGrath, D. M., Naish, J. H., O'Connor, J. P. B., Hutchinson, C. E., Waterton, J. C., Taylor, C.
J., & Parker, G. J. M. (2008). Oxygen-induced changes in longitudinal relaxation times in skeletal muscle. Magnetic Resonance Imaging, 26(2), 221–227.
Mitchelson, K. R., & Hird, F. J. (1973). Effect of pH and halothane on muscle and liver mitochondria. American Journal of Physiology -- Legacy Content, 225(6), 1393–1398.
Monsieurs, K., Heytens, L., Kloeck, C., Martin, J.-J., Wuyts, F., & Bossaert, L. (1997). Slower recovery of muscle phosphocreatine in malignant hyperthermia-susceptible individuals assessed by 31P-MR spectroscopy. Journal of Neurology, 244, 647–656.
Naressi, A., Couturier, C., Castang, I., de Beer, R., & Graveron-Demilly, D. (n.d.). Jave-based graphical user interface for MRUI, a software package for quantification of in vivo/medical magnetic resonance spectroscopy signals. Computers in Biology and Medicine, 31(4), 269–286.
Newcomer, B. R., & Boska, M. D. (1997). Adenosine triphosphate production rates, metabolic economy calculations, pH, phosphomonoesters, phosphodiesters, and force output during short-duration maximal isometric plantar flexion exercises and repeated maximal isometric plantar flexion exercises. Muscle & Nerve, 20(3), 336–346.
Nishio, H., Sato, T., Fukunishi, S., Tamura, A., Iwata, M., Tsuboi, K., & Suzuki, K. (2009). Identification of malignant hyperthermia-susceptible ryanodine receptor type 1 gene (RYR1) mutations in a child who died in a car after exposure to a high environmental temperature. Legal Medicine, 11(3), 142–143.
O'Sullivan, G. H., McIntosh, J. M., & Heffron, J. J. (2001). Abnormal uptake and release of Ca2+ ions from human malignant hyperthermia-susceptible sarcoplasmic reticulum. Biochemical Pharmacology, 61(12), 1479–1485.
Olgin, J., Argov, Z., Rosenberg, H., Tuchler, M., & Chance, B. (1988). Non-invasive evaluation of malignant hyperthermia susceptibility with phosphorus nuclear magnetic resonance spectroscopy. Anesthesiology, 68(4), 507–513.
Olgin, J., Rosenberg, H., Allen, G., Seestedt, R., & Chance, B. (1991). A blinded comparison of noninvasive, in vivo phosphorus nuclear magnetic resonance spectroscopy and the in vitro halothane/caffeine contracture test in the evaluation of malignant hyperthermia susceptibility. Anesthesia & Analgesia, 72(1), 36–47.
Ording, H. (1985). Incidence of malignant hyperthermia in Denmark. Anesthesia & Analgesia, 64(7), 700–704.
Parolin, M. L., Chesley, A., Matsos, M. P., Spriet, L. L., Jones, N. L., & Heigenhauser, G. J. (1999). Regulation of skeletal muscle glycogen phosphorylase and PDH during maximal intermittent exercise. American Journal of Physiology -- Legacy Content, 277(5 Pt 1), E890–900.
Partovi, S., Karimi, S., Jacobi, B., Schulte, A.-C., Aschwanden, M., Zipp, L., et al. (2012). Clinical implications of skeletal muscle blood-oxygenation-level-dependent (BOLD) MRI. Magnetic Resonance Materials in Physics, Biology and Medicine, 25(4), 251–261.
Paul-Pletzer, K. (2002). Identification of a Dantrolene-binding Sequence on the Skeletal Muscle Ryanodine Receptor. Journal of Biological Chemistry, 277(38), 34918–34923.
Payen, J. F., Bosson, J. L., Bourdon, L., Jacquot, C., Le Bas, J. F., Stieglitz, P., & Benabid, A. L. (1993). Improved noninvasive diagnostic testing for malignant hyperthermia susceptibility
102
from a combination of metabolites determined in vivo with 31P-magnetic resonance spectroscopy. Anesthesiology, 78(5), 848–855.
Poels, P. J., Joosten, E. M., Sengers, R. C., Stadhouders, A. M., Veerkamp, J. H., & Benders, A. A. (1991). In vitro contraction test for malignant hyperthermia in patients with unexplained recurrent rhabdomyolysis. Journal of the Neurological Sciences, 105(1), 67–72.
Pollock, A. N., Langton, E. E., Couchman, K., Stowell, K. M., & Waddington, M. (2002). Suspected malignant hyperthermia reactions in New Zealand. Anaesthesia and Intensive Care, 30(4), 453–461.
Porter, A. M. W. (2003). Collapse from exertional heat illness: implications and subsequent decisions. Military Medicine, 168(1), 76–81.
Radda, G. K. (1986). The Use of NMR Spectroscopy for the Understanding of Disease. Science (New York, N.Y.), 233(4764), 640–645.
Raturi, A., & Simmen, T. (2013). Where the endoplasmic reticulum and the mitochondrion tie the knot: The mitochondria-associated membrane (MAM). BBA - Molecular Cell Research, 1833(1), 213–224.
Riazi, S., Larach, M. G., Hu, C., Wijeysundera, D., Massey, C., & Kraeva, N. (2014). Malignant Hyperthermia in Canada: Characteristics of Index Anesthetics in 129 Malignant Hyperthermia Susceptible Probands. Anesthesia & Analgesia, 118(2), 381-387.
Rios, E., & Brum, G. (1987). Involvement of dihydropyridine receptors in excitation-contraction coupling in skeletal muscle. Nature, 325, 717–720.
Robinson, R. L., Brooks, C., Brown, S. L., Ellis, F. R., Halsall, P. J., Quinnell, R. J., et al. (2002). RYR1 mutations causing central core disease are associated with more severe malignant hyperthermia in vitro contracture test phenotypes. Human Mutation, 20(2), 88–97.
Robinson, R., Carpenter, D., Shaw, M.-A., Halsall, J., & Hopkins, P. (2006). Mutations in RYR1 in malignant hyperthermia and central core disease. Human Mutation, 27(10), 977–989.
Robinson, R., Hopkins, P., Carsana, A., Gilly, H., Halsall, J., Heytens, L., et al. (2003). Several interacting genes influence the malignant hyperthermia phenotype. Human Genetics, 112(2), 217–218.
Rosenberg, H., & Rueffert, H. (2011). Clinical utility gene card for: malignant hyperthermia. European Journal of Human Genetics, 19(6), 1–3.
Rosenberg, H., Davis, M., James, D., Pollock, N., & Stowell, K. (2007). Malignant hyperthermia. Orphanet Journal of Rare Diseases, 2(1), 21.
Roussel, M., Bendahan, D., Mattei, J. P., Le Fur, Y., & Cozzone, P. J. (2000). 31P magnetic resonance spectroscopy study of phosphocreatine recovery kinetics in skeletal muscle: the issue of intersubject variability. Biochimica Et Biophysica Acta, 1457(1-2), 18–26.
Ruf, K. C., Fehn, S., Bachmann, M., Moeller, A., Roth, K., Kriemler, S., & Hebestreit, H. (2012). Validation of activity questionnaires in patientswith cystic fibrosis by accelerometry and cycleergometry. BMC Medical Research Methodology, 12(1), 43.
Rutberg, H., Håkanson, E., Hall, G. M., & Jorfeldt, L. (1987). Effects of graded exercise on leg exchange of energy substrates in malignant hyperthermia susceptible subjects. Anesthesiology, 67(3), 308–313.
Sagui, E., Abriat, A., Kozak-Ribbens, G., Foutrier-Morello, C., Bernard, M., Canini, F., et al. (2014). Is Muscle Energy Production Disturbed in Exertional Heat Stroke? Military Medicine, 179(3), 342–345.
Sahlin, K., Harris, R. C., & Hultman, E. (1979). Resynthesis of creatine phosphate in human muscle after exercise in relation to intramuscular pH and availability of oxygen.

103
Scandinavian Journal of Clinical and Laboratory Investigation, 39(6), 551–557. Sambuughin, N., Holley, H., Muldoon, S., Brandom, B. W., de Bantel, A. M., Tobin, J. R., et al.
(2005). Screening of the entire ryanodine receptor type 1 coding region for sequence variants associated with malignant hyperthermia susceptibility in the north american population. Anesthesiology, 102(3), 515–521.
Sapega, A. A., Sokolow, D. P., Graham, T. J., & Chance, B. (1987). Phosphorus nuclear magnetic resonance: a non-invasive technique for the study of muscle bioenergetics during exercise. Medicine & Science in Sports & Exercise, 19(4), 410–420.
Sayers, S. P., Harackiewicz, D. V., Harman, E. A., Frykman, P. N., & Rosenstein, M. T. (1999). Cross-validation of three jump power equations. Medicine & Science in Sports & Exercise, 31(4), 572-577.
Shinmura, K. (2013). Effects of Caloric Restriction on Cardiac Oxidative Stress and Mitochondrial Bioenergetics: Potential Role of Cardiac Sirtuins. Oxidative Medicine and Cellular Longevity, 2013(2), 1–11.
Steele, D. S., & Duke, A. M. (2007). Defective Mg2+ regulation of RyR1 as a causal factor in malignant hyperthermia. Archives of Biochemistry and Biophysics, 458(1), 57–64.
Sumitani, M., Uchida, K., Yasunaga, H., Horiguchi, H., Kusakabe, Y., Matsuda, S., & Yamada, Y. (2011). Prevalence of malignant hyperthermia and relationship with anesthetics in Japan: data from the diagnosis procedure combination database. Anesthesiology, 114(1), 84–90.
Tartaglia, M. C., Chen, J. T., Caramanos, Z., Taivassalo, T., Arnold, D. L., & Argov, Z. (2000). Muscle phosphorus magnetic resonance spectroscopy oxidative indices correlate with physical activity. Muscle & Nerve, 23(2), 175–181.
Timmins, M. A., Rosenberg, H., Larach, M. G., Sterling, C., Kraeva, N., & Riazi, S. (2015). Malignant Hyperthermia Testing in Probands without Adverse Anesthetic Reaction. Anesthesiology, 123(3), 548–556.
Tobin, J. R., Jason, D. R., Challa, V. R., Nelson, T. E., & Sambuughin, N. (2001). Malignant hyperthermia and apparent heat stroke. JAMA : the Journal of the American Medical Association, 286(2), 168–169.
Towse, T. F. (2005). Effect of physical activity on MRI-measured blood oxygen level-dependent transients in skeletal muscle after brief contractions. Journal of Applied Physiology, 99(2), 715–722.
Treves, S., Anderson, A. A., Ducreux, S., Divet, A., Bleunven, C., Grasso, C., et al. (2005). Ryanodine receptor 1 mutations, dysregulation of calcium homeostasis and neuromuscular disorders. Neuromuscular Disorders, 15, 577–587.
Tyler, D. J., Hudsmith, L. E., Clarke, K., Neubauer, S., & Robson, M. D. (2008). A comparison of cardiac 31P MRS at 1.5 and 3 T. NMR in Biomedicine, 21(8), 793–798.
van den Broek, N. M. A., De Feyter, H. M. M. L., Graaf, L. D., Nicolay, K., & Prompers, J. J. (2007). Intersubject differences in the effect of acidosis on phosphocreatine recovery kinetics in muscle after exercise are due to differences in proton efflux rates. AJP: Cell Physiology, 293(1), C228–C237.
Vandewalle, H., Pérès, G., & Monod, H. (1987). Standard anaerobic exercise tests. Sports Medicine (Auckland, N.Z.), 4(4), 268–289.
Wappler, F., Fiege, M., & Schulte, M. E. J. (2001a). Pathophysiological role of the serotonin system in malignant hyperthermia. British Journal of Anaesthesia, 87(5), 794–798.
Wappler, F., Fiege, M., Antz, M., & Schulte, M. E. J. (2000). Hemodynamic and metabolic alterations in response to graded exercise in a patient susceptible to malignant hyperthermia.
104
Anesthesiology, 92(1), 268–272. Wappler, F., Fiege, M., Steinfath, M., Agarwal, K., Scholz, J., Singh, S., et al. (2001b). Evidence
for susceptibility to malignant hyperthermia in patients with exercise-induced rhabdomyolysis. Anesthesiology, 94(1), 95–100.
Webster, D. W., Thompson, R. T., Gravelle, D. R., Laschuk, M. J., & Driedger, A. A. (1990). Metabolic response to exercise in malignant hyperthermia-sensitive patients measured by 31P magnetic resonance spectroscopy. Magnetic Resonance in Medicine, 15(1), 81–89.
Weglinski, M. R., Wedel, D. J., & Engel, A. G. (1997). Malignant hyperthermia testing in patients with persistently increased serum creatine kinase levels. Anesthesia & Analgesia, 84(5), 1038–1041.
Wells, G. D., Elmi, M., & Thomas, S. (2009a). Physiological correlates of golf performance. Journal of Strength and Conditioning Research / National Strength & Conditioning Association, 23(3), 741–750.
Wells, G. D., Noseworthy, M. D., Hamilton, J., Tarnopolski, M., & Tein, I. (2008). Skeletal muscle metabolic dysfunction in obesity and metabolic syndrome. Canadian Journal of Neurological Sciences, 35(1), 31–40.
Wells, G. D., O'Gorman, C. S., Rayner, T., Caterini, J., Thompson, S., Bradley, T., & Hamilton, J. (2013a). Skeletal Muscle Abnormalities in Girls and Adolescents With Turner Syndrome. Journal of Clinical Endocrinology & Metabolism, 98(6), 2521–2527.
Wells, G. D., Selvadurai, H., & Tein, I. (2009b). Bioenergetic provision of energy for muscular activity. Paediatric Respiratory Reviews, 10(3), 83–90.
Wells, G. D., Wilkes, D. L., Schneiderman, J. E., Elmi, M., Tullis, E., Lands, L. C., et al. (2007). Reliability and Validity of the Habitual Activity Estimation Scale (HAES) in Patients With Cystic Fibrosis. Pediatric Pulmonology, 00, 1–9.
Wells, G. D., Wilkes, D. L., Schneiderman, J. E., Rayner, T., Elmi, M., Selvadurai, H., et al. (2011). Skeletal muscle metabolism in cystic fibrosis and primary ciliary dyskinesia. Pediatric Research, 69(1), 40–45.
Wells, G. D., Wilkes, D. L., Schneiderman, J. E., Thompson, S., Coates, A. L., & Ratjen, F. (2013b). Physiological correlates of pulmonary function in children with cystic fibrosis. Pediatric Pulmonology, n/a–n/a.
West, S. L., O'Gorman, C. S., Elzibak, A. H., Caterini, J., Noseworthy, M. D., Rayner, T., et al. (2015). BBA Clinical. Bbacli, 3(C), 25–30.
Williams, J. H., Holland, M., Ward, C. W., & Lee, J. C. (1992). Altered mechanical responses of malignant hyperthermic skeletal muscle during repetitive stimulation. Journal of Physiology, Paris, 86(4), 159–165.
Yang, T. (2003). Functional Defects in Six Ryanodine Receptor Isoform-1 (RyR1) Mutations Associated with Malignant Hyperthermia and Their Impact on Skeletal Excitation-Contraction Coupling. Journal of Biological Chemistry, 278(28), 25722–25730.
Zanconato, S., Buchthal, S., Barstow, T. J., & Cooper, D. M. (2002). 31P-magnetic resonance spectroscopy of leg muscle metabolism during exercise in children and adults. Journal of Applied Physiology, 74(5), 2214–2218.
Zupan, M. F., Arata, A. W., Dawson, L. H., Wile, A. L., Payn, T. L., & Hannon, M. E. (2009). Wingate Anaerobic Test peak power and anaerobic capacity classifications for men and women intercollegiate athletes. Journal of Strength and Conditioning Research / National Strength & Conditioning Association, 23(9), 2598–2604.
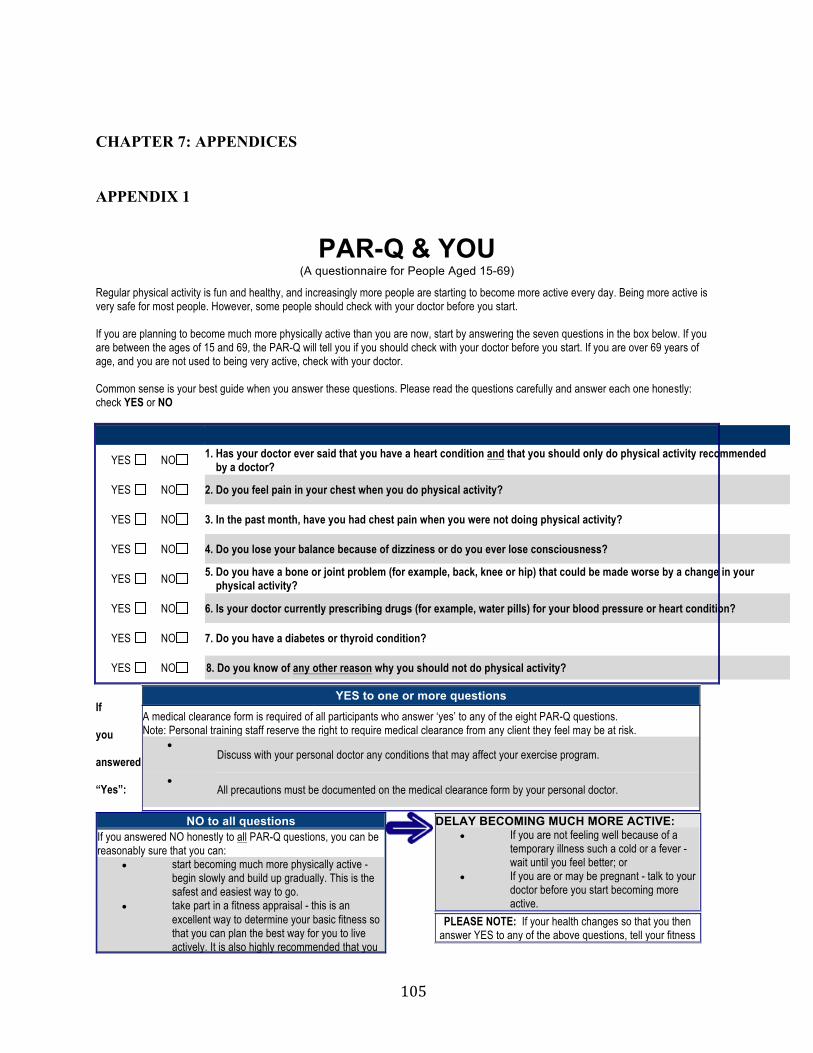
105
CHAPTER 7: APPENDICES
APPENDIX 1
PAR-Q & YOU (A questionnaire for People Aged 15-69)
Regular physical activity is fun and healthy, and increasingly more people are starting to become more active every day. Being more active is very safe for most people. However, some people should check with your doctor before you start. If you are planning to become much more physically active than you are now, start by answering the seven questions in the box below. If you are between the ages of 15 and 69, the PAR-Q will tell you if you should check with your doctor before you start. If you are over 69 years of age, and you are not used to being very active, check with your doctor. Common sense is your best guide when you answer these questions. Please read the questions carefully and answer each one honestly: check YES or NO
YES NO 1. Has your doctor ever said that you have a heart condition and that you should only do physical activity recommended by a doctor?
YES NO 2. Do you feel pain in your chest when you do physical activity?
YES NO 3. In the past month, have you had chest pain when you were not doing physical activity?
YES NO 4. Do you lose your balance because of dizziness or do you ever lose consciousness?
YES NO 5. Do you have a bone or joint problem (for example, back, knee or hip) that could be made worse by a change in your physical activity?
YES NO 6. Is your doctor currently prescribing drugs (for example, water pills) for your blood pressure or heart condition?
YES NO 7. Do you have a diabetes or thyroid condition?
YES NO 8. Do you know of any other reason why you should not do physical activity?
If you answered “Yes”:
YES to one or more questions
A medical clearance form is required of all participants who answer ‘yes’ to any of the eight PAR-Q questions. Note: Personal training staff reserve the right to require medical clearance from any client they feel may be at risk.
• Discuss with your personal doctor any conditions that may affect your exercise program.
• All precautions must be documented on the medical clearance form by your personal doctor.
NO to all questions If you answered NO honestly to all PAR-Q questions, you can be reasonably sure that you can:
• start becoming much more physically active - begin slowly and build up gradually. This is the safest and easiest way to go.
• take part in a fitness appraisal - this is an excellent way to determine your basic fitness so that you can plan the best way for you to live actively. It is also highly recommended that you
DELAY BECOMING MUCH MORE ACTIVE: • If you are not feeling well because of a
temporary illness such a cold or a fever - wait until you feel better; or
• If you are or may be pregnant - talk to your doctor before you start becoming more active.
PLEASE NOTE: If your health changes so that you then answer YES to any of the above questions, tell your fitness
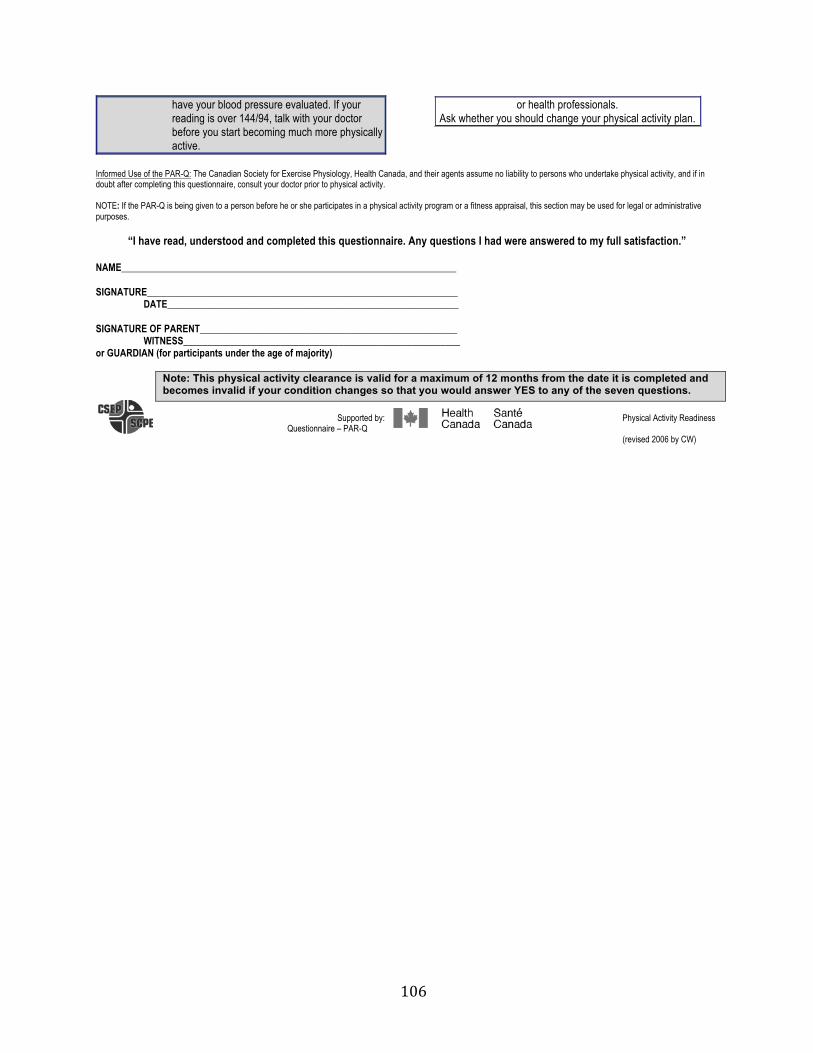
106
have your blood pressure evaluated. If your reading is over 144/94, talk with your doctor before you start becoming much more physically active.
or health professionals. Ask whether you should change your physical activity plan.
Informed Use of the PAR-Q: The Canadian Society for Exercise Physiology, Health Canada, and their agents assume no liability to persons who undertake physical activity, and if in doubt after completing this questionnaire, consult your doctor prior to physical activity. NOTE: If the PAR-Q is being given to a person before he or she participates in a physical activity program or a fitness appraisal, this section may be used for legal or administrative purposes.
“I have read, understood and completed this questionnaire. Any questions I had were answered to my full satisfaction.”
NAME_____________________________________________________________________ SIGNATURE________________________________________________________________ DATE____________________________________________________________ SIGNATURE OF PARENT_____________________________________________________ WITNESS_________________________________________________________ or GUARDIAN (for participants under the age of majority)
Note: This physical activity clearance is valid for a maximum of 12 months from the date it is completed and becomes invalid if your condition changes so that you would answer YES to any of the seven questions.
Supported by: Physical Activity Readiness
Questionnaire – PAR-Q (revised 2006 by CW)
107
APPENDIX 2
Research Consent Form Title of Research Project:
An investigation of skeletal muscle bioenergetics, and mitochondrial function in patients with Malignant Hyperthermia.
Investigators:
Dr. Sheila Riazi, Toronto General Hospital, Dept. of Anaesthesia and Pain Management, 416-340-3128
Dr. Greg Wells, Hospital for Sick Children, Physiology and Experimental Medicine, 416-978-3244
Dr. Mark Tanopolsky McMaster University, Division of Neurology, Dept. Pediatrics and Medicine, 905-521-2100 x 75226. 24 hour number: 416-790-0940
Purpose of the Research:
Malignant Hyperthermia (MH) is a genetic disorder of the muscles. It is generally characterized by a quick and severe reaction to anesthetics sometimes causing increased temperature and heart rate. If left untreated MH can be life-threatening. Stress and exercise may induce other symptoms that include muscular fatigue, muscle cramps, and muscle pain. Recently there have been documented risks in susceptible MH, indicating stressors like strenuous exercise, overheating, and use of some heart medications may induce an MH reaction in some patients.
A large number of Malignant Hyperthermia Susceptible (MHS) patients appear normal. But there is a significant group of MHS patients that, although their muscles when examined appear normal, suffer from fatigue, cramps, and muscle pain, affecting their daily activities. Unexplainably, these patients have persistently high creatine kinase (CK), an enzyme involved in energy consumption, in their muscles. Recent research shows that there are problems with the mitochondria in people with MHS. Mitochondria are organelles that produce energy for cells to function. Recent research also shows that increased levels of calcium in the muscle, causing dysfunction in the mitochondria, can activate inflammation.
In this study, 40 MHS individuals, from the Canadian MH-center, will voluntarily be examined using magnetic resonance spectroscopy (MRS) and functional imaging at rest and after exercise, and muscle biopsies will be performed and analyzed. We will also test 20 healthy individuals of age, sex, and BMI-matched to the MHS individuals as a control. These methods will provide
108
insight into the mechanism of MH, leading to rationale for new therapies and interventions for MHS patients.
Description of the Research:
This is a blinded research study.
To participate in this study, you must:
- be 18-70 years old
- have been tested for MH
A total of 15 individuals will be enrolled in this study.
Group 1 – MHS patients with no muscle symptoms (20 patients) Group 2 – MHS patients with non-specific muscle symptoms (20 patients)
Group 3 – Controls that have had a negative caffeine halothane contracture (CHC) test (20
individuals)
If you chose to participate, the study will take 5 hours not including travel time. Your descriptive data will be collected at Toronto General Hospital such as your age, height, weight, and your regular physical activity. Your cardiopulmonary fitness and muscle strength will also be assessed at the Hospital for Sick Children where you will also be imaged using magnetic resonance imaging (MRI). An optional minimally invasive muscle biopsy (muscle sample) will be performed with your consent. If you choose to consent the optional muscle biopsy will take place at McMaster University, in Hamilton.
Descriptive data (Toronto General Hospital, approximately 30 minutes): Age, height, and weight will be recorded. Habitual physical activity will be assessed using a questionnaire.
Cardiopulmonary Exercise Test (Hospital for Sick Children, approximately one hour including set up):
This test determines your physical fitness to see how much exercise your body can handle. You will be asked to exercise on a stationary bike, slowly increasing in intensity of the exercise. Your finger will be pricked twice for a drop of blood, during the test. You will be wearing a heart monitor and a blood pressure cuff, and will be supervised the whole time by a trained exercise physiologist.
Magnetic Resonance Imaging and Spectroscopy (Hospital for Sick Children, approximately two hours including set up):
109
You will then be asked to do 3 different exercises on a stationary bike and receive the MRI.
1st exercise – 30 seconds of maximum exercise (100% work), 5 minutes rest Rest period 2nd exercise – 90 seconds exercise (85% work), 5 minutes rest
Rest period 3rd exercise – 5 times 30 seconds of exercise (60% work) with 15 seconds of rest in between, 5 minutes rest
Rest period
Your total scan time will be approximately 90 minutes including set up, anatomical images and exercise testing. An exercise physiologist and MR technician will monitor all these steps.
Optional Muscle Biopsy (McMaster University, approximately 90 minutes): You will be asked to donate muscle tissue through a minimally invasive procedure. This procedure will be performed by Dr. Mark Tarnopolsky, a physician at McMaster University who has performed this procedure more than 12,000 times. Dr. Tarnopolsky will screen participants for bleeding disorders prior to performing the biopsy. A separate consent form will explain the procedure in detail. Potential Harms: Patients will be informed of the differences between habitual physical activity (i.e. activities of daily living such as chores) and regular exercise (i.e. structured activities such as soccer), as they will be participating in structured exercise during this study. Patients with pacemakers, metal implants, metal clips, or metal chips must notify Dr Wells prior to recruitment, as they can be dangerous in the MRI machine. All participants will be screened by the MR technician prior to testing in the MRI to ensure safe participation. A separate consent form will be required to complete the muscle biopsy and the potential harms associated with this procedure are explained within the muscle biopsy consent.
We know of no other harms in this study, but there may be harms that we do not know about.
Potential Discomforts or Inconvenience:
Time commitment: 5 hours plus travel time
Potential Benefits: To individual subjects: You will not benefit directly from participating in this study.
110
To society:
Insight to MH to propose rational for new therapies and/or interventions for MHS patients.
Confidentiality: We will respect your privacy. No information about who you are will be given to anyone or be published without your permission, unless required by law. For example, the law could make us give information about you if a child has been abused, if you have an illness that could spread to others, if you or someone else talks about suicide, or if the court orders us to give them the study papers. Sick Kids Clinical Research Monitors, or the regulator of the study may access the study records and your health records to check on the study. By signing this consent form, you agree to let these people look at your records. We will put a copy of this research consent form in your patient health record and give you a copy as well. The data produced from this study will be stored in a secure, locked location. Only members of the research team will have access to the data. Following completion of the research study the data will be kept as long as required then destroyed as required by Sick Kids policy. Published study results will not reveal your identity. Reimbursement: We will reimburse you for all your reasonable out of pocket expenses for being in this study e.g., meals, babysitters, parking and getting you to and from Toronto General, Sick Kids and McMaster University, up to a maximum of $200.00. If you stop taking part in the study, we will pay you for your expenses for taking part in the study up until that point. Voluntary Participation: It is your choice to take part in this study. You may leave the study at any time without affecting your care at Toronto General Hospital, MHIU, SickKids or any other care facilities. You may refuse to answer any questions you do not want to answer, or not answer an interview question by saying “pass”. New information that we get while we are doing this study may affect your decision to take part in this study. If this happens, we will tell you about this new information. And we will ask you again if you still want to be in the study. During this study we may create new tests, new medicines, or other things that may be worth some money. Although we may make money from these findings, we cannot give you any of this money now or in the future because you took part in this study. If you become ill or are harmed because of study participation, you will be treated for free. Your signing this consent form does not interfere with your legal rights in any way. The staff of the
111
study, any people who gave money for the study, or the hospital are still responsible, legally and professionally, for what they do. Alternatives to Participation: If you choose not to be a part of this study there will be no repercussions. You may participate in other studies at any of the institutions that are involved in the current research. There are no specific alternatives to participation available as part of this research. Questions about the study: If you encounter any issues you should contact your physician and Dr. Greg Wells at 416-978-3244. If you have any questions, concerns or would like to speak to the study team for any reason, please call Dr. Wells. If you have questions about your right as a subject in this study or for information on whom to contact in the event of injuries during this study, please call the SickKids Research Ethics Manager at 416-813-5718 or the Chair of the University Health Network Research Ethics Board (REB) or the Research Ethics office number at 416-581-7849. The REB is a group of people who oversee the ethical conduct of research studies. These people are not part of the study team. Everything that you discuss will be kept confidential. Sponsorship: The sponsor/funder of this research is the Exercise Medicine Fund at the Hospital for Sick Children and the University of Toronto Department of Anaesthesia Internal Research Award. You will be informed of any changes to the sponsor/funding of this project. Conflict of Interest: I, and the other research team members have no conflict of interest to declare. Consent: By signing this form, I agree that: 1) You have explained this study to me. You have answered all my questions. 2) You have explained the possible harms and benefits (if any) of this study. 3) I know what I could do instead of taking part in this study. I understand that I have the
right not to take part in the study and the right to stop at any time. My decision about taking part in the study will not affect my health care.
4) I am free now, and in the future, to ask questions about the study. 5) I have been told that my medical records will be kept private except as described to me. 6) I understand that no information about who I am will be given to anyone or be published
without first asking my permission.
112
7) I agree, or consent, to take part in this study. ________________________________ Printed Name of Participant & Age Participant’s signature & date ____ _____________________ Printed Name of Participant & Age Signature of person who explained consent & date _________________________________
Printed Witness’ name (if the subject Witness’ signature & date does not read English) If you have any questions about this study, please call Dr. Sheila Riazi, at 416-340-3128 or Greg Wells Ph.D. at 416-978-3244. If you have questions about your rights as a subject in a study or injuries during a study, please call the SickKids Research Ethics Manager at 416-813-5718.
113
APPENDIX 3
CONSENT TO PARTICIPATE IN A RESEARCH STUDY
Title of the Research
An investigation of skeletal muscle bioenergetics, and mitochondrial function in patients with Malignant Hyperthermia
Investigators
Principal Investigator
Dr. Sheila Riazi Toronto General Hospital Dept. of Anaesthesia and Pain Management Co-Investigator Dr. Greg Wells Hospital for Sick Children Physiology, and experimental medicine Dr. Mark Tarnopolsky McMaster University Division of Neurology, Department Pediatrics and Medicine, 24 hour number (pager): 416-790-0940 Purpose of the Research
Malignant Hyperthermia (MH) is a genetic disorder of the muscles. It is generally characterized by a quick and severe reaction to anaesthetics sometimes causing increased temperature and heart rate. If left untreated MH can be life-threatening. Stress and exercise may induce other symptoms that include muscular fatigue, muscle cramps, and muscle pain. Recently there have been documented risks in MH positive patients, indicating stressors like strenuous exercise, overheating, and use of some heart medications may induce an MH reaction in some patients.
A large number of Malignant Hyperthermia Susceptible (MHS) patients appear normal. But there is a significant group of MHS patients that, although their muscles when examined appear normal, suffer from fatigue, cramps, and muscle pain, affecting their daily activities. It is not known why these patients have persistently high creatine kinase (CK), an enzyme involved in energy consumption, in their muscles,
Recent research also shows that there are problems with the mitochondria in people with MHS. Mitochondria are inside cells, and produce energy for cells to function.
Recent research shows that increased levels of calcium in the muscle, causing dysfunction in the mitochondria, can activate inflammation.
In this study, 20 MHS individuals, from the Canadian MH-center, will voluntarily be examined using magnetic resonance spectroscopy (MRS) and functional imaging at rest and after exercise, and muscle biopsies will be performed and analyzed. 10 healthy individuals of similar age, sex, and body mass index to the MHS individuals will also be tested as a control. These methods will provide insight into the mechanism of MH, and may lead to new therapies and interventions for
114
MHS patients. If the exact mechanism causing the muscle problems in MH patients is found in this study, then drugs targeting the problem can be produced, and used.
Description of the Research
This is a blinded research study (Both co-investigators won’t be aware of MH versus healthy participants, in order to keep the study free of bias).
To participate in this study, you must:
- be 18-70 years old - have been tested for MH A total of 30 individuals will be enrolled in this study. Group 1 – MHS patients with no muscle symptoms (10 patients) Group 2 – MHS patients with non-specific muscle symptoms (10 patients) Group 3 – Healthy Controls – with no muscle symptoms (10 individuals) If you chose to participate, the study will take 4 hours. Your descriptive data will be collected such as your age, height, weight, and your regular physical activity. Your cardiopulmonary and muscle strength will also be assessed. Finally you will be imaged using magnetic resonance imaging (MRI) and spectroscopy. The MRI will take place at Hospital for Sick Children. An optional minimally invasive muscle biopsy (muscle sample) will be performed with your consent. If you choose to consent the optional muscle biopsy will take place at McMaster University, in Hamilton. Description of Assessments Descriptive data: Age, height, and weight will be recorded. Habitual physical activity will be assessed using a questionnaire. Cardiopulmonary Exercise Test: this test determines your physical fitness to see how much exercise your body can handle. You will be asked to exercise on a stationary bike, slowly increasing in intensity of the exercise. Your finger will be pricked twice for a drop of blood, during the test. You will be wearing a heart monitor and a blood pressure cuff, and will be supervised the whole time by a trained exercise physiologist. Magnetic Resonance Imaging and Spectroscopy: You will be injected with a small amount of isotope named 31P, which is a low dose phosphorus (phosphate) and water solution similar to colouring dye (very low dose radiation, used as a marker for muscle activity) used in this type of magnetic resonance imaging. There are no known side effects associated with this isotope. You will then be asked to do 3 different exercises on a stationary bike and receive the MRI.
1st exercise – 30 seconds of maximum exercise (100% work), 5 minutes rest, 90 seconds exercise (85% work) Rest period (2 minutes) 2nd exercise –5 times 30 seconds of exercise (60% work) with 15 seconds of rest in between Rest period (2 minutes) 3rd exercise – 60 seconds rest, 3 times 60 seconds exercise (65%) work followed by 2 minutes
115
recovery This all adds up to a total scan time of 10 minutes (MRI scanning will be done between exercise periods)
An exercise physiologist will monitor all these steps
Risks Except for noise, MRI is painless, and safe. Patients with pacemakers, metal implants, metal clips, or metal chips must notify Dr Riazi prior to recruitment, as they can be dangerous in the MRI machine. There is no radiation from the scan itself. Some people may feel a little ‘closed-in’ the MR machine. You will be able to speak with some one at all times and can stop test at any time. If patients do not tolerate exercise, the testing will be stopped immediately. With this controlled-exercise protocol, there is no risk of triggering any MH reaction. We know of no other harms in this study, but there may be harms that we do not know about. Potential Benefits To Individual: There are no immediate benefits to study participants. To society: insight to MH to propose rational for new therapies and/or interventions for MHS patients Voluntary Participation Your participation in this study is voluntary. You may decide to not be in the study, or to be in the study now then change your mind later. You may leave the study at any time without affecting your care at Toronto General Hospital, MHIU, or any other care facilities. You may refuse to answer any questions you do not want to answer, or not answer an interview question by saying “pass”. We will give you new information that is learned during the study that might affect your decision to stay in the study.
Confidentiality If you agree to join this study, the study doctor and his/her study team will look at your personal health information and collect only the information they need for the study. Personal health information is any information that could be used to identify you and includes your:
• name, • address, • date of birth, • new or existing medical records, that includes types, dates and results of medical tests or
procedures.
The information that is collected for the study will be kept in a locked and secure area by the study doctor for 10 years. Only the study team or the people or groups listed below will be allowed to look at your records. Your participation in this study also may be recorded in your

116
medical record at this hospital.
Representatives of the University Health Network Research Ethics Board may look at the study records and at your personal health information to check that the information collected for the study is correct and to make sure the study followed proper laws and guidelines.
All information collected during this study, including your personal health information, will be kept confidential and will not be shared with anyone outside the study unless required by law. You will not be named in any reports, publications, or presentations that may come from this study.
If you decide to leave the study, the information about you that was collected before you left the study will still be used. No new information will be collected without your permission.
In Case You Are Harmed in the Study If you become ill, injured or harmed as a result of taking part in this study, you will receive care. The reasonable costs of such care will be covered for any injury, illness or harm that is directly a result of being in this study. In no way does signing this consent form waive your legal rights nor does it relieve the investigators, sponsors or involved institutions from their legal and professional responsibilities. You do not give up any of your legal rights by signing this consent form. Conflict of Interest Researchers have an interest in completing this study. Their interests should not influence your decision to participate in this study.
Questions About the Study If you have any questions, concerns or would like to speak to the study team for any reason, please call: Dr. Sheila Riazi at 416-790-0940. If you have any questions about your rights as a research participant or have concerns about this study, call the Chair of the University Health Network Research Ethics Board (REB) or the Research Ethics office number at 416-581-7849. The REB is a group of people who oversee the ethical conduct of research studies. These people are not part of the study team. Everything that you discuss will be kept confidential.
Consent This study has been explained to me and any questions I had have been answered. I know that I may leave the study at any time. I agree to take part in this study.
Only Part 1 of the study, which includes the cardiopulmonary exercise test and MRI imaging (no muscle biopsy).
I am interested in reviewing the consent for Part 2 of the study which includes a muscle biopsy. Note: A muscle biopsy study consent will be presented to you if you wish to participate in this part of the study of the study. The biopsy will be done at Hamilton Health Science Centre and requires you to travel to Hamilton Ontario.
117
_____________________ _______________ ____________
Print Study Participant’s Name Signature Date
(You will be given a signed copy of this consent form)
My signature means that I have explained the study to the participant named above. I have answered all questions.
______________________ _______________ ____________
Print Name of Person Obtaining Signature Date Consent
Was the participant assisted during the consent process? YES NO
Date
If YES, please check the relevant box and complete the signature space below:
The person signing below acted as a translator for the participant during the consent process and attests that the study as set out in this form was accurately translated and has had any questions answered.
_______________________ ________________ ___________
Print Name of Translator Signature Date
________________________ _________________
Relationship to Participant Language
The consent form was read to the participant. The person signing below attests that the study as set out in this form was accurately explained to, and has had any questions answered.
______________________ ___________________ ____________ Print Name of Witness Signature Date
Relationship to Participant

118
APPENDIX 4
An investigation of skeletal muscle bioenergetics, and mitochondrial function in patients with malignant hyperthermia
Data Collection sheet ID number: Gender: Proband: Y/N Age: Weight/Height: Race: MH reaction: Y/N CHCT results:
Exclusion criteria are: Patients with any distinct muscle abnormality in histopathology (i.e. Duchenne muscular dystrophy, central core disease, multiminicore disease); Patients intolerant to exercise; Patients, who are on statin, anticoagulation drugs, and significant cardiac history; Patients with metal implants (MRI-incompatible); and Pregnant patients. List any skeletal signs/symptoms: Patient’s symptoms: muscle pain/ joint pain/muscle weakness/muscle cramps/activities of daily living/heat exhaustion/exercise intolerance Cleft palate/Scoliosis/hernia Signs of muscle abnormality: NCV/EMG/HISTOPATHOLOGY results if available: Any symptoms of Chronic fatigue syndrome: Medications used:

119
APPENDIX 5
THE HAES (HABITUAL ACTIVITY ESTIMATION SCALE)
This questionnaire will ask you questions about your daily activities. Please read all of the instructions carefully and answer each question as truthfully as you can.
Name: _________________________________________________
Date: ___________________________ INSTRUCTIONS (please read!) Please recall the activities of one typical weekday (choose from Tuesday, Wednesday or Thursday) and one typical Saturday within the past 2 weeks. For each given time period, please estimate the percentage of time that you spent in each of 4 different activity levels. For each of the time periods, the total time spent in all activity levels must add up to 100%. The different activity levels are described below:
ACTIVITY LEVEL DESCRIPTIONS
These descriptions give you examples of activities that are typical of each activity level. You should refer back to these descriptions as often as you need when completing your estimates.
a) inactive – lying down, sleeping, resting, napping
b) somewhat inactive – sitting, reading, watching television, playing video games, time in front of the computer, playing games or activities which are mostly done sitting down
c) somewhat active – walking, shopping, light household chores
d) very active – running, jumping, skipping, bicycling, skating, swimming, games that require lots of movement and make you breathe/sweat hard
Following is a sample of a completed time period:
SAMPLE
From when you finished breakfast until when you started lunch, please estimate the percentage of time that you spent in each of the following activity levels: a) inactive 5% (i.e., having a nap) b) somewhat inactive 60% (i.e., watching TV)

120
c) somewhat active 25% (i.e., shopping) d) very active 10% (i.e., riding a bicycle) TOTAL 100%
WEEKDAY ACTIVITY
For one typical weekday in the past 2 weeks, (choose from one of Tuesday, Wednesday or
Thursday), please estimate the percentage of time that you spent in each activity level.
1. After getting out of bed until starting breakfast:
a) inactive ______ %
b) somewhat inactive ______ %
c) somewhat active ______ %
d) very active ______ %
TOTAL 100%
2. After finishing breakfast until starting lunch:
a) inactive ______ %
b) somewhat inactive ______ %
c) somewhat active ______ %
d) very active ______ %
TOTAL 100%
3. After finishing lunch until starting supper:
a) inactive ______ %
b) somewhat inactive ______ %
c) somewhat active ______ %
d) very active ______ %
TOTAL 100%
4. After finishing supper until bedtime:
a) inactive ______ %
b) somewhat inactive ______ %

121
c) somewhat active ______ %
d) very active ______ %
TOTAL 100%
For the typical weekday that you are referring to, please answer the following questions as
accurately as possible in the spaces provided.
5. At what time did you get out of bed in the morning? ______
6. At what time did you start eating breakfast? ______
7. How long did you spend eating breakfast? ______ minutes
8. At what time did you start eating lunch? ______
9. How long did you spend eating lunch? ______ minutes
10. At what time did you start eating supper? ______
11. How long did you spend eating supper? ______ minutes
12. At what time did you go to bed that evening? ______
13. For the typical weekday that this questionnaire has asked you about, please rate your
overall level of activity (please circle one response only):
a) very inactive
b) inactive
c) somewhat inactive
d) somewhat active
e) active
f) very active
14. Is this “typical” Tuesday, Wednesday or Thursday that you described in this
questionnaire (please circle one response only):
a) a lot like most weekdays
b) a little bit like most weekdays
c) a little bit different from most weekdays
d) a lot different from most weekdays

122
SATURDAY ACTIVITY
For one typical Saturday in the past 2 weeks, please estimate the percentage of time that you
spent in each activity level.
15. After getting out of bed until starting breakfast:
a) inactive ______ %
b) somewhat inactive ______ %
c) somewhat active ______ %
d) very active ______ %
TOTAL 100%
16. After finishing breakfast until starting lunch:
a) inactive ______ %
b) somewhat inactive ______ %
c) somewhat active ______ %
d) very active ______ %
TOTAL 100%
17. After finishing lunch until starting supper:
a) inactive ______ %
b) somewhat inactive ______ %
c) somewhat active ______ %
d) very active ______ %
TOTAL 100%
18. After finishing supper until bedtime:
a) inactive ______ %
b) somewhat inactive ______ %
c) somewhat active ______ %
d) very active ______ %
TOTAL 100%

123
For the typical Saturday that you are referring to, please answer the following questions as
accurately as possible in the spaces provided.
19. At what time did you get out of bed in the morning? ______
20. At what time did you start eating breakfast? ______
21. How long did you spend eating breakfast? ______
minutes
22. At what time did you start eating lunch? ______
23. How long did you spend eating lunch? ______
minutes
24. At what time did you start eating supper? ______
25. How long did you spend eating supper? ______
minutes
26. At what time did you go to bed that evening? ______
27. For the typical Saturday that this questionnaire has asked you about, please rate your
overall level of activity (please circle one response only):
a) very inactive
b) inactive
c) somewhat inactive
d) somewhat active
e) active
f) very active
28. Is the “typical” Saturday that you described in this questionnaire (please circle one
response only):
a) a lot like most Saturdays
b) a little bit like most Saturdays
c) a little bit different from most Saturdays
d) a lot different from most Saturdays

124
29. If you have any comments about your activity patterns that you think are important,
please mention them on the back of this page. Thank-you.
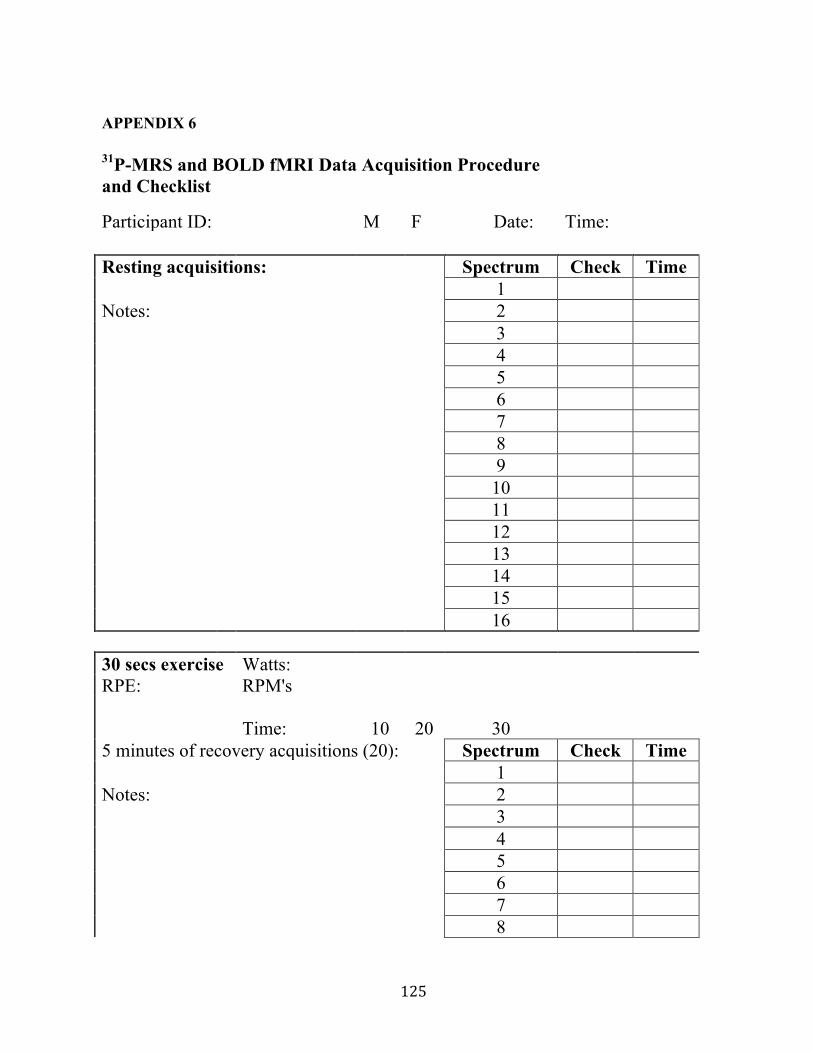
125
APPENDIX 6
31P-MRS and BOLD fMRI Data Acquisition Procedure and Checklist
Participant ID:
M F Date: Time:
Resting acquisitions: Spectrum Check Time
1
Notes:
2
3
4
5
6
7
8
9
10
11
12
13
14
15
16
30 secs exercise Watts: RPE:
RPM's
Time: 10
20 30
5 minutes of recovery acquisitions (20): Spectrum Check Time
1
Notes:
2
3
4
5
6
7
8
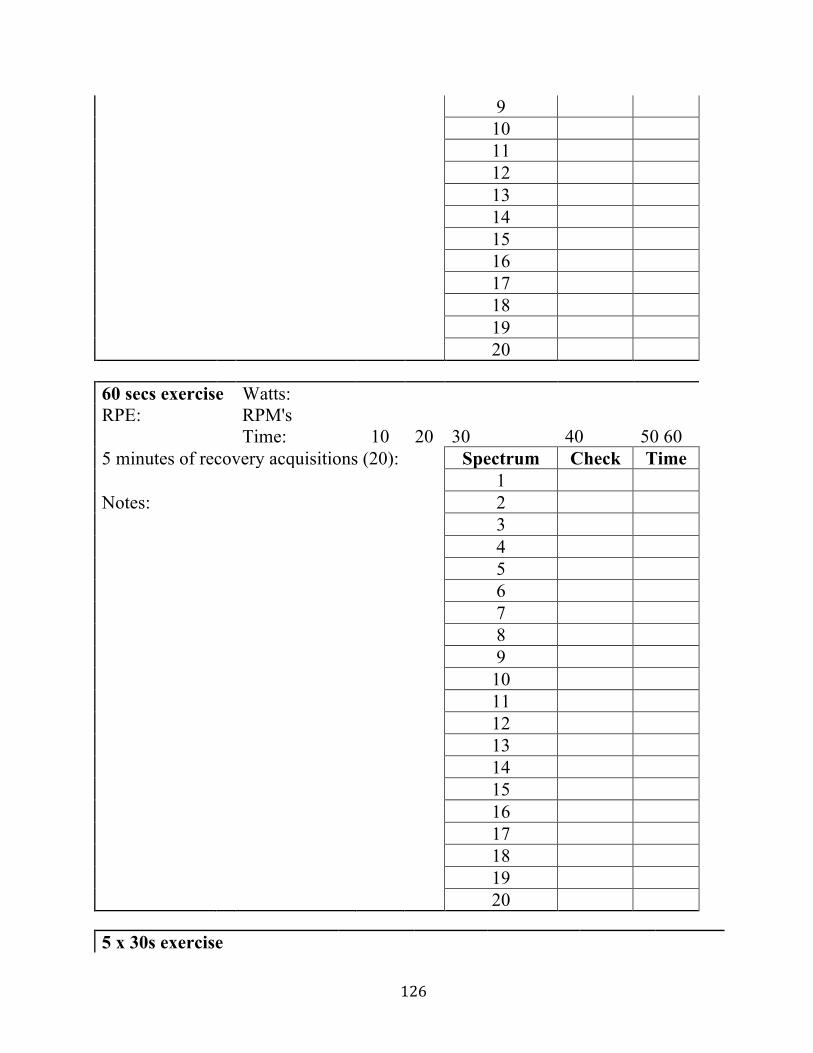
126
9
10
11
12
13
14
15
16
17
18
19 20
60 secs exercise Watts: RPE:
RPM's
Time: 10 20 30 40 50 60 5 minutes of recovery acquisitions (20): Spectrum Check Time
1
Notes:
2
3
4
5
6
7
8
9
10
11
12
13
14
15
16
17
18
19
20 5 x 30s exercise

127
Task Time Watts RPM's Check RPE
0 Exercise Spectrum 45 Exercise Spectrum 1:30 Exercise Spectrum 2:15 Exercise Spectrum 3:00 Exercise Spectrum 3:45 Exercise Spectrum 4:30 Exercise Spectrum 5:15 Exercise Spectrum 6:00 Exercise Spectrum 6:45 Exercise Spectrum
5 minutes of recovery acquisitions (20): Spectrum Check Time
1
Notes:
2
3
4
5
6
7
8
9
10
11
12
13
14
15
128
16
17
18
19
20
Other Comments or Notes:
Watts RPM
BOLD 1 min rest 10-9 min
1 min exerc 9-8 min
2 min rest 8-6 min
1 min exerc 6-5 min
2 min rest 5-3 min
1 min exerc 3-2 min
2 min rest 2-0 min

129
APPENDIX 7
An investigation of skeletal muscle bioenergetics, and mitochondrial function in patients with malignant hyperthermia
Data Collection sheet Date: Age: Study ID: Height: Gender: Weight: Breakfast: Lunch: PA day before: YMCA Submax Test (~ 1 hour after lunch): HR max (220-age): 85% HR max: Resting HR: HR after 1st workload: RPE (legs, lungs): Workload Watts HR/RPE
2nd min 3rd min 4th min 2nd
3rd
4th
5th SaO2 end of exercise: Comments:

130
Handgrip (~ 1 hour after YMCA) 1st trial (kg): 2nd trial (kg): 3rd trial (kg): Comments: Vertical jump: Standing height (inches): Jump height (inches) Vertical jump = jump height
– standing height
Comments: Wingate: Peak Power (W): Mean Power (W): Fatigue Index (%): Comments:

131
APPENDIX 8
Equation List
1) Mg2+ equation (Iotti et al., 2000)
2) pH equation (Iotti et al., 2000)
3) PCr recovery time constant equation: b+a*exp(-(x/c))
b = baseline PCr
a = difference between end-exercise and baseline PCr
c = time constant
x = time
4) High energy phosphagen ATP production rate (Newcomer et al., 1997)
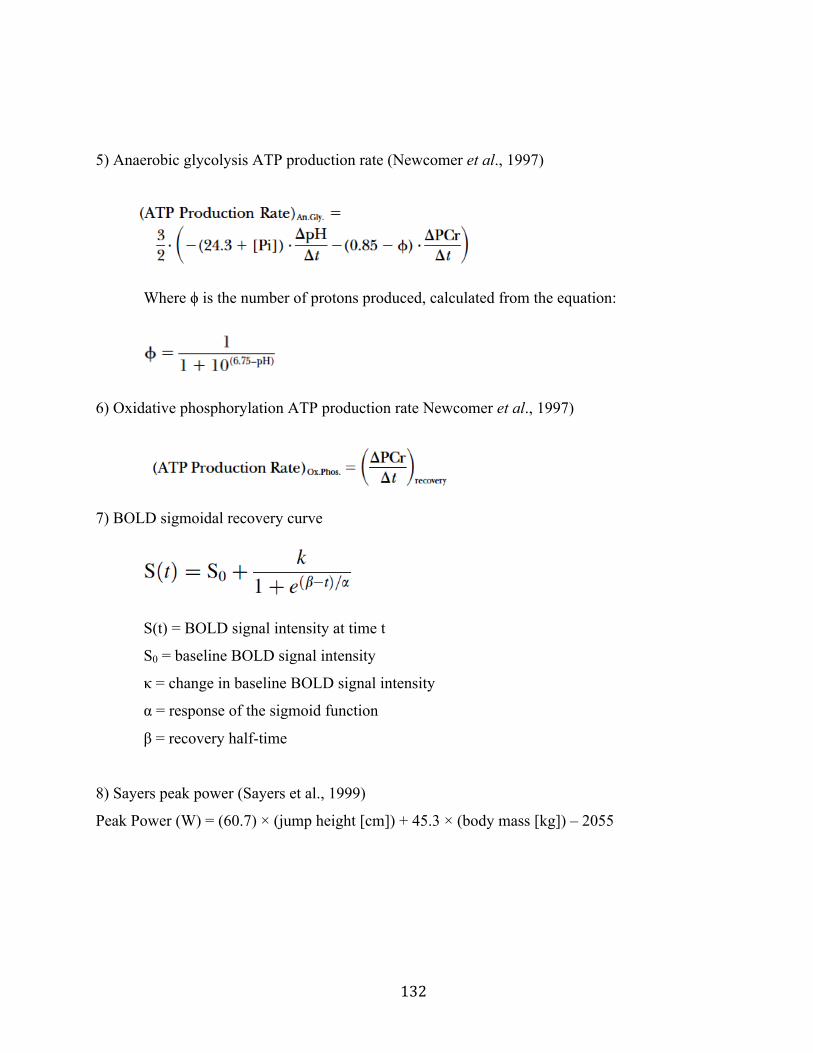
132
5) Anaerobic glycolysis ATP production rate (Newcomer et al., 1997)
Where ϕ is the number of protons produced, calculated from the equation:
6) Oxidative phosphorylation ATP production rate Newcomer et al., 1997)
7) BOLD sigmoidal recovery curve
S(t) = BOLD signal intensity at time t
S0 = baseline BOLD signal intensity
κ = change in baseline BOLD signal intensity
α = response of the sigmoid function
β = recovery half-time
8) Sayers peak power (Sayers et al., 1999)
Peak Power (W) = (60.7) × (jump height [cm]) + 45.3 × (body mass [kg]) – 2055

133
APPENDIX 9
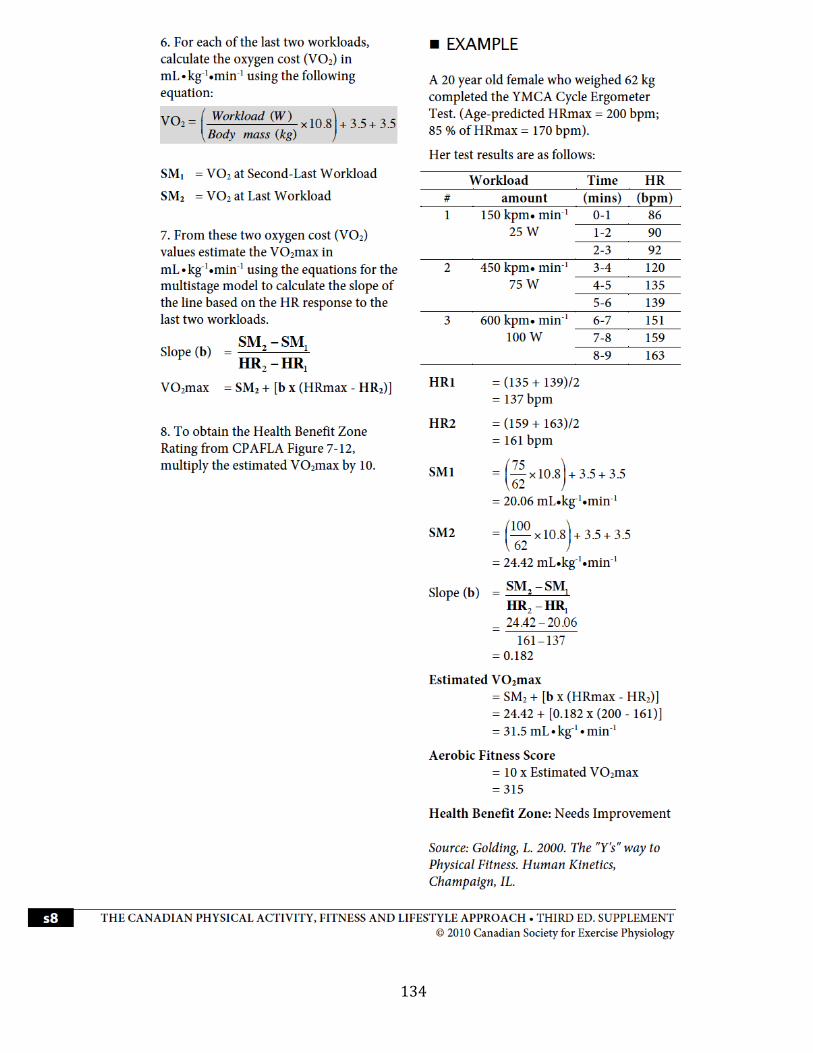
134