size of the public sector: government wage bill and...
TRANSCRIPT

Size of the Public Sector: Government Wage Bill and Employment1
November 2015
1This note draws on the note which was prepared by Zac Mills with Sudyumna Dahal, Colum Garrity, and Nick Manning that accompanied an earlier dataset. We are also grateful for comments and guidance provided by Gary Jones and Sage de Clerck at the IMF, Steven Kapsos at the ILO and Marinus Verhoeven, Cem Dener, Joanna Watkins, Zac Mills and members of the Global Solutions Group on HRM at the World Bank. Thanks are also due to Michael Roscitt and Patricia Austria for helping to edit and finalize the note. We are grateful for suggestions on how to improve this note as and improve and expand the dataset. Please address questions or comments to Vivek Srivastava ([email protected]) and Michael Roscitt ([email protected]).
SIZE OF THE PUBLIC SECTOR Government Wage Bill and Employment1
Emily Baddock
Peter Lang
Vivek Srivastava
Global Solutions Group on HRM
Governance Global Practice
The World Bank
NOVEMBER 2015

Size of the Public Sector: Government Wage Bill and Employment
Table of Contents Introduction .................................................................................................................................... 1
I. Measuring Government Wage Bill and Employment .............................................................. 1
A. Common Indicators .............................................................................................................. 1
B. Issues to consider in using indicators for wage bill and government employment data .... 2
II. Definitions ................................................................................................................................ 3
A. Government Entities Covered for Wage Bill Data ............................................................... 3
B. Wage Bill .............................................................................................................................. 5
C. Government Revenue, Total Expenditure and Expense, GDP and Population ................... 6
D. Government Entities Covered for Employment Regimes ................................................ 6
III. Data & Methodology ........................................................................................................... 7
A. IMF Government Finance Statistics (GFS) ........................................................................... 7
B. ILO LABORSTA .................................................................................................................... 10
C. IMF WEO ............................................................................................................................ 10
D. HRMIS & Pay Roll ............................................................................................................ 10
E. ICP PPP ............................................................................................................................... 11
F. Other Sources .................................................................................................................... 11
IV. Descriptive Statistics .......................................................................................................... 11
References .................................................................................................................................... 19
Appendix A: Potential Sources of Relevant Wage Bill Data .......................................................... 12
Appendix B: GFS Reference Chart ................................................................................................. 16

1
Size of the Public Sector: Government Wage Bill and Employment
Introduction
This note accompanies and describes an updated dataset (2000-2013)2 on public sector wage bills, total expenditure, revenues and government employment. The dataset also includes data on GDP and population and Purchasing Power Parity (PPP) exchange rates. In addition, available information on Human Resource Management Information Systems (HRMIS) and Pay Roll Systems has also been added
3. The data have been updated as of June 2015 from the various sources described below. As there are some inconsistencies in the definitions across the different data sources, we have made every effort to point these out in the text. The rest of the note is organized as follows: Section 1 introduces general indicators for assessing the wage bill and public employment; Section 2 provides definitions; Section 3 lists the data sources and methodology; Section 4 presents some summary statistics derived from the data; Appendix A outlines additional potential sources related to wage bill data; Appendix B offers clarifying information on the exact sources of the wage bill data.
I. Measuring Government Wage Bill and Employment While these data may be used for any analysis, the purpose of assembling these data is in part to provide operational World Bank staff with some reference points and comparators to situate a country that they are rating for the Country Policy and Institutional Assessment (CPIA) or analyzing for any other purpose, as “unusual” or an outlier. This exercise does not offer any normative perspective on whether being similar or different to others in the cluster is good or bad or on whether the public sector in a country is large or small.
A. Common Indicators4 The following indicators are commonly used in analyses of Government employment and compensation: Compensation of employees
Compensation of employees as a share of GDP*
Compensation of employees as a share of total expenditure*
Compensation of employees as a share of domestic revenue*
Compensation of employees compared to spending on non-wage outlays
2 The dataset replaces an earlier dataset that covered the period 2000-20008. In several instances the figures are different from those in the earlier dataset. This is because we have relied on the updated data sources for the entire dataset. 3 For this we have incorporated relevant information from the “PFM Systems and eServices” dataset: http://www.worldbank.org/publicfinance/fmis 4 This section draws on Clements et al 2010.

2
Size of the Public Sector: Government Wage Bill and Employment
Employment
Government employment as a percentage of private sector employment
Government employment as a percentage of total employment
Government employment as a percentage of the population* Wage level
Average government wages relative comparator private sector wages
Average government wages relative to GDP per capita
Ratio of the highest government wage to the lowest (compression ratio) [The “*” indicates that indicator is available in the accompanying dataset] Of the four commonly used indicators that are available from this dataset: Government compensation as a share of GDP and as a share of total expenditure “is often useful to compare government compensation of employees as a share of GDP and total government outlays with regional averages and with countries at similar levels of development.” (Clements et al 2010) Government compensation of employees as a share of domestic revenues “points to the sustainability of wage outlays in the absence of donor assistance. On occasion, donors provide assistance for expanding government employment, especially in priority sectors. But these inflows can be volatile and domestic resources may be needed to sustain higher spending on wages going forward.” (Clements et al 2010) Government employment as a percentage of total population “can be helpful in assessing whether employment is adequate (or excessively generous) relative to what is needed to provide essential services to the population.” (Clements et al 2010) As noted earlier, this exercise does not go so far as to offer any normative perspective on whether being similar or different to others in the cluster is “good” or “bad” or on whether the public sector in a country is “large” or “small”. Public employment is a matter of national policy preferences – implicit or explicit. The affordability question can only be considered in the context of country circumstances and of the overall dynamic of change in the wage bill. [Please refer to the section on Descriptive Statistics in this Note for more on this.]
B. Issues to consider in using indicators for wage bill and government employment data
In conducting any type of wage bill analysis or analysis of government employment data using such indicators, the following caveats should be borne in mind: Understatement of spending on employee compensation: It may be the case that in some countries some elements of compensation such as non-monetary allowances and/or benefits are not captured in wages and salaries. Second if public services are delivered by consultants (that is, temporary employees) and/or NGOs this may not be captured as “compensation of employees”. (See also footnote 5 (ii))

3
Size of the Public Sector: Government Wage Bill and Employment
Overstatement of spending on employee compensation: In other cases, wage and employment data might overstate the actual number of public servants available due to the presence of “ghost”/non-existent employees on the government payroll and absenteeism. Exclusion of autonomous entities financed through transfers that perform core government functions: The contingent liabilities from the staffing costs of legally protected monopolies and concessions etc. are ultimately with the government. Examples of these would be revenue authorities, debt management agencies, education boards, and health insurance providers and the like.
Employment guarantees: Governments may have policies guaranteeing employment for university graduates or graduates of teachers’ colleges that foreshadow employment increases. Comparability across countries and datasets: Taking the above caveats into consideration, there will be limitations in comparability across countries and datasets. Users should further analyze country-specific definitions of indicators of interest to ensure comparability (even if figures are being reported correctly by authorities).5
II. Definitions
A. Government Entities Covered for Wage Bill Data Wage bill data are drawn from the IMF’s Government Finance Statistics (GFS) database as of 2014. Definitions are provided for the “general government sector” and “central government subsector [of general government]”. Although wage bill data are not provided for the “public sector”, a definition is provided (International Monetary Fund, 2014):
General Government: “The general government sector consists of resident institutional units that fulfill the functions of government as their primary activity.”
Central Government: “The central government subsector [of general government] consists of the institutional unit(s) of the central government plus those nonmarket Non Profit Institutions that are controlled by the central government. The political authority of the central government extends over the entire territory of the country.”
5 Two examples (personal communication with colleagues in the IMF’s Fiscal Affairs Department, Sep 2014): i) It is not a sure thing that the ILO number of employees for the general government would match the definition
of the wage bill in GFS. For example, some countries include an imputation for employer social security contributions that increases the wage bill relative to countries that do not;
ii) The understatement of spending might be due to the nature of expenditure. For example, in Germany public health care spending could be higher in goods and services than in compensation of employees, even if the overall health spending is at similar levels (this just reflects that many health care professionals are private providers with contracts with the government).
4
Size of the Public Sector: Government Wage Bill and Employment
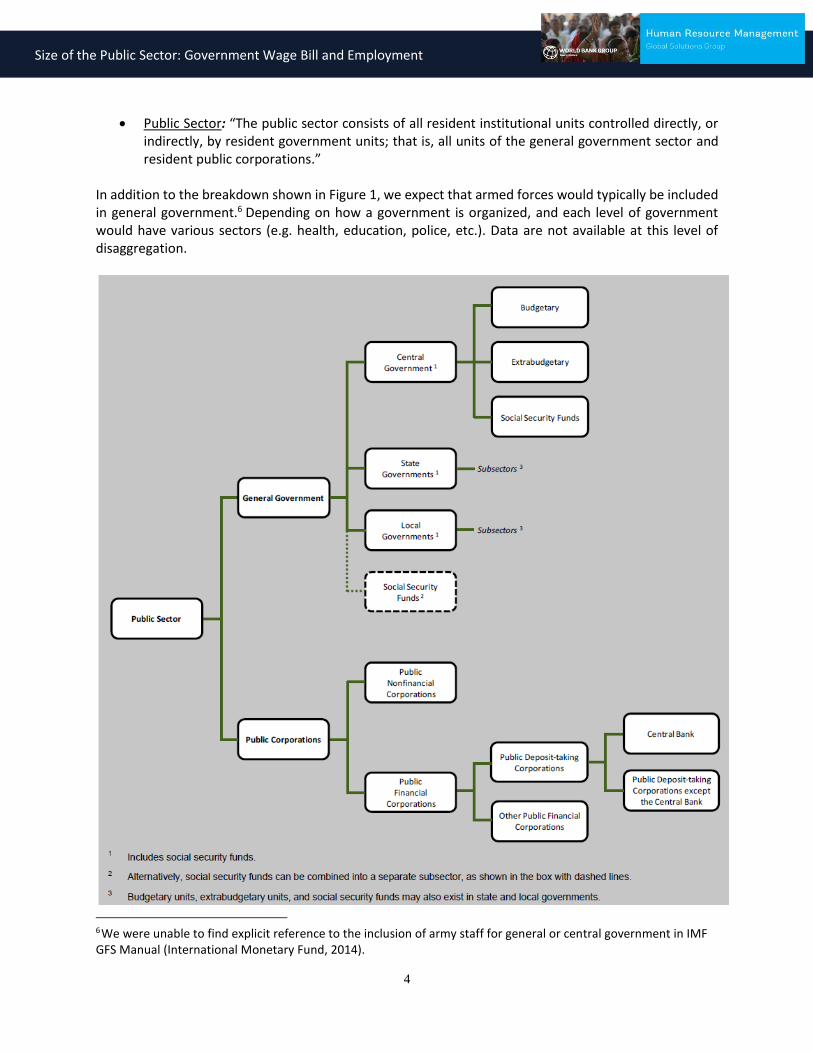
Public Sector: “The public sector consists of all resident institutional units controlled directly, or indirectly, by resident government units; that is, all units of the general government sector and resident public corporations.”
In addition to the breakdown shown in Figure 1, we expect that armed forces would typically be included in general government.6 Depending on how a government is organized, and each level of government would have various sectors (e.g. health, education, police, etc.). Data are not available at this level of disaggregation.
6
We were unable to find explicit reference to the inclusion of army staff for general or central government in IMF GFS Manual (International Monetary Fund, 2014).

5
Size of the Public Sector: Government Wage Bill and Employment
Figure 1: The Public Sector and its Main Components [Source: (International Monetary Fund, 2014)]
B. Wage Bill Conceptually, employee remuneration has the following elements:
Figure 2: Elements of total compensation. [Source: Based on the unpublished work of Nick Manning and Jeff Rinne (World Bank, 2007)] The wage bill data in this dataset includes government expenditure that is classified as ‘compensation of employees’ (International Monetary Fund, 2014):
Compensation of Employees: “The total remuneration, in cash or in kind, payable to an individual in an employer-employee relationship in return for work performed by the latter during the reporting period. These amounts are payable as an exchange for manual and intellectual labor services of individuals used in the production process of the institutional unit… Compensation of employees also excludes amounts payable when an employer-employee relationship does not exist, such as for contractors and self-employed outworkers. Such amounts payable are classified as use of goods and services… Compensation of employees comprises wages and salaries and employers’ social contributions payable by employers on behalf of employees to social insurance schemes” [Equivalent to cells 1, 2, 4, and 5 in Figure 2]. Note that even though the concept of total compensation includes in-kind elements, GFS data on compensation of employees based on budget executing reports reflect wages/salaries and social contributions only.
The OECD uses a similar definition for ‘total compensation’ (OECD, 2013):

6
Size of the Public Sector: Government Wage Bill and Employment
Total compensation: “Total compensation includes wages and salaries, and employers’ social contributions, both funded and unfunded. Social contributions are restricted to health and pensions systems, in order to have consistent data across countries.”
C. Government Revenue, Total Expenditure and Expense, GDP and Population Government Revenue, Total Expenditure and Expense are based on the IMF GFS definition (International Monetary Fund, 2014):
Revenue: “Revenue is an increase in net worth resulting from a transaction. For general government units, there are four main sources of revenue: taxes and other compulsory transfers imposed by government units, property income derived from the ownership of assets, sales of goods and services, and voluntary transfers received from other units.”
Expense: “All transactions that decrease the net worth of the general government sector are classified as expense. The major types of expense are compensation of employees, use of goods and services, consumption of fixed capital, interest, subsidies, grants, social benefits, and other expense. In addition, expense can be classified according to functional purpose, such as health or social protection.”
Total Expenditure: “Expenditure is the sum of expense and the net investment in nonfinancial assets.”
Gross Domestic Product figures are in national currency at current prices. Using the System of National Accounts (SNA)7 definition, the IMF World Economic Outlook defines GDP and population as:
Gross Domestic Product: “The sum of gross value added of all resident producer units plus that part (possibly the total) of taxes on products, less subsidies on products, that is not included in the valuation of output” (WEO, April 2015; SNA, 2008).
Population: “The population of a country is most simply defined as all those persons who are usually resident in the country” (WEO, April 2015; SNA, 2008).
D. Government Entities Covered for Employment Regimes Employment data are provided by the ILO’s (International Labor Organization) LABORSTA database for the years 2000-2010 for “general government”, “publicly owned enterprises” and the “public sector” (general government + state-owned enterprises). The definitions (ILO LABORSTA, 2010) for the various categories are:
7 http://unstats.un.org/unsd/nationalaccount/sna.asp

7
Size of the Public Sector: Government Wage Bill and Employment
General Government: “The general government sector employment is the total employment of all government units, social security funds and non-market Non Profit Institutions that are controlled and mainly financed by public authority.” [General Government [4] = All government units [1] + Social Security Funds (SSF) [2] + Non-market Non-Profit institutions [3]]
Publicly Owned Enterprises: “The employment of publicly owned enterprises and companies is the employment of all units producing goods or services for the market and which are mainly owned and/or controlled by government units.” [Publicly Owned Enterprises [5]]
Public Sector: “The total public sector employment covers all employment of general government sector as defined in System of National Accounts 1993[(a) All units of central, state or local government; (b) All social security funds at each level of government; (c) All non-market Non Profit Institutions (NPIs) that are controlled and mainly financed by government units] plus employment of publicly owned enterprises and companies, resident and operating at central, state (or regional) and local levels of government. It covers all persons employed directly by those institutions, without regard for the particular type of employment contract.” [Public Sector [6] = General Government [4] + Publicly Owned Enterprises [5]]
[The ILO’s plans for extending these data are discussed later in this note.]
III. Data & Methodology
A. IMF Government Finance Statistics (GFS) a.) Summary:
The country level data in this dataset on wages, revenues, total expenditure and expense are from the IMF’s Government Finance Statistics (GFS) database. Data are provided for both general government and central government for the period 2000-201389.
The earliest data are from 2000. While the data are available up to 2013 for some countries, there are substantial gaps.
b.) Accounting Methods:
The data also vary by the accounting method that countries have used when reporting data to the IMF. In order to ensure comparability for individual data entries when calculating ratios for Wage Bill to Revenue or Wage Bill to Total Expenditure, it was ensured that ratios are calculated using the same accounting method for a given year and a given category. Specifically, accounting methods vary for:
8 Some descriptive statistics that compare the Wage Bill to Total Expenditure, GDP and Revenue of a given country
are presented in the data file. 9 See Appendix A for additional potential sources for wage bill-related data.

8
Size of the Public Sector: Government Wage Bill and Employment
- ‘General Government’: General Government wage bill data were gathered from two accounting categories within GFS:
o ‘Cash, General Government’ [white in the dataset]
‘Cash’ uses a straightforward cash accounting method.
o ‘Noncash, General Government’[yellow in the dataset]: ‘Noncash’ data uses an accrual accounting method. Differences to ‘Cash’ can stem from:
the timing of recording (i.e. accrual accounting);
the inclusion of in-kind compensation not covered under cash accounting;
Imputed compensation of employees, resulting from imputations of government expense for contribution to social security arrangements in cases where these benefits are provided outside of a contributory scheme.10
In attempting to capture the most comprehensive data, if GFS data on General Government was available for a given country using multiple accounting methods, preference was given in the following order:
1. ‘Noncash, General Government’ [yellow] 2. ‘Cash, General Government’ [white].
- ‘Central Government’:
Central Government wage bill data was gathered from four accounting categories within GFS:
o ‘Cash, Central Government’ [white in the dataset] Aforementioned explanations of Cash accounting remain valid.
o ‘Noncash, Central Government’[yellow in the dataset]:
Aforementioned explanations of Noncash accounting remain valid.
o ‘Cash, Budgetary Central Government’ [green in the dataset]: “The budgetary central government is often a single unit of the central government that encompasses the fundamental activities of the national executive, legislative, and judiciary powers.” This indicator typically includes only data from the judiciary, legislature, ministries, presidency, and government agencies. Compared to Central Government data, Budgetary Central Government does not include extra-budgetary units or social security funds. (International Monetary Fund, 2014).
o ‘Noncash, Budgetary Central Government’ [red in the dataset]:
Aforementioned explanations of Noncash accounting and Budgetary Central Government remain valid.
In attempting to capture the most comprehensive data, if GFS data were available for a given country using multiple accounting methods, preference was given in the following order:
10 We are grateful to Sage de Clerck from the IMF for having provided clarifications on these matters.

9
Size of the Public Sector: Government Wage Bill and Employment
1. ‘Noncash, Central Government’ [yellow] 2. ‘Cash, Central Government’ [white] 3. ‘Noncash, Budgetary Central Government’ [red] 4. ‘Cash, Budgetary Central Government’ [green]
Some countries used multiple accounting methods between 2000 and 2013. Users should keep this in mind, as some changes could be a result of changes in collection or accounting methods. Ideally, cross country comparisons should be made with data points using the same accounting method even though this will reduce the number of comparable data points/countries. In particular, it seems doubtful whether Budgetary Central Government data can meaningfully be compared to Central Government data. With this caveat we leave to users to decide how they would like to use these data. To replicate the dataset, as extracted from the GFS database, Appendix B outlines the most recent source of data for each country. Countries that have implemented different accounting methods between 2000 and 2013 are indicated in bold in Appendix B.
c.) Total Expenditure and Expense:
As outlined in the section on definitions, ‘Total Expenditure’ includes ‘Expense’ plus net investment in nonfinancial assets. Therefore, generally speaking, ‘Total Expenditure’ will be higher than ‘Expense’. We have used ‘Total Expenditure’ for the calculation of Wage Bill ratios but left the data on ‘Expense’ in the dataset.
d.) Some puzzles: There seem to be a number of inconsistencies in the data, some of which we cannot fully explain yet. These include:
- Australia: Australia has reported both Cash and Noncash data to the GFS. Cash-based compensation of employees is roughly three times the non-cash based figure for compensation of employees. As we understand it, starting in 2003, the Australian classification system for cash did not allow for a distinction between compensation of employees and purchases of goods and services. Similarly, it does not distinguish grants from subsidies and social benefits include other payments.11
- Greece:
The difference between Greece’s reported general government and central government wage bill seems far too small. (The ratio to GDP for the former is 10% whereas it is 11% for the latter.)
11 We are grateful to Sage de Clerck from the IMF for having provided clarifications on this matter.
10
Size of the Public Sector: Government Wage Bill and Employment
- Pakistan:
Pakistan’s reported wage bill (1% of GDP) seems far too low compared to other countries.
B. ILO LABORSTA
Employment data have been compiled from the International Labor Organization’s (ILO) LABORSTA database and includes employment data from 2000-2010, as of May 2015.12 This primary source for public sector employment data discontinued its publicly available data collection after 2010, thus no data are currently available beyond 2010. The dataset includes data on general government, state-owned enterprises, and public sector employment (general government + state-owned enterprises). 13 We understand that some employment data for Central Government employment have been collected but are unpublished. It is understood that the ILO is in the process of migrating data to a new database, ILOSTAT. It is expected that data up to 2014 will become available by the end of 2015. 1415 In principle, all employees (permanent, temporary/contractual full time, temporary/contractual part time, intermittent) should be included in the employment figures but practices differ across countries. Employment data only includes civilian employment, hence excluding military staff.
C. IMF WEO GDP and population data are from the World Economic Outlook dataset, using the version updated in April 2015.16 Both indicators are presented through 2015. Consistent with the WEO Database, cells highlighted in red within the dataset represent IMF staff estimates, which serve as proxies for historical series when complete information is unavailable.
D. HRMIS & Pay Roll Information on HRMIS (Human Resource Management Information Systems) and Pay Roll systems is extracted from the dataset on “PFM systems and e-services”.17 This secondary information is fairly generic in nature and varies in depth depending on availability of data.
12 The OECD Public Finance and Employment Database (PFED) publishes information on public employment, also utilizing ILOSTAT. It is presented according to their “COFOG-special” classification which is consistent with the National Accounts. To our knowledge the revised employment figures have not yet been publicly released. In any case these data are largely limited to OECD countries. 13 There are some discrepancies in the definition of general government and state-owned enterprise employment data reported by various countries. 14 Data through 2014 is being incrementally added to ILOSTAT. Once complete, this dataset will be subsequently updated. ILOSTAT Database Link 15 We are grateful to Steven Kapsos from the ILO for clarifying issues around the ILO employment data. 16 The WEO database is updated every April and September. This note refers to data presented in the April 2015 version, which can be found in the WEO database archive: https://www.imf.org/external/ns/cs.aspx?id=28 17 http://www.worldbank.org/publicfinance/fmis

11
Size of the Public Sector: Government Wage Bill and Employment
E. ICP PPP The International Comparison Program (ICP) engaged in methodological research, survey activities and data processing and analysis in the areas of price statistics and national accounts in order to estimate purchasing power parities (PPPs) of the world’s principal economies. Latest available PPPs (from 2011) were included in the dataset for users’ convenience for potential future analyses.
F. Other Sources The dataset also includes indicators for i) political rights and civil liberties freedom (Freedom House), ii) income classification (World Bank), and iii) region for additional sub-group analysis.
IV. Descriptive Statistics The following summarizes a few generalizations that can be made from these data. Aggregate wage bill:
Region: For central government, Latin America and the Caribbean, Middle East and North Africa, and Sub-Saharan Africa have the highest shares of the wage bill in expenditure and revenue (between 27-31%) and GDP (7-9%). Similarly, for general government, the Middle East and North Africa, Latin America and the Caribbean, and Sub-Saharan Africa have the highest shares of wage bill in expenditure and revenue (between 29-35%).
Income: At the central government level, there is an inverse relationship among higher income levels and the wage bill percentage of revenue and expenditures. This relationship is not apparent at the general government level.
Population: As population size increases, the share of the wage bill in expenditures, revenue, and GDP decreases slightly.
Employment:
Regions: the OECD countries have the highest ratio of government employment relative to the population (8% for general government employment) in contrast with the South Asia region where the equivalent number is around 1%. For Eastern Europe and Central Asia, the difference between public sector and general government employment is notably high (indicating a large state-owned enterprises employment).
Income: Similarly, on average, high-income countries have 8% of the population working in general government and 10% working in the public sector, compared to 1% of low-income countries. For Middle-income countries the comparable figures are between 5% and 6%,

12
Size of the Public Sector: Government Wage Bill and Employment
Appendix A: Potential Sources of Relevant Wage Bill Data
Approach Variable
Methodology
Progress made Difficulties
Unit of analysis
Data sources Entities covered
Elements of wages covered
Legal employment regime covered
(OECD, 2015)
Employment General government and public corporations
Not known (not clear if contract workers are covered)
ILOSTAT Database (previously LABORSTA)
Coverage of all OECD countries
Seems straightforward for OECD; ILOSTAT data generally only available for OECD countries up to 2014
(Pilichowski and Turkisch, 2008)
Employment “Public domain” – but in practice they could only capture general government and public enterprise.
Presumably all Special OECD survey (GOV survey)
Limited coverage
Significant effort required to explain classifications and obtain data
(Schiavo-Campo et al., 1997b; Schiavo-Campo et al., 1997a)
Employment General government (central and local governments, health and education, (some military and public enterprises data were collected but not verified and not used in the paper)
Not known Varied – multiple sources
80-100 countries in early 1990s
Data drawn from multiple sources – possible differences in coverage and very labor intensive

13
Size of the Public Sector: Government Wage Bill and Employment
Approach Variable
Methodology
Progress made Difficulties
Unit of analysis
Data sources Entities covered
Elements of wages covered
Legal employment regime covered
(ILO, 2010) [SNA and ILO use the same definition]
Employment General government and public corporations where available
Not known ILO LABORSTA Database
About 70 countries
ILO LABORSTA data only available through 2010
(Mills et al., 2011)
Production Cost
GFS general government
Compensation costs only (Cash, Kind and employers contributions)
All employees in general government
GFS + personal files held by IMF staff
Data for 55 countries obtained for 2008
GFS inaccurate and patchy – and unknown relationship with other IMF data
(Schiavo-Campo et al., 1997b; Schiavo-Campo et al., 1997a)
Production Cost
General government (central and local governments, health and education – defined case by case)
Compensation Cost (Only monetary cost and allowances)
Not known Varied – multiple sources
80-100 countries in early 1990s
Data drawn from multiple sources – possible differences in coverage and very labor intensive
(OECD, 2013)
Production Cost
General government
Production Cost (Captures all)
Not known OECD SNA Coverage of all OECD countries
Seems straightforward for OECD
(Pilichowski and Turkisch, 2008)
Production Cost
“Public domain” Production Cost (Captures all subset)
Presumably all OECD SNA Coverage of all OECD countries
Not clear that “other public sector” or “private sector in the public domain” covered

14
Size of the Public Sector: Government Wage Bill and Employment
Approach Variable
Methodology
Progress made Difficulties
Unit of analysis
Data sources Entities covered
Elements of wages covered
Legal employment regime covered
SNA Production Cost
SNA only defines general government. However, “Public domain” can inferred from SNA as Pilichowski and Turkisch (2009) have done
Formally, SNA only defines compensation costs (cash, kind and employers contribution). However, “production cost” can be inferred and can be estimated.
Not known SNA and UN Data website
Same as GFS
(Mills et al., 2011)
Wage structure
GFS general government
Wages, salaries (in cash and in kind) and social contributions made on behalf of employees to social insurance schemes
All employees in general government
Varied – multiple sources
Data for 34 countries obtained for mid-1990s-2008
Compression data only. Data drawn from multiple sources – possible differences in coverage and very labor intensive
(Schiavo-Campo et al., 1997b; Schiavo-Campo et al., 1997a)
Wage structure
General government (central and local governments, health and education – defined case by case)
Assumed to be base pay + cash allowances
Not known Inferred from wage bill and employment data
80-100 countries in early 1990s
Only average individual wages can be calculated. Data drawn from multiple sources – possible differences in coverage and very labor intensive

15
Size of the Public Sector: Government Wage Bill and Employment
Approach Variable
Methodology
Progress made Difficulties
Unit of analysis
Data sources Entities covered
Elements of wages covered
Legal employment regime covered
(OECD, 2013)
Wage structure
General government
Reports 6 different wage regimes: 1) teachers, 2) doctors-nurses, 3) senior management (cen gov), 4) middle management (cen gov), 5) technical (cen gov), 6) secretarial (cen gov (see Annex 3)
Not known (are contract workers covered?)
OECD Education and Health At a Glance publications (presumably special surveys) and
Coverage of all OECD countries
Produces a range of PPP-Adjusted comparisons. Seems straightforward for OECD – but the health and education surveys must have been time-consuming.
SNA Wage structure
General Government
Wages (Cash or in kind) Direct social transfers from employers to their employees or retired employees and their family, such as payments for sickness, educational grants and pensions that do not set up an independent fund, are also imputed.
All employees in general government
SNA and UN Data website
Same as GFS

16
Size of the Public Sector: Government Wage Bill and Employment
Appendix B: GFS Reference Chart Bolded countries indicate multiple accounting methods used between 2000-2013, according to GFS. Countries are placed in the category that represents the
most recent accounting method used to report on a given indicator.
Sector Indicator Accounting Method Country
Central Government
Wage Cash Afghanistan, Albania, Argentina, Armenia, Azerbaijan, Bangladesh, Belarus, Bhutan, Brazil, Bulgaria, Cape Verde, Congo (Democratic Republic), Croatia, Czech Republic, Egypt, Georgia, India, Indonesia, Iran, Latvia, Lesotho, Macedonia, Maldives, Mexico, Moldova, Mongolia, Panama, Paraguay, Peru, Serbia, Singapore, Slovenia, Tajikistan, Timor-Leste, Trinidad & Tobago, Tunisia, Ukraine, Uruguay, Uzbekistan, Venezuela
Cash, Budgetary Angola, Antigua & Barbuda, Bahamas, Belize, Botswana, China (Mainland), Equatorial Guinea, Ethiopia, Fiji, Gambia, Ghana, Guatemala, Jordan, Kazakhstan, Kenya, Kuwait, Kyrgyz Republic, Laos, Liberia, Malawi, Malaysia, Mozambique, Namibia, Nepal, Nicaragua, Nigeria, Oman, Pakistan, Papua New Guinea, Philippines, Qatar, Rwanda, Sierra Leone, Sri Lanka, St Kitts & Nevis, Suriname, Swaziland, Syria, Tanzania, Uganda, Zambia, Zimbabwe
NonCash Australia, Austria, Belgium, Bolivia, Bosnia & Herzegovina, Canada, Chile, China (Hong Kong), Colombia, Costa Rica, Cyprus, Denmark, Dominican Republic, El Salvador,Estonia, Finland, France, Germany, Greece, Honduras, Hungary, Iceland, Ireland, Israel, Italy, Jamaica, Japan, Korea, Lithuania, Luxembourg, Madagascar, Malta, Mauritius, Morocco, Netherlands, New Zealand, Norway, Poland, Portugal, Romania, Russia, San Marino, Slovak Republic, South Africa, Spain, Sweden, Switzerland, Thailand, Turkey, United Arab Emirates, United Kingdom, United States
NonCash, Budgetary Algeria, Bahrain, Barbados, Benin, Burkina Faso, Burundi, Cambodia, Central African Republic, Congo (Republic), Cote d'Ivoire, Lebanon, Mali, Niger, Senegal, Togo
Revenue Cash Afghanistan, Albania, Argentina, Armenia, Azerbaijan, Bangladesh, Belarus, Bhutan, Brazil, Bulgaria, Cape Verde, Congo (Democratic Republic), Croatia, Czech Republic, Egypt, Georgia, India, Indonesia, Iran, Latvia, Lesotho, Macedonia, Maldives, Mexico, Moldova, Mongolia, Panama, Paraguay, Peru, Serbia, Singapore, Slovenia, Tajikistan, Timor-Leste, Trinidad & Tobago, Tunisia, Ukraine, Uruguay, Uzbekistan, Venezuela
Cash, Budgetary Angola, Antigua & Barbuda, Bahamas, Belize, Botswana, China (Mainland), Equatorial Guinea, Ethiopia, Fiji, Gambia, Ghana, Guatemala, Jordan, Kazakhstan, Kenya, Kuwait, Kyrgyz Republic, Laos, Liberia, Malawi, Malaysia, Mozambique, Namibia, Nepal, Nicaragua, Nigeria, Oman, Pakistan, Papua New Guinea, Philippines, Qatar, Rwanda, Sierra Leone, Sri Lanka, St Kitts & Nevis, Suriname, Swaziland, Syria, Tanzania, Uganda, Zambia, Zimbabwe
NonCash Australia, Austria, Belgium, Bolivia, Bosnia & Herzegovina, Canada, Chile, China (Hong Kong), Colombia, Costa Rica, Cyprus, Denmark, Dominican Republic, El Salvador,Estonia, Finland, France, Germany, Greece, Honduras, Hungary, Iceland, Ireland, Israel, Italy, Jamaica, Japan, Korea, Lithuania, Luxembourg, Madagascar, Malta, Mauritius, Morocco, Netherlands, New Zealand, Norway, Poland, Portugal, Romania, Russia, San Marino, Slovak Republic, South Africa, Spain, Sweden, Switzerland, Thailand, Turkey, United Arab Emirates, United Kingdom, United States
NonCash, Budgetary Algeria, Bahrain, Barbados, Benin, Burkina Faso, Burundi, Cambodia, Central African Republic, Congo (Republic), Cote d'Ivoire, Lebanon, Mali, Niger, Senegal, Togo

17
Size of the Public Sector: Government Wage Bill and Employment
Expenditure Cash Afghanistan, Albania, Argentina, Armenia, Azerbaijan, Bangladesh, Belarus, Bhutan, Brazil, Bulgaria, Cape Verde, Congo (Democratic Republic), Croatia, Czech Republic, Egypt, Georgia, India, Indonesia, Iran, Latvia, Lesotho, Macedonia, Maldives, Mexico, Moldova, Mongolia, Panama, Paraguay, Peru, Serbia, Singapore, Slovenia, Tajikistan, Timor-Leste, Trinidad & Tobago, Tunisia, Ukraine, Uruguay, Uzbekistan, Venezuela
Cash, Budgetary Angola, Antigua & Barbuda, Bahamas, Belize, Botswana, China (Mainland), Equatorial Guinea, Ethiopia, Fiji, Gambia, Ghana, Guatemala, Jordan, Kazakhstan, Kenya, Kuwait, Kyrgyz Republic, Laos, Liberia, Malawi, Malaysia, Mozambique, Namibia, Nepal, Nicaragua, Nigeria, Oman, Pakistan, Papua New Guinea, Philippines, Qatar, Rwanda, Sierra Leone, Sri Lanka, St Kitts & Nevis, Suriname, Swaziland, Syria, Tanzania, Uganda, Zambia, Zimbabwe
NonCash Australia, Austria, Belgium, Bolivia, Bosnia & Herzegovina, Canada, Chile, China (Hong Kong), Colombia, Costa Rica, Cyprus, Denmark, Dominican Republic, El Salvador,Estonia, Finland, France, Germany, Greece, Honduras, Hungary, Iceland, Ireland, Israel, Italy, Jamaica, Japan, Korea, Lithuania, Luxembourg, Madagascar, Malta, Mauritius, Morocco, Netherlands, New Zealand, Norway, Poland, Portugal, Romania, Russia, San Marino, Slovak Republic, South Africa, Spain, Sweden, Switzerland, Thailand, Turkey, United Arab Emirates, United Kingdom, United States
NonCash, Budgetary Algeria, Bahrain, Barbados, Benin, Burkina Faso, Burundi, Cambodia, Central African Republic, Congo (Republic), Cote d'Ivoire, Lebanon, Mali, Niger, Senegal, Togo
Sector Indicator Accounting
Method Country
General Government
Wage Cash Afghanistan, Albania, Armenia, Azerbaijan, Barbados, Belarus, Bhutan, Brazil, Bulgaria, Cape Verde, Croatia, Czech Republic, Egypt, Georgia, India, Indonesia, Iran, Jordan, Kazakhstan, Latvia, Lesotho, Macedonia, Malaysia, Maldives, Moldova, Mongolia, Paraguay, Peru, Serbia, Seychelles, Singapore, Slovenia, Tajikistan, Timor-Leste, Tunisia, Ukraine, Uzbekistan, Yemen
NonCash Argentina, Australia, Austria, Belgium, Bolivia, Bosnia & Herzegovina, Canada, Chile, China (Hong Kong), Colombia, Congo (Republic), Costa Rica, Cyprus, Denmark, El Salvador, Estonia, Finland, France, Germany, Greece, Honduras, Hungary, Iceland, Ireland, Israel, Italy, Jamaica, Japan, Korea, Lithuania, Luxembourg, Malta, Mauritius, Morocco, Netherlands, New Zealand, Norway, Poland, Portugal, Romania, Russia, San Marino, Slovak Republic, South Africa, Spain, Sweden, Switzerland, Thailand, Turkey, United Arab Emirates, United Kingdom, United States
Revenue Cash Afghanistan, Albania, Armenia, Azerbaijan, Barbados, Belarus, Bhutan, Brazil, Bulgaria, Cape Verde, Croatia, Czech Republic, Egypt, Georgia, India, Indonesia, Iran, Jordan, Kazakhstan, Latvia, Lesotho, Macedonia, Malaysia, Maldives, Moldova, Mongolia, Paraguay, Peru, Serbia, Seychelles, Singapore, Slovenia, Tajikistan, Timor-Leste, Tunisia, Ukraine, Uzbekistan, Yemen
NonCash Argentina, Australia, Austria, Belgium, Bolivia, Bosnia & Herzegovina, Canada, Chile, China (Hong Kong), Colombia, Congo (Republic), Costa Rica, Cyprus, Denmark, El Salvador, Estonia, Finland, France, Germany, Greece, Honduras, Hungary, Iceland, Ireland, Israel, Italy, Jamaica, Japan, Korea, Lithuania, Luxembourg, Malta, Mauritius, Morocco, Netherlands, New Zealand, Norway, Poland, Portugal, Romania, Russia, San Marino, Slovak Republic, South Africa, Spain, Sweden, Switzerland, Thailand, Turkey, United Arab Emirates, United Kingdom, United States

18
Size of the Public Sector: Government Wage Bill and Employment
Expenditure Cash Afghanistan, Albania, Armenia, Azerbaijan, Barbados, Belarus, Bhutan, Brazil, Bulgaria, Cape Verde, Croatia, Czech Republic, Egypt, Georgia, India, Indonesia, Iran, Jordan, Kazakhstan, Latvia, Lesotho, Macedonia, Malaysia, Maldives, Moldova, Mongolia, Paraguay, Peru, Serbia, Seychelles, Singapore, Slovenia, Tajikistan, Timor-Leste, Tunisia, Ukraine, Uzbekistan, Yemen
NonCash Argentina, Australia, Austria, Belgium, Bolivia, Bosnia & Herzegovina, Canada, Chile, China (Hong Kong), Colombia, Congo (Republic), Costa Rica, Cyprus, Denmark, El Salvador, Estonia, Finland, France, Germany, Greece, Honduras, Hungary, Iceland, Ireland, Israel, Italy, Jamaica, Japan, Korea, Lithuania, Luxembourg, Malta, Mauritius, Morocco, Netherlands, New Zealand, Norway, Poland, Portugal, Romania, Russia, San Marino, Slovak Republic, South Africa, Spain, Sweden, Switzerland, Thailand, Turkey, United Arab Emirates, United Kingdom, United States

19
Size of the Public Sector: Government Wage Bill and Employment
References Benedict Clements, Sanjeev Gupta, Izabela Karpowicz, Shamsuddin Tareq (2010), Evaluating
Government Employment and Compensation, IMF, Fiscal Affairs Department
Coppola, A. & Calvo-Gonzalez, O. (2011) Higher Wages, Lower Pay: Public vs. Private Sector
Compensation in Peru, Washington DC, World Bank.
Dahal, Sudyuman & Garrity, Colum & Manning, Nick & Mills, Zac (2011), “Wage Bill and Pay Compression
Summary Note”, World Bank,
http://siteresources.worldbank.org/PUBLICSECTORANDGOVERNANCE/Resources/285741-
1343934891414/WageBillandPayCompressionSummaryNote.pdf.
Dahal, Sudyumna & Manning, Nick (2012), “Data Sources on Public Sector Pay and Employment”, World
Bank.
ICP (2011) International Comparison Program (ICP),
http://siteresources.worldbank.org/ICPEXT/Resources/ICP_2011.html.
ILO LABORSTA (2010) Statistics on Public Sector Employment: Definitions,
http://laborsta.ilo.org/applv8/data/sectore.html.
International Monetary Fund (2014) Government Finance Statistics Manual 2014 Pre-Publication Draft,
Washington DC, IMF, http://www.imf.org/external/np/sta/gfsm/pdf/text14.pdf.
Manning, Nick & Rinne, Jeff (2007), unpublished mimeo, World Bank.
OECD (2013) Government at a Glance, Paris, OECD, http://www.oecd.org/gov/government-at-a-glance-
2013.htm.
OECD (2015) Government at a Glance, Paris, OECD, OECD Government at a Glance 2015
Pilichowski, E. & Turkisch, E. (2008) Employment in Government in the Perspective of the Production
Costs of Goods and Services in the Public Domain, Paris, OECD.
Schiavo-Campo, S., De Tommaso, G. & Mukherjee, A. (1997a) Government Employment and Pay: A
Global and Regional Perspective, Washington DC, World Bank.
Schiavo-Campo, S., De Tommaso, G. & Mukherjee, A. (1997b) An International Statistical Survey of
Government Employment and Wages, Washington DC, World Bank.