size effect in microcompression of epoxy micropillars
TRANSCRIPT

Size effect in microcompression of epoxy micropillars
S. Wang • Y. Yang • L. M. Zhou • Y.-W. Mai
Received: 28 February 2012 / Accepted: 18 April 2012 / Published online: 4 May 2012
� Springer Science+Business Media, LLC 2012
Abstract Understanding the size effect on the mechani-
cal properties of polymers is of great importance for a
robust design of today’s polymer-based micro-devices. In
this article, we propose the microcompression approach
based on the focused ion beam milling technique to probe
the possible size effect on the mechanical behavior of
epoxy micropillars. By systematically reducing their size
from the micrometer to submicron scale, these micropillars
display a constant elastic modulus in their inner cores while
exhibit an increasing yield and fracture strengths with
decreasing diameters. Such a size effect is attributed to the
intrinsic material heterogeneity at the submicron scale and
the presence of a nano-scale stiff surface layer wrapping
around the micropillars. This study provides a theoretical
framework for the microcompression analysis of polymer-
based micropillars, paving the way for future study of a
variety of polymer-based advanced material systems by
microcompression.
Introduction
Since the 1990s, polymers have been increasingly used as
functional or structural materials in micro-electro-
mechanical systems (MEMS) [1, 2]. As an alternative to
the conventional MEMS materials, such as silicon and
metals, polymers possess their advantages of higher
mechanical robustness, lower fabrication costs, a greater
versatility in microfabrication, and more chemical, struc-
tural, and biological functionalities [1, 2]. Because of this,
today’s micro-devices, such as displays [3], photo voltaic
devices [4], memory, and transistors [5], are strongly
migrating towards polymers. While the ultimate goal is to
achieve the full integration of the polymer-based MEMS
with those in like material systems one day, knowledge of
the mechanical properties of polymers at the small size
scale is one of the prerequisites that must be acquired.
As compared with silicon and metals, which have
received extensive research efforts during the past decades
for understanding their size-dependent mechanical behav-
iors [6–16], the investigation of polymers is comparably less
regarding their mechanical behavior at different length
scales [17, 18]. One of the commonly used tools for the size
effect study in polymers is nanoindentation [13]. Although
polymers possess rate-dependent plasticity and have the
tendency to pile up under indentation, which defies the direct
use of the standard indentation method [13], research efforts
have been made for extending the realm of applicability of
the standard indentation method to include polymers
[19–21]. By indenting polymers at different depths, their
hardness for different indent sizes can be extracted. As a
result, it was found that the hardness of polymers seemed to
obey a similar size effect trend as other materials, such as
metals [12], i.e., the smaller the indent size, the harder the
material becomes, which was then attributed to the strain
gradient effect that gave rise to a higher density of molecular
kinks at a shallower indent in polymers [17]. It was even
argued that such a strain gradient effect should be ubiquitous
among different material systems [14].
On the other hand, a recently emerging research interest
is to study the mechanical properties of materials under the
S. Wang � Y. Yang (&) � L. M. Zhou � Y.-W. Mai
The Department of Mechanical Engineering,
The Hong Kong Polytechnic University, Hung Hom,
Kowloon, Hong Kong, China
e-mail: [email protected]
Y.-W. Mai
School of Aerospace, Mechanical and Mechatronic Engineering
J07, University of Sydney, Sydney, NSW, Australia
123
J Mater Sci (2012) 47:6047–6055
DOI 10.1007/s10853-012-6513-0

conditions free of an overall strain gradient [7], which
represents the scenarios in which materials should exhibit
the lowest mechanical strengths than otherwise, and is
apparently more closely relevant to the design of MEMS
devices. Based on the prior study, it is known that the size
effect still persists even without the presence of strain
gradient in metals and silicon [7, 8]. Such important find-
ings imply that, apart from the stiffness and strength, the
external dimension of materials should also be considered
as one of the key parameters in the design of the MEMS
devices made of those materials. However, similar studies
for polymers are still rare up to date.
In this article, we propose the microcompression
method, which was pioneered originally for the study of
single-crystal metals [7], for the size effect study of poly-
mers. This method combines the nanoindentation and
focused ion beam (FIB) micro-fabrication techniques to
probe the possible size effect in a uniaxially loaded
material. The variety of issues, such as the finite substrate
compliance, micropillar tapering, and ion-milling effect,
arising from the use of ion beam milling, will be discussed
pertaining to the microcompression of polymers. Through
this study, it can be demonstrated that the microcompres-
sion method can be extended from hard materials, such as
metals and silicon, to soft materials, such as polymers for
mechanical characterization at the micrometer scale.
Materials and experiments
As a model material, an as-received epoxy resin system
including Araldite-F (diglycidyl ether of bisphenol A,
DGEBA) and Piperidine was used for this study (for the
details of material preparation, please see Ref. [22]). Fol-
lowing the sequential ion-milling approach [15, 23], a
series of epoxy micropillars were carved out on the
mechanically polished surface of the bulk epoxy sample
using the FIB technique on a Quanta 200 3D FIB/SEM
Dual-BeamTM
System (FEI Company, Hillsboro, OR,
USA). Prior to the ion-beam treatment, the epoxy sample
was coated with an Au/Pd thin film with a thickness of a
few nanometers to enhance electric conductivity. Under the
current voltage of 30 keV, the Ga? ion beams of a current
density of 3 nA were first used to create an annular crater
with a 20-lm outer diameter at the depth close to that of
the micropillar to be fabricated. As the precursor, the crater
had an inner diameter a few micrometers larger than the
desired pillar’s diameter. Subsequently, the ion beams with
incrementally decreasing densities were used for shaping
the micropillar. At the final step of trimming, the ion beam
with the current density down to a few tens of pA were
utilized to remove the severely damaged materials because
of the previous use of the high-density ions. Note that a
similar process has also been commonly employed to
prepare FIB-milled polymer thin foils for transmission
electron microscopy (TEM) [24]. In spite of these laborious
experimental efforts, the FIB-milled micropillars were still
tapered, with an average taper angle of *2�, because of the
ion-beam divergence. As shown in Fig. 1, it can be seen
that the typical geometry of the FIB-milled epoxy micro-
pillar is similar to those of FIB-milled metallic and ceramic
micropillars, as archived in the literature [8, 15, 23].
To study the possible size effect in polymers, the FIB-
milled micropillars had diameters and aspect ratios rang-
ing, respectively, from *0.7 to *5 lm and *3:1 and
*4:1. The microcompression experiments were then car-
ried out at a load-controlled mode on the TriboscopeTM
Nanoindentation System (Hysitron, Minneapolis, MN,
USA), which was equipped with a 10-lm flat-end conical
diamond indenter. For simplicity, the nominal stress rate
adopted in the microcompression experiments was fixed at
*35 MPa/s.
Results and discussion
Experimental load–displacement curves
From the microcompression experiments, it was found that
the epoxy micropillars underwent a reversed trend of size-
induced ductile-to-brittle transition in contrast to amor-
phous-metal micropillars [25], i.e., the smaller epoxy
micropillars exhibited brittle-like fracture while the larger
ones deformed seemingly in a plastic way. As shown in
Fig. 2a, the load–displacement curve from the 4-lm epoxy
micropillar smoothly transitions from elastic to plastic
deformation and then levels off at a somewhat constant
load as the plastic flow continues. Considering the tapering
effect and the lateral expansion of the micropillar, the
constant load is implicative of a strain softening behavior,
which can be attributed to the stable crack growth in the
micropillar, as can be seen from the ex situ scanning
electron microscopy (SEM) images (Fig. 2b). In sharp
contrast, the micropillar with the diameter of about *1 lm
exhibits the brittle-like fracture. As shown in Fig. 2c, a
sudden load drop occurs at limited plastic deformation.
Note that the brittle-like fracture was caused by shear
failure (Fig. 2d), which is, however, often regarded as the
manifestation of the plastic flows in quasi-brittle materials
at the macroscopic scale, such as ice [26].
Before proceeding, it is worthwhile to mention that
pronounced surface wrinkling was also observed in those
‘plastically’ deformed epoxy micropillars (Fig. 3). These
surface wrinkles were developed around the cracks
exposed on the micropillar’s surface, exhibiting a well-
defined periodic structure along the crack length and
6048 J Mater Sci (2012) 47:6047–6055
123

diminishing with distance away from the surface cracks.
Note that a similar phenomenon of surface wrinkling was
also observed by Moon and co-workers when they
bombarded the surface of a polydimethylsiloxane (PDMS)
sheet using the Ga? ion beams with different ion fluence
[27]. As a result of the ion-induced residual strain and
Fig. 1 The scanning electron microscopy (SEM) image of the micropillars fabricated through focused ion beams on the polished surface of the
epoxy sample coated with Au thin films
Fig. 2 a The load–
displacement curve of the epoxy
micropillar with the top
diameter of *4.1 lm, b the
micrograph of the cracked
4.1-lm micropillar, c the load–
displacement curve of the epoxy
micropillar with the top
diameter of *0.7 lm and d the
micrograph of the fractured
0.7-lm micropillar
J Mater Sci (2012) 47:6047–6055 6049
123

surface stiffening, surface wrinkling develops in the PDMS
sheet to minimize elastic energy storage [27].
Micromechanical properties of epoxy micropillars
Elastic modulus
Unlike in regular compression tests, the extraction of the
mechanical properties of the epoxy micropillars from the
microcompression tests is nontrivial. Aside from the
above-mentioned surface stiffening effect, the micropillar
tapering and base rounding together with the compliance of
their base material defy the measurement of the pillars’
Young’s moduli. However, according to Yang et al. [15],
the combined effects from the imperfect sample geometries
and base compliance can be accounted for with the fol-
lowing formula:
E ¼ WH
D0
; b;q
D0
� �1þ p 1� mð ÞD0
8H
� �
� 4H
pD0 D0 þ 2H tan bð ÞdP
dh; ð1Þ
where H is the height of the micropillar, D0 is the top
diameter of the micropillar, b is the taper angle, q is the
radius of curvature at the base of the micropillar, m is the
Poisson’s ratio (*0.35 for the epoxy resins), W is a
dimensionless function as derived from the finite-element
(FE) simulations in Ref. [15], and dP/dh is the slope of the
loading curve in the elastic regime (Fig. 1a, c). Note that
the elastic behavior of a micropillar was implicitly assumed
to be rate independent when deriving Eq. (1), which works
quite well for metallic glasses and most metals. However,
elasticity in polymers is known to be rate dependent;
therefore, the elastic moduli of the micropillars so obtained
from Eq. (1) might be rate dependent as well. To minimize
such a rate effect, the stress rate was fixed at *35 MPa s-1
in our microcompression experiments.
Using Eq. (1), the Young’s moduli of the micropillars
can be extracted from the experimental data. As shown in
Fig. 4, they exhibit an apparent ‘size effect’ with their
magnitudes increasing with decreasing D0. However, as the
pillar’s top diameter increases beyond *3 lm, the
extracted Young’s moduli levels off to an average value of
*4 GPa, which is comparable to the average Young’s
Fig. 3 The micrographs of the
surface wrinkles observed on
the plastically deformed epoxy
micropillar with surface cracks
Fig. 4 The variation of the
obtained modulus of the
micropillars with their top
diameters. (Note that the shadedarea denotes the range of the
Young’s modulus of the epoxy
obtained from standard
nanoindentation tests and the
inset to the right of the plot is
the schematic of the composite
structure of the FIB-milled
epoxy micropillar, consisting of
an epoxy core and a FIB-
induced stiff skin)
6050 J Mater Sci (2012) 47:6047–6055
123

modulus (3.9 ± 0.1 GPa [m ? SD]) as measured from the
standard nanoindentation tests with a holding load (see
Appendix A), implying that the rate effect is negligibly
small in both microcompression and nanoindentation
experiments under these experimental conditions. In con-
trast, the 1-lm micropillar shows a Young’s modulus of
*8 GPa, which doubles that of the bulk epoxy. The
apparent size effect on the elastic modulus can be attrib-
uted to the ion-induced surface stiffening [27]. In view of
this, the epoxy micropillar can be envisaged as a composite
of an epoxy ‘core’ wrapped around by a FIB-induced stiff
skin (the inset of Fig. 4).
To extract the true Young’s modulus of the epoxy core,
the simple rule of mixture can be employed. Assuming a
uniform thickness of the stiff skin, the Young’s modulus,
Em, of the epoxy core can be derived as:
Em ¼E � 4Ef
tfD0� tf
D0
� �2� �
1� 2tfD0
� �2; ð2Þ
where Ef and tf denote the Young’s modulus and thickness
of the stiff skin, respectively. Based on the elastic wrin-
kling theory [27], it can be shown that both Ef and tf can be
estimated from the surface wrinkles (Fig. 3) and the
average modulus of the bulk epoxy measured from nano-
indentation (E = 3.9 GPa), which gives Ef = 30 ±
10 GPa and tf = 31 ± 7 nm (Appendix B). Here, it is
worth mentioning that the interface in a real material must
be diffusive rather than sharp in its profile; therefore, the
thickness estimated by using Eq. (2) corresponds to an
effective interface producing the same mechanical effect as
a real one. Despite this mathematic simplification, the order
of magnitude of the estimated tf and Ef is consistent with
the available experimental results reported in the literature
[24, 27]. Note that not all micropillars displayed the
wrinkle patterns after deformation; however, we did not
find any conspicuous size effect on the thickness of the stiff
layer based on the available experimental results and the
corresponding calculations. This is consistent with the
notion that, when the density of the ions is low, the damage
they can cause is only limited to a material surface. Given
the ion density we used for final trimming being extremely
low, which produced a stiff layer only about 30-nm thick in
the micropillars of 2–3 lm in diameter, we believe that a
size effect on the layer thickness is unlikely when the same
ion beams were used to trim the micropillars of 1 lm in
diameter. In such a case, we basically assume that the layer
thickness is size independent in this study. Substituting the
related parameters into Eq. (2), Em can be then extracted.
As shown in Fig. 4, after ruling out the effect of the ion-
induced surface stiffening, there is no discernable size
effect on the Young’s modulus of the epoxy core Em,
which shows a constant value of 3.9 ± 0.5 GPa consistent
with the previous nanoindentation results (3.9 ± 0.1 GPa).
Mechanical strength
To extract the yield strengths of these micropillars, the
yielding load, Py, is taken as the one corresponding to the
departure of the load–displacement curve from the elastic
response (Fig. 1a, c). To be consistent with the micro-
compression literature [7–9, 23, 28], the yielding strengths
of the micropillars were computed using ry ¼ 4Py=pD20
without considering the effect of pillar tapering.1 However,
in view of the surface stiffening, this only gives the mea-
surements of the ‘composite’ yield strengths of the
micropillars. With the skin’s Young’s modulus known to be
*30 GPa, the yield strength of the epoxy core can be then
estimated by subtracting the skin stress from ry, which is
ry ¼ 4 Py � Pf
� =p D0 � 2tfð Þ2. Here, Pf denotes the pos-
sible maximum stress that can be attained in the stiff skin at
the yielding point, which roughly equals EfAfhy/H, where Af
denotes the cross sectional area of the stiff skin and hy the
displacement of the micropillar at the yielding point.
Figure 5a presents the yield strengths of the micropillars
as a function of the pillar’s top diameters. Evidently, even
after excluding the skin effect, there is still a significant
size effect on the measured yield strengths. As shown in
Fig. 5a, the pillars’ yield strengths experience a drastic
change for the diameters less than *1 lm, exhibiting the
trend of ‘the smaller, the harder’ as usually witnessed from
the other types of micropillars [7–9]. Consistent with the
trend of the ‘composite’ Young’s moduli, the measured
yield strengths also level off at a value of *100 MPa with
the increasing pillar sizes. Note that the constant yield
strength of *100 MPa is comparable with those of bulk
epoxy samples measured under similar loading condition
[29]. Figure 5b displays the nominal fracture strengths of
the micropillars, which were measured from the maximum
loads attained before fracture, as a function of the pillar’s
top diameters. As compared with the case of the yield
strengths, the pillars’ fracture strengths exhibit the size
effect at the top diameter of around *2 lm and gradually
level off to around *200 MPa with the increasing pillars’
diameters. Note that the difference between the yield and
fracture strengths in the size effect regime cannot be totally
attributed to the post-yielding lateral expansion of these
micropillars, as the post-yielding deformation involved is
quite limited. Accompanying the change in the fracture
strengths, the fracture modes of the micropillars also
1 The tapering effect on the measured yielding strength of micropil-
lars has been studied in Ref [16]. With a taper angle of less than *3�,
the error incurred with the use of the traditional formula is expected to
be less than 10 %.
J Mater Sci (2012) 47:6047–6055 6051
123

transition from splitting fracture in the larger micropillars
to shear failure in the smaller ones, as shown by the insets
of Fig. 5b.
Possible origin of size effect
Unlike crystalline materials, there is no intrinsic structural
length scale in the pure epoxy that could influence its yield
strength at the micrometer scale; however, as pointed out in
Ref. [30], yielding in glassy polymers entails the stress-
induced percolation of weak bonds in the three-dimen-
sional network composed of cross-linked and randomly
oriented molecular chains. Based on our understanding, it
is reasonable to propose that the witnessed variation of the
yield strengths be related to the diminishing number of
available weak bonds in the epoxy micropillars. In other
words, even though the molecular structure of the epoxy
would look alike in topology at the submicron and mac-
roscopic scales, the availability of the weak bonds might be
different. In such a case, the multi-parameter Weibull
theory can be applied to investigate the size effect on the
yield strengths of the epoxy micropillars, from which the
probability of yielding in the micropillar can be written as
[16]:
P ry;D0
� ¼ 1� exp �Dn
0
ry
R
� �m� �; ð3Þ
where R is the reference yield strength, m is the Weibull
modulus, and n is the dimensionality constant. Based on
Eq. (3), the scaling relation for the size effect ry / D�n
m
0 can
be deduced. From the inset of Fig. 5a, it can be clearly seen
that n/m = 0.89 for the epoxy micropillars. On the other
hand, the Weibull modulus, m, can be determined using the
following equation [16]:
x ¼C 1þ 2
m
� � C2 1þ 1
m
� �0:5C 1þ 1
m
� ; ð4Þ
where x denotes the ratio of the standard deviation to the
mean value of the measured yield strengths. Based on the
measurements of the size-affected yield strengths (the inset
of Fig. 5a), the Weibull modulus m can be obtained as
around *3 from Eq. (4), which then gives the dimen-
sionality constant n * 2.7. Physically, this behavior
implies that the yielding behavior of the micropillar is a
consequence of volume deformation which may be related
to the molecular-scale percolation rather than a surface
effect which is caused by the mechanical mismatch
between the indenter and micropillar.
Different from the yielding of the epoxy micropillars,
which involves inelastic deformation throughout the
micropillar’s volume, the onset of their fracture entails
crack nucleation in the presence of the stiff surface skin,
which constraints the subsequent propagation of the cracks.
In the large micropillars, the cracks propagated in the
tensile direction, which resulted in the pillar splitting along
the lateral direction (Fig. 2b). It is noteworthy that these
tensile cracks propagated in a stable manner, which might
be caused by the limited elastic energy release from the
micropillar and is responsible for the extensive plastic flow,
as can be witnessed from Fig. 2a. By contrast, in the small
micropillars, the cracks propagated along an inclined plane
and in an unstable manner, leading to the brittle-like shear
failure (Fig. 2d).
The size effect on the fracture of the micropillars can be
understood in the context of fracture of quasi-brittle
materials [26, 31]. For those kinds of materials, their
fracture modes under compressive loadings are strongly
dependent on the biaxial stress state, R, which is defined as
Fig. 5 a The variation of the yield strength of the FIB-milled epoxy
micropillar with the pillar’s diameter (the inset: the power-law fitting
of the size effect on the yield strengths); and b the variation of the
fracture strength of the FIB-milled epoxy micropillar with the pillar’s
diameter with the insets showing the size-induced fracture mode
transition (scale bars in the insets = 1 lm)
6052 J Mater Sci (2012) 47:6047–6055
123

the ratio of the applied longitudinal to lateral stress. For
R = 0 which corresponds to the case of uniaxial loading,
the cracks in those materials would propagate in the tensile
direction; however, they will gradually change to an
inclined direction if a constraining stress is imposed from
the lateral direction, which corresponds to a positive R
ratio. For the epoxy micropillars, which can be viewed as a
quasi-brittle material, the ion-induced surface stiffening
naturally leads to a geometric constraint on loading on the
inner epoxy core. From linear elasticity, the associated R
ratio can be simply derived as 2tfEfm= D0 � 2tfð ÞEm. Based
on such a derivation and the obtained material properties,
the R ratio can be found ranging from *0.001 for the 5-lm
micropillar to *0.005 for the 1-lm micropillar. In Ref.
[26], it was found out that even the low confinement with
R = 0.005 could trigger the deformation mode transition in
ice. Therefore, it is reasonable to propose here that the
increasing R ratio should be responsible for the elevation in
the fracture strengths of the epoxy micropillars and also
their fracture mode transition. Because the fracture of the
small micropillars entails the breakage of the stiff surface
skin, the seeming brittleness as seen in Fig. 2c suggests the
brittle nature of the nano-scale surface skin induced by the
ion-beam milling.
Concluding remarks
In summary, the microcompression experiment is per-
formed and carefully investigated in this article on the FIB-
milled epoxy micropillars. Based on the experimental
results, salient conclusions can be drawn from this study,
which are listed as follows:
(1) In sharp contrast to the cases of metals and ceramics,
the Ga? ion machining of the bulk epoxy results in a
non-negligible stiff surface skin with a Young’s
modulus of *30 GPa and a thickness of *30 nm.
(2) The presence of the stiff surface skin leads to a size
effect on the ‘composite’ elastic modulus of the
micropillar; however, the elastic modulus of the inner
epoxy core is size independent.
(3) There is a strong size effect on the yield strengths of
the epoxy micropillars at the submicron scale even
though the surface stiffening effect is excluded, which
can be attributed to the Weibull statistics. However, at
the micrometer scale, the yield strengths of the
micropillars exhibit the trend of size independence
and are comparable with those of the bulk samples.
(4) The fracture of the ion-milled epoxy micropillars is
strongly related to the presence of the stiff surface
skin. Under microcompression, the latter acts as a
geometrical constraint that triggers the fracture mode
transition from axial splitting at the micrometer scale
to shear failure at the submicron scale. Owing to the
brittleness of the surface skin, shear failure appears
brittle on the load–displacement response.
From the above conclusions, it can be seen that great
caution should be taken when interpreting the results from
the microcompression of FIB-milled polymeric micropil-
lars owing to the confounding effects from the ion-beam
milling. In particular, our finding shows that the surface
effect plays an important role in the microcompression of
the epoxy micropillars. It is expected that such an effect
may still persist even in the polymeric micropillars fabri-
cated by other means because of the exposure of the
polymers to light and air for some time before the exper-
iments or to a process that occurs during fabrication. In
such a sense, our study provides a useful experimental and
analytical framework to quantify such a surface effect and,
therefore, paves the way for the future use of microcom-
pression in the study of a variety of polymer-based
advanced material systems, such as nano-composites,
polymer thin films, and polymer-based microstructures.
Acknowledgements S.W. and Y.Y. acknowledge the financial
support provided by the Hong Kong Polytechnic University for newly
recruited academic staff. Y.Y. is thankful to Prof. Y.L. of University
of Sidney for the invaluable discussions.
Appendix A
The standard nanoindentation method based on the Oliver
and Pharr’s approach was used to measure the Young’s
modulus, E, of the bulk epoxy sample [13]. To exclude the
creep effect, a holding section was included into the load
function as seen from the inset of Fig. A1a. For consistency
of experimental data, only those load–displacement curves
following a mater curve in the loading portion were
selected for the analysis. Furthermore, to attain a time-
independent property, the duration of the holding section
was varied such that the time dependence of the modulus
could be monitored. The results showed that, once the
holding time reached more than *2 s, there was no sys-
tematic change in the distribution of the measured modu-
lus, as shown in Fig. A1a. Based on our experimental
results, the extracted Young’s modulus displays a normal
distribution with a mean value of 3.9 Pa and a standard
deviation of 0.1 GPa for the bulk epoxy sample (note that
the Poisson’s ratio of the epoxy was assumed as *0.35 in
the data analysis).
As complement to the histogram of the measured
modulus, Fig. A1a and b shows its variation with the
indentation contact depth, which seemingly reveals a sur-
face effect, that is, the measured modulus appears slightly
J Mater Sci (2012) 47:6047–6055 6053
123
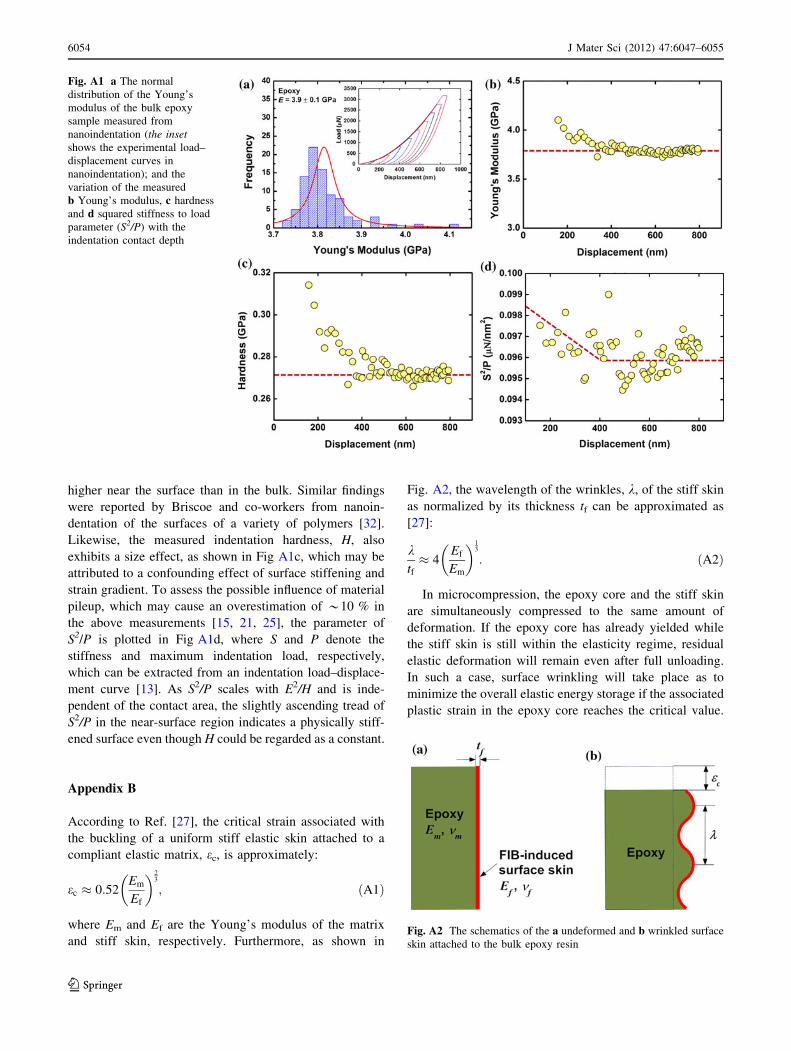
higher near the surface than in the bulk. Similar findings
were reported by Briscoe and co-workers from nanoin-
dentation of the surfaces of a variety of polymers [32].
Likewise, the measured indentation hardness, H, also
exhibits a size effect, as shown in Fig A1c, which may be
attributed to a confounding effect of surface stiffening and
strain gradient. To assess the possible influence of material
pileup, which may cause an overestimation of *10 % in
the above measurements [15, 21, 25], the parameter of
S2/P is plotted in Fig A1d, where S and P denote the
stiffness and maximum indentation load, respectively,
which can be extracted from an indentation load–displace-
ment curve [13]. As S2/P scales with E2/H and is inde-
pendent of the contact area, the slightly ascending tread of
S2/P in the near-surface region indicates a physically stiff-
ened surface even though H could be regarded as a constant.
Appendix B
According to Ref. [27], the critical strain associated with
the buckling of a uniform stiff elastic skin attached to a
compliant elastic matrix, ec, is approximately:
ec � 0:52Em
Ef
� �23
; ðA1Þ
where Em and Ef are the Young’s modulus of the matrix
and stiff skin, respectively. Furthermore, as shown in
Fig. A2, the wavelength of the wrinkles, k, of the stiff skin
as normalized by its thickness tf can be approximated as
[27]:
ktf
� 4Ef
Em
� �13
: ðA2Þ
In microcompression, the epoxy core and the stiff skin
are simultaneously compressed to the same amount of
deformation. If the epoxy core has already yielded while
the stiff skin is still within the elasticity regime, residual
elastic deformation will remain even after full unloading.
In such a case, surface wrinkling will take place as to
minimize the overall elastic energy storage if the associated
plastic strain in the epoxy core reaches the critical value.
Fig. A1 a The normal
distribution of the Young’s
modulus of the bulk epoxy
sample measured from
nanoindentation (the insetshows the experimental load–
displacement curves in
nanoindentation); and the
variation of the measured
b Young’s modulus, c hardness
and d squared stiffness to load
parameter (S2/P) with the
indentation contact depth
Fig. A2 The schematics of the a undeformed and b wrinkled surface
skin attached to the bulk epoxy resin
6054 J Mater Sci (2012) 47:6047–6055
123

Note that almost all surface wrinkles were observed around
the surface cracks in the plastically deformed micropillars
(Fig. 3). This is because, as the constraint in the hoop
direction is released on the two inner faces of the surface
cracks, the stress state there in the stiff skin and its adjacent
epoxy resin is closer to that for elastic wrinkling as
predicted by Eqs. (A1) and (A2).
To estimate tf and Ef, the plastically deformed epoxy
micropillars were carefully examined using high-resolution
scanning electron microscopy. The wavelengths k were
recorded with the corresponding plastic deformation in the
micropillar and, then used together with the Young’s
modulus of the bulk epoxy, as measured from nanoinden-
tation (Em * 3.9 GPa), to solve for tf and Ef from
Eqs. (A1) and (A2). Based on our experimental data,
k * 250 nm and ec * 0.12, which then leads to
tf * 30 nm and Ef * 30 GPa. As compared with amor-
phous-metal micropillars, such as Zr-based metallic glass
whose FIB damage layer was measured to be a few
nanometers in thickness [28], the epoxy micropillars pos-
sess a much thicker stiffened FIB damage layer, which may
result from chain scission and formation of new cross-links
in the polymeric materials because of ion irradiation [33].
References
1. Liu C (2007) Adv Mater 19:3783
2. Wilson SA, Jourdain RPJ, Zhang Q, Dorey RA, Bowen CR,
Willander M, Wahab QU, Willander M, Al-hilli SM, Nur O,
Quandt E, Johansson C, Pagounis E, Kohl M, Matovic J, Samel
B, van der Wijngaart W, Jager EWH, Djinovic CDZ, Wegener M,
Moldovan C, Iosub R, Abad E, Wendlandt M, Rusu C, Persson K
(2007) Mater Sci Eng R 56:1
3. Forrest SR (2004) Nature 428:911
4. Park SH, Roy A, Beaupre S, Cho S, Coates N, Moon JS, Moses
D, Leclerc M, Lee K, Heeger AJ (2009) Nat Photonics 3:297
5. Briseno AL, Mannsfeld SCB, Ling MM, Liu S, Tseng RJ, Reese
C, Robert ME, Yang Y, Wudl F, Bao Z (2006) Nature 444:913
6. Stolken JS, Evans AG (1998) Acta Mater 46:5109
7. Uchic MD, Dimiduk DM, Florando JN, Nix WD (2004) Science
305:986
8. Ostlund F, Rzepiejewska-Malyska K, Leifer K, Hale LM, Tang
YY, Ballarini R, Gerberich WW, Michler J (2009) Adv Funct
Mater 19:2439
9. Uchic MD, Shade PA, Dimiduk DM (2009) Annu Rev Mater Res
39:361
10. Fleck NA, Muller GM, Ashby MF, Hutchinson JW (1994) Acta
Metall Mater 42:475
11. Fleck NA, Hutchinson JW (1997) Adv Appl Mech 33:295
12. Gao H, Nix WD (1998) J Mech Phys Solids 46:411
13. Oliver WC, Pharr GM (1992) J Mater Res 7:1564
14. Lam DCC, Chong ACM (2001) Mater Sci Eng A 318:313
15. Yang Y, Ye JC, Lu J, Liu FX, Liaw PK (2009) Acta Mater
57:1613
16. Ye JC, Lu J, Yang Y, Liaw PK (2010) Intermetallics 18:385
17. Chong ACM, Lam DCC (1999) J Mater Res 14:4103
18. Tan EPS, Lim CT (2006) Comp Sci Tech 66:1102
19. Feng G, Ngan AHW (2002) J Mater Res 17:660
20. Stone DS, Jakes JE, Puthoff J, Elmustafa AA (2010) J Mater Res
25:611
21. Choi Y, Lee H-S, Kwon D (2004) J Mater Res 19:3307
22. Wang G-T, Liu H-Y, Saintier N, Mai Y-W (2009) Eng Fail Anal
16:2635
23. Greer JR, Oliver WC, Nix WD (2005) Acta Mater 53:1821
24. White H, Pu Y, Rafailovich M, Sokolov J, King AH, Giannuzzi
LA, Urbanik-Shannon C, Kempshall BW, Eisenberg A, Schwarz
SA, Strzhemechny YM (2001) Polymer 42:1613
25. Ye JC, Lu J, Yang Y, Liaw PK (2009) Acta Mater 57:6037
26. Wachter LM, Renshaw CE, Schulson EM (2009) Acta Mater
57:345
27. Moon MW, Lee SH, Sun JY, Oh KH, Vaziri A, Hutchinson JW
(2007) Proc Nat Acad Sci USA 104:1130
28. Lai YH, Lee CJ, Cheng YT, Chou HS, Chen HM, Du XH, Chang
CI, Huang JC, Jian SR, Jang JSC, Nieh TG (2008) Scripta Mater
58:890
29. Mayr AE, Cook WD, Edward GH (1998) Polymer 39:3719
30. Stachurski ZH (1997) Prog Polym Sci 22:407
31. Bazant ZP, Planas J (1998) Fracture and size effect in concrete
and other quasibrittle materials. CRC, Boca Raton
32. Briscoe BJ, Fiori L, Peillo E (1998) J Phys D Appl Phys 31:2395
33. Sasuga T, Kawanishi S, Nishi M, Seguchi T, Kohno I (1991)
Radiat Phys Chem 37:135
J Mater Sci (2012) 47:6047–6055 6055
123