six sigma green belt part 5 - institute of industrial and ... · pdf filesix sigma green belt...
TRANSCRIPT

5-1
Six Sigma Green Belt
Part 5
Process Capability
© 2011 IIE and Aft Systems, Inc.

© 2011 IIE and Aft Systems, Inc. 5-2
Process Capability
• Is the measured, inherent reproducibility of the product turned out by the process. It can be quantified from data which, in turn, are the result of measurements of work performed by the process. It defines limits we would normally expect virtually all individuals to fall within.
• By definition a process is “capable” when it is operating at the three sigma level.

© 2011 IIE and Aft Systems, Inc. 5-3
Process Capability
• Is the range over which the natural variation of a process occurs as determined by the system of common causes.
• It is the ability of the combination of people, machines, methods, materials, and measurements to produce a product or service that will consistently meet design specifications.
© 2011 IIE and Aft Systems, Inc. 5-4
Measuring Process Capability
• Process capability is measured by the proportion of output that can be produced within design specifications-It is a long term prediction.
• It is a measure of the uniformity of the process.
It can be measured only if all special causes have been eliminated and the process is in a
state of statistical control.
© 2011 IIE and Aft Systems, Inc. 5-5
Components of Process Capability
• Design specifications
• Centering of natural variation
• Range or spread of variation

© 2011 IIE and Aft Systems, Inc. 5-6
Capability Measures
• Short term measures show the capability at a specific instance in time, e.g., 5 out of 90 samples did not meet customer requirements
• Long term measures show the expected capability of the process based on statistical projections using inherent process variability

© 2011 IIE and Aft Systems, Inc. 5-7
Establishing Process Capability
• Histogram
• Control Chart
These must be performed prior to calculating any process capability measures

© 2011 IIE and Aft Systems, Inc. 5-8
Statistics
Green Belts are expected to be able to calculate the following:
• Percent or proportion Non-Conforming
• Cp Index
• Cpk Index

© 2011 IIE and Aft Systems, Inc. 5-9
Percent Non-Conforming
• Reflects the proportion of the population that we normally expect not to meet the process specifications.
• Corresponds to the
‘tail’ areas on the
normal curve sketch
AcceptableLSLLSL
USL

© 2011 IIE and Aft Systems, Inc. 5-10
Calculating
Use z transform. Values in Normal Curve Table
22 d
MR
d
R'
x-Lspec
x-Uspec
or
z
z
l
u
Process must be centered somewhere between the customer requirements.
mean thecalled also is x

© 2011 IIE and Aft Systems, Inc. 5-11
Z Value Tail Z Value Tail Z Value Tail Z Value Tail
Prop. Prop. Prop. Prop.
0.01 0.4960 0.31 0.3783 0.61 0.2709 0.91 0.1814
0.02 0.4920 0.32 0.3745 0.62 0.2676 0.92 0.1788
0.03 0.4880 0.33 0.3707 0.63 0.2643 0.93 0.1762
0.04 0.4840 0.34 0.3669 0.64 0.2611 0.94 0.1736
0.05 0.4801 0.35 0.3632 0.65 0.2578 0.95 0.1711
0.06 0.4761 0.36 0.3594 0.66 0.2546 0.96 0.1685
0.07 0.4721 0.37 0.3557 0.67 0.2514 0.97 0.1660
0.08 0.4681 0.38 0.3520 0.68 0.2483 0.98 0.1635
0.09 0.4641 0.39 0.3483 0.69 0.2451 0.99 0.1611
0.10 0.4602 0.40 0.3446 0.70 0.2420 1.00 0.1587
0.11 0.4562 0.41 0.3409 0.71 0.2389 1.01 0.1562
0.12 0.4522 0.42 0.3372 0.72 0.2358 1.02 0.1539
0.13 0.4483 0.43 0.3336 0.73 0.2327 1.03 0.1515
0.14 0.4443 0.44 0.3300 0.74 0.2296 1.04 0.1492
0.15 0.4404 0.45 0.3264 0.75 0.2266 1.05 0.1469
0.16 0.4364 0.46 0.3228 0.76 0.2236 1.06 0.1446
0.17 0.4325 0.47 0.3192 0.77 0.2206 1.07 0.1423
0.18 0.4286 0.48 0.3156 0.78 0.2177 1.08 0.1401
0.19 0.4247 0.49 0.3121 0.79 0.2148 1.09 0.1379
0.20 0.4207 0.50 0.3085 0.80 0.2119 1.10 0.1357
0.21 0.4168 0.51 0.3050 0.81 0.2090 1.11 0.1335
0.22 0.4129 0.52 0.3015 0.82 0.2061 1.12 0.1314
0.23 0.4090 0.53 0.2981 0.83 0.2033 1.13 0.1292
0.24 0.4052 0.54 0.2946 0.84 0.2005 1.14 0.1271
0.25 0.4013 0.55 0.2912 0.85 0.1977 1.15 0.1251
0.26 0.3974 0.56 0.2877 0.86 0.1949 1.16 0.1230
0.27 0.3936 0.57 0.2843 0.87 0.1922 1.17 0.1210
0.28 0.3897 0.58 0.2810 0.88 0.1894 1.18 0.1190
0.29 0.3859 0.59 0.2776 0.89 0.1867 1.19 0.1170
0.30 0.3821 0.60 0.2743 0.90 0.1841 1.20 0.1151

© 2011 IIE and Aft Systems, Inc. 5-12
Z Value Tail Z Value Tail Z Value Tail Z Value Tail
Prop. Prop. Prop. Prop.
1.21 0.1131 1.51 0.0655 1.81 0.0351 2.11 0.0174
1.22 0.1112 1.52 0.0643 1.82 0.0344 2.12 0.0170
1.23 0.1093 1.53 0.0630 1.83 0.0336 2.13 0.0166
1.24 0.1075 1.54 0.0618 1.84 0.0329 2.14 0.0162
1.25 0.1056 1.55 0.0606 1.85 0.0322 2.15 0.0158
1.26 0.1038 1.56 0.0594 1.86 0.0314 2.16 0.0154
1.27 0.1020 1.57 0.0582 1.87 0.0307 2.17 0.0150
1.28 0.1003 1.58 0.0571 1.88 0.0301 2.18 0.0146
1.29 0.0985 1.59 0.0559 1.89 0.0294 2.19 0.0143
1.30 0.0968 1.60 0.0548 1.90 0.0287 2.20 0.0139
1.31 0.0951 1.61 0.0537 1.91 0.0281 2.21 0.0136
1.32 0.0934 1.62 0.0526 1.92 0.0274 2.22 0.0132
1.33 0.0918 1.63 0.0516 1.93 0.0268 2.23 0.0129
1.34 0.0901 1.64 0.0505 1.94 0.0262 2.24 0.0125
1.35 0.0885 1.65 0.0495 1.95 0.0256 2.25 0.0122
1.36 0.0869 1.66 0.0485 1.96 0.0250 2.26 0.0119
1.37 0.0853 1.67 0.0475 1.97 0.0244 2.27 0.0116
1.38 0.0838 1.68 0.0465 1.98 0.0239 2.28 0.0113
1.39 0.0823 1.69 0.0455 1.99 0.0233 2.29 0.0110
1.40 0.0808 1.70 0.0446 2.00 0.0228 2.30 0.0107
1.41 0.0793 1.71 0.0436 2.01 0.0222 2.31 0.0104
1.42 0.0778 1.72 0.0427 2.02 0.0217 2.32 0.0102
1.43 0.0764 1.73 0.0418 2.03 0.0212 2.33 0.0099
1.44 0.0749 1.74 0.0409 2.04 0.0207 2.34 0.0096
1.45 0.0735 1.75 0.0401 2.05 0.0202 2.35 0.0094
1.46 0.0721 1.76 0.0392 2.06 0.0197 2.36 0.0091
1.47 0.0708 1.77 0.0384 2.07 0.0192 2.37 0.0089
1.48 0.0694 1.78 0.0375 2.08 0.0188 2.38 0.0087
1.49 0.0681 1.79 0.0367 2.09 0.0183 2.39 0.0084
1.50 0.0668 1.80 0.0359 2.10 0.0179 2.40 0.0082

© 2011 IIE and Aft Systems, Inc. 5-13
Z Value Tail Z Value Tail Z Value Tail
Prop. Prop. Prop.
2.41 0.0080 2.71 0.0034 3.10 0.00096760
2.42 0.0078 2.72 0.0033 3.20 0.00068714
2.43 0.0075 2.73 0.0032 3.30 0.00048342
2.44 0.0073 2.74 0.0031 3.40 0.00033693
2.45 0.0071 2.75 0.0030 3.50 0.00023263
2.46 0.0069 2.76 0.0029 3.60 0.00015911
2.47 0.0068 2.77 0.0028 3.70 0.00010780
2.48 0.0066 2.78 0.0027 3.80 0.00007235
2.49 0.0064 2.79 0.0026 3.90 0.00004810
2.50 0.0062 2.80 0.0026 4.00 0.00003167
2.51 0.0060 2.81 0.0025 4.10 0.00002066
2.52 0.0059 2.82 0.0024 4.20 0.00001335
2.53 0.0057 2.83 0.0023 4.30 0.00000854
2.54 0.0055 2.84 0.0023 4.40 0.00000541
2.55 0.0054 2.85 0.0022 4.50 0.00000340
2.56 0.0052 2.86 0.0021 4.60 0.00000211
2.57 0.0051 2.87 0.0021 4.70 0.00000130
2.58 0.0049 2.88 0.0020 4.80 0.00000079
2.59 0.0048 2.89 0.0019 4.90 0.00000048
2.60 0.0047 2.90 0.0019 5.00 0.00000029
2.61 0.0045 2.91 0.0018 5.10 0.00000017
2.62 0.0044 2.92 0.0018 5.20 0.00000010
2.63 0.0043 2.93 0.0017 5.30 0.00000006
2.64 0.0041 2.94 0.0016 5.40 0.00000003
2.65 0.0040 2.95 0.0016 5.50 0.00000002
2.66 0.0039 2.96 0.0015 6.00 0.000000001
2.67 0.0038 2.97 0.0015 6.50 0.00000000
2.68 0.0037 2.98 0.0014 7.00 0.00000000
2.69 0.0036 2.99 0.0014 7.50 0.00000000
2.70 0.0035 3.00 0.0013 8.00 0.00000000

© 2011 IIE and Aft Systems, Inc. 5-14
Example
A process has a mean of 600 and a standard deviation of 6. Spec limits are 585 and 615.
1. What is the percent non-conforming? (The total proportion in both tails.)
2. What is the DPMO?
3. What is the sigma level? (The sigma level is the smaller of the two z values.)
LSLLSL
USLUnacceptable
Unacceptable

© 2011 IIE and Aft Systems, Inc. 5-15
Example
A process has a mean of 100 and a standard deviation of 4. Spec limits are 95 and 106.
1. What is the percent non-conforming?
2. What is the sigma level?
3. What is the DPM?
LSLLSL
USLUnacceptable
Unacceptable

© 2011 IIE and Aft Systems, Inc. 5-16
ExampleContinued
In the preceding example if each incorrect transaction costs $4 and annual volume is 400,000, what is the cost of the incorrect transactions?

© 2011 IIE and Aft Systems, Inc. 5-17
ExampleContinued
If in the preceding example the standard deviation were reduced to 2 via a DMAIIC Green Belt project. If this were done at a cost of $100,000 would it be worth it? (One year payback.)

© 2011 IIE and Aft Systems, Inc. 5-18
ExampleContinued
What would it take (or be worth) to now reduce the standard deviation to 1?

© 2011 IIE and Aft Systems, Inc. 5-19
More Practice
• A process has a mean of 200 and and a standard deviation of 2.
• Upper specification limit is 212.
• Lower specification limit is 188.
• Determine
– Proportion non conforming
– DPMO
– Sigma Level
Motorola Shift

© 2011 IIE and Aft Systems, Inc. 5-20
Another Problem
What is the capability of the process, in terms of proportion defective or sigma level or dpmo, we collected data on earlier in the course?
(page 4-12)

© 2011 IIE and Aft Systems, Inc. 5-21
Capability Indices
Show the relationship between the process capability and the process specifications
Cp measures potential capability assuming that the process average is equal to the midpoint of the specification limits and the process is operating in statistical control. Cpk reflects the current process mean’s proximity to either specification limit. (When the process is centered Cp = Cpk.)
Although the indices are calculated differently, the interpretation is the same

© 2011 IIE and Aft Systems, Inc. 5-22
Cp or Cpk Less than 1.0
Cp or Cpk
Value
Sigma
Level
0.33
0.67
1
2

© 2011 IIE and Aft Systems, Inc. 5-23
Cp or Cpk Equal to 1.0
Cp or Cpk
Value
Sigma
Level
0.33
0.67
1.00
1
2
3-4.5
-4.3 -4
-3.8
-3.5
-3.3
-3.1
-2.8
-2.6
-2.3
-2.1
-1.9
-1.6
-1.4
-1.1
-0.9
-0.7
-0.4
-0.2
0.0
7
0.3
1
0.5
5
0.7
9
1.0
3
1.2
7
1.5
1
1.7
5
1.9
9
2.2
3
2.4
7
2.7
1
2.9
5
3.1
9
3.4
3
3.6
7
3.9
1
4.1
5
4.3
9

© 2011 IIE and Aft Systems, Inc. 5-24
Cp or Cpk Greater than 1.0
Cp or Cpk
Value
Sigma
Level
0.33
0.67
1.00
1.33
1.67
2.00
2.33
2.67
3.00
1
2
3
4
5
6
7
8
9
No Motorola Shift
-4.5
-4.3 -4
-3.8
-3.5
-3.3
-3.1
-2.8
-2.6
-2.3
-2.1
-1.9
-1.6
-1.4
-1.1
-0.9
-0.7
-0.4
-0.2
0.0
7
0.3
1
0.5
5
0.7
9
1.0
3
1.2
7
1.5
1
1.7
5
1.9
9
2.2
3
2.4
7
2.7
1
2.9
5
3.1
9
3.4
3
3.6
7
3.9
1
4.1
5
4.3
9
© 2011 IIE and Aft Systems, Inc. 5-25
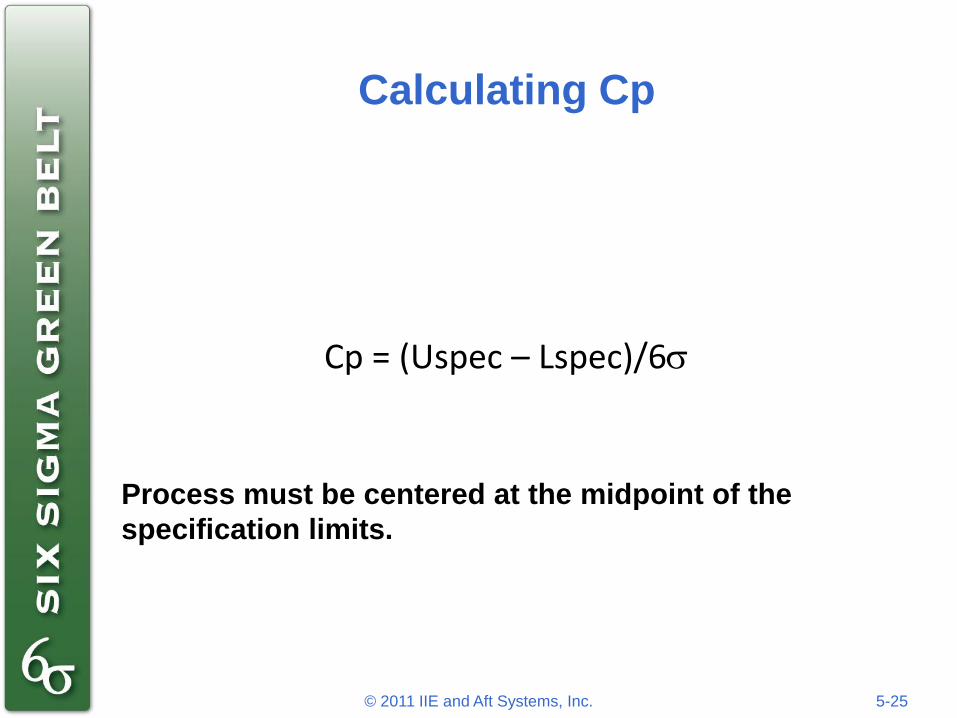
Calculating Cp
Cp = (Uspec – Lspec)/6
Process must be centered at the midpoint of the
specification limits.

© 2011 IIE and Aft Systems, Inc. 5-26
Cpk Calculation
Smaller of the following:
Cpku = (Uspec – Mean) / 3
Cpkl = (Mean – Lspec) / 3
Cpk also is equal to the sigma level divided by 3
Note:Can also use these for one sided requirements

© 2011 IIE and Aft Systems, Inc. 5-27
Capability
What is the capability index for the process we analyzed earlier? (page 4-12)

Interpretation
© 2011 IIE and Aft Systems, Inc. 5-28
Capability Measure
Not Capable Capable
More than
Capable
Proportion Non
ConformingMore than
.0027 0.0027Less than
.0027
DPMOMore than
2700 2700Less than
2700
Sigma LevelLess than
3.0 3.0More
than 3.0
CpkLess than
1.0 1More
than 1.0

© 2011 IIE and Aft Systems, Inc. 5-29
Another Cost Study
• A process has customer requirements of 50 and 75. It is in control with an adjustable mean and a known standard deviation (based on the Shewhart approximation) of 8.
• Accounting tells us that a “defect” on the low side will cost of $10 and on the high side $5. (Scrap vs. rework.)
• Engineering has not been able to figure out a way to reduce variation.
• What is the optimum location for the process centering in order to minimize cost?

© 2011 IIE and Aft Systems, Inc. 5-30
Homework ExerciseU-Bolts
• On the following page is data on U-bolts for the dimension shown at the right.
• Determine the capability of the process regarding the indicated dimension. (Specs are 10.70 + .15)

© 2011 IIE and Aft Systems, Inc. 5-31
Sample Observations Average Range
1 10.65 10.70 10.65 10.80 10.55 10.670 0.25
2 10.75 10.85 10.75 10.70 10.65 10.740 0.20
3 10.75 10.80 10.80 10.70 10.75 10.760 0.10
4 10.60 10.70 10.65 10.65 10.90 10.700 0.30
5 10.70 10.75 10.70 10.65 10.65 10.690 0.10
6 10.60 10.75 10.75 10.75 10.70 10.710 0.15
7 10.75 10.80 10.65 10.75 10.45 10.680 0.35
8 10.65 10.80 10.50 10.70 10.80 10.690 0.30
9 10.60 10.70 10.70 10.65 10.60 10.650 0.10
10 10.80 10.75 10.60 10.75 10.65 10.710 0.20
11 10.85 10.70 10.65 10.70 10.65 10.710 0.20
12 10.70 10.75 10.75 10.70 10.65 10.710 0.10
13 10.65 10.70 10.75 10.65 10.50 10.650 0.25
14 10.70 10.80 10.90 10.80 10.70 10.780 0.20
15 10.65 10.80 10.65 10.60 10.65 10.670 0.20
16 10.75 10.70 10.65 10.75 10.65 10.700 0.10
17 10.90 10.70 10.80 10.70 10.75 10.770 0.20
18 10.75 10.65 10.70 10.65 10.55 10.660 0.20
19 10.75 10.60 10.75 10.60 10.90 10.720 0.30
20 10.65 10.55 10.70 10.70 10.65 10.650 0.15
21 10.60 10.65 10.65 10.70 10.65 10.650 0.10
22 10.50 10.60 10.70 10.65 10.75 10.640 0.25
23 10.80 10.70 10.65 10.50 10.65 10.660 0.30
24 10.65 10.65 10.90 10.80 10.65 10.730 0.25
104

© 2011 IIE and Aft Systems, Inc. 5-32
Statistics
Mean 10.6958
Average Range .2021
Shewhart Standard Deviation .0869
Calculated Standard Deviation
.0871

© 2011 IIE and Aft Systems, Inc. 5-33
28
27
26
25
24
23
22
21
20
19
18
17
16
Frequency 15
14
13
12
11
10
9
8
7
6
5
4
3
2
1

© 2011 IIE and Aft Systems, Inc. 5-34
Sample ID
Averages
Ranges

© 2011 IIE and Aft Systems, Inc. 5-35
Histogram
0
5
10
15
20
25
30
35
40
10.45
to <=
10.495
10.495
to <=
10.54
10.54
to <=
10.585
10.585
to <=
10.63
10.63
to <=
10.675
10.675
to <=
10.72
10.72
to <=
10.765
10.765
to <=
10.81
10.81
to <=
10.855
10.855
to <=
10.9
Class
# O
bs
erv
ati
on
s

© 2011 IIE and Aft Systems, Inc. 5-36
Xbar Chart
UCL=10.81244
LCL=10.57923
CEN=10.69583
10.45
10.5
10.55
10.6
10.65
10.7
10.75
10.8
10.85
1 2 3 4 5 6 7 8 9 10 11 12 13 14 15 16 17 18 19 20 21 22 23 24
R Chart
UCL=0.4272
LCL=0.0
CEN=0.20208
0
0.1
0.2
0.3
0.4
0.5
1 2 3 4 5 6 7 8 9 10 11 12 13 14 15 16 17 18 19 20 21 22 23 24

© 2011 IIE and Aft Systems, Inc. 5-37
Process CapabilityCpk Analysis
10
.30
10
.33
10
.35
10
.38
10
.40
10
.43
10
.45
10
.48
10
.50
10
.53
10
.55
10
.58
10
.60
10
.63
10
.65
10
.68
10
.70
10
.73
10
.75
10
.78
10
.80
10
.83
10
.85
10
.88
10
.90
10
.93
10
.95
10
.97
11
.00
11
.02
11
.05
11
.07
Mean = 10.696
StdDev = 0.0869
USL = 10.85
LSL = 10.55
Sigma Level = 1.6801
Cpk = .5600
DPM = 84,654