site suitability review of the missouri river sanitation
TRANSCRIPT
Site Suitability Reviewof the
Missouri River Sanitation Landfill
byJeffrey Olson
North Dakota State Water Commissionand
Phillip L. GreerNorth Dakota Geological Survey
Prepared by theNorth Dakota State Water Commissionand theNorth Dakota Geological Survey
ND Landfill Site Investigation No. 9

SITE SUITABILITY REVIEWOF THE
MISSOURI RIVER SANITATION LANDFILL
By Jeffrey M. Olson, North Dakota State Water Commission,
and Phillip L. Greer, North Dakota Geological Survey
North Dakota Landfill Site Investigation 9
Prepared by the NORTH DAKOTA GEOLOGICAL SURVEYand the NORTH DAKOTA STATE WATER COMMISSION
Bismarck, North Dakota1993
TABLE OF CONTENTS
Page
INTRODUCTION 1
Purpose 1
Location of the Missouri River Sanitation Landfill.. 1
Previous Site Investigations 3
Methods of Investigation 3
Test Drilling Procedure 3
Monitoring Well Construction and Development... 4
Collecting and Analyzing Water Samples 6
Water-Level Measurements 8
Well-Abandonment Procedures 8
Location-Numbering System 10
GEOLOGY 12
Regional Geology 12
Local Geology 13
HYDROLOGY 16
Surface Water Hydrology 16
Regional Ground-Water Hydrology 17
Local Ground-Water Hydrology 18
Water Quality 19
CONCLUSIONS 20
REFERENCES 23
APPENDIX A Water Quality Standards and MaximumContaminant Levels 24
APPENDIX B Sampling Procedure for Volatile OrganicCompounds 26
APPENDIX C Lithologic Logs of Wells and Test Holes. 28
ii
TABLE OF CONTENTS (cont.)
Page
APPENDIX D Water Level Tables 35
APPENDIX E
APPENDIX F
APPENDIX G
Major Ion and Trace ElementConcentrations. 37
Volatile Organic Compounds for Well146-082-23DCA 39
Volatile Organic Compounds for Well146-082-26ABA 42
iii
LIST OF FIGURES
Page
Figure 1. Location of the Missouri River Sanitationlandfill in the SE 1/4 quarter of Section 23and NE 1/4 of Section 26, T146N, R82W 2
Figure 2. Well construction design used for monitoringwells installed at the Missouri RiverSanitation landfill. 5
Figure 3. Monitoring well abandonment procedure 9
Figure 4. Location-numbering system for the MissouriRiver Sanitation landfill. 11
Figure 5. Location of monitoring wells and thedirection of ground-water flow at theMissouri River Sanitation landfill 14
Figure 6. Geohydrologic-section A-A' in the MissouriRiver Sanitation landfill. 15
iv
INTRODUCTION
Purpose
The North Dakota State Engineer and the North Dakota
State Geologist were instructed by the 52 nd State Legislative
Assembly to conduct site-suitability reviews of the municipal
landfills in the state of North Dakota. These reviews are to
be completed by July 1, 1995 (North Dakota Century Code 23-
29-07.7). The purpose of this program is to evaluate site
suitability of each landfill for disposal of solid waste
based on geologic and hydrologic characteristics. Reports
will be provided to the North Dakota State Department of
Health and Consolidated Laboratories (NDSDHCL) for use in
site improvement, site remediation, or landfill closure.
Additional studies may be necessary to meet the requirements
of the NDSDHCL for continued operation of municipal solid
waste landfills. The Missouri River Sanitation solid waste
landfill is one of the landfills being evaluated.
Location of the Missouri River Sanitation Landfill
The Missouri River Sanitation solid waste landfill is
located two miles east and one-mile south of the City of
Underwood in Township 146 North, Range 82 West, SE 1/4 of
Section 23 and NE 1/4 of Section 26 (Fig. 1). The landfill
site encompasses approximately 80 acres of which about 20
acres has been used.
1

Elevation in feet aboveMSL (NGVD of 1929)
McLeanCount
R.82W.
z
Nt
1-1
z
R.82W.
Landfill
01 Surface Water E2 Wetland Falkirk Mine
Mine Gravel Pit ft Building -- Streams
0 Falkirk Wells
Figure 1. Location of the Missouri River Sanitation landfillin the SE 1/4 of section 23 and NE 1/4 of Section 26,T146N, R82W.
2
Previous Site Investigations
The area surrounding the landfill location has been
studied extensively by the Falkirk Mining Company for the
purpose of lignite mining. The Falkirk Mine Permit
application NAFK-8405 (1990) described six hydrostratigraphic
units in the area of the landfill. Monitoring wells were
installed throughout the region for ground-water information
in the Cole Harbor Formation, Underwood sand, Hagel A and B
coal beds, and Hensler coal bed. The report provided a
detailed analysis of the local and regional hydrogeology and
hydrochemistry.
Methods of Investigation
The Missouri River Sanitation study was accomplished by
means of: 1) test drilling; 2) construction and development
of monitoring wells; 3) collecting and analyzing water
samples; and 4) measuring water levels. Well abandonment
procedures were followed for non-permanent monitoring wells.
Test Drilling Procedure
The drilling method at the Missouri River Sanitation
landfill was based on the site's geology and depth to ground
water, as determined by the preliminary evaluation. A solid-
stem auger was used at the Missouri River Sanitation landfill
3
because the sediments were poorly consolidated and because
the depth to the water table was expected to be less than 70
feet. The lithologic descriptions were determined from the
drill cuttings.
Monitoring Well Construction and Development
Three monitoring wells installed at the Missouri River
Sanitation landfill were based on the geologic and
topographic characteristics of the site. Three additional
wells that were already in place were also used in this
study. The depth and intake interval of each well was
selected to monitor the water level at the top of the
uppermost aquifer. The wells were located near the active
area of the landfill.
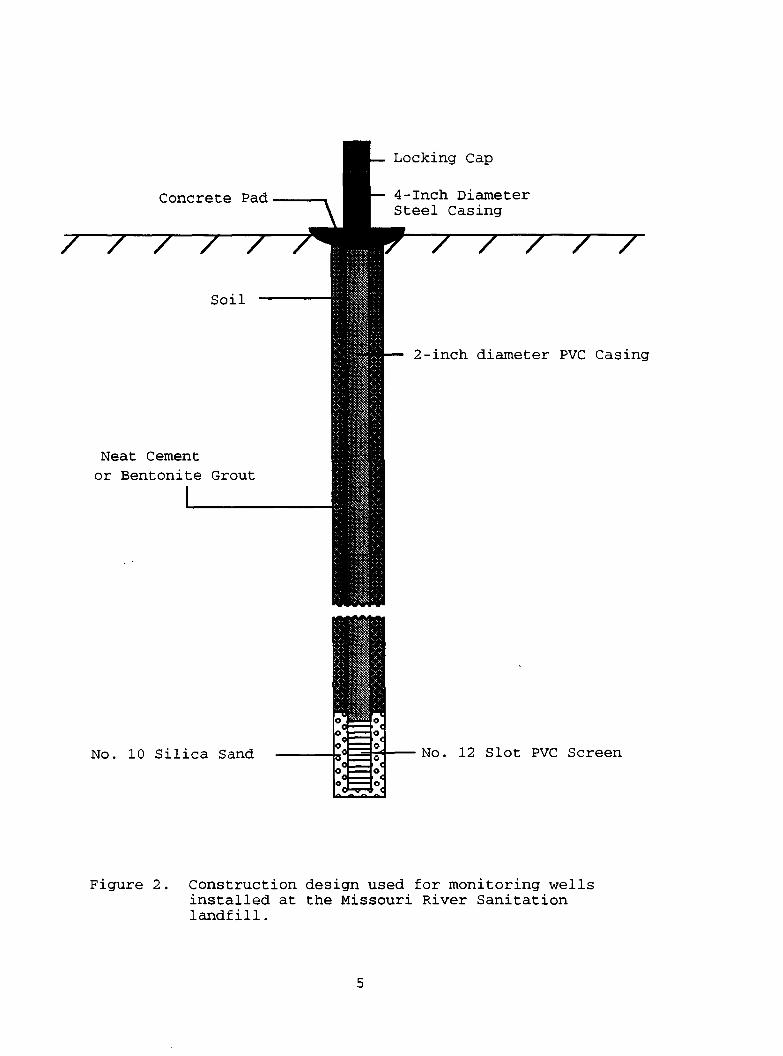
Monitoring wells were constructed following a standard
design (Fig. 2) intended to comply with the construction
regulations of the NDSDHCL and the North Dakota Board of
Water Well Contractors (North Dakota Department of Health,
1986). The wells were constructed using a 2-inch diameter,
SDR21, polyvinyl chloride (PVC) well casing and a PVC screen,
either 5 or 10 feet long, with a slot-opening size of 0.012
or 0.013 inches. The screen was fastened to the casing with
stainless steel screws (no solvent weld cement was used).
After the casing and screen were installed into the drill
hole, the annulus around the screen was filled with No. 10
4
Soil
Neat Cementor Bentonite Grout
1
2-inch diameter PVC Casing
Concrete Pad
Locking Cap
4-Inch DiameterSteel Casing
/ / / / / / / / / /
No. 10 Silica Sand No. 12 Slot PVC Screen
Figure 2. Construction design used for monitoring wellsinstalled at the Missouri River Sanitationlandfill.
5
(grain-size diameter) silica sand to a height of two feet
above the top of the screen. High-solids bentonite grout
and/or neat cement was placed above the silica sand to seal
the annulus to approximately five feet below land surface.
The remaining annulus was filled with drill cuttings. The
permanent wells were secured with a protective steel casing
and a locking cover protected by a two-foot-square concrete
pad.
All monitoring wells were developed using a stainless
steel bladder pump or a teflon bailer. Any drilling fluid
and fine materials present near the well were removed to
insure movement of formation water through the screen.
The Mean Sea Level (MSL) elevation was established for
each well by differential leveling to Third Order accuracy.
The surveys established the MSL elevation at the top of the
casing and the elevation of the land surface next to each
well.
Collecting and Analyzing Water Samples
Water-quality analyses were used to determine if
leachate is migrating from the landfill into the underlying
ground-water system. Selected field parameters, major ions,
and trace elements were measured for each water sample.
These field parameters and analytes are listed in Appendix A
with their Maximum Contaminant Levels (MCL). MCLs are
enforceable drinking water standards and represent the
6
maximum permissible level of a contaminant as stipulated by
the U.S. Environmental Protection Agency (EPA).
Water samples were collected using a bladder pump
constructed of stainless steel with a teflon bladder. A
teflon bailer was used in monitoring wells with limited
transmitting capacity. Before sample collection, three to
four well volumes were extracted to insure that unadulterated
formation water was sampled. Four samples from each well
were collected in high density polyethylene plastic bottles
as follows:
1) Raw (500 ml)
2) Filtered (500 ml)
3) Filtered and acidified (500 ml)
4) Filtered and double acidified (500 ml).
The following parameters were determined for each sample.
Specific conductance, pH, bicarbonate, and carbonate were
analyzed using the raw sample. Sulfate, chloride, nitrate,
and dissolved solids were analyzed using the filtered sample.
Calcium, magnesium, sodium, potassium, iron, and manganese
were analyzed from the filtered, acidified sample. Cadmium,
lead, arsenic, and mercury were analyzed using the filtered
double-acidified samples.
One well was sampled for Volatile Organic Compounds
(VOC) analysis. This sample was collected at a different
time than the standard water quality sample. The procedure
used for collecting the VOC sample is described in Appendix
B. Each sample was collected with a plastic throw-away
7
bailer and kept chilled. These samples were analyzed within
the permitted 14-day holding period. The standard water-
quality analyses were performed at the North Dakota State
Water Commission (NDSWC) Laboratory and VOC analyses were
performed by the NDSDHCL.
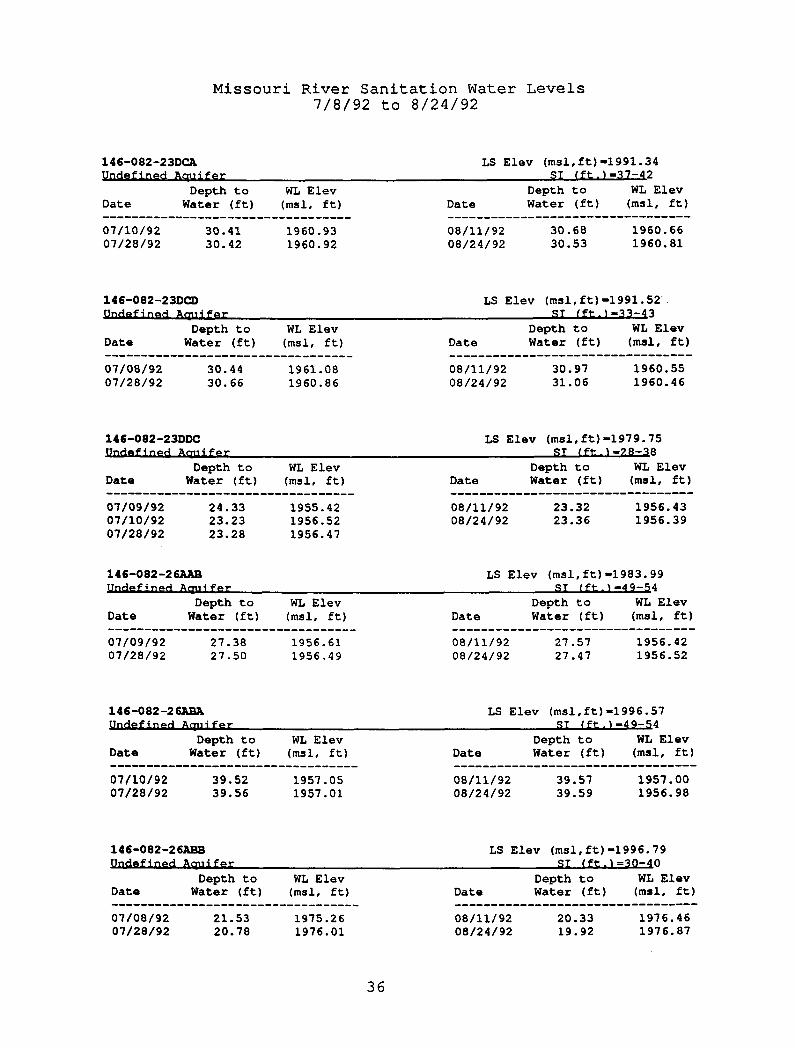
Water-Level Measurements
Water-level measurements were taken at least three times
at a minimum of two-week intervals. The measurements were
taken using a chalked-steel tape or an electronic (Solnist
10078) water-level indicator. These measurements were used
to determine the shape and configuration of the water table.
Well-Abandonment Procedure
The test holes and monitoring wells that were not
permanent were abandoned according to NDSDHCL and Board of
Water Well Contractors regulations (North Dakota Department
of Health, 1986). The soil around the well was dug to a
depth of approximately three to four feet below land surface
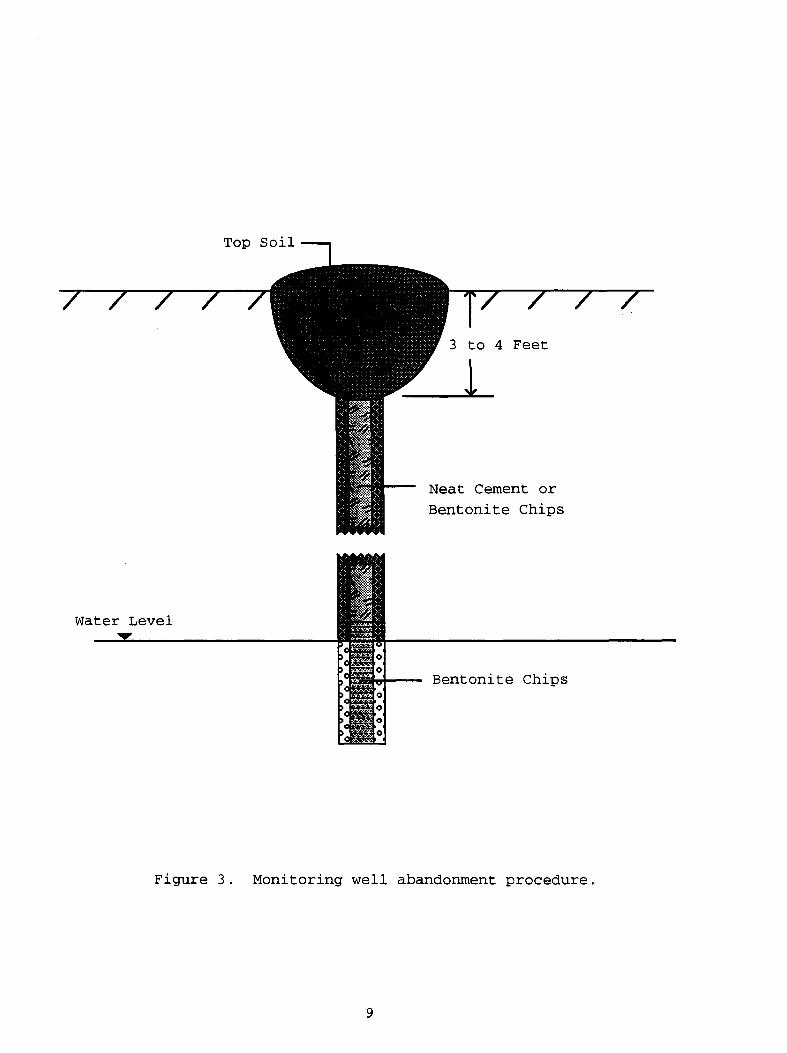
(Fig. 3) to prevent disturbance of the sealed wells. The
screened interval of the well was plugged with bentonite
chips to a height of approximately one foot above the top of
the screen and the remaining well casing was filled with neat
cement. The upper three to four feet was then filled with
cuttings and the disturbed area was blended into the
8
Top Soil
3 to 4 Feet
Neat Cement orBentonite Chips
Water Level
Bentonite Chips
Figure 3. Monitoring well abandonment procedure.
9

surrounding land surface. Test holes were plugged with high-
solids bentonite grout and/or neat cement to a depth
approximately five feet below land surface. The upper five
feet of the test hole was filled with soil cuttings.
Location-Numbering System
The system for denoting the location of a test hole or
observation well is based on the federal system of
rectangular surveys of public land. The first and second
numbers indicate Township north and Range west of the 5th
Principle Meridian and baseline (Fig. 4). The third number
indicates the section. The letters A, B, C, and D designate,
respectively, the northeast, northwest, southwest, and
southeast quarter section (160-acre tract), quarter-quarter
section (40-acre tract), and quarter-quarter-quarter section
(10-acre tract). Therefore, a well denoted by 146-082-23DCA
would be located in the NE1/4, SW1/4, SE1/4 Section 23,
Township 146 North, Range 82 West. Consecutive numbers are
added following the three letters if more than one well is
located in a 10-acre tract, e.g. 146-082-23DCA1 and 146-082-
23DCA2.
10

ooe efiy
146-082-23DCA
Figure 4. Location-numbering system for the Missouri RiverSanitation landfill.
11
GEOLOGY
Regional Geology
The area surrounding the Missouri River Sanitation
landfill is covered by a thin layer of glacial sediments
draped over the pre-existing bedrock topography. The glacial
sediments are mainly till comprised of an unsorted mixture of
clay, silt, and sand along with small percentages of pebbles,
cobbles, and boulders (Bluemle, 1971). Bedrock is exposed at
the surface in a few areas, primarily along the sides of Coal
Lake Coulee and its tributary drainages.
Coal Lake Coulee, to the east of the landfill, is a
glacial meltwater channel apparently connected the ancestral
Knife River with the interglacial Missouri River Channel
(Falkirk, 1990). Two test holes were drilled in Coal Lake
Coulee by the North Dakota State Water Commission. One test
hole encountered 24 feet of alluvium and slough deposits
(mainly clay and silt) underlain by 84 feet of outwash
deposits (mainly sand and gravel). The other test hole
encountered 63 feet of alluvium and slough deposits and 127
feet of outwash (Klausing, 1971).
The Sentinel Butte and Bullion Creek Formations underlie
the glacial sediments. These formations were deposited
during the Paleocene Epoch in a deltaic environment (Jacob,
1976). They are composed of sand, sandstone, silt, clay,
lignite, and limestone.
12

Local Geology
The Missouri River Sanitation landfill is located in the
abandoned Underwood Coal Company strip mine (Fig. 5). A
ravine on the east side of the landfill drains into Coal
Lake. This lake occupies a depression in Coal Lake Coulee
and is approximately 1/4 mile from the landfill.
Test hole 146-082-26ABB, located southwest of the
landfill, drilled through 17 feet of glacial drift (Fig. 6,
lithologic logs in Appendix C). The glacial drift is of
varuable thickness around the site and is generally absent
east of the landfill along Coal Lake Coulee. A layer of
bedrock sand underlies the glacial drift. Test holes drilled
by Falkirk Mining Company near the site also encountered the
sand, which ranges from 10 to 30 feet thick. The sand was
not reported in wells 146-082-26AAB and 146-082-26ABA, which
were drilled by Broneskew Drilling Company.
Two lignite beds, the Bagel A and B beds of the Sentinel
Butte Formation, were mined at the site. The Hagel A bed has
an average thickness of 9 feet. A layer of clay, 5 to 20
feet thick, overlies the Bagel A bed and underlies the
bedrock sand. The Bagel A bed outcrops along the flanks of
Coal Lake Coulee at elevations of about 1950 to 1960 feet.
13
11 Building Monitoring Well M Surface Water Active Area
F.0 Landfill -- Ephemeral Stream 146-082-26ABB1976.468/11/92 0 0
Direotion of
Elevation in feet Well Number andGround-Water Flow above MSL (NGVD, 1929) Water-Level Elevation
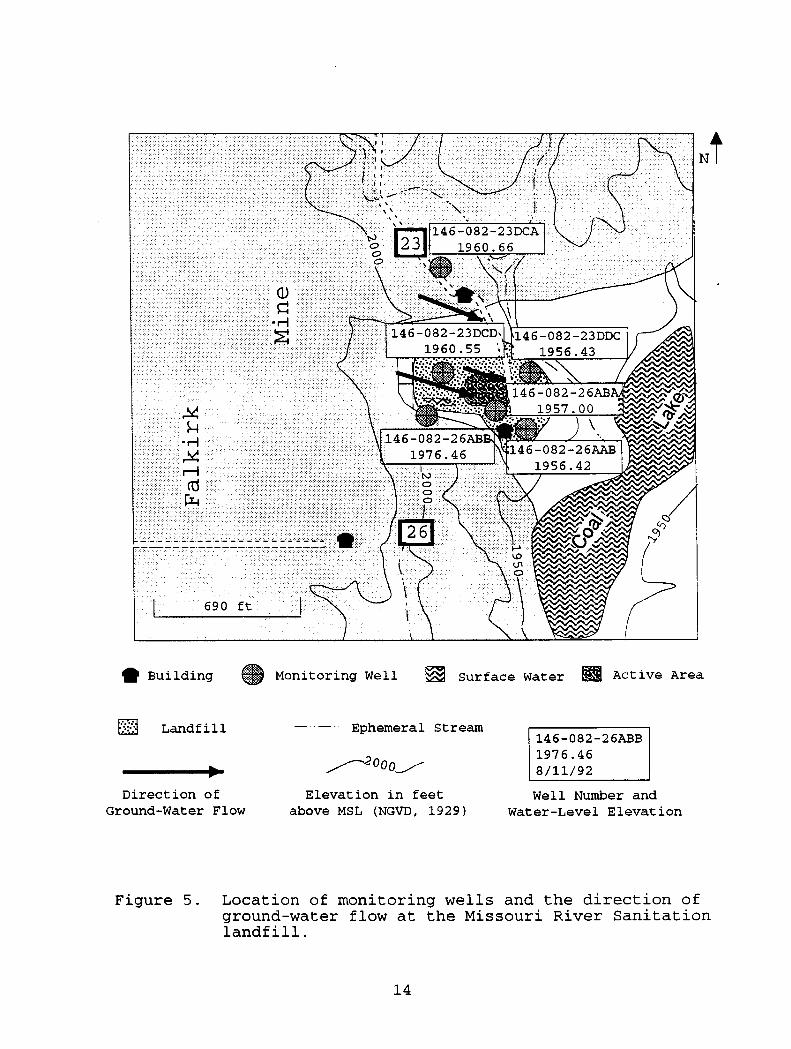
Figure 5. Location of monitoring wells and the direction ofground-water flow at the Missouri River Sanitationlandfill.
14

1960 -
1940
A
Elevationin Feet
2000 -
1980 -
GRAVEL
TILL
SPOILS ANDREWORKED MATERIAL
SAND
CLAY
Test HoleMonitoring
Well
ScreenedInterval
or
HorizontalScale in FeetA'
SEC 23
0 100
VerticalExaggerationX 8
200r 01.1i Al
• SEC 26
LIGNITE
V Water Levels07/28/92
Location of Wellsand Cross Section
Figure 6. Geohydrologic section A—A' in the Missouri River Sanitation landfill

Test holes in this study did not reach the Hagel B bed.
Test holes drilled by Falkirk indicate that it has an average
thickness of approximately 2 1/2 feet. The two lignite beds
are separated by 6 to 12 feet of clay. A layer of clay and
silt underlies the Hagel B bed.
Test holes 146-082-23DCD and 146-082-23DCA were drilled
within the mined area. The spoil material within the mine
site contains varied proportions of clay, sand, and silt,
with a trace of gravel.
HYDROLOGY
Surface-Water Hydrology
Coal Lake is located about 1/4 mile east of the landfill
at an elevation of about 1915 feet MSL (Falkirk Mining
Report, 1990). Coal Lake appears to drain north through Coal
Lake Coulee toward Turtle Lake during periods of high water
table. Coal Lake is recharged by numerous ephemeral streams
along the length of Coal Lake Coulee. Ground-water discharge
provides another source of recharge to Coal Lake.
Wetlands exist along Coal Lake Coulee and in the mine
tailings. A small semi-permanent wetland is located on the
west side of the landfill in the mine tailings that appears
to be at the same elevation as the ground-water. This
wetland may represent a "window" in the water table
16
associated with the upper sand aquifer. The use of the
surface water in the area is generally wildlife habitat
(Falkirk Mining Report, 1990).
Regional Ground-Water Hydrology
Both bedrock and glacial aquifers comprise the regional
ground-water flow system. Bedrock aquifers are located
within the Sentinel Butte and Bullion Creek Formations. The
Underwood sand sequence, within the Sentinel Butte Formation,
consists of sand deposits and is mostly saturated (Falkirk
Report,1990). The Underwood sand is extensive and overlies
the Hagel lignite beds. The aquifer is characterized by a
calcium-magnesium-bicarbonate type water with varying amounts
of sodium. This aquifer discharges into the Coal Lake
Coulee.
The Hagel A and B lignite beds, located in the Sentinel
Butte Formation, appear to be saturated. Discharge from the
Hagel A and B lignite beds occurs along Coal Lake Coulee,
which is hydraulically connected to the Coal Lake Coulee
aquifer. A spring was located northeast of the landfill in a
southeast-trending ravine along the outcrop of the Hagel A
lignite bed (Falkirk Mine Report, 1990). The two Hagel
lignite beds are characterized by calcium-magnesium-
bicarbonate type waters.
The Sheet sand sequence underlies the Hagel beds and is
characterized by a calcium-magnesium-bicarbonate type water
17

with increased sodium and sulfate concentrations. This
sequence discharges into the Coal Lake aquifer.
The Hensler sand sequence is located in the Bullion
Creek Formation and is characterized by a sodium-bicarbonate
type water. The Hensler sand underlies the Sheet sand and
discharges into the Coal Lake aquifer.
The Coal Lake Coulee aquifer is located in Coal Lake
Coulee about 1/4 mile east of the landfill and is a part of
the Turtle Lake aquifer. This aquifer consists of glacial
meltwater deposits with an average thickness of 30 to 40
feet. Ground-water flow in this aquifer is to the north
through the coulee into the Turtle Lake-Lake Nettie aquifer
systems (Falkirk Mine Report, 1990). This aquifer is a
discharge area for the surrounding bedrock aquifers. The
Coal Lake Coulee aquifer is characterized by a calcium-
magnesium-bicarbonate type water.
Local Ground-water Hydrology
Three test holes were drilled at the Missouri River
Sanitation landfill with monitoring wells installed in all
three. In addition, three monitoring wells (one from Falkirk
Mine Corp., and two from Missouri River Sanitation) were used
in evaluating this site. The screens were placed in mine
spoils and in the Hagel lignite layer. Four water-level
measurements were taken over a seven-week period.
18
The uppermost aquifer, throughout most of the landfill
site, is in the mine tailings or Hagel A lignite layer (Fig.
6). Water-level measurements indicate that the direction of
ground-water flow in this aquifer is east-southeast toward
Coal Lake, which may function as a local discharge area (Fig.
5) .
Water Quality
Chemical analyses of water samples are shown in Appendix
E. Well 146-082-23DCD was used as an up-gradient well for
the aquifer in the mine tailings. Water in this well is
characterized by high concentrations of manganese, calcium,
sulfate, and total dissolved solids. These concentrations
appear to be caused by natural weathering of the mine
tailings. Well 146-082-23DCA, also located in the mine
tailings, indicated high concentrations of these major ions
plus high concentrations of magnesium, sodium, and chloride.
This well is located north of the landfill and should not be
affected by the landfill. Monitoring wells located down-
gradient indicated lower concentrations of all major ions as
compared to those associated with the up-gradient wells.
The trace element analyses indicated high concentrations
of strontium in all wells. Strontium concentrations ranged
from 360gg/L to 12,000 gg/L. The highest concentration was
detected in well 146-082-23DCA. Skoustad and Horr (1963, in
Hem, 1989) found median concentrations of strontium for large
19

U.S. public water supplies to be 110 µg/L. Increased
strontium can result from incineration ash, municipal waste
ash, or burning pile ash. Increased concentrations of
strontium can also be a result of the weathering of mine
tailings.
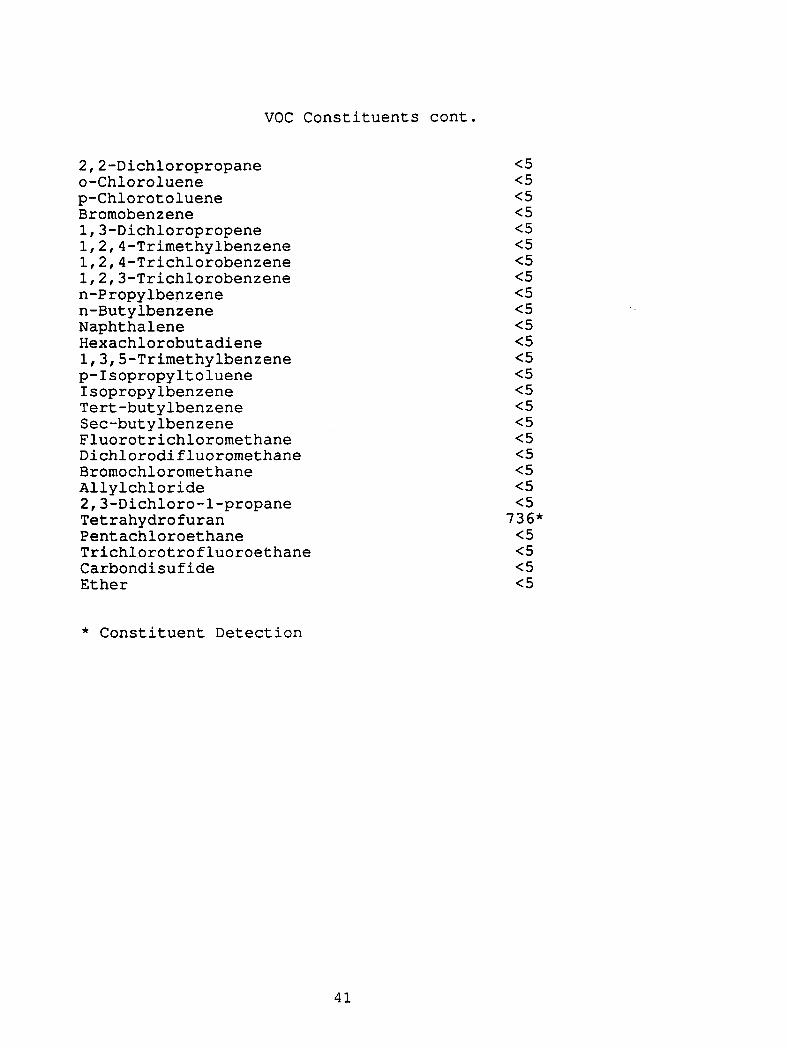
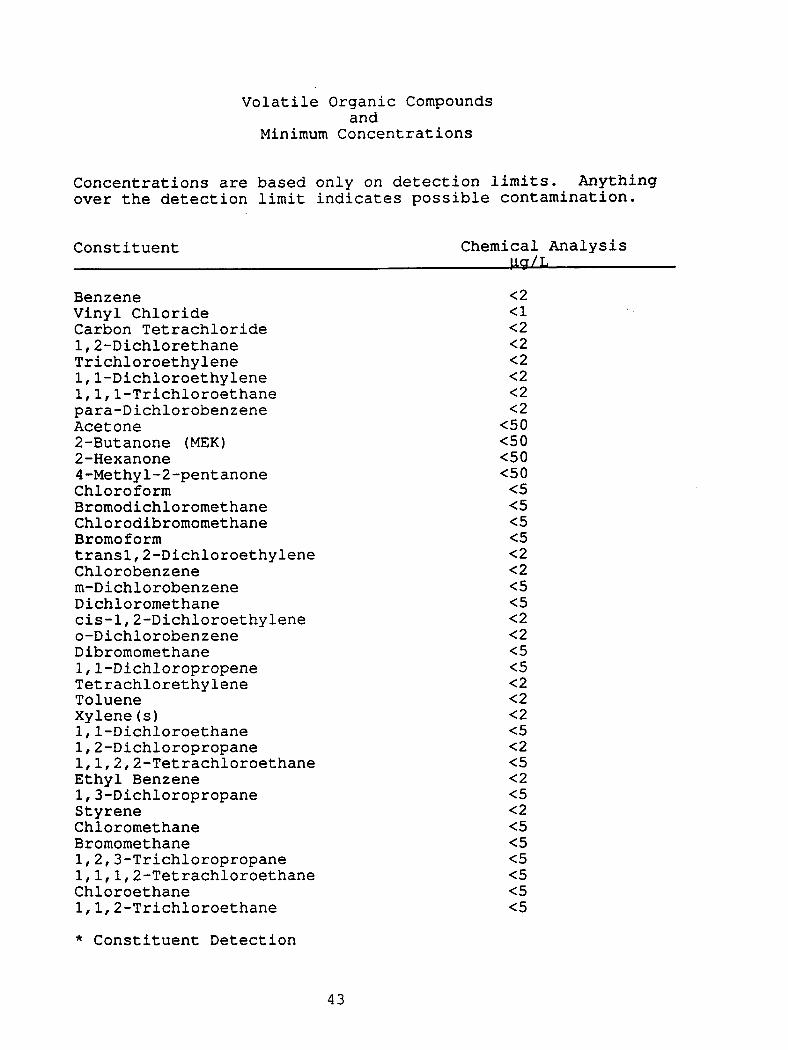
The VOC analyses, from wells 146-082-23DCA and 146-082-
26ABA, are shown in Appendix F and G, respectively. These
analyses indicated concentrations of tetrahydrofuran (736
gg/L and 356 gg/L, respectively). This compound is man-made
and is not found in natural ground waters. Tetrahydrofuran
is used in glues and liquid cements for fabricating packages
and polyvinyl-chloride materials. These detections were from
wells already in place and their construction methods are not
known. These wells may have been constructed using a PVC
cement compound containing tetrahydrofuran. Well 146-082-
23DCA is located outside the area of influence of the
landfill and should not be affected by leachate migration
from the landfill.
CONCLUSIONS
The Missouri River Sanitation landfill is located on the
south side of the abandoned Underwood Coal Company strip
mine. The area surrounding the landfill is covered by a thin
layer of glacial sediments over the pre-existing bedrock
topography. The thickness of the glacial drift is variable
20

across the site and is generally absent east of the landfill
along Coal Lake Coulee. The upper bedrock consists of the
Sentinel Butte and the Bullion Creek Formations. Coal Lake
Coulee is a glacial meltwater channel which apparently
connected the ancestral Knife River with the interglacial
Missouri River Channel.
Coal Lake is located within Coal Lake Coulee and is the
local discharge area for the surrounding bedrock aquifers of
the Sentinel Butte and Bullion Creek Formations. The Coal
Lake Coulee aquifer is a glacial meltwater channel that
underlies Coal Lake Coulee. This aquifer also is a local
discharge area for surrounding bedrock aquifers. The water
quality of the Coal Lake Coulee aquifer in the study area,
ranges from a calcium-magnesium-bicarbonate to a sodium-
bicarbonate type.
The mine tailings are partially saturated at well 146-
082-23DCD. The direction of ground-water flow in the mine
tailings is southeast toward Coal Lake Coulee.
Water quality analyses from the monitoring wells
completed in mine tailings indicated high concentrations of
sulfate, calcium, manganese, and total dissolved solids.
These concentrations appear to be caused by the weathering of
the mine tailings. Strontium was detected in high
concentrations in all the wells. These concentrations also
appear to be the result of weathering of the mine tailings.
Mobilization of major ions and trace elements from the mine
21

tailings may effectively mask input of major ions and trace
elements from the landfill.
The VOC analyses indicated tetrahydrofuran in wells 146-
082-23DCA and 146-082-26ABA. The well completion reports for
these two wells are not known. The wells may have been
constructed using a PVC cement compound containing
tetrahydrofuran. The VOC detections, in this case, may not
suggest leachate migration from the landfill into the
underlying aquifer. Additional study may be needed to
determine the source of the tetrahydrofuran.
Coal Lake Coulee and Coal Lake Coulee aquifer may be
susceptible to leachate migration from the landfill because
they are discharge areas for the surrounding surface and
ground-water systems. The bedrock aquifers do not appear to
be susceptible to leachate migration because of the thick
layer of clay seperating the refuse from the aquifer. Based
on water quality analyses from wells down-gradient, there
does not appear to be any leachate migration from the
landfill.
22

REFERENCES
Bluemle, J.P., 1971, Geology of McLean County, NorthDakota: North Dakota Geological Survey, Bulletin 60,North Dakota State Water Commission, County Ground WaterStudies 19, Part I, 65 p.
Falkirk Mining Company, 1990, Mine Permit Application NAFK-8405.
Hem, J.D., 1989, Study and interpretation of the chemicalcharacteristics of natural water: United StatesGeological Survey Water-Supply Paper 2254, 263 p.
Jacob, A.F., 1976, Geology of the upper part of the FortUnion Group (Paleocene), Williston Basin, withreference to uranium: North Dakota GeologicalSurvey, Report of Investigation No. 58, 49 p.
North Dakota Department of Health, 1986, Water wellconstruction and water well pump installation: Article33-18 of the North Dakota Administrative Code.
Klausing, R.L., 1971, Ground water basic data, McLeanCounty, North Dakota: North Dakota Geological Survey,Bulletin 60, North Dakota State Water Commission,County Ground Water Studies 19, Part II, 468 p.
Klausing, R.L., 1974, Ground-water resources of McLeanCounty, North Dakota: North Dakota Geological Survey,Bulletin 60, North Dakota State Water Commission,County Ground Water Studies 19, Part III, 73 p.
23

APPENDIX A
WATER QUALITY STANDARDSAND
MAXIMUM CONTAMINANT LEVELS
24

Water Quality Standardsand
Maximum Contaminant Levels
MCL (mg/L)color/odor6-8 (optimum)
Field ParametersappearancepHspecific conductancetemperaturewater level
Geochemical Parametersironcalciummagnesiummanganesepotassiumtotal alkalinitybicarbonatecarbonatechloridefluoridenitrate+nitrite (N)sulfatesodiumtotal dissolved solids (TDS)cation/anion balancehardness
Heavy Metals (gg/L)arseniccadmiumleadmolybdenummercuryseleniumstrontium
>0.325-5025-50>0.05
150-200150-2002500.7-1.210300-100020-170>1000
>121 (hard tovery hard)
501050
1002
10
* EPA has not set a MCL for strontium. The medianconcentration for most U.S. water supplies is 110 gg/L(Hem,1989).
25
APPENDIX B
SAMPLING PROCEDURE FORVOLATILE ORGANIC COMPOUNDS
26
SAMPLING PROCEDURE FOR 40ML AMBER BOTTLES
Sample Collection for Volatile Organic Compounds
byNorth Dakota Department of Health
and Consolidated Laboratories
1. Three samples must be collected in the 40m1 bottles thatare provided by the lab. One is the sample and theothers are duplicates.
2. A blank will be sent along. Do Not open this blank andturn it in with the other three samples.
3. Adjust the flow so that no air bubbles pass through thesample as the bottle is being filled. No air should betrapped in the sample when the bottle is sealed. Makesure that you do not wash the ascorbic acid out of thebottle when taking the sample.
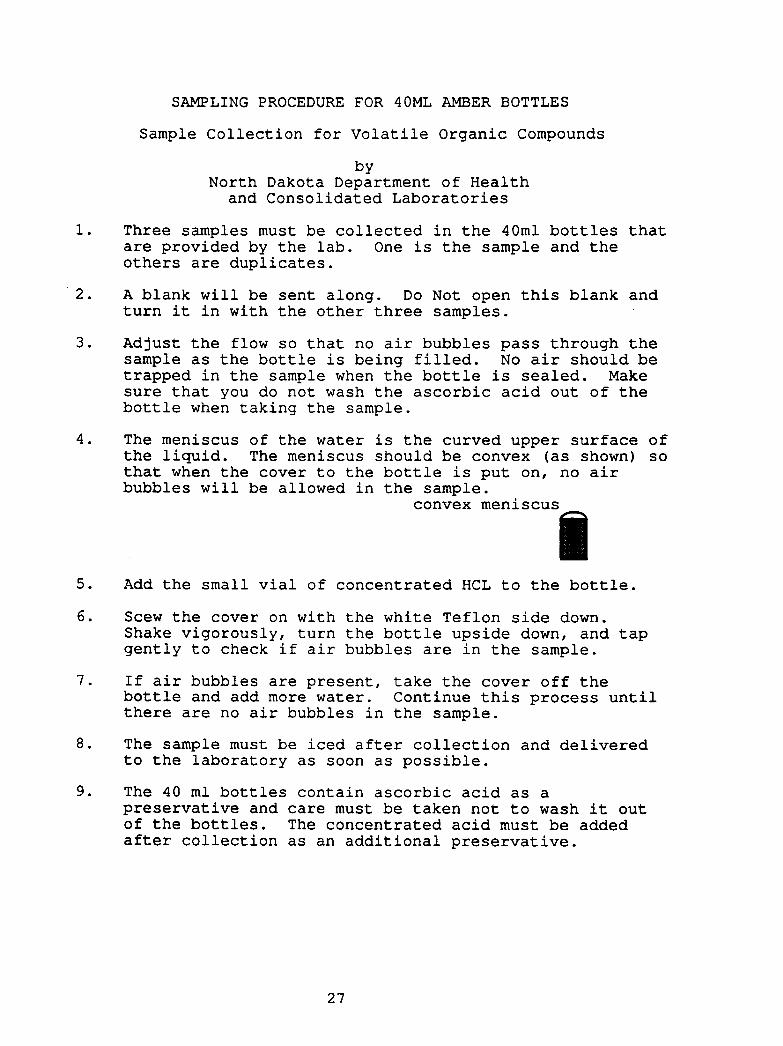
4. The meniscus of the water is the curved upper surface ofthe liquid. The meniscus should be convex (as shown) sothat when the cover to the bottle is put on, no airbubbles will be allowed in the sample.
convex meniscusI5. Add the small vial of concentrated HCL to the bottle.
6. Scew the cover on with the white Teflon side down.Shake vigorously, turn the bottle upside down, and tapgently to check if air bubbles are in the sample.
7. If air bubbles are present, take the cover off thebottle and add more water. Continue this process untilthere are no air bubbles in the sample.
8. The sample must be iced after collection and deliveredto the laboratory as soon as possible.
9. The 40 ml bottles contain ascorbic acid as apreservative and care must be taken not to wash it outof the bottles. The concentrated acid must be addedafter collection as an additional preservative.
27
APPENDIX C
LITHOLOGIC LOGSOF WELLS AND TEST HOLES
28
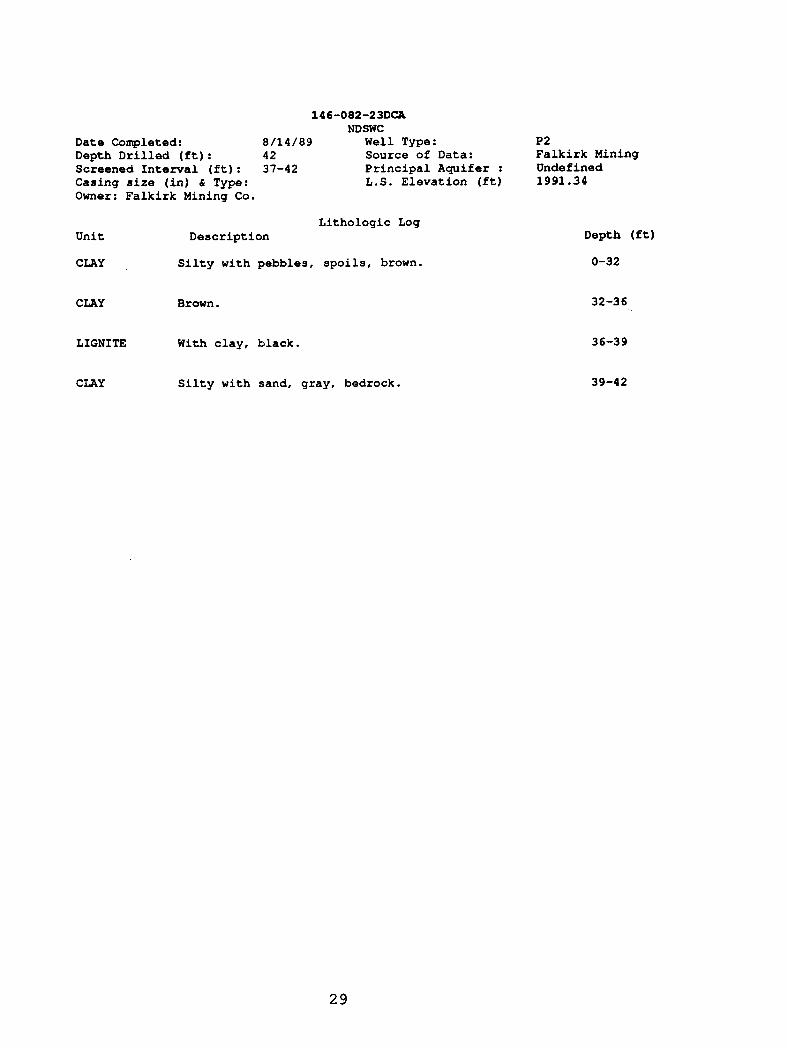
146-082-23DCANDSWC
Well Type:Source of Data:Principal Aquifer :L.S. Elevation (ft)
P2Falkirk MiningUndefined1991.34
Date Completed: 8/14/89Depth Drilled (ft): 42Screened Interval (ft): 37-42Casing size (in) & Type:Owner: Falkirk Mining Co.
Lithologic LogUnit Description
CLAY
Silty with pebbles, spoils, brown.
CLAY
Brown.
LIGNITE
With clay, black.
CLAY
Silty with sand, gray, bedrock.
Depth (ft)
0-32
32-36
36-39
39-42
29
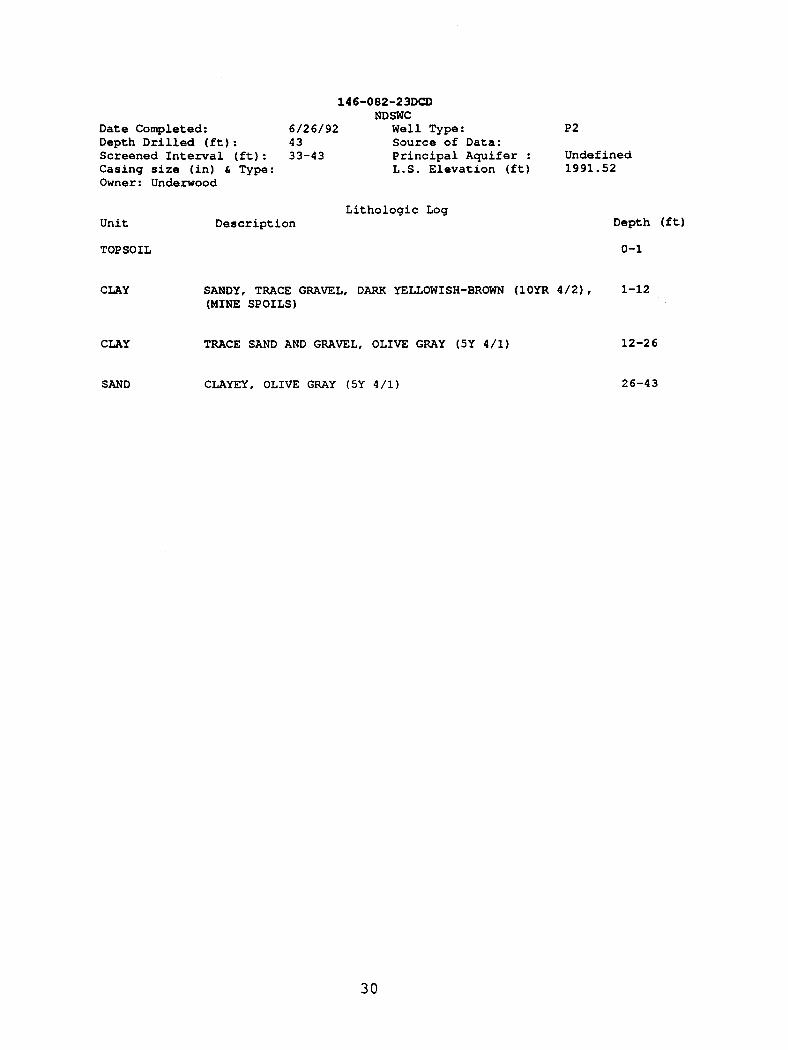
Date Completed:Depth Drilled (ft):Screened Interval (ft):Casing size (in) & Type:Owner: Underwood
6/26/924333-43
146-082-23DCDNDSWC
Well Type: P2Source of Data:Principal Aquifer : UndefinedL.S. Elevation (ft) 1991.52
Lithologic LogUnit Description Depth (ft)
TOPSOIL
0-1
CLAY SANDY, TRACE GRAVEL, DARK YELLOWISH-BROWN (10YR 4/2), 1-12(MINE SPOILS)
CLAY TRACE SAND AND GRAVEL, OLIVE GRAY (5Y 4/1J
12-26
SAND CLAYEY, OLIVE GRAY (5Y 4/1) 26-43
30

146-082-23DDCNDSWC
Date Completed: 6/26/92 Well Type: P2Depth Drilled (ft): 38 Source of Data:Screened Interval (ft): 28-38 Principal Aquifer : UndefinedCasing size (in) & Type: L.S. Elevation (ft) 1979.75Owner: Underwood
Lithologic LogUnit Description Depth (ft)
TOPSOIL 0-1
SAND
FINE-GRAINED, SILTY, MODERATE YELLOWISH-BROWN (10YR 1-85/4J, (SENTINEL BUTTE FORMATION)
CLAY SILTY, TRACE SAND, MODERATE YELLOWISH-BROWN (10YR 5/4) 8-13
CLAY MODERATE YELLOWISH-BROWN (10YR 5/4) 13-20
LIGNITE 20-22
CLAY PALE BROWN (5YR 5/2) 22-23
LIGNITE 23-27
CLAY
WITH INTERBEDDED LIGNITE, PALE BLUE-GREEN (5BG 7/2) 27-38
31

Date Completed:Depth Drilled (ft):Screened Interval (ft):Casing size (in) & Type:Owner: Underwood
146-082-26AABNDSWC
87 Well Type: P2,BRONESKEW DRILL54 Source of Data:49-54 Principal Aquifer : Undefined
L.S. Elevation (ft) 1983.99
Lithologic LogUnit Description
TOPSOIL
CLAY
ROCK
CLAY
LIGNITE
CLAY
Depth (ft)
0-2
2-21
21-23
23-31
31-41
41-54
32
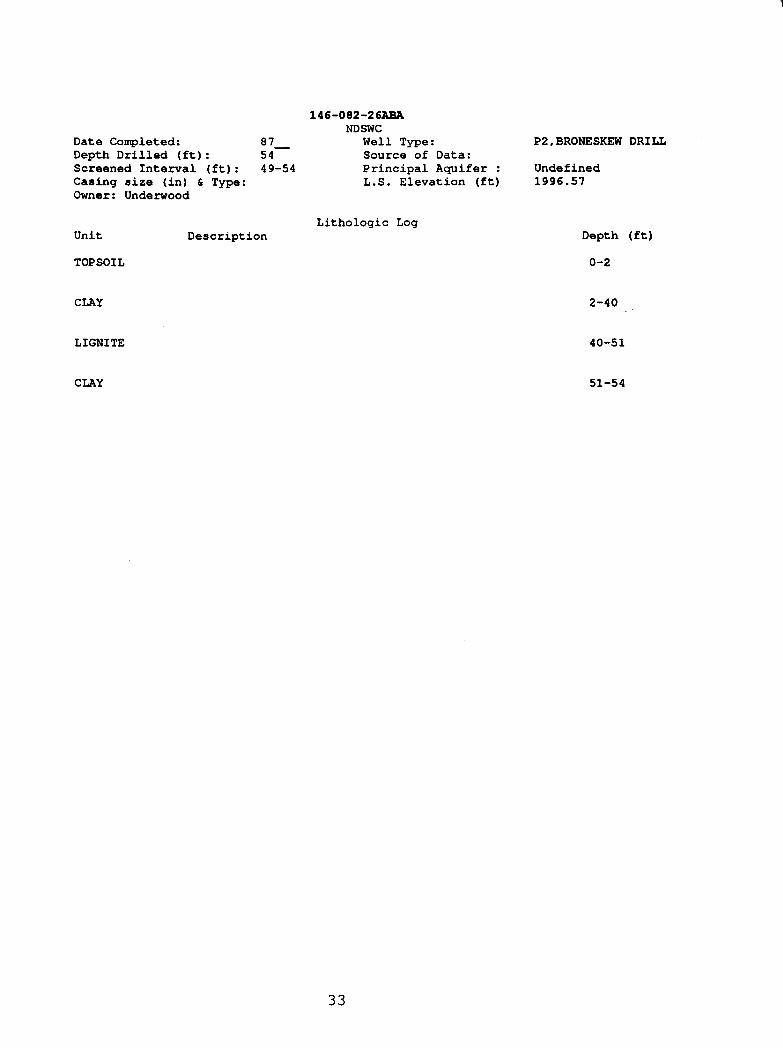
Date Completed:Depth Drilled (ft):Screened Interval (ftJ:Casing size (inJ & Type:Owner: Underwood
146-082-26ABANDSWC
87 Well Type: P2,BRONESKEW DRILL54 Source of Data:49-54 Principal Aquifer : Undefined
L.S. Elevation (ft) 1996.57
Unit Description
TOPSOIL
CLAY
LIGNITE
Lithologic LogDepth (ft)
0-2
2-40
40-51
CLAY
51-54
33

146-082-26ABBNDSWC
Date Completed: 6/26/92 Well Type: P2Depth Drilled (ft): 40 Source of Data:Screened Interval (ft): 30-40 Principal Aquifer : UndefinedCasing size (in) & Type: L.S. Elevation (ft) 1996.79Owner: Underwood
Lithologic LogUnit Description Depth (ft)
TOPSOIL 0-1
GRAVEL SANDY, MODERATE YELLOWISH-BROWN (GLACIAL DRIFT) 1-6
CLAY SILTY, TRACE GRAVEL, DARK YELLOWISH-BROWN 6-17
SAND MEDIUM-GRAINED, MODERATE YELLOWISH-BROWN (10YR 4/4J, 17-22(SENTINEL BUTTE FORMATION)
SAND MEDIUM-GRAINED, CLAYEY, MODERATE YELLOWISH-BROWN 22-30(10YR 5/4).
CLAY SANDY, OLIVE GRAY (5Y 4/1), DAMP 30-36
LIGNITE 36-40
34

APPENDIX D
WATER-LEVEL TABLES
35
Date
30.68 1960.661960.8130.53
WL Elev(msl, ft)
1960.931960.92
Date
30.97 1960.551960.4631.06
WL Elev(msl, ft)
1961.081960.86
DateWL Elev(msl, ft)
LS Elev (msl,ft)=1991.34SI (ft.)=37-42
Depth to WL ElevWater (ft) (msl, ft)
08/11/9208/24/92
LS Elev (msl,ft)=1991.52ST (ft.)=33-43
Depth to WL ElevWater (ft) (msl, ft)
08/11/9208/24/92
LS Elev (msl,ft)=1979.75ST lft.1=78-38
Depth to WL ElevWater (ft) (msl, ft)
146-082-23DCAUndefined Aquifer
Depth toDate Water (ft)
07/10/92 30.4107/28/92 30.42
146-082-23DCDUndefined Arrl fer
Depth toDate Water (ftJ
07/08/92 30.4407/28/92 30.66
146-082-23DDCUndefined Arypifer
Depth toDate Water (ft)
08/11/9208/24/92
1976.461976.87
20.3319.92
146-082-26ABBUndefined Aquifer
Depth toDate Water (ft)
07/08/92 21.5307/28/92 20.78
WL Elev(msl, ft)
1975.261976.01
Date
LS Elev (msl,ft)=1996.79SI (ft.)=30-40
Depth to WL ElevWater (ft) (msl, ft)
Missouri River Sanitation Water Levels7/8/92 to 8/24/92
07/09/92 24.33 1955.42 08/11/92 23.32 1956.4307/10/92 23.23 1956.52 08/24/92 23.36 1956.3907/28/92 23.28 1956.47
146-082-26AAB
LS Elev (msl,ft)=1983.99Undefined Aquifer SI (ft.)=49-54
Depth to WL Elev Depth to WL ElevDate Water (ft)
(msl, ft)
Date Water (ft) (msl, ft)
07/09/92
27.38
1956.61
08/11/92 27.57
1956.4207/28/92
27.50
1956.49
08/24/92 27.47
1956.52
146-082-26ABA
LS Elev (msl,ft)=1996.57Undefined Arrifpr SI (ft.1-49-54
Depth to WL Elev Depth to WL ElevDate Water (ft)
(msl, ft)
Date Water (ft) (msl, ft)
07/10/92 39.52
1957.05
08/11/92
39.57
1957.0007/28/92 39.56
1957.01
08/24/92
39.59
1956.98
36

APPENDIX E
MAJOR ION AND TRACE-ELEMENTCONCENTRATIONS
37

Missouri River Sanitation Water Quality
Major Ions Analyses
Screened I4 (milligrams per liter) 'Spec
Interval Date Hardness as 9 Cond Temp
Location (ft) Sampled 5102Fe Phn Ca Mg Na K HCO3 CO3 SO4CI F NO3 B TDS CaCO
3NCH Na SAR (limbo) (-C) pH
146-082-23DCA 37-42 07/10/92 17 0.07 1.5 560 330 230 20 634 0 2500 230 0.1 0 0.44 4200 2800 2200 15 1.9 4590 20 7.76
146-082-23DCD 33-43 07/08/92 21 0.2 1.1 290 140 24 23 764 0 730 3.1 0.1 1.7 0.21 1610 1300 670 4 0.3 2100 17 7.67
146-082-2300C 28-38 07/09/92 17 0.08 0.56 160 76 44 9.4 607 0 300 81 0.1 3.4 0.25 991 710 210 12 0.7 1521 14 6.52
146-082-26AAB 49-54 07/09/92 15 0.03 0.28 100 46 18 6 430 0 170 14 0.1 1.3 0.18 583 440 86 8 0.4 924 16 7.52
146-082-26ABA 49-54 07/10/92 16 0.07 0.31 140 58 27 8.5 562 0 210 39 0.1 1.5 0.28 778 590 130 9 0.5 1202 12 6.91
146-082-26A0B 30-40 07/08/92 17 0.02 0.14 67 24 4 341 0 11 2 0.2 0.1 0.05 301 270 3 0.1 499 14 7.88
Trace Element Analyses
DateLocation
Sampled Selenium Lead Cadmium Mercury Arsenic Molybdenum Strontium (micrograms per liter)
145-082-230CA 7/10/92 2 0 0 0 8 11 12000
146-082-230CD 7/8/92 1 0 0 0 6 0 2600
146-082-23DDC 7/9/92 0 0 0 0 6 1 3500
145-082-26AAB 7/9/92 1 0 0 0 3 0 2000
145-082-26ABA 7/10/92 0 0 0 0 5 0 2700
145-082-26ABB 7/8/92 0 0 0 0 2 3 360

APPENDIX F
VOLATILE ORGANIC COMPOUNDSFOR WELL 146-082-23DCA
39
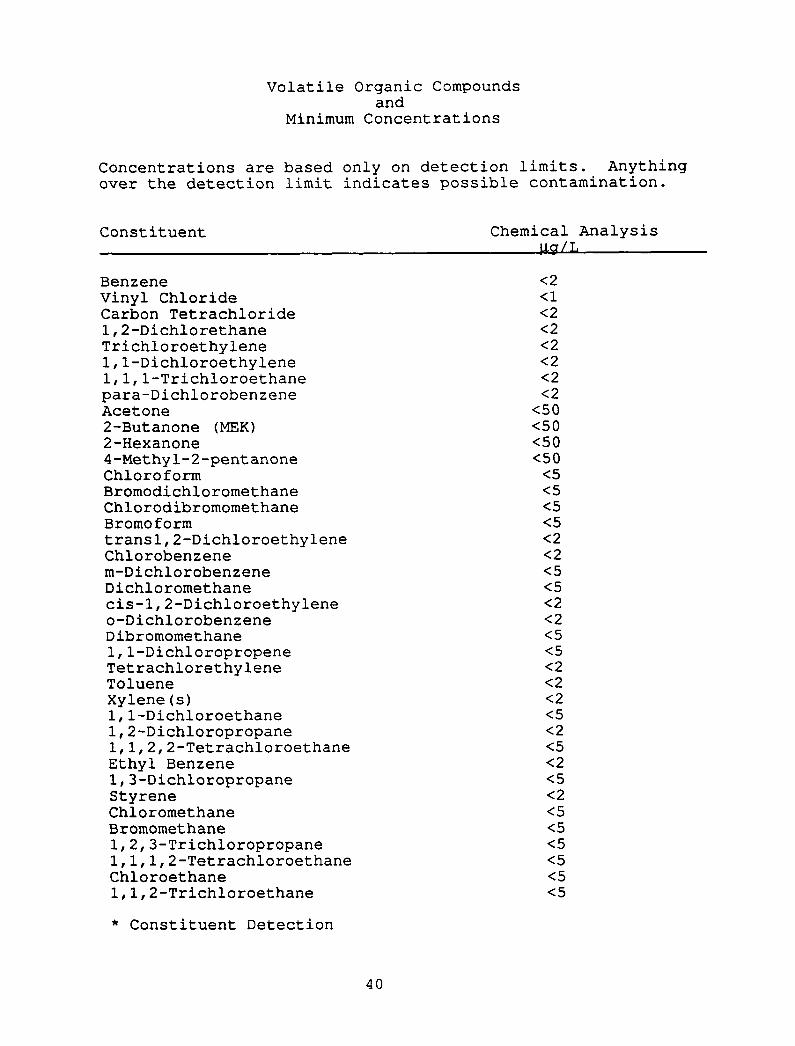
Volatile Organic Compoundsand
Minimum Concentrations
Concentrations are based only on detection limits. Anythingover the detection limit indicates possible contamination.
Constituent Chemical Analysis14/L
Benzene <2Vinyl Chloride <1Carbon Tetrachloride <21,2-Dichlorethane <2Trichloroethylene <21,1-Dichloroethylene <21,1,1-Trichloroethane <2para-Dichlorobenzene <2Acetone <502-Butanone (MEK) <502-Hexanone <504-Methyl-2-pentanone <50Chloroform <5Bromodichloromethane <5Chlorodibromomethane <5Bromoform <5trans1,2-Dichloroethylene <2Chlorobenzene <2m-Dichlorobenzene <5Dichloromethane <5cis-1,2-Dichloroethylene <2o-Dichlorobenzene <2Dibromomethane <51,1-Dichloropropene <5Tetrachiorethylene <2Toluene <2Xylene(s) <21,1-Dichloroethane <51,2-Dichloropropane <21,1,2,2-Tetrachloroethane <5Ethyl Benzene <21,3-Dichloropropane <5Styrene <2Chloromethane <5Bromomethane <51,2,3-Trichloropropane <51,1,1,2-Tetrachloroethane <5Chloroethane <51,1,2-Trichloroethane <5
* Constituent Detection
40
VOC Constituents cont.
2,2-Dichloropropane <5o-Chloroluene <5p-Chlorotoluene <5Bromobenzene <51,3-Dichloropropene <51,2,4-Trimethylbenzene <51,2,4-Trichlorobenzene <51,2,3-Trichlorobenzene <5n-Propylbenzene <5n-Butylbenzene <5Naphthalene <5Hexachlorobutadiene <51,3,5-Trimethylbenzene <5p-Isopropyltoluene <5Isopropylbenzene <5Tert-butylbenzene <5Sec-butylbenzene <5Fluorotrichloromethane <5Dichlorodifluoromethane <5Bromochloromethane <5Allylchloride <52,3-Dichloro-l-propane <5Tetrahydrofuran 736*Pentachloroethane <5Trichlorotrofluoroethane <5Carbondisufide <5Ether <5
* Constituent Detection
41
APPENDIX G
VOLATILE ORGANIC COMPOUNDSFOR WELL 146-082-26ABA
42
Volatile Organic Compoundsand
Minimum Concentrations
Concentrations are based only on detection limits. Anythingover the detection limit indicates possible contamination.
Constituent Chemical Analysisg/L
Benzene <2Vinyl Chloride <1Carbon Tetrachloride <21,2-Dichlorethane <2Trichloroethylene <21,1-Dichloroethylene <21,1,1-Trichloroethane <2para-Dichlorobenzene <2Acetone <502-Butanone (MEK) <502-Hexanone <504-Methyl-2-pentanone <50Chloroform <5Bromodichloromethane <5Chlorodibromomethane <5Bromoform <5trans1,2-Dichloroethylene <2Chlorobenzene <2m-Dichlorobenzene <5Dichioromethane <5cis-1,2-Dichloroethylene <2o-Dichlorobenzene <2Dibromomethane <51,1-Dichloropropene <5Tetrachlorethylene <2Toluene <2Xylene(s) <21,1-Dichloroethane <51,2-Dichloropropane <21,1,2,2-Tetrachloroethane <5Ethyl Benzene <21,3-Dichloropropane <5Styrene <2Chioromethane <5Bromomethane <51,2,3-Trichloropropane <51,1,1,2-Tetrachloroethane <5Chloroethane <51,1,2-Trichloroethane <5
* Constituent Detection
43

VOC Constituents cont.
2,2-Dichloropropane <5o-Chloroluene <5p-Chlorotoluene <5Bromobenzene <51,3-Dichloropropene <51,2,4-Trimethylbenzene <51,2,4-Trichlorobenzene <51,2,3-Trichlorobenzene <5n-Propylbenzene <5n-Butylbenzene <5Naphthalene <5Hexachlorobutadiene <51,3,5-Trimethylbenzene <5p-Isopropyltoluene <5Isopropylbenzene <5Tert-butylbenzene <5Sec-butylbenzene <5Fluorotrichloromethane <5Dichlorodifluoromethane <5Bromochloromethane <5Allylchloride <52,3-Dichloro-l-propane <5Tetrahydrofuran 356*Pentachloroethane <5Trichlorotrofluoroethane <5Carbondisufide <5Ether <5
* Constituent Detection