site-specific fish tissue mercury at four ... 2008 – final report site-specific fish tissue...
TRANSCRIPT
January 2008 – Final Report
SITE-SPECIFIC FISH TISSUE MERCURY AT FOUR EASTERN NORTH CAROLINA NATIONAL WILDLIFE REFUGES
U.S. Fish and Wildlife Service Raleigh, NC
Columbia, NC Swanquarter, NC
Manteo, NC Wadesboro, NC
N.C. Division of Water Quality
Raleigh, NC
N.C. Wildlife Resources Commission Raleigh, NC
USFWS

ii
PREFACE
To assess fish tissue mercury concentrations in species commonly consumed on eastern North Carolina National Wildlife Refuges, the U.S. Fish and Wildlife Service partnered with the North Carolina Division of Water Quality and the North Carolina Wildlife Resources Commission. This work was coordinated by Sara Ward (Ecologist / Environmental Contaminant Specialist) in the U.S. Fish and Wildlife Service Raleigh Field Office and was funded by the U.S. Fish and Wildlife Service’s Environmental Contaminants Program (project number 200440001). The cooperation of Refuge Managers, Assistant Managers, and biologists at eastern North Carolina refuges guided the sampling strategy. Field sampling assistance was provided by biologists from each of the partnering agencies; their assistance is also appreciated. Analytical chemistry for the project was performed by Laboratory and Environmental Testing, Inc. (Columbia, MO) and the North Carolina Division of Water Quality Laboratory Section (Raleigh, NC). This final report was prepared addressing comments received on an earlier draft from the NC Division of Water Quality’s Bioassessment Unit and Laboratory Sections, NC Wildlife Resources Commission and Refuge Managers. Dr. W. Gregory Cope, aquatic toxicologist (NC State University, Department of Environmental & Molecular Toxicology), also provided comments that improved the report. Additional questions, comments, and suggestions related to this final report are encouraged. Inquires can be directed to the U.S. Fish and Wildlife Service at the following address:
Sara Ward U.S. Fish and Wildlife Service
Raleigh Ecological Services Field Office P.O. Box 33726
Raleigh, NC 27636-3726
Suggested citation: Ward, SE. 2008. Site-Specific Fish Tissue Mercury at Four Eastern North Carolina National Wildlife Refuges. Final Report. U.S. Fish and Wildlife Service. USFWS, Raleigh, NC.

iii
ABSTRACT
Mercury concentrations above levels of concerns in fish tissue have prompted the North Carolina Division of Public Heath to issue a consumption advisory for several species of freshwater fish in eastern North Carolina. Historic fish tissue data collected by the North Carolina Division of Water Quality and the U.S. Fish and Wildlife Service from eastern North Carolina National Wildlife Refuges (NWRs) documented mercury concentrations at or above levels of concern for public consumption in a few fish species (e.g., largemouth bass). Other game species have not been frequently sampled (e.g., crappie, flier, and bluegill). Based on this concern, updated information on the mercury concentration in important recreational fish species was collected to inform refuge fisheries management. Between 2004 and 2006, 305 fillet and 18 whole body fish samples were collected from Alligator River, Mattamuskeet, Pocosin Lakes, and Pee Dee NWRs. Mercury concentrations in fish fillets indicate that catfish (geometric mean = 0.16 ppm-ww; range 0.01 to 0.99 ppm-ww) and sunfish (geometric mean = 0.18 ppm-ww; range 0.03-0.46 ppm-ww) species are generally below the state action level for issuing public health consumption advisories. Half of the perch (geometric mean = 0.33 ppm-ww; range 0.13-0.67 ppm-ww) and 84 percent of largemouth bass (geometric mean = 0.57 ppm-ww; range 0.03-1.6 ppm-ww) fillets exceeded human consumptive levels of concern. In addition to the State fish consumption advisory, our data would support species-specific fish size thresholds for refuge waters to minimize health risks of mercury exposure for the general public for bluegill (eat fish smaller than 36 cm total length) and largemouth bass (eat fish smaller than 21 cm total length). Because bluegill rarely exceed 36 cm in length, most individuals caught on refuges are safe to eat. This is consistent with the State’s fish consumption advice. The current legal size limit for largemouth bass (of 35.6 cm) precludes consumption of small individuals with lower mercury levels in refuge waters; only catch and release fishing or limited consumption (consistent with the State’s advisory: http://www.epi.state.nc.us/epi/fish/safefish.html) for this species is advised. The toxicological significance of fish tissue mercury residues to piscivorous birds was also evaluated. Mercury concentrations measured in whole fish frequently exceeded levels reported to adversely affect sensitive avian species. Estimates of whole fish mercury concentrations (based on fillet mercury residues) also frequently (84 percent) exceeded avian dietary toxicity thresholds. A comprehensive wildlife risk assessment could be performed with dietary input modeling and site specific exposure assessment.

iv
TABLE OF CONTENTS
PREFACE…………………………………………………………………………………………ii ABSTRACT……………………………………………………………………………………...iii LIST OF TABLES AND FIGURES……………………………………………………………...v LIST OF ACRONYMS/ABBREVIATIONS………………………………………………….…vi INTRODUCTION………………………………………………………………………………...1 METHODS………………………………………………………………………………………..2 RESULTS AND DISCUSSION…………………………………………………………………10 MANAGEMENT RECOMMENDATIONS…………………………………………………….23 REFERENCES…………………………………………………………………………………..24 Appendix…………………………………………………………………………………………27

v
LIST OF TABLES AND FIGURES
Tables 1. Concentrations of mercury in fish fillets at Alligator River NWR, 2005 ………………….11 2. Concentrations of mercury in fish fillets at Mattamuskeet NWR, 2004……………………12 3. Concentrations of mercury in fish at Pocosin Lakes NWR, 2004-2006……………………13 4. Concentrations of mercury in fish at Pee Dee NWR, 2004…………………………………14 5. Comparison of historic and present fish fillet mercury concentrations for species collected
from waters on or adjacent to three National Wildlife Refuges……………………………..20 Figures 1. Reference map for National Wildlife Refuges where fish mercury sampling was
conducted……………………………………………………………………………………..3 2. Alligator River National Wildlife Refuge fish collection sites……………………………….4 3. Mattamuskeet National Wildlife Refuge fish collection sites………………………………..5 4. Pocosin Lakes National Wildlife Refuge fish collection sites………………………………..6 5. Pee Dee National Wildlife Refuge fish collection sites………………………………………7 6 Relationship of tissue mercury concentration (ppm-ww) to fish length (cm) for bluegill
(Lepomis macrochirus) collected from North Carolina National Wildlife Refuges………...14 7. Relationship of tissue mercury concentration (ppm-ww) to fish length (cm) for largemouth
bass (Micropterus salmoides) collected from North Carolina National Wildlife Refuges….15 8. Relationship of tissue mercury concentration (ppm-ww) to fish length (cm) for species in the
family Ictaluridae (catfish) from North Carolina National Wildlife Refuges………………16 9. Relationship of tissue mercury concentration (ppm-ww) to fish length (cm) for species in the
family Centrarchidae (sunfish) from North Carolina National Wildlife Refuges…………..16 10. Relationship of tissue mercury concentration (ppm-ww) to fish length (cm) for species in the
family Percidae (perches) from North Carolina National Wildlife Refuges………………..17 11. Average estimated whole body mercury concentration in fish species collected from four
North Carolina National Wildlife Refuges…………………………………………………..21
vi
LIST OF ACRONYMS/ABBREVIATIONS
cm centimeter FDA U.S. Food and Drug Administration LET Laboratory and Environmental Testing, Inc. LDL lower detection limit LOAEL lowest observed adverse effect level mg/kg milligram per kilogram NADP National Atmospheric Deposition Program NCDHHS North Carolina Division of Health and Human Services NCDPH North Carolina Division of Public Health NCDWQ North Carolina Division of Water Quality NCWRC North Carolina Wildlife Resources Commission NWR National Wildlife Refuge NOAEL no observed adverse effect level ppm part per million PACF Patuxent Analytical Control Facility Service U.S. Fish and Wildlife Service USEPA U.S. Environmental Protection Agency ww wet weight

1
Site-Specific Fish Tissue Mercury at Four Eastern North Carolina National Wildlife Refuges Introduction Mercury distribution nationwide can be attributed to a variety of natural (e.g., mercury deposits in certain geologic formations and soil types) and anthropogenic sources (e.g., fossil fuel combustion, solid waste incineration). Global mercury cycling is controlled by volatilization to the atmosphere from various sources, distribution via climactic patterns, and redeposition on land and surface water (USEPA 2001). All waters of the eastern U.S. are subject to continuous mercury loading through atmospheric deposition (USEPA 2001). Mercury accumulation in fish and wildlife has been documented as a concern for the waters of eastern North Carolina, including those in the areas where four national wildlife refuges (NWRs), Mattamuskeet, Pocosin Lakes, Alligator River, and Pee Dee NWRs, support recreational fisheries. Environmental conditions in eastern North Carolina favor accumulation of mercury via wet and dry deposition. Deposited mercury preferentially binds to the highly organic soil types found in the eastern portion of the State creating a mercury sink for historic and current mercury deposits (McDonald et al. 1983; Zillioux et al. 1993). Pee Dee NWR is located in the Yadkin-Pee Dee River Basin where elevated mercury levels in fish have been documented upstream and downstream of the refuge (NCDWQ 1998; NCDWQ 2001). Mattamuskeet, Pocosin Lakes, and Alligator River NWRs are situated between the Albemarle and Pamlico Sounds and are all underlain by peat soils. Historically ditched and drained, this hydrologic modification has artificially lowered the groundwater table promoting soil oxidation and providing a pathway for mercury mobilized from peat soils to enter down-gradient surface waters. Exceedances of water quality standards for mercury have been demonstrated in the waters draining peat soils subjected to ditching and draining, or other processes promoting oxidation (Environmental Sciences and Engineering, Inc. 1982; Hinesley and Wicker 1997). Given the enhanced binding and storage of mercury in eastern North Carolina and the tendency for methylmercury to biomagnify in progressively higher trophic levels, mercury accumulation in fish and wildlife resources is a documented concern (Benkert 1990, 1992; Cunningham et al. 1992; Augspurger and Looney 1995; Hinesley and Wicker 1997). Among the most common concerns are sediment mercury concentrations which exceed screening values (Long and Morgan 1990) for adverse effects to ecological receptors (Cunningham et al. 1992) and exceedances of North Carlina’s ambient water quality standard for mercury of 12 ng/l (NCDWQ 1998; Hinesley and Wicker 1997). Slightly elevated mercury concentrations in piscivorous birds have also been documented (Augspurger and Looney 1995). In recognition of mercury concentrations above levels of concern, the North Carolina Division of Public Heath (NCDPH) has issued a consumption advisory for freshwater fish species including bowfin (Amia calva), warmouth (Lepomis gulosus), chain pickerel (Esox niger), and catfish species caught in eastern North Carolina south and east of Interstate 85. Restricted consumption of largemouth bass (Micropterus salmoides) caught statewide is also advised (NCDHHS 2006). The North Carolina Division of Water Quality (NCDWQ) Biological Assessment Unit has

2
previously documented mercury levels exceeding either the U.S. Environmental Protection Agency (USEPA) screening value (USEPA 2000) of 0.4 parts per million (ppm), USEPA methylmercury fish tissue criterion of 0.3 ppm (USEPA 2001b), or the Food and Drug Administration (FDA) Action Level of 1 ppm (USFDA 1998) in several fish samples collected in waters on Pocosin Lakes and Mattamuskeet NWRs (NCDWQ 2007). Prior to this assessment, waters on Pocosin Lakes NWR were last sampled by NCDWQ in 1995 (Lake Phelps) and 1986 (Pungo and New Lakes) while Mattamuskeet NWR was most recently sampled in 1997. The U.S. Fish and Wildlife Service (Service) has also documented mercury levels in fish tissue exceeding the FDA action level (Looney and Augspurger 1992). These historic data indicated a contaminant threat to refuge resources and public health, and updated mercury measurements were desired to inform refuge fisheries management. Accordingly, the Service coordinated an effort to determine mercury concentrations in edible portions of commonly consumed fish species at the most popular fishing locations on refuges. Mercury results were compared to published screening values to identify sites where commonly consumed fish species are contaminated (and may present health risks to the public and to trust resources) and areas where these fish species are considered safe for consumption. This report documents our assessment of mercury levels in fish species collected from four refuges. Methods Sample Site Description Four refuges (Alligator River, Mattamuskeet, Pocosin Lakes, and Pee Dee NWRs) were selected for participation in the study based on several factors including: 1) previously documented mercury issues and 2) the prevalence of public recreational fishing. Refuge staff input guided target species identification (locally-important recreational fish species) and selection of three to four sample sites routinely used for recreational fishing on each refuge. A reference map illustrating the four refuges sampled is shown in Figure 1; Figures 2 through 5 depict the sampling locations on each refuge. Sampling sites at Alligator River NWR included Sawyer Lake and South Lake. Initially proposed sampling locations at the refuge included canals adjacent to US Highway 64, the farm field canal, the pump station pool area, and Laurel Bay Lake; however, collection from these sites was not possible for a variety of reasons. At the pump station and farm field sites, access via a small electrofishing boat was not possible. Entry to Laurel Bay Lake was also restricted for boat access due to excessive growth of alligator weed (Alternanthera philoxeroides). Collection in U.S. Highway 64 canals was attempted on several occasions; however, insufficient numbers of samples were obtained. Although recreational fishing activity at Sawyer Lake is less significant than at the originally proposed locations, hydrologic connectivity to Milltail Creek, which traverses the refuge from its origin near the Dare County Bombing Range northwest to its confluence with Alligator River, makes characterization of mercury from this site meaningful for interpretation of risks to a larger area. South Lake, an embayment of Albemarle Sound, lies in the northern portion of the refuge and was selected as an alternate collection site based on its hydrologic connection to the U.S. Highway 64 canals.

3
[�
[�Raleigh
Charlotte
Pee Dee NWR
Pocosin Lakes NWR
Mattamuskeet NWR
Alligator River NWR
1
2
34
5
Legend
Refuges Sampled
County Boundaries
Major Hydrography
Corresponding Fig. No.0 50 100 150 20025
Miles −
Collection sites at Mattamuskeet NWR included Rose Bay Canal (located at the southwest corner of Lake Mattamuskeet), the causeway culverts along Highway 94 (traversing the center of the lake), West Main Canal (a drainage feature lying near the central southern portion of Lake Mattamuskeet that is hydrologically connected to Outfall Canal and the open water portion of Lake Mattamuskeet via Central Canal), and Sandy Dike access to Lake Mattamuskeet (located west of Highway 94 just north of marsh impoundment #3). Marsh impoundment #11, although originally targeted for sampling, was not sampled due to low water levels. Fish sampling at Pocosin Lakes NWR was attempted at three (out of four) of the collection locations originally proposed by refuge staff (Pungo Lake, Smartweed Canal, and Phelps Lake); however, based on limited catch success at Pungo Lake (a dystrophic system characterized by low pH conditions and highly tannic waters), sampling efforts at New Lake (a system with similar water quality conditions and productivity) were abandoned. Rather, sampling was conducted at two additional sites where recreational fishing is popular: Scuppernong River (in the vicinity of the refuge headquarters’ interpretive boardwalk) and Frying Pan (an embayment of Alligator River surrounded by conservation ownership, including the refuge). Sampling in Smartweed Canal (a shallow canal located west of Pungo Lake along West Lake Road) was limited to gill netting because access with shocking equipment was not possible. Sampling in Lake Phelps, a shallow 16,600-acre lake that abuts the refuge, occurred via shocking boats on multiple occasions. Substrates in Lake Phelps include sand and peat material; however, unlike nearby Pungo and New Lakes, the surface water is clear and has a relatively higher pH. Figure 1. Reference map for National Wildlife Refuges where fish mercury sampling was conducted. Highlighted boxes denote areas illustrated in greater detail in subsequent maps.

4
South Lake
Sawyer Lake
US-64
US-264
0 1 2 3 40.5
Miles
−
Albemarle Sound
ALLIGATOR RIVER
NATIONAL WILDLIFE REFUGE
0 1 2 3 40.5
Kilometers
S. Ward, USFWS 10/23/07
Primary Roads
Hydrography
National Wildlife Refuge
Fish Collection Site
Figure 2. Alligator River National Wildlife Refuge fish collection sites.

5
Causeway
West Main CanalSandy Dike
Rose Bay Canal
NC
-94
US-264
US-264
0 1 2 3 40.5
Miles
−
Pamlico Sound
MATTAMUSKEET
NATIONAL WILDLIFE REFUGE
0 1 2 3 40.5
Kilometers
S. Ward, USFWS 10/23/07
Primary Roads
Hydrography
National Wildlife Refuge
Fish Collection Site
Figure 3. Mattamuskeet National Wildlife Refuge fish collection sites.

6
Frying Pan
Scuppernong River
Lake Phelps
Pungo Lake
Smartweed Canal
US-64
NC
-94
NC-45
NC
-99
NC-308
US-
64 US-64
US-64
NC
-94
0 2.5 5 7.5 101.25
Miles
−
Albemarle Sound
POCOSIN LAKES
NATIONAL WILDLIFE REFUGE
0 2.5 5 7.5 101.25
Kilometers
S. Ward, USFWS 10/23/07
Primary Roads
Hydrography
National Wildlife Refuge
Fish Collection Site
Figure 4. Pocosin Lakes National Wildlife Refuge fish collection sites.
7
Sullivan Pond
Ross Pond
US
-52
NC
-109
0 0.25 0.5 0.75 10.125
Miles
−
Brown Creek
PEE DEE
NATIONAL WILDLIFE REFUGE
0 0.25 0.5 0.75 10.125
Kilometers
S. Ward, USFWS 10/23/07
Primary Roads
Hydrography
National Wildlife Refuge
Fish Collection Site
Pee Dee River
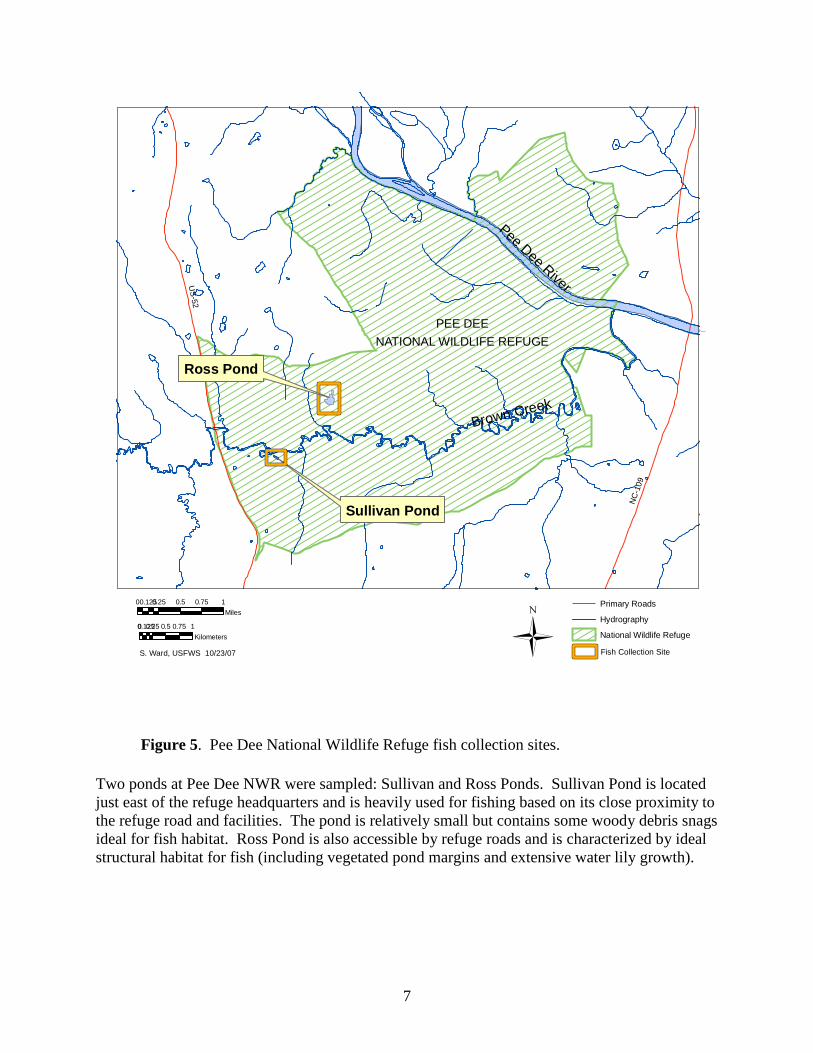
Figure 5. Pee Dee National Wildlife Refuge fish collection sites.
Two ponds at Pee Dee NWR were sampled: Sullivan and Ross Ponds. Sullivan Pond is located just east of the refuge headquarters and is heavily used for fishing based on its close proximity to the refuge road and facilities. The pond is relatively small but contains some woody debris snags ideal for fish habitat. Ross Pond is also accessible by refuge roads and is characterized by ideal structural habitat for fish (including vegetated pond margins and extensive water lily growth).

8
Fish Collection and Processing The sampling protocol is based on NCDWQ standard operating procedures for fish tissue collection and processing and current USEPA guidance for fish sampling and contaminant analysis (NCDWQ 2006; USEPA 2000). Three distinct ecological groups of finfish, bottom-feeders (e.g., a catfish species), mid-trophic level species (e.g., sunfish) and predators (e.g., largemouth bass) were targeted for collection on all refuges included in the study. Our selection of target species representing different trophic levels was attempted to evaluate a variety of habitats, feeding strategies, and physiological factors that might result in differences in mercury bioaccumulation. Additional target species identified for the project included white perch (Morone americana), yellow perch (Perca flavescens), black crappie (Pomoxis nigromaculatus), a prevalent sunfish species such as bluegill (Lepomis macrochirus) or pumpkinseed (Lepomis gibbosus), and chain pickerel (Esox niger) (Alligator River NWR only). The specific combination of the target species collected on each refuge was determined by trophic levels and information regarding the most commonly consumed fish. Ten individual fish samples were desired for each target species at each sampling site based on EPA guidance for use of individual samples in monitoring fish contaminant levels (USEPA 2000). That guidance indicates that a sample size of ten or fewer fish should be used only if the ratio of the standard deviation of mercury concentrations within a given fish population (estimated from historic data) to the desired minimum detectable difference between the screening value and the mean mercury concentration for the population is 0.85 or less. Estimates from historic NCDWQ data, a recommendation from the NCDWQ Environmental Sciences Section, and advice from our peer review supported the selected sample size. Boat-mounted electrofishing units were used as the preferred fish collection method. When sufficient numbers of target species were not achieved using this approach (or environmental conditions did not support this method), alternative fish collection methods (e.g., trap nets, gill nets, hook and line) were employed in attempt to meet the targeted sample size. During collections performed using electrofishing or trap nets, fish were stored in a live well pending transport to shore. Fish from each collection site were sorted by species in the field and were stored in polyethylene bags for transport to a field station within 24 hours of collection. To prevent contamination, only live, intact fish (devoid of breaks or lacerations) were processed for sample analysis. When sample processing was not possible immediately following collection, fish were stored at -20 BC pending processing. Sample preparation was conducted by NCDWQ Biological Assessment Unit and Service staff at the NCDWQ laboratory. Fish were thawed prior to processing and placed on a contaminant-free surface for sorting and labeling. Fish were inspected to assure they were not compromised during transport and storage and weight and total length were recorded. Stainless steel equipment was used and processing surfaces were washed with detergent and rinsed with deionized water to prevent contamination. According to NCDWQ protocol (2006), fish fillets were scaled prior to homogenization; for catfish species collected, skinless fillets were used. Fish were scaled and filleted on aluminum foil covered surfaces. If a 200 gram fillet sample was achieved from an individual fish fillet, the remaining fillet tissue was discarded (or processed for analysis as a split sample); however, if additional sample mass was required, the fillets from each side of the fish were combined. Fish of

9
insufficient size for adequate sample mass using both fillets were combined into a sample composite of fillets from two or more individual fish. NCDWQ analytical support also allowed an assessment of the relationship of fillet to whole body concentrations of mercury for determining effects to piscivorous wildlife (through the collection and analysis of whole body samples for each target species). For each sample, fillets (or individual whole body samples) were homogenized and placed in foil cups with foil-lined lids. The potential for cross-contamination was minimized by rinsing utensils with deionized water and changing aluminum foil coverings between processing of fish samples. Fish Tissue Chemical Analysis A total of 320 samples (302 fillet samples and 18 whole body) were analyzed by the NCDWQ Analytical Chemistry Laboratory; 98 samples were processed as split samples and were analyzed separately by a Service contract laboratory (Laboratory and Environmental Testing, Inc. [LET], Columbia, MO). Samples were processed in batches (based on the order of collection) with processing and analysis occurring between 2004 and 2007. Total mercury concentration in fish tissue was determined using strong acid digestion and analysis by cold vapor reduction atomic absorption spectrophotometry (USEPA 1991). Samples were digested using either microwave digestion with trace metal grade nitric acid (LET) or sulfuric and nitric acid digestion folloed by oxidation with potassium permanganate (NCDWQ). Calibration for the cold vapor atomic absorption spectrophotometry utilized four calibration standards (ranging from 0 to 30 ppb). The lower detection limit (LDL) for wet weight mercury concentrations reported by NCDWQ and LET was 0.02 ppm. Analytical results were accompanied by batch-specific quality control / quality assurance samples (including blanks, spikes, duplicates and standard reference material analyses) to gage analytical precision and bias (accuracy). Review of quality assurance data (provided in Appendix A) indicates acceptable accuracy. Data Interpretation Individual fillet and composite fillet mercury residues were screened against recommended thresholds for human consumption of fish including USEPA fish tissue mercury criterion for human health (USEPA 2000; USEPA 2001; USEPA 2001b), NC fish consumption action level (NCDHHS 2006), and FDA action limit (USFDA 1998). Because most mercury in fish exists as methylmercury (Wiener 1987), total mercury results from our analyses were compared to methylmercury screening values. A species specific evaluation of fish size relative to mercury concentration was also performed; based on insufficient sample numbers for several species collected, species family groups (e.g., ictalurids, centrarchids, and percids) were also assessed to determine fish size and mercury concentration relationships. Comparison of fish tissue residues across refuges sampled was not possible for most of the target species collected (based on an insufficient number of individuals obtained across refuges); however, consideration of refuge-specific differences in fish tissue residues was possible for two species with adequate sample sizes (e.g., bluegill and largemouth bass) and for multiple species grouped by family (e.g., catfish, sunfish, and perch)1. Mercury levels in fish species collected were also compared to baseline fish tissue mercury data (with age and size adjustments where appropriate) for refuges
1 The family grouping for sunfish (Family Centrarchidae) includes all species of centrarchids except largemouth bass (Micropterus salmoides). Largemouth bass tissue residues were considered separately in the analysis.

10
where previous sampling has been conducted (Alligator River, Mattamuskeet, and Pocosin Lakes NWRs). The toxicological significance of fish tissue mercury residues to piscivorous wildlife was also compared to the avian dietary LOAEL of 0.1 ppm-wet weight (Heinz 1979; Eisler 1987) to examine potential impacts to migratory birds. In addition, we estimated whole-fish mercury concentrations based on the fillet data using previously described methods (Bevelhimer et al., 1997). Although secondary to objective of fisheries management and risk communication to the public, an evaluation of wildlife receptor’s dietary mercury exposure is another valuable use of the data. Statistical Analyses Mercury concentrations from each of 96 samples analyzed by both labs were analyzed for goodness of fit to a normal distribution by the Shapiro-Wilks test (JMP 5.1.2, SAS Institute, Inc., Cary, NC, USA). Neither dataset was normally distributed, and log-transformed concentrations also did not fit a normal distribution. Accordingly, the nonparametric Wilcoxon Signed Rank test was used to test for difference among the labs. Distributions of fish lengths, weights, and mercury concentration, by species, were analyzed for goodness of fit to a normal distribution by the Shapiro-Wilks test. About a half the species mercury concentration datasets did not fit a normal distribution. Consequently, nonparametric summary statistics are reported for mercury in each species (for each refuge) including the median, 90th percentile, range of concentrations, and frequency with which samples exceeded the state action level of 0.4 ppm mercury in fish. Results and Discussion Fish Tissue Mercury Concentrations Concentrations of mercury in fish collected from each refuge are summarized in Tables 1-4; complete analytical results for all fish collected are presented in Appendix A. Regressions of fish mercury versus length or weight were conducted for all species; in general length was a better predictor and the relationship is plotted for two species for which database size yield meaningful results: bluegill (Figure 6) and largemouth bass (Figure 7). Due to insufficient sample sizes for other species, fillet mercury results were pooled for species related by family. The relationship of fish length and fillet mercury concentration is illustrated for the following three family groupings: ictalurids (catfish), centrarchids (sunfish, excluding data for largemouth bass), and percids (perch) in Figures 8-10. Sampling sites at Alligator River NWR are characterized by low alkalinity and low pH. These conditions, coupled with recent evidence of brackish water intrusion to the canals lining the Highway 64 corridor (K. Dockendorf, NC Wildlife Resources Commission [NCWRC], pers. comm.), appear to contribute to a low-productivity fishery. Minimal collection success was realized at the refuge despite repeated sampling attempts. Consequently, only limited (n = 22) data are available for interpretation from two sites. No top predator species (e.g., largemouth

11
bass) were collected. Mid-trophic level fish species obtained included bluegill, flier (Centrarchus macropterus), yellow bullhead (Ameiurus natalis), warmouth (Lepomis gulosus), and white perch (Morone americana). Because sample sizes for all species fell short of the targeted 10 individuals at each collection site, sample results were grouped by family. All fish mercury fillet residues from Alligator River NWR were below the state action level (of 0.4 ppm-ww methylmercury). Table 1. Concentrations of mercury in fish at Alligator River NWR, 2005.
Species Median 90th Percentile Range
% Above NC
Action Levela
Bluegill (n = 1) 0.12 0.12 0.12 0Flier (n = 12) 0.19 0.31 0.12-0.34 0Yellow Bullhead (n = 7) 0.15 0.19 0.13-0.19 0Warmouth (n = 1) 0.26 0.26 0.26 0White Perch (n = 1) 0.23 0.23 0.23 0
FamilyIctalurids (n = 7) 0.15 0.19 0.13-0.19 0
Centrarchids (n = 14)b 0.19 0.30 0.12-0.34 0Percids (n = 1) 0.23 0.23 0.23 0
Mercury Concentration (ppm wet weight)
a NC Dept. of Health and Human Services action level for issuing fish advisories of 0.4 mg/kg methyl mercury. Total mercury results from this study were compared to the methyl mercury action level because most of mercury in fish exists as methyl mercury.b The family grouping for sunfish (Family Centrarchidae) includes all species of centrarchids except largemouth bass (Micropterus salmoides). Largemouth bass tissue residues were considered separately in the analysis.
Fish were collected at Mattamuskeet NWR in May 2004 from four sites: Rose Bay Canal, West Main Canal, Sandy Dike and the Causeway. Fish mercury concentrations pooled from all collection locations on the refuge yielded a sufficient sample size for several species including bluegill, gizzard shad (Dorosoma cepedianum), and largemouth bass. Additional species collected included black crappie (Pomoxis nigromaculatus), brown bullhead (Ameiurus nebulosus), common carp (Cyprinus carpio), and channel catfish (Ictalurus punctatus). Of the 94 individual fish fillets analyzed, mercury concentrations exceeded the state action level for only one mid-trophic level species (black crappie) or three percent of the overall centrarchid fillets analyzed (Table 2 and Figure 9), while 82 percent of largemouth bass fillets exceeded the state action level (Figure 7).

12
Species Median 90th Percentile Range
% Above NC
Action Levela
Black crappie (n = 1) 0.46 0.46 0.46 100Bluegill (n = 36) 0.17 0.24 0.09-0.31 0Brown bullhead (n = 4) 0.06 0.14 0.05-0.14 0Carp (n = 4) 0.05 0.08 0.01-0.08 0Channel catfish (n = 2) 0.20 0.29 0.10-0.29 0Gizzard shad (n = 30) 0.03 0.05 0.02-0.06 0Largemouth bass (n = 17) 0.58 0.90 0.24-0.92 82
FamilyIctalurids (n = 6) 0.08 0.29 0.05-0.29 0
Centrarchids (n = 37)b 0.17 0.24 0.09-0.46 3Percids (n = 0) n/a n/a n/a n/aa NC Dept. of Health and Human Services action level for issuing fish advisories of 0.4 mg/kg methyl mercury. Total mercury results from this study were compared to the methyl mercury action level because most of mercury in fish exists as methyl mercury.
Mercury Concentration (ppm wet weight)
b The family grouping for sunfish (Family Centrarchidae) includes all species of centrarchids except largemouth bass (Micropterus salmoides). Largemouth bass tissue residues were considered separately in the analysis.
Table 2. Concentrations of mercury in fish at Mattamuskeet NWR, 2004.

13
Table 3. Concentrations of mercury in fish at Pocosin Lakes NWR, 2004-2006.
Species Median 90th Percentile Range
% Above NC
Action Levela
Black crappie (n = 1) 0.23 0.23 0.23 0Bluegill (n = 24) 0.20 0.36 0.09-0.41 4Brown bullhead (n = 9) 0.10 0.20 0.07-0.2 0Carp (n = 3) 0.23 0.29 0.20-0.29 0Flier (n = 1) 0.46 0.46 0.46 100Largemouth bass (n = 50) 0.61 1.19 0.03-1.6 92Pumkinseed (n = 11) 0.25 0.35 0.16-0.36 0Redear sunfish (n = 3) 0.14 0.23 0.10-0.23 0Warmouth (n = 3) 0.27 0.27 0.22-0.27 0White catfish (n = 7) 0.25 0.99 0.10-0.99 14White perch (n = 2) 0.27 0.40 0.13-0.40 50Yellow bullhead (n = 2) 0.59 0.69 0.49-0.69 100Yellow perch (n = 17) 0.40 0.65 0.17-0.67 53
FamilyIctalurids (n = 18) 0.12 0.72 0.07-0.99 17
Centrarchids (n = 43)b 0.21 0.35 0.09-0.46 5Percids (n = 19) 0.40 0.65 0.13-0.67 53
Mercury Concentration (ppm wet weight)
a NC Dept. of Health and Human Services action level for issuing fish advisories of 0.4 mg/kg methyl mercury. Total mercury results from this study were compared to the methyl mercury action level because most of mercury in fish exists as methyl mercury.b The family grouping for sunfish (Family Centrarchidae) includes all species of centrarchids except largemouth bass (Micropterus salmoides). Largemouth bass tissue residues were considered separately in the analysis.

14
Table 4. Concentrations of mercury in fish at Pee Dee NWR, 2004.
Figure 6. Relationship of tissue mercury concentration (ppm-ww) to fish length (cm) for bluegill (Lepomis macrochirus) collected from North Carolina National Wildlife Refuges (Mattamuskeet [MNWR], Pee Dee [PDNWR], Pocosin Lakes [PLNWR], and Alligator River [ARNWR]). Mercury concentration tended to be low regardless of size.
Hg (ppm ww) = [0.0113 * Fish Length (cm)] - 0.0116
R2 = 0.0909p = 0.0095
0
0.2
0.4
0.6
0.8
1
1.2
10 12 14 16 18 20 22 24
Fish length (cm)
Hg
(ppm
)
MNWR
PDNWR
PLNWR
ARNWR
FDA Action Level
NC Action Level
Species Median 90th Percentile Range
% Above NC
Action Levela
Black crappie (n = 5) 0.21 0.25 0.11-0.25 0Bluegill (n = 12) 0.22 0.39 0.10-0.42 8Channel catfish (n = 9) 0.25 0.44 0.01-0.44 11Largemouth bass (n = 20) 0.63 0.87 0.12-0.88 65Redear sunfish (n = 9) 0.12 0.20 0.03-0.20 0Warmouth (n = 1) 0.41 0.41 0.41 100
FamilyIctalurids (n = 9) 0.25 0.44 0.01-0.44 11
Centrarchids (n = 27)b 0.19 0.35 0.03-0.42 7Percids (n = 0) n/a n/a n/a n/a
Mercury Concentration (ppm wet weight)
a NC Dept. of Health and Human Services action level for issuing fish advisories of 0.4 mg/kg methyl mercury. Total mercury results from this study were compared to the methyl mercury action level because most of mercury in fish exists as methyl mercury.b The family grouping for sunfish (Family Centrarchidae) includes all species of centrarchids except largemouth bass (Micropterus salmoides). Largemouth bass tissue residues were considered separately in the analysis.

15
Hg (ppm ww) = [0.0168 * Fish Length (cm)] + 0.045
R2 = 0.1298p = 0.0021
0
0.2
0.4
0.6
0.8
1
1.2
10 15 20 25 30 35 40 45 50 55 60
Fish length (cm)
Hg
(ppm
)
MNWR
PDNWR
PLNWR
1.6 1.4 1.4
FDA Action Level
NC Action Level
Fish were collected at Pocosin Lakes NWR on 14 occasions between August 2004 and May 2006 using varied collection techniques including electrofishing, gill nets, trap nets, and hook and line. With samples pooled from all collection locations on the refuge, mercury fillet residue datasets for bluegill, largemouth bass, and yellow perch were sufficiently large for meaningful interpretation. Other species collected in limited numbers included black crappie, brown bullhead, carp, flier, pumpkinseed (Lepomis gibbosus), redear sunfish (Lepomis microlophus), warmouth, white catfish (Ameiurus catus), white perch, and yellow bullhead. Fillet mercury data were also summarized by family. Most (92 percent) largemouth bass fillets collected from refuge waters exceeded the state action level for methylmercury, and 18 percent of those samples also exceeded the FDA action level of 1 ppm (Figure 7). Although only a limited number of catfish species were obtained during refuge collections, 17 percent (three individuals) of ictalurid fillets exceeded the state action level (Figure 8). The catfish samples exceeding the state threshold included yellow bullhead and white catfish collected from Lake Phelps. Two individual sunfish fillet samples (of 43 samples total) collected from the refuge also exceeded the state threshold (Figure 4). Two percid species (yellow perch and white perch) were collected from Pocosin Lakes NWR and 53 percent of perch fillet mercury residues exceeded the state action level (Figure 10). Samples exceeding the state action level were obtained from several sites on the refuge including Pungo Lake, Frying Pan, Scuppernong River, and Lake Phelps. Regressions of fish mercury versus perch length indicate that mercury residues in fillet tissue are not significantly correlated to overall fish length (which ranged from 19.5 to 25 cm for individuals exceeding the state threshold).
Figure 7. Relationship of tissue mercury concentration (ppm-ww) to fish length (cm) for largemouth bass (Micropterus salmoides) collected from North Carolina National Wildlife Refuges (Mattamuskeet [MNWR], Pee Dee [PDNWR], and Pocosin Lakes [PLNWR]). Refuge-specific regression equations were also significant and had higher coefficients of determination.

16
Hg (ppm ww) = [0.0103 * Fish length (cm)] - 0.1215
R2 = 0.1518p = 0.0130
0
0.2
0.4
0.6
0.8
1
1.2
10 15 20 25 30 35 40 45 50
Fish length (cm)
Hg
(ppm
) MNWR
PDNWR
PLNWR
ARNWR
FDA Action Level
NC Action Level
Hg (ppm ww) = [0.0091 * Fish length (cm)] + 0.0327
R2 = 0.0481p = 0.0157
0
0.2
0.4
0.6
0.8
1
1.2
10 12 14 16 18 20 22 24 26 28
Fish length (cm)
Hg
(ppm
) MNWR
PDNWR
PLNWR
ARNWR
FDA Action Level
NC Action Level
Figure 8. Relationship of tissue mercury concentration (ppm-ww) to fish length (cm) for species in the family Ictaluridae (catfish) from North Carolina National Wildlife Refuges (Mattamuskeet [MNWR], Pee Dee [PDNWR], Pocosin Lakes [PLNWR], and Alligator River [ARNWR]).
Figure 9. Relationship of tissue mercury concentration (ppm-ww) to fish length (cm) for species in the family Centrarchidae (sunfish) from North Carolina National Wildlife Refuges (Mattamuskeet [MNWR], Pee Dee [PDNWR], Pocosin Lakes [PLNWR], and Alligator River [ARNWR]). The family grouping for sunfish (Family Centrarchidae) includes all species of centrarchids except largemouth bass (Micropterus salmoides). Largemouth bass tissue residues were considered separately in the analysis.
17
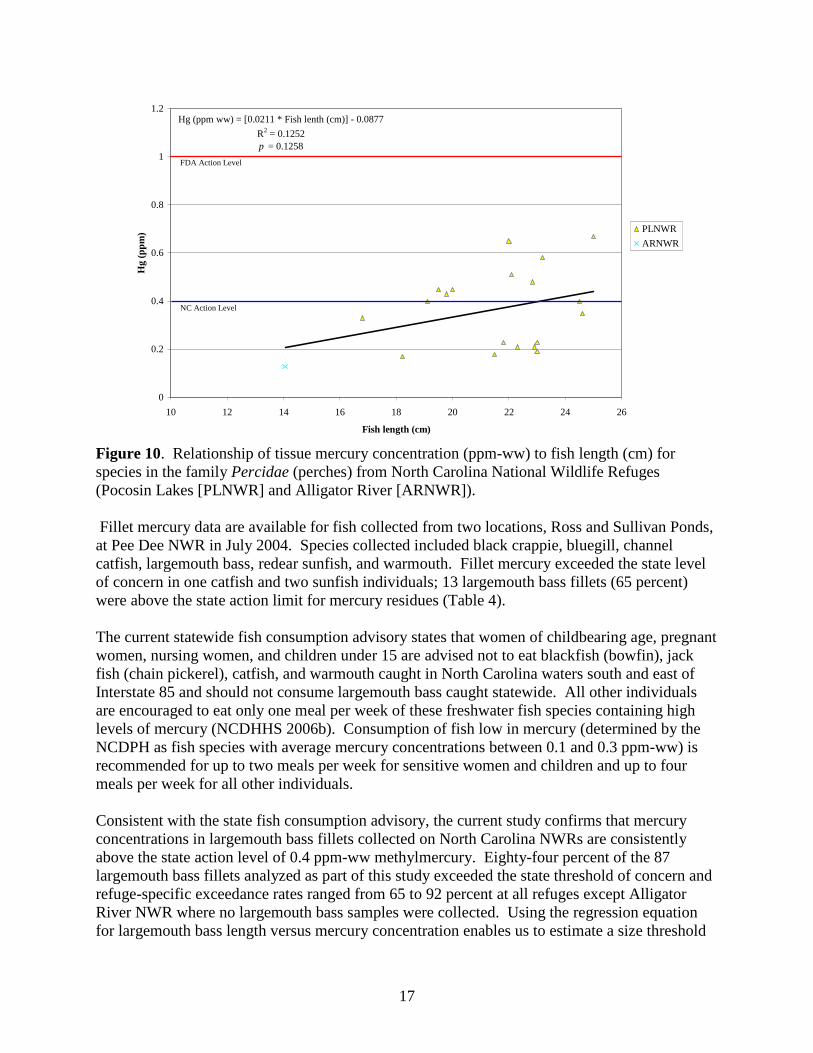
Hg (ppm ww) = [0.0211 * Fish lenth (cm)] - 0.0877
R2 = 0.1252p = 0.1258
0
0.2
0.4
0.6
0.8
1
1.2
10 12 14 16 18 20 22 24 26
Fish length (cm)
Hg
(ppm
) PLNWR
ARNWR
FDA Action Level
NC Action Level
Figure 10. Relationship of tissue mercury concentration (ppm-ww) to fish length (cm) for species in the family Percidae (perches) from North Carolina National Wildlife Refuges (Pocosin Lakes [PLNWR] and Alligator River [ARNWR]). Fillet mercury data are available for fish collected from two locations, Ross and Sullivan Ponds, at Pee Dee NWR in July 2004. Species collected included black crappie, bluegill, channel catfish, largemouth bass, redear sunfish, and warmouth. Fillet mercury exceeded the state level of concern in one catfish and two sunfish individuals; 13 largemouth bass fillets (65 percent) were above the state action limit for mercury residues (Table 4). The current statewide fish consumption advisory states that women of childbearing age, pregnant women, nursing women, and children under 15 are advised not to eat blackfish (bowfin), jack fish (chain pickerel), catfish, and warmouth caught in North Carolina waters south and east of Interstate 85 and should not consume largemouth bass caught statewide. All other individuals are encouraged to eat only one meal per week of these freshwater fish species containing high levels of mercury (NCDHHS 2006b). Consumption of fish low in mercury (determined by the NCDPH as fish species with average mercury concentrations between 0.1 and 0.3 ppm-ww) is recommended for up to two meals per week for sensitive women and children and up to four meals per week for all other individuals.
Consistent with the state fish consumption advisory, the current study confirms that mercury concentrations in largemouth bass fillets collected on North Carolina NWRs are consistently above the state action level of 0.4 ppm-ww methylmercury. Eighty-four percent of the 87 largemouth bass fillets analyzed as part of this study exceeded the state threshold of concern and refuge-specific exceedance rates ranged from 65 to 92 percent at all refuges except Alligator River NWR where no largemouth bass samples were collected. Using the regression equation for largemouth bass length versus mercury concentration enables us to estimate a size threshold

18
below which consumption of fish is not likely to present risks to the public (Figure 7). Based on fillet mercury data from this study, fish smaller than 21 cm total length caught from refuge waters generally should be safe to eat; however, the legal size limit of 35.6 cm (NCWRC 2007) precludes consumption. Accordingly, a catch and release fishery or limited consumption (consistent with the State’s advisory: http://www.epi.state.nc.us/epi/fish/safefish.html) is advised. Centrarchid species collected from refuges are considered to be mid-trophic level consumers. Because these species eat a varied diet (including plankton, algae, and small fish), they are generally less likely to accumulate high levels of mercury over time. Of the seven sunfish species (black crappie, bluegill, flier, gizzard shad, pumpkinseed, redear sunfish, and warmouth) collected from study refuges, five individual samples (or four percent of 121 samples total) across all refuges exceeded the state action level for mercury. Of the centrarchids, only the dataset for bluegill was large enough to generate a meaningful regression relationship for fillet mercury concentration versus fish length (Figure 6). In general, bluegill caught on refuges that are smaller than 36 cm total length should be safe for the public to consume. The recommended range of sizes for consumption presented here is intended to provide information for individuals not included in sensitive groups (e.g., women of childbearing age, pregnant and nursing women, or children) to minimize their potential health risks when eating fish caught on NWRs; it does not change the advice that sensitive individuals should not consume largemouth bass from refuge waters or anywhere else in the state. A small dataset for percid and ictalurid species limits an evaluation of regression relationships to determine size thresholds for safe consumption. Two percid species, yellow perch and white perch, were collected from Alligator River and Pocosin Lakes NWRs. Although perch were collected in only limited numbers, half of the 20 samples exceeded the state mercury action limit. Both white and yellow perch readily feed at or near the substrate surface with adults preying on macroinvertebrates and small fishes (NatureServe 2007), thus promoting exposure to and incidental ingestion of sediment-bound mercury. Accordingly, dietary preferences may explain elevated mercury levels found in percids relative to other mid-trophic level species (e.g., sunfish) collected in this study; however, the small dataset limits meaningful interpretation of exceedance frequencies. Catfish species are included in the current fish consumption advisory for eastern North Carolina waters; however, only four catfish fillet samples (10 percent overall) collected from refuges exceeded the state threshold of concern. Because of their close association with the substrate, the catfish diet is comprised of benthic invertebrates, small fishes, and occasionally plant material (Thomas et al. 2007); accordingly, ictalurid species are potentially exposed to sediment-bound mercury. Consistent with one of the original project objectives, catfish species were collected from each refuge; however, sample sizes were smaller than desired at several refuges, so it is not practical to determine appropriate sizes for low-risk consumption. Fillet mercury concentrations were determined from several locations at each refuge; however, for most collection sites, insufficient samples were obtained for each species to draw any conclusions about location-specific differences in fish mercury. Differences in fillet mercury between each of the refuges included in the study are evident (Figures 6 through 10); however,
19
meaningful comparison of species-specific mercury between refuges is also hampered by small datasets. A comparison of historic fillet mercury levels (NCDWQ 2007) in fish species collected from waters on or adjacent to three refuges to results from the present study is presented in Table 5. Fillet mercury results are summarized for family groupings (ictalurids, centrarchids, and percids) as well as a representative top predator species (largemouth bass). Fillet mercury for fish collected in the vicinity of Alligator River NWR rarely exceeded the state action level and median mercury concentrations appear relatively unchanged from historic sampling results for catfish and sunfish species. Small data sets and other confounding factors (e.g., differences in fish sizes and specific collection locations), however, limit our ability to draw definitive conclusions regarding trends in fish mercury concentrations at Alligator River. Likewise, mercury in fillets from catfish and sunfish species collected from Mattamuskeet NWR for this study appear to be reasonably comparable to historic median fillet mercury concentrations (with similar confounding factors). Median fillet mercury concentrations and the rate of action level exceedance for largemouth bass at Mattamuskeet NWR appear to have more than doubled when comparing results from prior sampling efforts to those from the current study despite inclusion of larger fish in the historic datasets. The cause of increasing fillet mercury concentrations at Mattamuskeet NWR is not known. Limited water quality data exist for the refuge and mercury deposition data are limited to one nearby National Atmospheric Deposition Program (NADP) collection site (located at Pocosin Lakes NWR) in operation since February 1996; no increasing trends in mercury deposition or atmospheric mercury levels have been noted during the period of record of the mercury deposition network site (NADP 2007). The size ranges of catfish species collected at Pocosin Lakes NWR are similar between historic and current sampling events, and while median fillet mercury concentrations are similar, the 90th percentile fillet mercury residue and frequency of action level exceedance appear to indicate an increase in mercury burdens over time. Although some differences are evident between sunfish, perch, and largemouth bass results from historic and present collections, they are not dramatic and do not appear to be conclusive based on sample sizes, varied collection locations, or fish sizes. Historic data were not available from Pee Dee NWR for comparison.

20
Median 90th Percentile Range
Alligator River NWRb
This Study Ictalurids (n = 7) 0.15 0.19 0.13-0.19 0 27.0-37.0 Centrarchids (n = 14) 0.19 0.30 0.12-0.34 0 16.8-19.5 Percids (n = 1) 0.23 0.23 0.23 0 23 Largemouth bass (n = 0) n/a n/a n/a n/a n/a Historic Data Ictalurids (n = 3) 0.05 0.08 0.03-0.09 0 32.0-42.0 Centrarchids (n = 4) 0.16 0.20 0.08-0.21 0 17.5-22.6 Percids (n = 0) n/a n/a n/a n/a n/a Largemouth bass (n = 18) 0.21 0.39 0.13-0.57 6 30.5-52.0
Mattamuskeet NWRc
This Study Ictalurids (n = 6) 0.08 0.29 0.05-0.29 0 20.9-48.0 Centrarchids (n = 37) 0.17 0.24 0.09-0.46 3 15.0-27.5 Percids (n = 0) n/a n/a n/a n/a n/a Largemouth bass (n = 17) 0.58 0.90 0.24-0.92 82 22.5-29.4 Historic Data Ictalurids (n = 7) 0.12 0.15 0.08-0.17 0 23.4-41.0 Centrarchids (n = 13) 0.25 0.39 0.11-0.43 8 17.5-32.5 Percids (n = 1) 0.07 0.07 0.07 0 19.8 Largemouth bass (n = 133) 0.27 0.58 0.1-0.86 33 27.3-56.5
Pocosin Lakes NWRd
This Study Ictalurids (n = 18) 0.12 0.72 0.07-0.99 17 21.5-47.0 Centrarchids (n = 43) 0.21 0.35 0.09-0.46 5 15.2-22.1 Percids (n = 19) 0.40 0.65 0.13-0.67 53 14.1-25.0 Largemouth bass (n = 50) 0.61 1.19 0.03-1.6 92 35.6-54.0 Historic Data Ictalurids (n = 9) 0.11 0.21 0.08-0.38 0 21.5-47.0 Centrarchids (n = 16) 0.31 0.53 0.11-0.61 31 17.5-24.6 Percids (n = 2) 0.41 0.46 0.35-0.47 50 19.9-20.7 Largemouth bass (n = 53) 1.00 1.80 0.11-2.2 85 26.0-55.1
Fish Size Range (cm)
a NC Dept. of Health and Human Services action level for issuing fish advisories of 0.4 mg/kg methyl mercury. Total mercury results from this study were compared to the methyl mercury action level because most of mercury in fish exists as methyl mercury.b Collection dates: this study (Mar. & Nov. 2005); historic data (Sept 1990, May 1994, Mar. 1995)
c Collection dates: this study (May & Jun. 2004); historic data (Jan. & Feb. 1984, May 1991, Apr. 1997)
Mercury Concentration (ppm wet weight)% Above
NC Action
Levela
d Collection dates: this study (Aug.-Nov. 2004, Apr.-Aug. 2005, May 2006); historic data (May 1994, Mar. & Jun. 1995,
Jul. 2003)
Table 5. Comparison of historic and present fish fillet mercury concentrations for species collected from waters on or adjacent to three National Wildlife Refuges. The family grouping for sunfish (Family Centrarchidae) includes all species of centrarchids except largemouth bass (Micropterus salmoides). Largemouth bass tissue residues were considered separately in the analysis.

21
Piscivorous Wildlife Consumption Dietary levels as low as 0.5 ppm-dry weight (~0.1 ppm-wet weight) methylmercury have been associated with adverse reproductive impacts to sensitive avian species (Heinz 1979; Eisler 1987). The USEPA used this value as the avian chronic exposure Lowest Observed Adverse Effects Level (LOAEL) in the Mercury Report to Congress (USEPA 1997). Sublethal effects of methylmercury at this concentration in the diet of mallards include reduced egg-laying, production of fewer young, and hyperresponsiveness of young to fright stimulus. To approximate a No Observed Adverse Effects Level (NOAEL) in the wildlife risk assessment portion of the Mercury Report To Congress, USEPA divided this LOAEL by a LOAEL-to-NOAEL uncertainty factor of 3 (USEPA 1997). These avian wildlife dietary mercury effects reference values are similar to those used by USEPA in the Great Lakes Water Quality Criteria Initiative. We used the avian dietary LOAEL of 0.1 ppm-wet weight to examine potential impacts to migratory birds for measured whole body (n = 18) and approximated (n = 302) whole body (determined using a fillet-to-whole body relationship for mercury described by Bevelhimer et al. 1997) fish mercury concentrations. Sixty-seven percent of measured fillet whole body mercury residues for species collected across refuges exceeded the LOAEL for avian dietary impacts; fish species with mercury burdens exceeding the LOAEL included black crappie, brown bullhead, white catfish, yellow perch, and largemouth bass. Estimated whole body mercury residues for species collected from all four refuges also exceeded the LOAEL for all species collected except gizzard shad (Figure 11).
0.00
0.10
0.20
0.30
0.40
0.50
0.60
0.70
0.80
0.90
1.00
1.10
BLACK C
RAPPIE
BLUEG
ILL S
UNFISH
BROW
N BULLH
EADCARP
CHANNEL
CATFISH
FLIER
GIZZARD S
HAD
LARG
EMOUTH
BASS
PUMPKINSEED
REDEA
R SUNFISH
WARM
OUTH
WHIT
E CATFIS
H
WHIT
E PERCH
YELLOW
BULL
HEAD
YELLOW
PERCH
Hg
(ppm
-ww
)
Avian Dietary LOAEL
Figure 11. Average estimated whole body mercury concentration in fish species collected from four North Carolina National Wildlife Refuges. Bars represent maximum estimated whole body mercury residue for each species. Comparison of measured and estimated whole body fish mercury residues to dietary toxicity reference values is a conservative means of assessing risks to piscivorous birds because it considers exclusive consumption of fish prey by avian receptors. A less conservative and potentially more realistic assessment of piscivorous wildlife risks could be achieved by modeling mercury residues associated with piscivore oral exposure routes (e.g., drinking water, food items,

22
incidental soil/sediment ingestion, etc) and considering the foraging areas used by representative receptors. Other avian effects data (beyond the LOAEL) could also be evaluated; however, the modeling approach is beyond the scope of this project. Evaluation of Split Samples Analysis of split samples was previously recommended to allow for comparison of results between the Service contract laboratory and the State laboratory. Ninety-six of the 305 samples were processed in duplicate and analyzed by separately by NCDWQ and LET. A matched pairs analysis of these data with the Wilcoxon Ranked-Sign test indicates the NCDWQ results are significantly lower than those reported by LET. Relative percent deviations among the samples indicate the NCDWQ data are, on average, 18% lower than corresponding concentrations reported by LET; the magnitude of this difference should not markedly affect interpretation of results given the normal analytical variability in fish tissue mercury measurements.

23
Management Recommendations
1. Mercury concentrations in fish fillets obtained from four NC NWRs indicate that catfish (ranging from 0.01 to 0.99 ppm-ww) and sunfish (ranging from 0.03-0.46 ppm-ww) species are generally below the state action level for issuing public health consumption advisories. Half of the perch (ranging from 0.13-0.67 ppm-ww) and 84 percent of largemouth bass (ranging from 0.03-1.6 ppm-ww) fillet mercury residues exceeded the state consumption action level.
a. Fillet mercury results for bluegill indicate that consumption of individual fish greater than 36 cm in length should be avoided to minimize public exposure risks. Because bluegill rarely exceed 36 cm in length, most individuals caught on refuges are safe to eat. This is consistent with the State’s fish consumption advice.
b. Consumption of individual largemouth bass greater than 35.6 cm in length (the legal size limit for most refuge waters) is not recommended. Our data indicate that only largemouth bass smaller than 21 cm in length would be generally safe for consumption. The current legal size limit for largemouth bass (of 35.6 cm) precludes consumption of smaller individuals. Accordingly, a catch and release fishery or limited consumption (consistent with the State’s advisory: http://www.epi.state.nc.us/epi/fish/safefish.html) is advised.
c. Insufficient perch data are available to determine a size threshold for safe public consumption. Future data collection targeting perch species is recommended in order to provide refuge-specific guidance for consumption.
d. The statewide fish consumption advisory issued by the NC Division of Public Health (http://www.epi.state.nc.us/epi/fish/current.html) should be followed by all refuge visitors. Current state advisory information and risk management recommendations from this study should be posted at popular fishing locations on each refuge.
2. Mercury concentrations in whole body samples indicated that the lower range of dietary
levels known to adversely affect sensitive avian species was exceeded for all species except bluegill and flier. Whole body mercury for species estimated based on fillet mercury residues also frequently (84 percent) exceeded avian dietary toxicity thresholds. The conservative risk screening of a limited whole body sample dataset comprised of multiple species presented here indicates potential impacts to avian productivity.
a. Measured whole body fish mercury burdens should be sampled in the future if mercury impacts to piscivorous wildlife are indicated.
b. A comprehensive wildlife risk assessment (beyond the scope of the current project) including dietary input modeling and site specific exposure assessment should be implemented if future wildlife mercury impacts are suspected.

24
References Augspurger, T. and K. Looney. 1995. Mercury in Lake Mattamuskeet osprey and largemouth bass, Mattamuskeet National Wildlife Refuge, Hyde County, North Carolina. U.S. Fish Wildl. Serv., Raleigh, NC. Benkert, K.A. 1990. Limnological assessment of Lake Mattamuskeet and Pungo Lake in relation to metal residues in biota and sediments. U.S. Fish Wildl. Serv., North Carolina Field Office, Raleigh, NC. Benkert, K.A. 1992. Contaminant assessment of biota and sediments in the Albemarle-Pamlico region. U.S. Fish. Wildl. Serv., Raleigh Field Office, Raleigh, NC. Bevelhimer, M.S., Beauchamp, J.J., Sample, B.E., and G.R. Southworth. 1997. Estimation of Whole-Fish Contaminant Concentrations from Fish Fillet Data. U.S. Department of Energy, Office of Environmental Management, Risk Assessment Program. Oak Ridge National Laboratory. Oak Ridge, TN. February 1997, ES/ER/TM-202. Cunningham, P.A., Williams, R.E., Chessin, R.L., McCarthy, J.M., Curry, R. Gold, K.W., Pratt, R.W., and S.J. Stichter. 1992. Watershed planning in the Albemarle-Pamlico estuarine system: report 3 – toxics analysis. Report No. 92-04. North Carolina Dept. of Environment, Health, and Natural Resources, Albemarle-Pamlico Estuarine Study. Raleigh, NC. Eisler, R. 1987. Mercury hazards to fish, wildlife, and invertebrates: a synoptic review. U. S. Fish Wild. Serv. Biol. Rep. 85 (1.10). 90 pp. Environmental Sciences and Engineering, Inc. 1982. Hydrology, biology, and water quality studies for the Pungo River area of North Carolina. Preliminary assessment prepared for Peat Methanol Associates, Methanol Plant, Creswell, North Carolina. Environmental Sciences and Engineering, Inc., Gainesville, FL. Heinz, G.H. 1979. Methylmercury: reproductive and behavioral effects on three generations of mallard ducks. J. Wildl. Manag. 43:394-401. Hinesley, E. and M. Wicker. 1997. Atlantic white cedar wetland restoration project, Pocosin Lakes National Wildlife Refuge. Report for non-point source pollution demonstration project. U.S. Fish Wildl. Serv., Raleigh, NC. Long, E.R. and L.G. Morgan. 1990. The potential for biological effects of sediment-sorbed contaminants tested in the national status and trend program. NOAA, National Ocean Service. NOAA Tech. Mem. NOS OMA 52. Seattle. Looney, K.T. and T. Augspurger. 1992. Mercury and other elemental contaminant residues in largemouth bass from Mattamuskeet National Wildlife Refuge. Raleigh Field Office, Raleigh, NC.

25
McDonald, C.B., A.N. Ash and E.S. Kane. 1983. Pocosins: A changing wetland resouce. U.S. Fish Wildl. Serv. FWS/OBS-83/32, Washington, DC. National Atmospheric Deposition Program. 2007. NADP Site Information - NADP/MDN Monitoring Location NC42. Available http://nadp.sws.uiuc.edu/sites/siteinfo.asp?net=MDN&id=NC42. (Accessed: December 27, 2007). NatureServe. 2007. Comprehensive Report Series – Perca flavescens. Available http://www.natureserve.org/explorer/servlet/NatureServe?searchSciOrCommonName=yellow+perch&x=0&y=0. (Accessed: November 5, 2007). NC DHHS. 2006. Health Effects of Methylmercury and North Carolina’s Advice on Eating Fish. NC Department of Health and Human Services, Occupational and Environmental Epidemiology Branch. March 27, 2006. Available http://www.epi.state.nc.us/epi/fish/technicalhealtheffects.pdf. (Accessed: November 5, 2007). NC DHHS. 2006b. What fish are safe to eat? Advice on Eating Fish from the North Carolina Division of Public Health. October 2006. Available http://www.epi.state.nc.us/epi/fish/safefish06.pdf. (Accessed: November 5, 2007). NCDWQ. 1998. Yadkin - Pee Dee River Basinwide Water Quality Management Plan. NC Division of Water Quality, Water Quality Section. Raleigh, NC. NCDWQ. 2001 Classifications and water quality standards applicable to surface waters of North Carolina (Title 15A NCAC 2B .0100 and .0200). Environmental Management Commission, Raleigh, NC. April 1, 2001. NCDWQ. 2006. Standard Operating Procedures Fish Tissue Assessments. Environmental Sciences Section, Biological Assessment Unit. Available http://h2o.enr.state.nc.us/esb/BAUwww/FinalNewSOPv2.pdf. (Accessed: November 5, 2007). NCDWQ. 2007. Biological Assessment Unit Fish Tissue Results. Available http://h2o.enr.state.nc.us/esb/fish_tissue_results.html. (Accessed: November 5, 2007). NCWRC. 2007. North Carolina Inland Fishing, Hunting, & Trapping Regulations Digest (effective July 1, 2007 - June 30, 2008), Inland Fishing Regulations and Information. Available http://www.ncwildlife.org/pg02_Regs/2007_08_Inland_Regs.pdf. (Accessed: November 5, 2007). Thomas, C., Bonner, T., and B. Whiteside. 2007. Freshwater Fishes of Texas. Texas A&M Press. College Station, TX. Available http://www.bio.txstate.edu/~tbonner/txfishes/. (Accessed: November 5, 2007). U.S. Environmental Protection Agency. 1991. Methods For The Determination of Metals in Environmental Samples, Environmental Monitoring Systems Laboratory, Office Of Research

26
and Development, U.S. Environmental Protection Agency, Report No. EPA-600/4-91-010 Method 245.6. U.S. Environmental Protection Agency. 1997. Mercury report to Congress. Volume VII: Characterization of human health and wildlife risks from mercury exposure in the United States. Office of Air Quality Planning and Standards and Office of Research and Development. EPA-452-R-97-009. U.S. Environmental Protection Agency. 2000. Guidance for assessing chemical contaminant data for use in fish advisories: Volume 1: Fish sampling and analysis. Third ed. Office of Water. EPA 823-B-00-007. Washington, DC. U.S. Environmental Protection Agency. 2001. Mercury Update: Impact on Fish Advisories. Office of Water. EPA-823-F-01-011. Washington, DC. U.S. Environmental Protection Agency. 2001b. Water Quality Criterion for the Protection of Human Health: Methylmercury. Office of Water. EPA-823-R-01-001. U.S. Food and Drug Administration. 1998. Action Levels for Poisonous or Deleterious Substances in Human Food and Animal Feed. Industry Activities. Staff Booklet. Washington, DC. Wiener, J.G. 1987. Metal contamination of fish in low pH lakes and potential implications for piscivorous wildlife. Trans. 52nd No. Am. Wildl. Nat. Res. Conf. pp. 645-657. Zillioux, E.J., D.B. Porcella and J.M. Benoit. 1993. Mercury cycling and effects in freshwater wetland ecosystems. Environ. Toxicol. Chem. 12: 2245-2264.

27
Appendix A. Analytical Chemistry Reports