site master
TRANSCRIPT

Key words : Return Loss, Antenna, Connectors, Feeder__________________________________________________________
Site Master Measurements : Guidelines and Recommendations
October 9th, 2002 Version 1.0 Dr. Hatem MOKHTARI
Strictly Confidential _________________________________________________________________________________1/10
Key words : Return Loss, Antenna, Connectors, Feeder__________________________________________________________
1. Background Site Master has been extensively used within Ben and THE OPERATOR to accurately deploy their networks and avoid Downlink Power outage/mismatch. Site Master is used not only for site commissioning but during maintenance and subsequent checking further to O&M monitoring as well. The document intends to give common guidelines for what to measure in view of reducing the amount of parameters to be measured, and keeping a reliable and high quality site production process. 2. Scope of Work The scope of work is to provide guidelines using relevant measurements to reach the required quality in terms of Return Loss and Distance to Fault measurements using Site Master. Furthermore, we also attempt to get a common agreement with regards to the values we can tolerate for :
i) Return Loss (e.g. -30 dB) ii) Feeder Cable Loss (e. g. <= 3 dB) iii) Cable Length Accuracy (e. g. between 1 and 5 %)
3. Introduction Site Master measurements have become more and more widespread within the telecommunications arena. Most Operators use it either for commissioning or subsequent monitoring. THE OPERATOR/Ben/THE OPERATOR need to have common tools and procedures, especially when we are dealing with the quality of the sites being deployed. To fully cope with both THE OPERATOR and Ben expectations, a number of RF parameters have to be clearly explained. With Site Master numerous things can be done, but to speed-up the production of UMTS sites we will attempt to focus on the most relevant and rather important parameters. Obviously, the aim is to update the Planning Tool with the accurate feeder loss values but also to prevent high power outage.
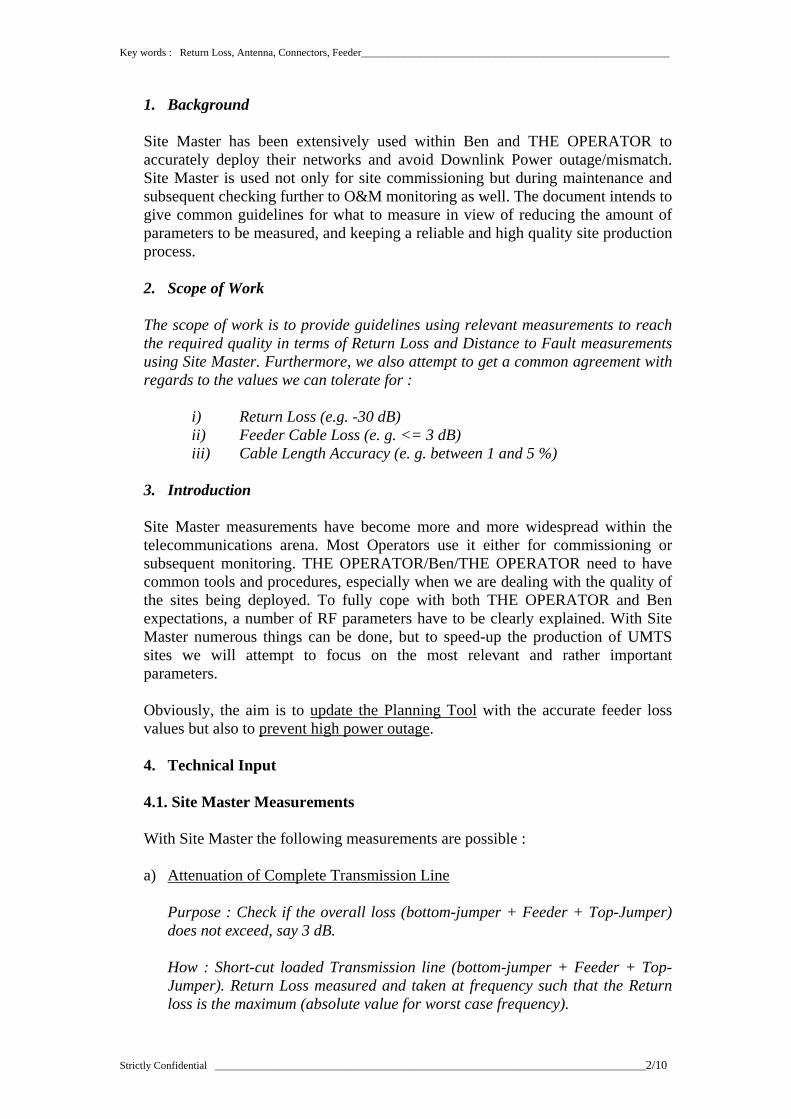
4. Technical Input 4.1. Site Master Measurements With Site Master the following measurements are possible : a) Attenuation of Complete Transmission Line
Purpose : Check if the overall loss (bottom-jumper + Feeder + Top-Jumper) does not exceed, say 3 dB. How : Short-cut loaded Transmission line (bottom-jumper + Feeder + Top-Jumper). Return Loss measured and taken at frequency such that the Return loss is the maximum (absolute value for worst case frequency).
Strictly Confidential _________________________________________________________________________________2/10

Key words : Return Loss, Antenna, Connectors, Feeder__________________________________________________________
Importance : High Reason : Cable Loss will be used for accurate propagation and linkbudget calculations to reflect the real situation.
b) Length of Complete Transmission Line Purpose : Check cable length loss (bottom-jumper + Feeder + Top-Jumper) and compare with the planned one How : Short-cut loaded Transmission line (bottom-jumper + Feeder + Top-Jumper) and Site Master set on DTF/Return Loss and connected to jumper 1 (see ANNEX 1). A graph (return Loss vs Distance) is displayed. Only one Marker is used : Maximum Return loss leads to an accurate length corresponding to this maximum value. Importance : Low Reason : RF Planning does not need this info provided that feeder loss is supplied. However, for our Mams Database and site tracking this should be important.
c) Frequency Domain Return Loss for Complete Transmission Line Purpose : Check if the total return loss of the whole transmission line is below, say -24 dB (0.4% maximum power reflection). How : A Matched Load is used with the whole Transmission line. Return Loss measured in point 1 (see ANNEX 1). A single marker is used corresponding to the maximum return loss. Importance : Very High Reason : If we agree on a maximum overall return loss of -24 dB then we need to check whether this specification is met using this measurement. Otherwise, one of the elements is faulty (i.e. connectors and/or jumpers or feeder).
d) Distance Domain Return Loss for Complete Transmission Line
Purpose : Check the return loss of each separate component is below maximum admissible values. How : A Matched Load used on connector 4 and two Markers are used. One for bottom jumper and one for top-jumper. Maximum values are then taken and compared to the specifications (to be agreed upon !) THE OPERATOR Specifies the following (Maximum values : -36 dB for feeders and -32.5 dB for connectors)
Strictly Confidential _________________________________________________________________________________3/10
Key words : Return Loss, Antenna, Connectors, Feeder__________________________________________________________
Importance : Very High
Reason : allows to check if a connector or a feeder is faulty, especially during site maintenance. Initial site design does not require such detail.
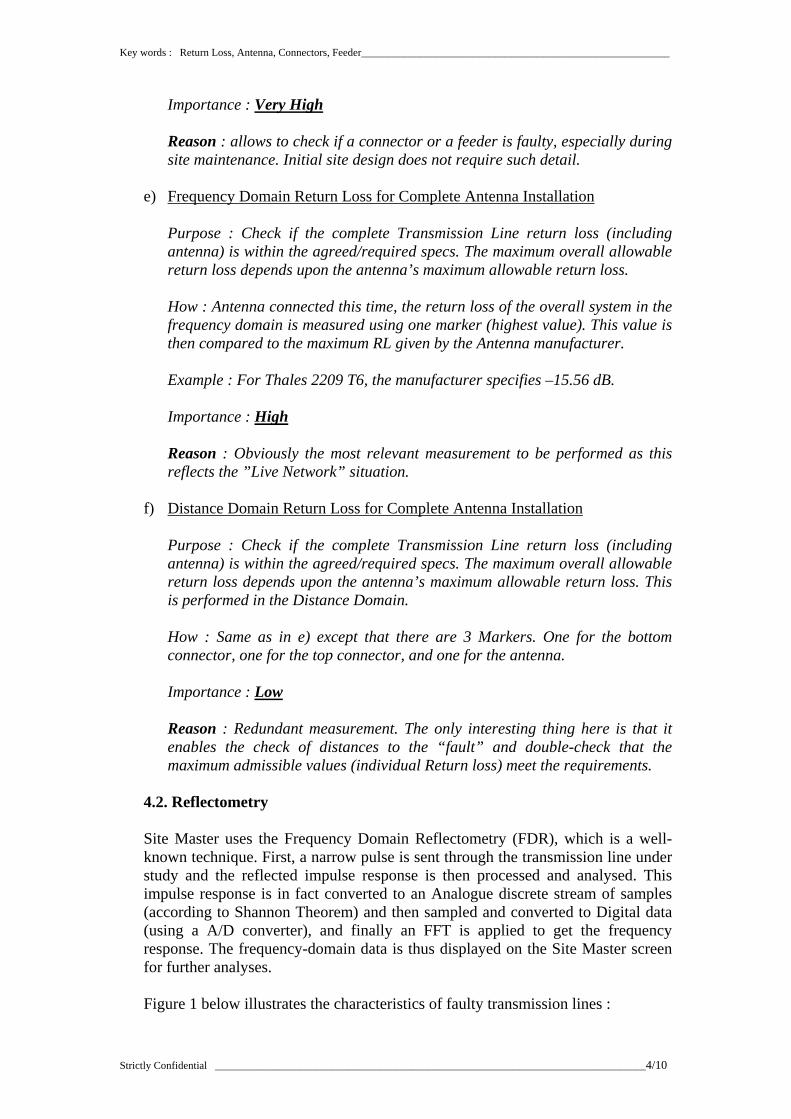
e) Frequency Domain Return Loss for Complete Antenna Installation
Purpose : Check if the complete Transmission Line return loss (including antenna) is within the agreed/required specs. The maximum overall allowable return loss depends upon the antenna’s maximum allowable return loss. How : Antenna connected this time, the return loss of the overall system in the frequency domain is measured using one marker (highest value). This value is then compared to the maximum RL given by the Antenna manufacturer. Example : For Thales 2209 T6, the manufacturer specifies –15.56 dB. Importance : High Reason : Obviously the most relevant measurement to be performed as this reflects the ”Live Network” situation.
f) Distance Domain Return Loss for Complete Antenna Installation
Purpose : Check if the complete Transmission Line return loss (including antenna) is within the agreed/required specs. The maximum overall allowable return loss depends upon the antenna’s maximum allowable return loss. This is performed in the Distance Domain. How : Same as in e) except that there are 3 Markers. One for the bottom connector, one for the top connector, and one for the antenna. Importance : Low Reason : Redundant measurement. The only interesting thing here is that it enables the check of distances to the “fault” and double-check that the maximum admissible values (individual Return loss) meet the requirements.
4.2. Reflectometry Site Master uses the Frequency Domain Reflectometry (FDR), which is a well-known technique. First, a narrow pulse is sent through the transmission line under study and the reflected impulse response is then processed and analysed. This impulse response is in fact converted to an Analogue discrete stream of samples (according to Shannon Theorem) and then sampled and converted to Digital data (using a A/D converter), and finally an FFT is applied to get the frequency response. The frequency-domain data is thus displayed on the Site Master screen for further analyses. Figure 1 below illustrates the characteristics of faulty transmission lines :
Strictly Confidential _________________________________________________________________________________4/10

Key words : Return Loss, Antenna, Connectors, Feeder__________________________________________________________
Incident Pulse
Load : Antenna, Short-circuit or Open End
Using basic Fourier analysis, the impulse response in the frequency domain can be written as :
∑∞=
−∞=
=n
ncn tjnAth )exp()( ω (1)
An are the discrete amplitudes given by the sampler and ωc is nothing but the carrier frequency. Afterwards, an FFT is applied to the above impulse response to obtain the Spectrum response of the transmission line. The FFT function will have the oscillating behaviour as the impulse response contains also oscillating contributions. The presence of sine and cosine in the FFT explain why the frequency response is oscillating. Site Master always shows such an oscillating behaviour, which confirms this theoretical analysis. The values of An will influence the amplitudes of each maximum we see on the Site Master display. 4.3. Velocity in a Coax Cable In a coax cable the propagation is on a TEM mode basis where the power is represented by the Poynting Vector. The cut-off frequency is given by the resolution of the Maxwell’s equation in a cylindrical confined medium filled by a dielectric material (Ni-Teflon, Polypropylene, etc.). The velocity inside the waveguide (coax) is given by :
rp
cvε
= (2)
This parameter is very important for Site Master for length computation. In fact the length is given by :
tvL p ∆= . (3) The accuracy of L is strongly dependent upon the knowledge of Vp, which is a manufacturer-specific value, and of course the time measurement between the first DC impulse and the received one, reflected by the “obstacle” or the fault (either a connector, antenna or any fault due to aging of the cable for example). 4.4. Return Loss in a Coax
Strictly Confidential _________________________________________________________________________________5/10

Key words : Return Loss, Antenna, Connectors, Feeder__________________________________________________________
The amount of lost energy (not transmitted to the antenna) is expressed in the return loss. This can be due to impedance mismatch (aging antenna for example), or connector or cable problems. This section is very important because so far Ben and THE OPERATOR were using different values. THE OPERATOR proposes a value not exceeding (e.g. -30 dB) for the return loss. The return loss is nothing but the dB value of the Reflection coefficient and is given by :
( )ρlog20=dBR (4) e.g. for a reflected power of 0.4% (0.004) the return loss is 24.3 dB ! therefore, a return loss of 30 dB corresponds to a reflected power of 0.1 %. As a reminder, the relationship between the Transmitted power (%) and the reflection coefficient is as follows :
)1(100(%) 2ρ−×=dTransmitteP (5) The reflected power (%) is thus straightforward :
(%)100(%)Re dTransmitteflected PP −=∴
(6) THE OPERATOR proposes to tolerate up to 0.4% of reflected power, which leads to a maximum return loss of -24.3 dB. Table 1 : Return Loss versus VSWR
VSWR Reflec. Coef Return Loss % Power Transmitted % Power Reflected
1 0,000 Infinity 100,0% 0,0% 1,01 0,005 46,06 100,0% 0,0% 1,02 0,010 40,09 100,0% 0,0% 1,03 0,015 36,61 100,0% 0,0% 1,04 0,020 34,15 100,0% 0,0% 1,05 0,024 32,26 99,9% 0,1% 1,06 0,029 30,71 99,9% 0,1% 1,07 0,034 29,42 99,9% 0,1% 1,08 0,038 28,30 99,9% 0,1% 1,09 0,043 27,32 99,8% 0,2% 1,1 0,048 26,44 99,8% 0,2% 1,11 0,052 25,66 99,7% 0,3% 1,12 0,057 24,94 99,7% 0,3%
Strictly Confidential _________________________________________________________________________________6/10

Key words : Return Loss, Antenna, Connectors, Feeder__________________________________________________________
1,13 0,061 24,29 99,6% 0,4% 1,14 0,065 23,69 99,6% 0,4% 1,15 0,070 23,13 99,5% 0,5% 1,16 0,074 22,61 99,5% 0,5% 1,17 0,078 22,12 99,4% 0,6% 1,18 0,083 21,66 99,3% 0,7% 1,19 0,087 21,23 99,2% 0,8% 1,2 0,091 20,83 99,2% 0,8% 1,21 0,095 20,44 99,1% 0,9% 1,22 0,099 20,08 99,0% 1,0% 1,23 0,103 19,73 98,9% 1,1% 1,24 0,107 19,40 98,9% 1,1% 1,25 0,111 19,08 98,8% 1,2% 1,26 0,115 18,78 98,7% 1,3% 1,27 0,119 18,49 98,6% 1,4% 1,28 0,123 18,22 98,5% 1,5% 1,29 0,127 17,95 98,4% 1,6% 1,3 0,130 17,69 98,3% 1,7% 1,31 0,134 17,45 98,2% 1,8% 1,32 0,138 17,21 98,1% 1,9% 1,33 0,142 16,98 98,0% 2,0% 1,34 0,145 16,75 97,9% 2,1% 1,35 0,149 16,54 97,8% 2,2% 1,36 0,153 16,33 97,7% 2,3% 1,37 0,156 16,13 97,6% 2,4% 1,38 0,160 15,94 97,5% 2,5% 1,39 0,163 15,75 97,3% 2,7% 1,4 0,167 15,56 97,2% 2,8% Note : A VSWR of 1.13 is an acceptable figure and this will not lead to any problem in DL transmission. 4.5. Coax and a Matched Load In theory, a matched load produces no standing waves. In practice this is never true. According to measurements the response is also oscillating (resonance) and therefore frequency-dependent. This is due to external noise which leads to this random behaviour. Only inside anechoic chambers the problem can be solved. 4.6. Coax and an Antenna The most relevant and important measurement is the Return Loss with an antenna connected. Within THE OPERATOR the following antennas will be used : Antenna Type Maximum VSWR Maximum Return Loss
Thales 2209 1.4 : 1 -15.56 dB Kathrein 742 233 1.5 : 1 -13.98 dB Kathrein 742 211 1.4 : 1 -15.56 dB
The overall set up is shown on ANNEX 1.
Strictly Confidential _________________________________________________________________________________7/10
Key words : Return Loss, Antenna, Connectors, Feeder__________________________________________________________
4.7. Feeder Loss Measurement Feeder loss measurements are very important. This guarantees that the measured value SHALL be the value the Planning Tool will be using. Besides, this is a double-check of the values given by the coax cable manufacturer, for a given length. 5. Concluding Recommendations According to the abovementioned measurement sets described in Section 4.1. THE OPERATOR proposes to keep the following measurements and discard the remaining ones: a) Feeder Loss Measurement is of evident importance c) Frequency Domain Return Loss with a Matched Load to check the overall Return Loss d) Distance to Fault Return Loss : Allows to check each connector status (useful during site maintenance) e) Frequency domain Return Loss Measurement for the complete set (including antenna). This is the most important and most relevant one because it encompasses the whole elements (Connectors, feeders, antenna). Instead of 6 measurements, THE OPERATOR proposes only 4 most important Site Master Measurements without jeopardizing the quality of the transmission line + antenna system to be deployed.
6. Technical References [1] Site Master User’s Manual, www.anritsu.com [2] Bill JAUCHLER, “Return Loss Testing in the Field”, EMS Wireless Technical Support. [3] Alpha Industries, “Return Loss Table”, www.alphaind.com [4] Hatem MOKHTARI, Alain NYECK, Catherine and Andre TOSSER-ROUSSEY, “Finite Difference Method and Pspice Simulation Applied to the Coaxial Cable in a Linear Temperature Gradient”, IEE Proceedings-A, Vol. 139, No. 1, pp. 39-41, January, 1992. [5] Hatem MOKHTARI, Catherine and Andre TOSSER-ROUSSEY, “Thermal Fault Temperature Measurement Along a Coaxial Cable Using the Finite Difference Method Applied to the Electromagnetic Wave Propagation Equation”, 8th International Conference on CAD/CAM, August 1992, Metz, France
Strictly Confidential _________________________________________________________________________________8/10

Key words : Return Loss, Antenna, Connectors, Feeder__________________________________________________________
ANNEX 1
SITE MASTER MEASUREMENT SETUP
Top-Jumper
Feeder
4
3
Antenna
2 1 Bottom-Jumper
r
Strictly Confidential ______________
To Site Master Connecto
___________________________________________________________________9/10