site map - gis.macombgov.org
TRANSCRIPT

Site MapChesterfield Town CenterI 94, Chesterfield, MI, 48047 Latitude: 42.63023Ring: 3, 5, 10 Miles Longitude: -82.84949
September 23, 2013
Made with Esri Business Analyst©2013 Esri www.esri.com/ba 800-447-9778 Try it Now! Page 1 of 1
Executive SummaryChesterfield Town CenterI 94, Chesterfield, MI, 48047 Latitude: 42.63023Ring: 3 mile radius Longitude: -82.84949
3 miles 5 miles 10 milesPopulation
2000 Population 40,408 127,979 430,119
2010 Population 42,556 147,614 473,300
2012 Population 42,346 147,615 473,186
2017 Population 42,170 147,757 473,462
2000-2010 Annual Rate 0.52% 1.44% 0.96%
2010-2012 Annual Rate -0.22% 0.00% -0.01%
2012-2017 Annual Rate -0.08% 0.02% 0.01%2012 Male Population 50.4% 49.4% 48.6%2012 Female Population 49.6% 50.6% 51.4%2012 Median Age 38.5 38.8 40.3
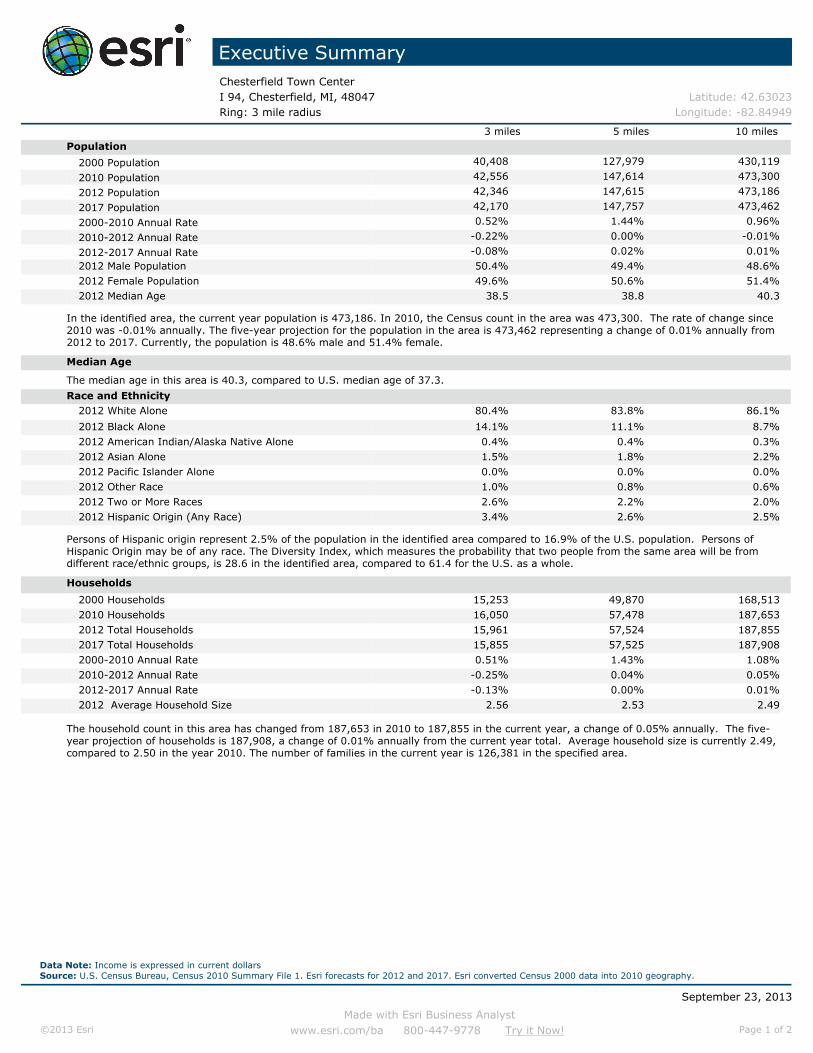
In the identified area, the current year population is 473,186. In 2010, the Census count in the area was 473,300. The rate of change since2010 was -0.01% annually. The five-year projection for the population in the area is 473,462 representing a change of 0.01% annually from2012 to 2017. Currently, the population is 48.6% male and 51.4% female.
Median Age
The median age in this area is 40.3, compared to U.S. median age of 37.3.
Race and Ethnicity2012 White Alone 80.4% 83.8% 86.1%
2012 Black Alone 14.1% 11.1% 8.7%2012 American Indian/Alaska Native Alone 0.4% 0.4% 0.3%2012 Asian Alone 1.5% 1.8% 2.2%2012 Pacific Islander Alone 0.0% 0.0% 0.0%2012 Other Race 1.0% 0.8% 0.6%2012 Two or More Races 2.6% 2.2% 2.0%2012 Hispanic Origin (Any Race) 3.4% 2.6% 2.5%
Persons of Hispanic origin represent 2.5% of the population in the identified area compared to 16.9% of the U.S. population. Persons ofHispanic Origin may be of any race. The Diversity Index, which measures the probability that two people from the same area will be fromdifferent race/ethnic groups, is 28.6 in the identified area, compared to 61.4 for the U.S. as a whole.
Households
2000 Households 15,253 49,870 168,5132010 Households 16,050 57,478 187,6532012 Total Households 15,961 57,524 187,8552017 Total Households 15,855 57,525 187,9082000-2010 Annual Rate 0.51% 1.43% 1.08%2010-2012 Annual Rate -0.25% 0.04% 0.05%2012-2017 Annual Rate -0.13% 0.00% 0.01%2012 Average Household Size 2.56 2.53 2.49
The household count in this area has changed from 187,653 in 2010 to 187,855 in the current year, a change of 0.05% annually. The five-year projection of households is 187,908, a change of 0.01% annually from the current year total. Average household size is currently 2.49,compared to 2.50 in the year 2010. The number of families in the current year is 126,381 in the specified area.
September 23, 2013
Made with Esri Business Analyst©2013 Esri www.esri.com/ba 800-447-9778 Try it Now! Page 1 of 2
Data Note: Income is expressed in current dollarsSource: U.S. Census Bureau, Census 2010 Summary File 1. Esri forecasts for 2012 and 2017. Esri converted Census 2000 data into 2010 geography.
Executive SummaryChesterfield Town CenterI 94, Chesterfield, MI, 48047 Latitude: 42.63023Ring: 10 mile radius Longitude: -82.84949
3 miles 5 miles 10 milesMedian Household Income
2012 Median Household Income $48,392 $54,771 $53,3642017 Median Household Income $55,449 $61,576 $59,8262012-2017 Annual Rate 2.76% 2.37% 2.31%
Average Household Income
2012 Average Household Income $61,122 $68,514 $66,6562017 Average Household Income $67,158 $74,953 $73,0492012-2017 Annual Rate 1.90% 1.81% 1.85%
Per Capita Income
2012 Per Capita Income $24,116 $27,024 $26,7622017 Per Capita Income $26,370 $29,512 $29,3022012-2017 Annual Rate 1.80% 1.78% 1.83%
Households by Income
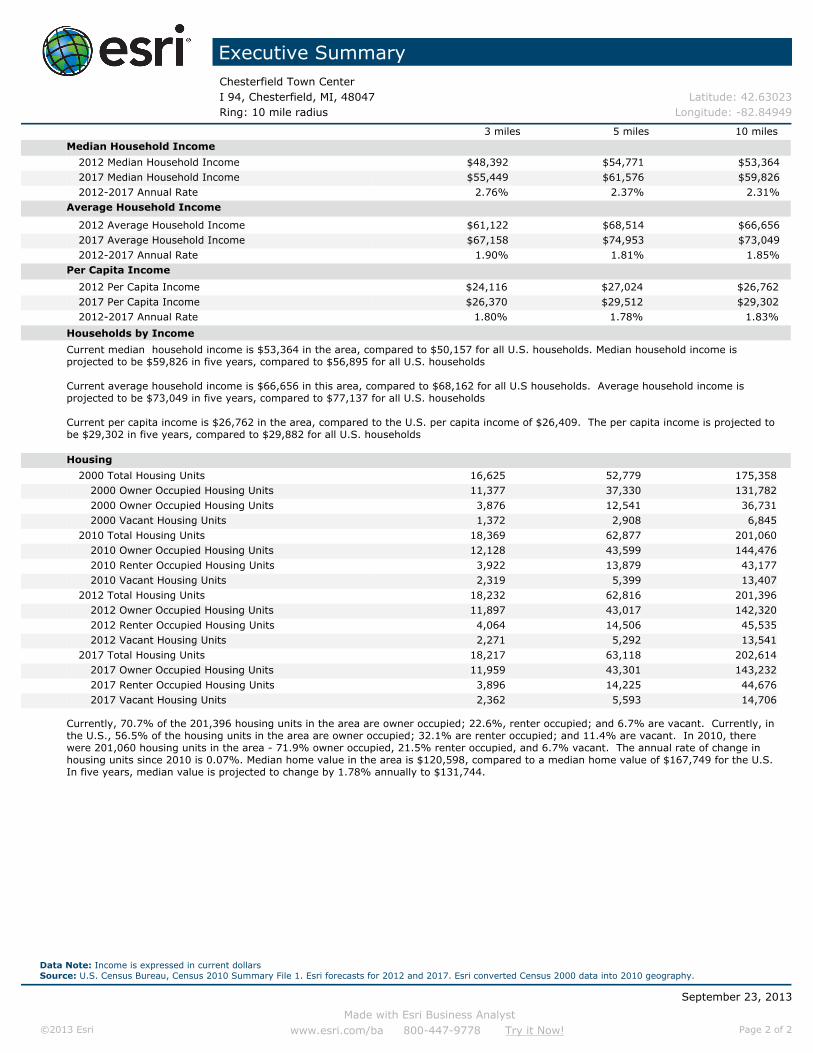
Current median household income is $53,364 in the area, compared to $50,157 for all U.S. households. Median household income isprojected to be $59,826 in five years, compared to $56,895 for all U.S. households
Current average household income is $66,656 in this area, compared to $68,162 for all U.S households. Average household income isprojected to be $73,049 in five years, compared to $77,137 for all U.S. households
Current per capita income is $26,762 in the area, compared to the U.S. per capita income of $26,409. The per capita income is projected tobe $29,302 in five years, compared to $29,882 for all U.S. households Housing
2000 Total Housing Units 16,625 52,779 175,3582000 Owner Occupied Housing Units 11,377 37,330 131,7822000 Owner Occupied Housing Units 3,876 12,541 36,7312000 Vacant Housing Units 1,372 2,908 6,845
2010 Total Housing Units 18,369 62,877 201,0602010 Owner Occupied Housing Units 12,128 43,599 144,4762010 Renter Occupied Housing Units 3,922 13,879 43,1772010 Vacant Housing Units 2,319 5,399 13,407
2012 Total Housing Units 18,232 62,816 201,3962012 Owner Occupied Housing Units 11,897 43,017 142,3202012 Renter Occupied Housing Units 4,064 14,506 45,5352012 Vacant Housing Units 2,271 5,292 13,541
2017 Total Housing Units 18,217 63,118 202,6142017 Owner Occupied Housing Units 11,959 43,301 143,2322017 Renter Occupied Housing Units 3,896 14,225 44,6762017 Vacant Housing Units 2,362 5,593 14,706
Currently, 70.7% of the 201,396 housing units in the area are owner occupied; 22.6%, renter occupied; and 6.7% are vacant. Currently, inthe U.S., 56.5% of the housing units in the area are owner occupied; 32.1% are renter occupied; and 11.4% are vacant. In 2010, therewere 201,060 housing units in the area - 71.9% owner occupied, 21.5% renter occupied, and 6.7% vacant. The annual rate of change inhousing units since 2010 is 0.07%. Median home value in the area is $120,598, compared to a median home value of $167,749 for the U.S.In five years, median value is projected to change by 1.78% annually to $131,744.
September 23, 2013
Made with Esri Business Analyst©2013 Esri www.esri.com/ba 800-447-9778 Try it Now! Page 2 of 2
Data Note: Income is expressed in current dollarsSource: U.S. Census Bureau, Census 2010 Summary File 1. Esri forecasts for 2012 and 2017. Esri converted Census 2000 data into 2010 geography.

Demographic and Income ProfileChesterfield Town CenterI 94, Chesterfield, MI, 48047 Latitude: 42.63023Ring: 3 mile radius Longitude: -82.84949
Summary Census 2010 2012 2017Population 42,556 42,346 42,170Households 16,050 15,961 15,855Families 10,776 10,718 10,556Average Household Size 2.56 2.56 2.57Owner Occupied Housing Units 12,128 11,897 11,959Renter Occupied Housing Units 3,922 4,064 3,896Median Age 38.2 38.5 38.7
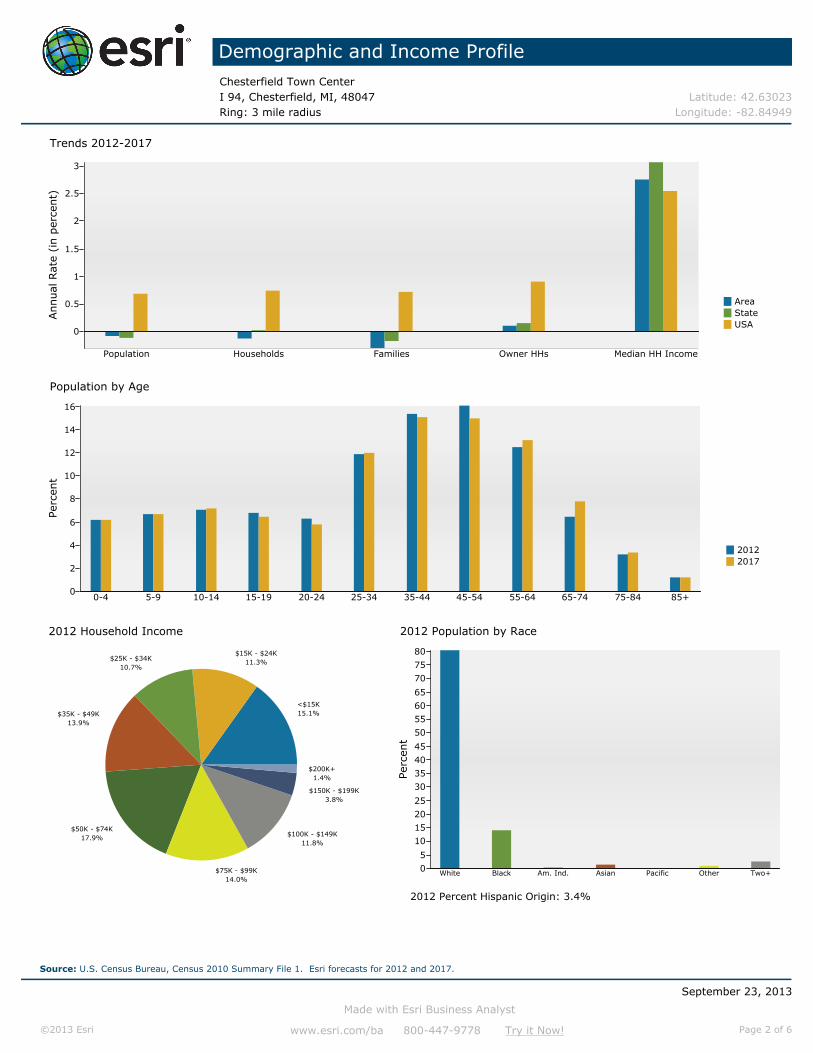
Trends: 2012 - 2017 Annual Rate Area State NationalPopulation -0.08% -0.12% 0.68%Households -0.13% 0.03% 0.74%Families -0.30% -0.17% 0.72%Owner HHs 0.10% 0.15% 0.91%Median Household Income 2.76% 3.07% 2.55%
2012 2017 Households by Income Number Percent Number Percent
<$15,000 2,413 15.1% 2,236 14.1%$15,000 - $24,999 1,809 11.3% 1,329 8.4%$25,000 - $34,999 1,715 10.7% 1,285 8.1%$35,000 - $49,999 2,225 13.9% 2,081 13.1%$50,000 - $74,999 2,852 17.9% 3,315 20.9%$75,000 - $99,999 2,239 14.0% 2,650 16.7%$100,000 - $149,999 1,878 11.8% 2,037 12.8%$150,000 - $199,999 603 3.8% 673 4.2%$200,000+ 227 1.4% 250 1.6%
Median Household Income $48,392 $55,449Average Household Income $61,122 $67,158Per Capita Income $24,116 $26,370
Census 2010 2012 2017 Population by Age Number Percent Number Percent Number Percent
0 - 4 2,652 6.2% 2,616 6.2% 2,601 6.2%5 - 9 2,878 6.8% 2,858 6.7% 2,846 6.7%10 - 14 3,081 7.2% 3,024 7.1% 3,045 7.2%15 - 19 3,047 7.2% 2,896 6.8% 2,760 6.5%20 - 24 2,639 6.2% 2,653 6.3% 2,425 5.8%25 - 34 4,960 11.7% 5,022 11.9% 5,040 12.0%35 - 44 6,670 15.7% 6,505 15.4% 6,356 15.1%45 - 54 7,062 16.6% 6,833 16.1% 6,332 15.0%55 - 64 5,088 12.0% 5,301 12.5% 5,523 13.1%
65 - 74 2,606 6.1% 2,765 6.5% 3,292 7.8%75 - 84 1,384 3.3% 1,368 3.2% 1,424 3.4%
85+ 487 1.1% 506 1.2% 526 1.2%Census 2010 2012 2017
Race and Ethnicity Number Percent Number Percent Number PercentWhite Alone 34,958 82.1% 34,042 80.4% 31,676 75.1%Black Alone 5,375 12.6% 5,984 14.1% 7,948 18.8%American Indian Alone 161 0.4% 168 0.4% 187 0.4%Asian Alone 572 1.3% 615 1.5% 708 1.7%Pacific Islander Alone 14 0.0% 14 0.0% 18 0.0%Some Other Race Alone 428 1.0% 440 1.0% 479 1.1%Two or More Races 1,048 2.5% 1,083 2.6% 1,154 2.7%
Hispanic Origin (Any Race) 1,364 3.2% 1,432 3.4% 1,628 3.9%Data Note: Income is expressed in current dollars.
September 23, 2013
Made with Esri Business Analyst
©2013 Esri www.esri.com/ba 800-447-9778 Try it Now! Page 1 of 6
Source: U.S. Census Bureau, Census 2010 Summary File 1. Esri forecasts for 2012 and 2017.
Demographic and Income ProfileChesterfield Town CenterI 94, Chesterfield, MI, 48047 Latitude: 42.63023Ring: 3 mile radius Longitude: -82.84949
AreaStateUSA
Trends 2012-2017
Population Households Families Owner HHs Median HH Income
Annual
Rat
e (i
n p
erce
nt)
3
2.5
2
1.5
1
0.5
0
20122017
Population by Age
0-4 5-9 10-14 15-19 20-24 25-34 35-44 45-54 55-64 65-74 75-84 85+
Perc
ent
16
14
12
10
8
6
4
2
0
2012 Household Income
<$15K15.1%
$15K - $24K11.3%$25K - $34K
10.7%
$35K - $49K13.9%
$50K - $74K17.9%
$75K - $99K14.0%
$100K - $149K11.8%
$150K - $199K3.8%
$200K+1.4%
2012 Population by Race
White Black Am. Ind. Asian Pacific Other Two+
Perc
ent
80
75
70
65
60
55
50
45
40
35
30
25
20
15
10
5
0
2012 Percent Hispanic Origin: 3.4%
September 23, 2013
Made with Esri Business Analyst
©2013 Esri www.esri.com/ba 800-447-9778 Try it Now! Page 2 of 6
Source: U.S. Census Bureau, Census 2010 Summary File 1. Esri forecasts for 2012 and 2017.
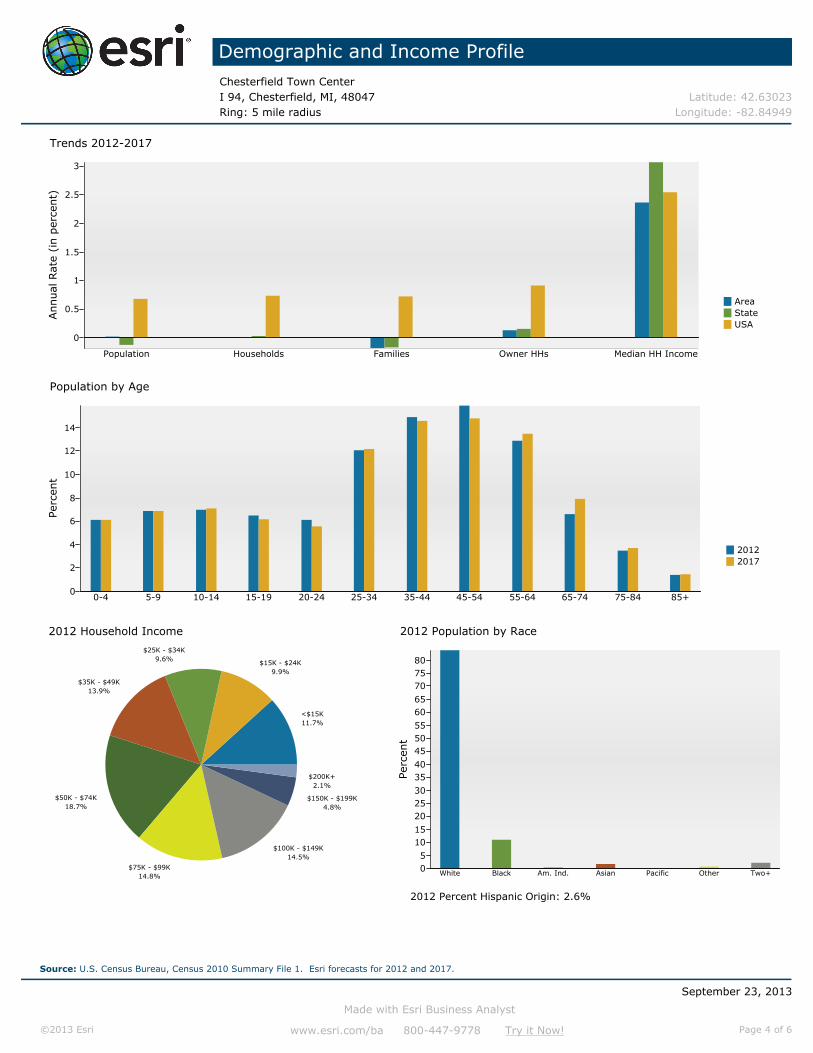
Demographic and Income ProfileChesterfield Town CenterI 94, Chesterfield, MI, 48047 Latitude: 42.63023Ring: 5 mile radius Longitude: -82.84949
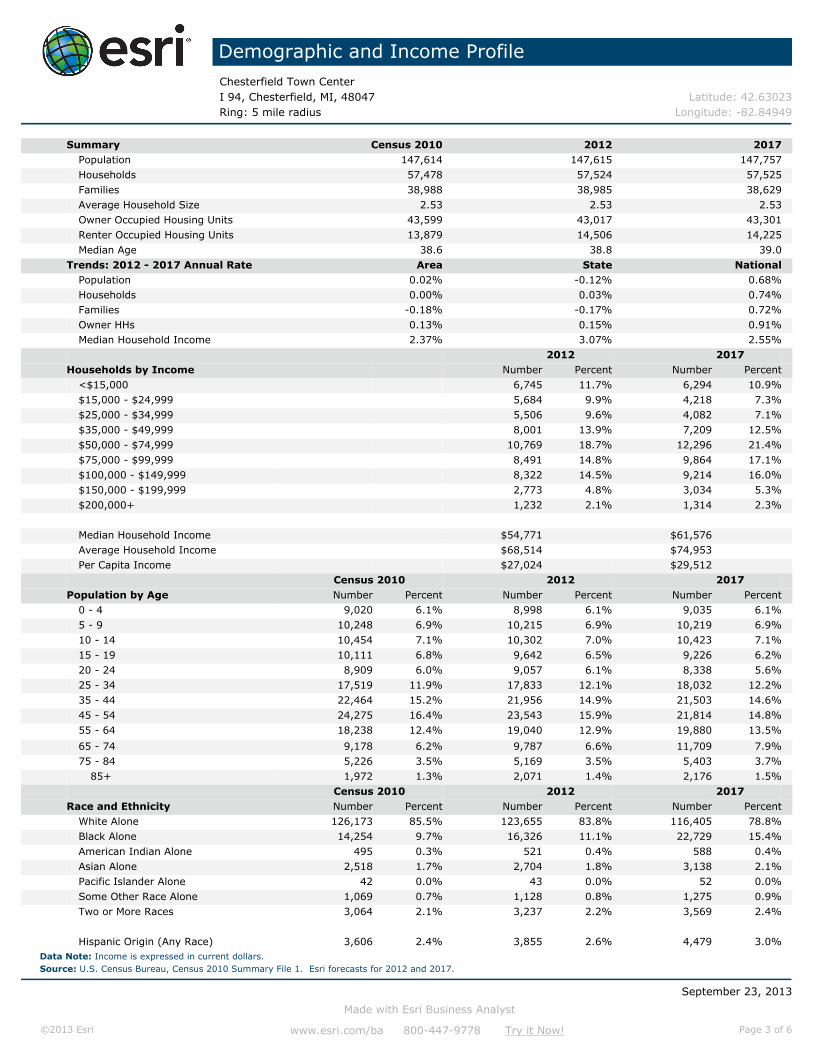
Summary Census 2010 2012 2017Population 147,614 147,615 147,757Households 57,478 57,524 57,525Families 38,988 38,985 38,629Average Household Size 2.53 2.53 2.53Owner Occupied Housing Units 43,599 43,017 43,301Renter Occupied Housing Units 13,879 14,506 14,225Median Age 38.6 38.8 39.0
Trends: 2012 - 2017 Annual Rate Area State NationalPopulation 0.02% -0.12% 0.68%Households 0.00% 0.03% 0.74%Families -0.18% -0.17% 0.72%Owner HHs 0.13% 0.15% 0.91%Median Household Income 2.37% 3.07% 2.55%
2012 2017 Households by Income Number Percent Number Percent
<$15,000 6,745 11.7% 6,294 10.9%$15,000 - $24,999 5,684 9.9% 4,218 7.3%$25,000 - $34,999 5,506 9.6% 4,082 7.1%$35,000 - $49,999 8,001 13.9% 7,209 12.5%$50,000 - $74,999 10,769 18.7% 12,296 21.4%$75,000 - $99,999 8,491 14.8% 9,864 17.1%$100,000 - $149,999 8,322 14.5% 9,214 16.0%$150,000 - $199,999 2,773 4.8% 3,034 5.3%$200,000+ 1,232 2.1% 1,314 2.3%
Median Household Income $54,771 $61,576Average Household Income $68,514 $74,953Per Capita Income $27,024 $29,512
Census 2010 2012 2017 Population by Age Number Percent Number Percent Number Percent
0 - 4 9,020 6.1% 8,998 6.1% 9,035 6.1%5 - 9 10,248 6.9% 10,215 6.9% 10,219 6.9%10 - 14 10,454 7.1% 10,302 7.0% 10,423 7.1%15 - 19 10,111 6.8% 9,642 6.5% 9,226 6.2%20 - 24 8,909 6.0% 9,057 6.1% 8,338 5.6%25 - 34 17,519 11.9% 17,833 12.1% 18,032 12.2%35 - 44 22,464 15.2% 21,956 14.9% 21,503 14.6%45 - 54 24,275 16.4% 23,543 15.9% 21,814 14.8%55 - 64 18,238 12.4% 19,040 12.9% 19,880 13.5%
65 - 74 9,178 6.2% 9,787 6.6% 11,709 7.9%75 - 84 5,226 3.5% 5,169 3.5% 5,403 3.7%
85+ 1,972 1.3% 2,071 1.4% 2,176 1.5%Census 2010 2012 2017
Race and Ethnicity Number Percent Number Percent Number PercentWhite Alone 126,173 85.5% 123,655 83.8% 116,405 78.8%Black Alone 14,254 9.7% 16,326 11.1% 22,729 15.4%American Indian Alone 495 0.3% 521 0.4% 588 0.4%Asian Alone 2,518 1.7% 2,704 1.8% 3,138 2.1%Pacific Islander Alone 42 0.0% 43 0.0% 52 0.0%Some Other Race Alone 1,069 0.7% 1,128 0.8% 1,275 0.9%Two or More Races 3,064 2.1% 3,237 2.2% 3,569 2.4%
Hispanic Origin (Any Race) 3,606 2.4% 3,855 2.6% 4,479 3.0%Data Note: Income is expressed in current dollars.
September 23, 2013
Made with Esri Business Analyst
©2013 Esri www.esri.com/ba 800-447-9778 Try it Now! Page 3 of 6
Source: U.S. Census Bureau, Census 2010 Summary File 1. Esri forecasts for 2012 and 2017.
Demographic and Income ProfileChesterfield Town CenterI 94, Chesterfield, MI, 48047 Latitude: 42.63023Ring: 5 mile radius Longitude: -82.84949
AreaStateUSA
Trends 2012-2017
Population Households Families Owner HHs Median HH Income
Annual
Rat
e (i
n p
erce
nt)
3
2.5
2
1.5
1
0.5
0
20122017
Population by Age
0-4 5-9 10-14 15-19 20-24 25-34 35-44 45-54 55-64 65-74 75-84 85+
Perc
ent
14
12
10
8
6
4
2
0
2012 Household Income
<$15K11.7%
$15K - $24K9.9%
$25K - $34K9.6%
$35K - $49K13.9%
$50K - $74K18.7%
$75K - $99K14.8%
$100K - $149K14.5%
$150K - $199K4.8%
$200K+2.1%
2012 Population by Race
White Black Am. Ind. Asian Pacific Other Two+
Perc
ent
807570
6560
555045
4035
302520
1510
50
2012 Percent Hispanic Origin: 2.6%
September 23, 2013
Made with Esri Business Analyst
©2013 Esri www.esri.com/ba 800-447-9778 Try it Now! Page 4 of 6
Source: U.S. Census Bureau, Census 2010 Summary File 1. Esri forecasts for 2012 and 2017.

Demographic and Income ProfileChesterfield Town CenterI 94, Chesterfield, MI, 48047 Latitude: 42.63023Ring: 10 mile radius Longitude: -82.84949
Summary Census 2010 2012 2017Population 473,300 473,186 473,462Households 187,653 187,855 187,908Families 126,388 126,381 125,193Average Household Size 2.50 2.49 2.49Owner Occupied Housing Units 144,476 142,320 143,232Renter Occupied Housing Units 43,177 45,535 44,676Median Age 40.0 40.3 40.6
Trends: 2012 - 2017 Annual Rate Area State NationalPopulation 0.01% -0.12% 0.68%Households 0.01% 0.03% 0.74%Families -0.19% -0.17% 0.72%Owner HHs 0.13% 0.15% 0.91%Median Household Income 2.31% 3.07% 2.55%
2012 2017 Households by Income Number Percent Number Percent
<$15,000 21,923 11.7% 20,468 10.9%$15,000 - $24,999 19,864 10.6% 14,859 7.9%$25,000 - $34,999 18,933 10.1% 14,343 7.6%$35,000 - $49,999 26,285 14.0% 23,712 12.6%$50,000 - $74,999 36,081 19.2% 41,313 22.0%$75,000 - $99,999 26,478 14.1% 31,058 16.5%$100,000 - $149,999 26,757 14.2% 29,092 15.5%$150,000 - $199,999 7,873 4.2% 9,147 4.9%$200,000+ 3,661 1.9% 3,914 2.1%
Median Household Income $53,364 $59,826Average Household Income $66,656 $73,049Per Capita Income $26,762 $29,302
Census 2010 2012 2017 Population by Age Number Percent Number Percent Number Percent
0 - 4 27,259 5.8% 27,186 5.7% 27,195 5.7%5 - 9 30,255 6.4% 30,069 6.4% 29,947 6.3%10 - 14 32,164 6.8% 31,618 6.7% 31,855 6.7%15 - 19 31,603 6.7% 30,097 6.4% 28,689 6.1%20 - 24 27,317 5.8% 27,784 5.9% 25,506 5.4%25 - 34 55,602 11.7% 56,520 11.9% 56,893 12.0%35 - 44 68,512 14.5% 66,732 14.1% 65,097 13.7%45 - 54 75,472 15.9% 73,120 15.5% 67,487 14.3%55 - 64 59,551 12.6% 62,057 13.1% 64,561 13.6%
65 - 74 34,267 7.2% 36,459 7.7% 43,462 9.2%75 - 84 21,643 4.6% 21,433 4.5% 22,210 4.7%
85+ 9,653 2.0% 10,112 2.1% 10,559 2.2%Census 2010 2012 2017
Race and Ethnicity Number Percent Number Percent Number PercentWhite Alone 414,587 87.6% 407,501 86.1% 387,249 81.8%Black Alone 35,533 7.5% 41,026 8.7% 58,107 12.3%American Indian Alone 1,459 0.3% 1,534 0.3% 1,735 0.4%Asian Alone 9,839 2.1% 10,513 2.2% 12,131 2.6%Pacific Islander Alone 96 0.0% 99 0.0% 117 0.0%Some Other Race Alone 2,755 0.6% 2,923 0.6% 3,356 0.7%Two or More Races 9,031 1.9% 9,590 2.0% 10,768 2.3%
Hispanic Origin (Any Race) 10,834 2.3% 11,628 2.5% 13,645 2.9%Data Note: Income is expressed in current dollars.
September 23, 2013
Made with Esri Business Analyst
©2013 Esri www.esri.com/ba 800-447-9778 Try it Now! Page 5 of 6
Source: U.S. Census Bureau, Census 2010 Summary File 1. Esri forecasts for 2012 and 2017.

Demographic and Income ProfileChesterfield Town CenterI 94, Chesterfield, MI, 48047 Latitude: 42.63023Ring: 10 mile radius Longitude: -82.84949
AreaStateUSA
Trends 2012-2017
Population Households Families Owner HHs Median HH Income
Annual
Rat
e (i
n p
erce
nt)
3
2.5
2
1.5
1
0.5
0
20122017
Population by Age
0-4 5-9 10-14 15-19 20-24 25-34 35-44 45-54 55-64 65-74 75-84 85+
Perc
ent
14
12
10
8
6
4
2
0
2012 Household Income
<$15K11.7%
$15K - $24K10.6%
$25K - $34K10.1%
$35K - $49K14.0%
$50K - $74K19.2%
$75K - $99K14.1%
$100K - $149K14.2%
$150K - $199K4.2%
$200K+1.9%
2012 Population by Race
White Black Am. Ind. Asian Pacific Other Two+
Perc
ent
8580757065605550454035302520151050
2012 Percent Hispanic Origin: 2.5%
September 23, 2013
Made with Esri Business Analyst
©2013 Esri www.esri.com/ba 800-447-9778 Try it Now! Page 6 of 6
Source: U.S. Census Bureau, Census 2010 Summary File 1. Esri forecasts for 2012 and 2017.

Housing ProfileChesterfield Town CenterI 94, Chesterfield, MI, 48047 Latitude: 42.63023Ring: 3 mile radius Longitude: -82.84949
Population Households2010 Total Population 42,556 2012 Median Household Income $48,3922012 Total Population 42,346 2017 Median Household Income $55,4492017 Total Population 42,170 2012-2017 Annual Rate 2.76%2012-2017 Annual Rate -0.08%
Census 2010 2012 2017Housing Units by Occupancy Status and Tenure Number Percent Number Percent Number Percent
Total Housing Units 18,369 100.0% 18,232 100.0% 18,217 100.0%Occupied 16,050 87.4% 15,961 87.5% 15,855 87.0%
Owner 12,128 66.0% 11,897 65.3% 11,959 65.6%Renter 3,922 21.4% 4,064 22.3% 3,896 21.4%
Vacant 2,319 12.6% 2,271 12.5% 2,362 13.0%
2012 2017Owner Occupied Housing Units by Value Number Percent Number Percent
Total 11,897 100.0% 11,959 100.0%<$50,000 1,003 8.4% 509 4.3%$50,000-$99,999 3,332 28.0% 2,769 23.2%$100,000-$149,999 5,025 42.2% 4,987 41.7%$150,000-$199,999 1,748 14.7% 2,653 22.2%$200,000-$249,999 553 4.6% 789 6.6%
$250,000-$299,999 149 1.3% 161 1.3%$300,000-$399,999 70 0.6% 75 0.6%$400,000-$499,999 7 0.1% 6 0.1%$500,000-$749,999 9 0.1% 9 0.1%$750,000-$999,999 1 0.0% 1 0.0%$1,000,000+ 0 0.0% 0 0.0%
Median Value $116,059 $127,083Average Value $118,434 $130,910
Source: U.S. Census Bureau, Census 2010 Summary File 1. Esri forecasts for 2012 and 2017.
September 23, 2013
Made with Esri Business Analyst©2013 Esri www.esri.com/ba 800-447-9778 Try it Now! Page 1 of 6
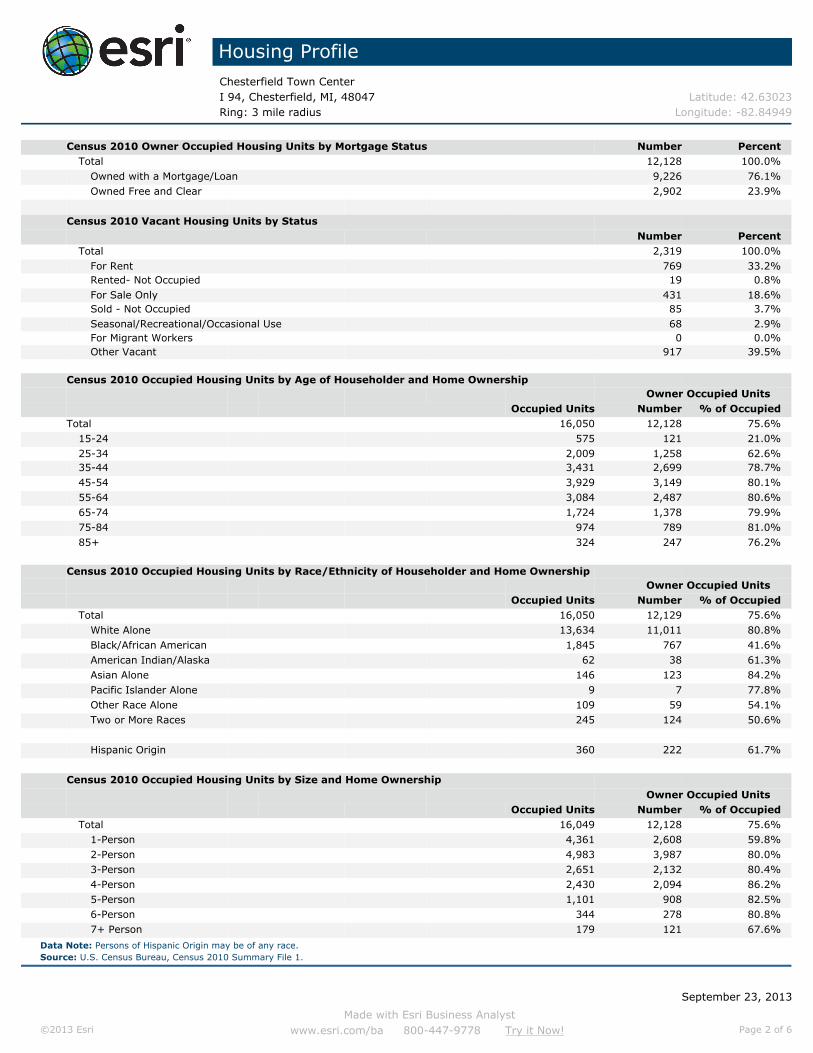
Housing ProfileChesterfield Town CenterI 94, Chesterfield, MI, 48047 Latitude: 42.63023Ring: 3 mile radius Longitude: -82.84949
Census 2010 Owner Occupied Housing Units by Mortgage Status Number PercentTotal 12,128 100.0%
Owned with a Mortgage/Loan 9,226 76.1%Owned Free and Clear 2,902 23.9%
Census 2010 Vacant Housing Units by StatusNumber Percent
Total 2,319 100.0%For Rent 769 33.2%Rented- Not Occupied 19 0.8%For Sale Only 431 18.6%Sold - Not Occupied 85 3.7%Seasonal/Recreational/Occasional Use 68 2.9%For Migrant Workers 0 0.0%Other Vacant 917 39.5%
Census 2010 Occupied Housing Units by Age of Householder and Home Ownership Owner Occupied Units
Occupied Units Number % of OccupiedTotal 16,050 12,128 75.6%
15-24 575 121 21.0%25-34 2,009 1,258 62.6%35-44 3,431 2,699 78.7%45-54 3,929 3,149 80.1%55-64 3,084 2,487 80.6%65-74 1,724 1,378 79.9%75-84 974 789 81.0%85+ 324 247 76.2%
Census 2010 Occupied Housing Units by Race/Ethnicity of Householder and Home Ownership Owner Occupied Units
Occupied Units Number % of OccupiedTotal 16,050 12,129 75.6%
White Alone 13,634 11,011 80.8%Black/African American 1,845 767 41.6%American Indian/Alaska 62 38 61.3%Asian Alone 146 123 84.2%Pacific Islander Alone 9 7 77.8%Other Race Alone 109 59 54.1%Two or More Races 245 124 50.6%
Hispanic Origin 360 222 61.7%
Census 2010 Occupied Housing Units by Size and Home Ownership Owner Occupied Units
Occupied Units Number % of OccupiedTotal 16,049 12,128 75.6%
1-Person 4,361 2,608 59.8%2-Person 4,983 3,987 80.0%3-Person 2,651 2,132 80.4%4-Person 2,430 2,094 86.2%5-Person 1,101 908 82.5%6-Person 344 278 80.8%7+ Person 179 121 67.6%
Data Note: Persons of Hispanic Origin may be of any race.Source: U.S. Census Bureau, Census 2010 Summary File 1.
September 23, 2013
Made with Esri Business Analyst©2013 Esri www.esri.com/ba 800-447-9778 Try it Now! Page 2 of 6
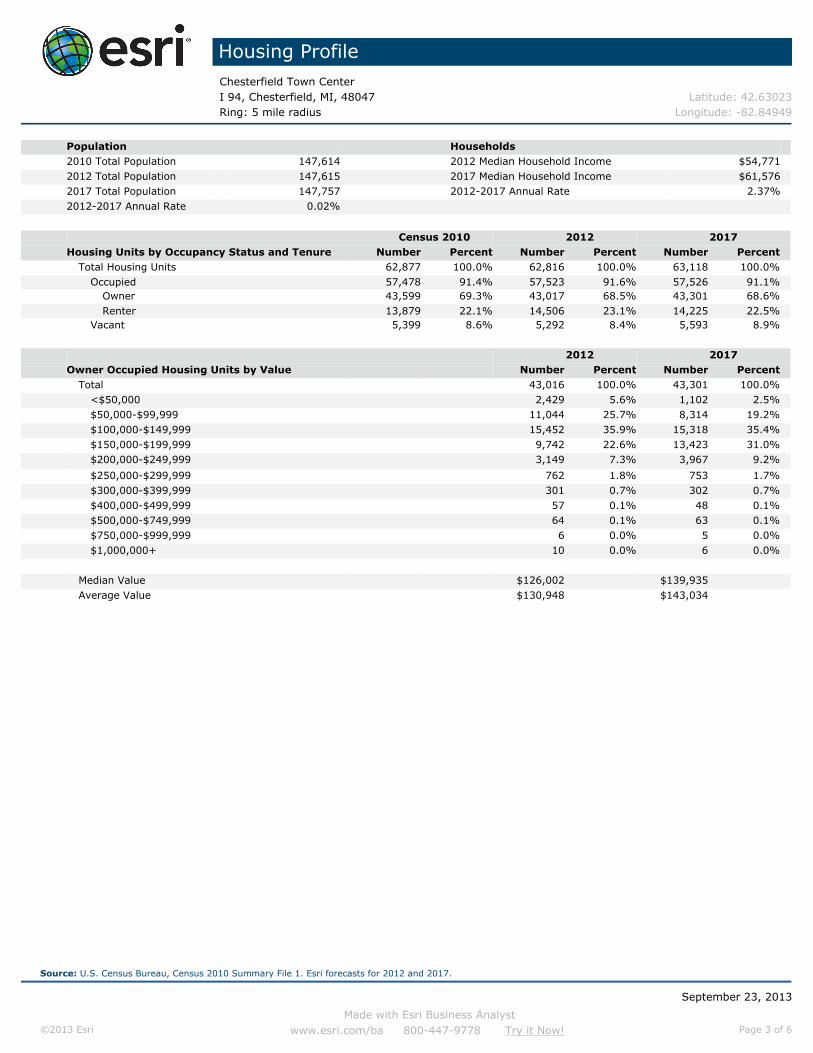
Housing ProfileChesterfield Town CenterI 94, Chesterfield, MI, 48047 Latitude: 42.63023Ring: 5 mile radius Longitude: -82.84949
Population Households2010 Total Population 147,614 2012 Median Household Income $54,7712012 Total Population 147,615 2017 Median Household Income $61,5762017 Total Population 147,757 2012-2017 Annual Rate 2.37%2012-2017 Annual Rate 0.02%
Census 2010 2012 2017Housing Units by Occupancy Status and Tenure Number Percent Number Percent Number Percent
Total Housing Units 62,877 100.0% 62,816 100.0% 63,118 100.0%Occupied 57,478 91.4% 57,523 91.6% 57,526 91.1%
Owner 43,599 69.3% 43,017 68.5% 43,301 68.6%Renter 13,879 22.1% 14,506 23.1% 14,225 22.5%
Vacant 5,399 8.6% 5,292 8.4% 5,593 8.9%
2012 2017Owner Occupied Housing Units by Value Number Percent Number Percent
Total 43,016 100.0% 43,301 100.0%<$50,000 2,429 5.6% 1,102 2.5%$50,000-$99,999 11,044 25.7% 8,314 19.2%$100,000-$149,999 15,452 35.9% 15,318 35.4%$150,000-$199,999 9,742 22.6% 13,423 31.0%$200,000-$249,999 3,149 7.3% 3,967 9.2%
$250,000-$299,999 762 1.8% 753 1.7%$300,000-$399,999 301 0.7% 302 0.7%$400,000-$499,999 57 0.1% 48 0.1%$500,000-$749,999 64 0.1% 63 0.1%$750,000-$999,999 6 0.0% 5 0.0%$1,000,000+ 10 0.0% 6 0.0%
Median Value $126,002 $139,935Average Value $130,948 $143,034
Source: U.S. Census Bureau, Census 2010 Summary File 1. Esri forecasts for 2012 and 2017.
September 23, 2013
Made with Esri Business Analyst©2013 Esri www.esri.com/ba 800-447-9778 Try it Now! Page 3 of 6

Housing ProfileChesterfield Town CenterI 94, Chesterfield, MI, 48047 Latitude: 42.63023Ring: 5 mile radius Longitude: -82.84949
Census 2010 Owner Occupied Housing Units by Mortgage Status Number PercentTotal 43,600 100.0%
Owned with a Mortgage/Loan 33,269 76.3%Owned Free and Clear 10,331 23.7%
Census 2010 Vacant Housing Units by StatusNumber Percent
Total 5,399 100.0%For Rent 2,084 38.6%Rented- Not Occupied 60 1.1%For Sale Only 1,207 22.4%Sold - Not Occupied 230 4.3%Seasonal/Recreational/Occasional Use 296 5.5%For Migrant Workers 0 0.0%Other Vacant 1,503 27.8%
Census 2010 Occupied Housing Units by Age of Householder and Home Ownership Owner Occupied Units
Occupied Units Number % of OccupiedTotal 57,478 43,600 75.9%
15-24 1,988 384 19.3%25-34 7,704 4,489 58.3%35-44 11,989 9,287 77.5%45-54 13,787 11,142 80.8%55-64 11,059 9,126 82.5%65-74 5,973 5,046 84.5%75-84 3,655 3,113 85.2%85+ 1,323 1,013 76.6%
Census 2010 Occupied Housing Units by Race/Ethnicity of Householder and Home Ownership Owner Occupied Units
Occupied Units Number % of OccupiedTotal 57,479 43,600 75.9%
White Alone 50,208 40,585 80.8%Black/African American 5,447 1,855 34.1%American Indian/Alaska 194 113 58.2%Asian Alone 678 548 80.8%Pacific Islander Alone 21 14 66.7%Other Race Alone 278 140 50.4%Two or More Races 653 345 52.8%
Hispanic Origin 983 602 61.2%
Census 2010 Occupied Housing Units by Size and Home Ownership Owner Occupied Units
Occupied Units Number % of OccupiedTotal 57,479 43,600 75.9%
1-Person 15,284 9,328 61.0%2-Person 18,361 14,497 79.0%3-Person 9,482 7,442 78.5%4-Person 8,826 7,696 87.2%5-Person 3,838 3,280 85.5%6-Person 1,161 963 82.9%7+ Person 527 394 74.8%
Data Note: Persons of Hispanic Origin may be of any race.Source: U.S. Census Bureau, Census 2010 Summary File 1.
September 23, 2013
Made with Esri Business Analyst©2013 Esri www.esri.com/ba 800-447-9778 Try it Now! Page 4 of 6
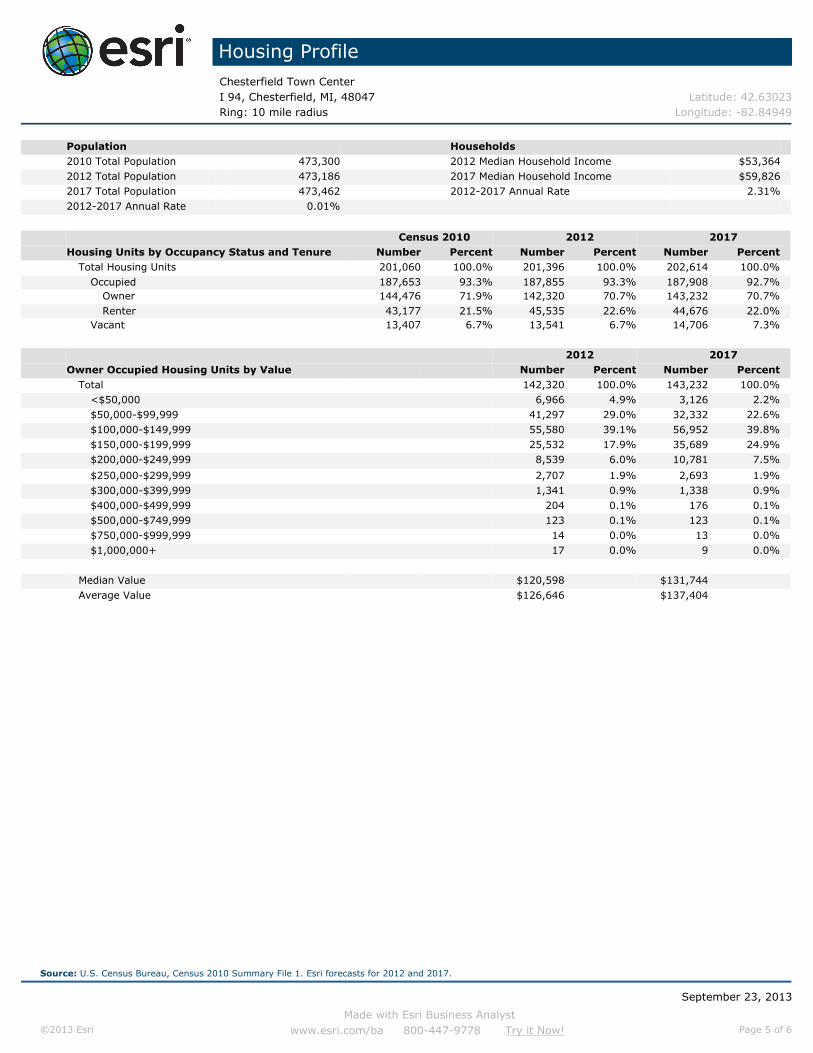
Housing ProfileChesterfield Town CenterI 94, Chesterfield, MI, 48047 Latitude: 42.63023Ring: 10 mile radius Longitude: -82.84949
Population Households2010 Total Population 473,300 2012 Median Household Income $53,3642012 Total Population 473,186 2017 Median Household Income $59,8262017 Total Population 473,462 2012-2017 Annual Rate 2.31%2012-2017 Annual Rate 0.01%
Census 2010 2012 2017Housing Units by Occupancy Status and Tenure Number Percent Number Percent Number Percent
Total Housing Units 201,060 100.0% 201,396 100.0% 202,614 100.0%Occupied 187,653 93.3% 187,855 93.3% 187,908 92.7%
Owner 144,476 71.9% 142,320 70.7% 143,232 70.7%Renter 43,177 21.5% 45,535 22.6% 44,676 22.0%
Vacant 13,407 6.7% 13,541 6.7% 14,706 7.3%
2012 2017Owner Occupied Housing Units by Value Number Percent Number Percent
Total 142,320 100.0% 143,232 100.0%<$50,000 6,966 4.9% 3,126 2.2%$50,000-$99,999 41,297 29.0% 32,332 22.6%$100,000-$149,999 55,580 39.1% 56,952 39.8%$150,000-$199,999 25,532 17.9% 35,689 24.9%$200,000-$249,999 8,539 6.0% 10,781 7.5%
$250,000-$299,999 2,707 1.9% 2,693 1.9%$300,000-$399,999 1,341 0.9% 1,338 0.9%$400,000-$499,999 204 0.1% 176 0.1%$500,000-$749,999 123 0.1% 123 0.1%$750,000-$999,999 14 0.0% 13 0.0%$1,000,000+ 17 0.0% 9 0.0%
Median Value $120,598 $131,744Average Value $126,646 $137,404
Source: U.S. Census Bureau, Census 2010 Summary File 1. Esri forecasts for 2012 and 2017.
September 23, 2013
Made with Esri Business Analyst©2013 Esri www.esri.com/ba 800-447-9778 Try it Now! Page 5 of 6

Housing ProfileChesterfield Town CenterI 94, Chesterfield, MI, 48047 Latitude: 42.63023Ring: 10 mile radius Longitude: -82.84949
Census 2010 Owner Occupied Housing Units by Mortgage Status Number PercentTotal 144,476 100.0%
Owned with a Mortgage/Loan 105,875 73.3%Owned Free and Clear 38,601 26.7%
Census 2010 Vacant Housing Units by StatusNumber Percent
Total 13,407 100.0%For Rent 4,946 36.9%Rented- Not Occupied 251 1.9%For Sale Only 3,218 24.0%Sold - Not Occupied 682 5.1%Seasonal/Recreational/Occasional Use 834 6.2%For Migrant Workers 3 0.0%Other Vacant 3,517 26.2%
Census 2010 Occupied Housing Units by Age of Householder and Home Ownership Owner Occupied Units
Occupied Units Number % of OccupiedTotal 187,652 144,475 77.0%
15-24 5,080 1,266 24.9%25-34 24,040 14,628 60.8%35-44 36,283 27,905 76.9%45-54 42,457 34,675 81.7%55-64 35,522 29,957 84.3%65-74 22,178 19,038 85.8%75-84 15,248 12,487 81.9%85+ 6,844 4,519 66.0%
Census 2010 Occupied Housing Units by Race/Ethnicity of Householder and Home Ownership Owner Occupied Units
Occupied Units Number % of OccupiedTotal 187,653 144,476 77.0%
White Alone 168,106 136,181 81.0%Black/African American 13,400 4,267 31.8%American Indian/Alaska 555 360 64.9%Asian Alone 2,833 2,147 75.8%Pacific Islander Alone 36 22 61.1%Other Race Alone 724 368 50.8%Two or More Races 1,999 1,131 56.6%
Hispanic Origin 2,954 1,889 63.9%
Census 2010 Occupied Housing Units by Size and Home Ownership Owner Occupied Units
Occupied Units Number % of OccupiedTotal 187,652 144,475 77.0%
1-Person 52,206 33,158 63.5%2-Person 60,071 48,624 80.9%3-Person 30,784 24,697 80.2%4-Person 27,349 23,492 85.9%5-Person 11,872 10,097 85.0%6-Person 3,691 3,067 83.1%7+ Person 1,679 1,340 79.8%
Data Note: Persons of Hispanic Origin may be of any race.Source: U.S. Census Bureau, Census 2010 Summary File 1.
September 23, 2013
Made with Esri Business Analyst©2013 Esri www.esri.com/ba 800-447-9778 Try it Now! Page 6 of 6

Business SummaryChesterfield Town CenterI 94, Chesterfield, MI, 48047 Latitude: 42.63023Rings: 3, 5, 10 mile radii Longitude: -82.84949
Data for all businesses in area 3 miles 5 miles 10 milesTotal Businesses: 3,009 8,337 27,255Total Employees: 23,767 55,842 166,211Total Residential Population: 42,346 147,615 473,186Employee/Residential Population Ratio: 0.56 0.38 0.35
Businesses Employees Businesses Employees Businesses Employees
by SIC Codes Number Percent Number Percent Number Percent Number Percent Number Percent Number PercentAgriculture & Mining 75 2.5% 216 0.9% 241 2.9% 646 1.2% 823 3.0% 2,715 1.6%Construction 338 11.2% 1,530 6.4% 1,052 12.6% 3,315 5.9% 3,471 12.7% 10,974 6.6%Manufacturing 286 9.5% 5,863 24.7% 504 6.0% 8,223 14.7% 1,511 5.5% 23,976 14.4%Transportation 96 3.2% 618 2.6% 262 3.1% 1,500 2.7% 764 2.8% 3,408 2.1%Communication 23 0.8% 200 0.8% 60 0.7% 475 0.9% 182 0.7% 975 0.6%Utility 8 0.3% 62 0.3% 16 0.2% 93 0.2% 69 0.3% 577 0.3%Wholesale Trade 150 5.0% 918 3.9% 335 4.0% 1,596 2.9% 1,136 4.2% 5,575 3.4%
Retail Trade Summary 457 15.2% 4,097 17.2% 1,206 14.5% 10,924 19.6% 4,053 14.9% 37,167 22.4%Home Improvement 32 1.1% 367 1.5% 82 1.0% 924 1.7% 237 0.9% 2,075 1.2%General Merchandise Stores 13 0.4% 883 3.7% 22 0.3% 1,603 2.9% 79 0.3% 7,900 4.8%Food Stores 32 1.1% 112 0.5% 105 1.3% 1,040 1.9% 373 1.4% 3,379 2.0%Auto Dealers, Gas Stations, Auto Aftermarket 68 2.2% 550 2.3% 153 1.8% 1,442 2.6% 382 1.4% 3,136 1.9%Apparel & Accessory Stores 21 0.7% 195 0.8% 63 0.8% 593 1.1% 289 1.1% 2,598 1.6%Furniture & Home Furnishings 30 1.0% 118 0.5% 88 1.0% 286 0.5% 331 1.2% 1,466 0.9%Eating & Drinking Places 125 4.1% 1,359 5.7% 305 3.7% 3,169 5.7% 1,003 3.7% 10,443 6.3%Miscellaneous Retail 137 4.6% 513 2.2% 388 4.7% 1,867 3.3% 1,360 5.0% 6,170 3.7%
Finance, Insurance, Real Estate Summary 175 5.8% 829 3.5% 554 6.6% 2,307 4.1% 1,865 6.8% 8,192 4.9%Banks, Savings & Lending Institutions 26 0.9% 130 0.5% 76 0.9% 568 1.0% 268 1.0% 2,035 1.2%Securities Brokers 11 0.4% 27 0.1% 29 0.4% 77 0.1% 116 0.4% 334 0.2%Insurance Carriers & Agents 31 1.0% 291 1.2% 87 1.0% 507 0.9% 322 1.2% 1,368 0.8%Real Estate, Holding, Other Investment Offices 106 3.5% 381 1.6% 361 4.3% 1,155 2.1% 1,160 4.3% 4,455 2.7%
Services Summary 1,353 45.0% 6,814 28.7% 4,022 48.2% 22,384 40.1% 13,214 48.5% 65,144 39.2%Hotels & Lodging 7 0.2% 102 0.4% 18 0.2% 133 0.2% 63 0.2% 568 0.3%Automotive Services 87 2.9% 352 1.5% 189 2.3% 723 1.3% 601 2.2% 2,295 1.4%Motion Pictures & Amusements 59 2.0% 330 1.4% 183 2.2% 778 1.4% 614 2.3% 2,917 1.8%Health Services 69 2.3% 975 4.1% 310 3.7% 6,936 12.4% 1,287 4.7% 15,377 9.3%Legal Services 99 3.3% 351 1.5% 148 1.8% 514 0.9% 334 1.2% 1,026 0.6%Education Institutions & Libraries 40 1.3% 1,019 4.3% 113 1.4% 3,646 6.5% 356 1.3% 10,348 6.2%Other Services 992 33.0% 3,685 15.5% 3,061 36.7% 9,655 17.3% 9,958 36.5% 32,612 19.6%
Government 48 1.6% 2,622 11.0% 86 1.0% 4,379 7.8% 167 0.6% 7,507 4.5%
Totals 3,009 100% 23,767 100% 8,337 100% 55,842 100% 27,255 100% 166,211 100%
September 23, 2013
Made with Esri Business Analyst©2013 Esri www.esri.com/ba 800-447-9778 Try it Now! Page 1 of 2
Source: Copyright 2012 Dun & Bradstreet, Inc. All rights reserved. Esri Total Residential Population forecasts for 2012.

Business SummaryChesterfield Town CenterI 94, Chesterfield, MI, 48047 Latitude: 42.63023Rings: 3, 5, 10 mile radii Longitude: -82.84949
Businesses Employees Businesses Employees Businesses Employees
by NAICS Codes Number Percent Number Percent Number Percent Number Percent Number Percent Number PercentAgriculture, Forestry, Fishing & Hunting 5 0.2% 7 0.0% 30 0.4% 98 0.2% 130 0.5% 488 0.3%Mining 1 0.0% 0 0.0% 1 0.0% 0 0.0% 11 0.0% 47 0.0%Utilities 2 0.1% 27 0.1% 5 0.1% 32 0.1% 26 0.1% 231 0.1%Construction 344 11.4% 1,544 6.5% 1,072 12.9% 3,364 6.0% 3,523 12.9% 11,117 6.7%Manufacturing 278 9.2% 5,655 23.8% 493 5.9% 8,044 14.4% 1,500 5.5% 23,924 14.4%Wholesale Trade 150 5.0% 918 3.9% 334 4.0% 1,594 2.9% 1,127 4.1% 5,517 3.3%Retail Trade 330 11.0% 2,731 11.5% 886 10.6% 7,673 13.7% 2,993 11.0% 26,482 15.9%
Motor Vehicle & Parts Dealers 51 1.7% 464 2.0% 115 1.4% 1,243 2.2% 274 1.0% 2,585 1.6%Furniture & Home Furnishings Stores 13 0.4% 45 0.2% 47 0.6% 112 0.2% 177 0.6% 802 0.5%Electronics & Appliance Stores 19 0.6% 101 0.4% 46 0.6% 209 0.4% 161 0.6% 667 0.4%Bldg Material & Garden Equipment & Supplies Dealers 28 0.9% 314 1.3% 77 0.9% 870 1.6% 225 0.8% 1,997 1.2%Food & Beverage Stores 31 1.0% 108 0.5% 98 1.2% 1,043 1.9% 364 1.3% 3,399 2.0%Health & Personal Care Stores 20 0.7% 173 0.7% 59 0.7% 879 1.6% 211 0.8% 2,143 1.3%Gasoline Stations 16 0.5% 86 0.4% 38 0.5% 199 0.4% 109 0.4% 567 0.3%Clothing & Clothing Accessories Stores 28 0.9% 208 0.9% 85 1.0% 645 1.2% 380 1.4% 2,879 1.7%Sport Goods, Hobby, Book, & Music Stores 20 0.7% 107 0.5% 62 0.7% 242 0.4% 204 0.7% 1,227 0.7%General Merchandise Stores 13 0.4% 883 3.7% 22 0.3% 1,603 2.9% 79 0.3% 7,900 4.8%Miscellaneous Store Retailers 69 2.3% 206 0.9% 170 2.0% 519 0.9% 606 2.2% 1,925 1.2%Nonstore Retailers 21 0.7% 36 0.2% 65 0.8% 108 0.2% 203 0.7% 390 0.2%
Transportation & Warehousing 71 2.4% 415 1.7% 188 2.3% 1,127 2.0% 608 2.2% 2,827 1.7%Information 57 1.9% 480 2.0% 147 1.8% 944 1.7% 483 1.8% 2,041 1.2%Finance & Insurance 86 2.8% 488 2.1% 254 3.1% 1,279 2.3% 908 3.3% 4,214 2.5%
Central Bank/Credit Intermediation & Related Activities 26 0.9% 130 0.5% 75 0.9% 567 1.0% 275 1.0% 2,048 1.2%Securities, Commodity Contracts & Other Financial 28 0.9% 66 0.3% 89 1.1% 197 0.4% 300 1.1% 756 0.5%Insurance Carriers & Related Activities; Funds, Trusts & 31 1.0% 291 1.2% 90 1.1% 515 0.9% 333 1.2% 1,410 0.8%
Real Estate, Rental & Leasing 107 3.5% 396 1.7% 320 3.8% 1,114 2.0% 1,032 3.8% 4,278 2.6%Professional, Scientific & Tech Services 402 13.3% 1,227 5.2% 1,131 13.6% 2,990 5.4% 3,480 12.8% 12,613 7.6%
Legal Services 99 3.3% 352 1.5% 158 1.9% 525 0.9% 382 1.4% 1,227 0.7%Management of Companies & Enterprises 4 0.1% 6 0.0% 20 0.2% 38 0.1% 62 0.2% 120 0.1%Administrative & Support & Waste Management & Remediation 469 15.6% 1,190 5.0% 1,542 18.5% 4,369 7.8% 4,937 18.1% 13,050 7.9%Educational Services 46 1.5% 1,022 4.3% 136 1.6% 3,602 6.5% 419 1.5% 10,385 6.2%Health Care & Social Assistance 130 4.3% 1,714 7.2% 457 5.5% 8,155 14.6% 1,801 6.6% 18,475 11.1%Arts, Entertainment & Recreation 48 1.6% 488 2.1% 151 1.8% 909 1.6% 451 1.7% 2,646 1.6%Accommodation & Food Services 133 4.4% 1,476 6.2% 326 3.9% 3,365 6.0% 1,077 4.0% 11,117 6.7%
Accommodation 7 0.2% 102 0.4% 18 0.2% 133 0.2% 63 0.2% 568 0.3%Food Services & Drinking Places 126 4.2% 1,375 5.8% 308 3.7% 3,232 5.8% 1,014 3.7% 10,549 6.3%
Other Services (except Public Administration) 299 9.9% 1,284 5.4% 756 9.1% 2,689 4.8% 2,517 9.2% 9,055 5.4%Automotive Repair & Maintenance 78 2.6% 313 1.3% 170 2.0% 638 1.1% 521 1.9% 1,970 1.2%
Public Administration 49 1.6% 2,699 11.4% 87 1.0% 4,456 8.0% 169 0.6% 7,584 4.6%
Total 3,009 100% 23,767 100% 8,337 100% 55,842 100% 27,255 100% 166,211 100%
September 23, 2013
Made with Esri Business Analyst©2013 Esri www.esri.com/ba 800-447-9778 Try it Now! Page 2 of 2
Source: Copyright 2012 Dun & Bradstreet, Inc. All rights reserved. Esri Total Residential Population forecasts for 2012.