site disturbance and soil impacts resulting from mechanized
TRANSCRIPT

Site Disturbance and Soil Impacts Resulting from Mechanized Thinning of Upland Hardwood Stands in Southeastern Kentucky
Jason Thompson 1 and Emily Carter 2
1 Engineer, Forest Operations Research Unit, Southern Research Station, USDA Forest Service 2 Research Soil Scientist, Forest Operations Research Unit, Southern Research Station, USDA Forest
Service
A large scale silvicultural trial was designed to examine the effectiveness of five treatments in reducing the potential future impacts of gypsy moth infestation and oak decline on upland hardwood forests in the Daniel Boone National Forest in southeastern Kentucky. Three of the five prescriptions were implemented with a mechanical harvesting system. The system consisted of a swing-to-tree feller buncher, chainsaw limbing and topping in the woods and skidding with a grapple skidder. The three mechanically harvested prescriptions were shelterwood with reserves, thinning to B-line, and woodland thinning. Each prescription was designed to test the effectiveness of varying degrees of basal area reduction in limiting the impact of gypsy moth infestation and oak decline. After harvesting was complete the point transect method was used to measure site disturbance caused by the harvesting operations. An assessment of soil response was conducted in one area that was subjected to the most intense thinning – shelterwood with reserves. This treatment thinned each stand to 10 – 25 ft2/ac to create a 2 aged stand. Primary soil variables measured included bulk density and soil strength in both pre- treatment and post treatment condition. Bulk density within the soil profile increased in response to thinning. Conversely, soil strength was reduced after thinning that may be the result of higher moisture levels. Soil bulk density increased in response to traffic intensity, as measured by the site disturbance survey, but the reverse was noted for soil strength. The impact of trafficking on carbon and nitrogen was also evaluated by monitoring nitrogen mineralization and carbon efflux. Disturbance intensity influenced nitrogen mineralization while carbon efflux was detected on a limited basis.
Keyword: Site Disturbance, Soil Impact, Thinning, Bulk Density, Soil Strength, Kentucky 1. Introduction
A large scale study was implemented in 2007 to assess the effectiveness of five different silvicultural treatments in limiting the impacts of gypsy moth and oak decline on the Daniel Boone National Forest in southeastern Kentucky.
135 38th Annual COFE Meeting – Engineering Solutions for Non-Industrial Private Forest Operations Hilton Hotel Downtown – Lexington, Kentucky – July 19 - 22, 2015

Previous research suggests that the impact of oak decline and gypsy moth infestations can be limited by preparing the forest before stress introduction. Silvicultural treatments aimed at decreasing competition and increasing regeneration and tree vigor have been shown to lessen the impacts of oak decline and gypsy moth infestations.
The original study implemented four silvicultural treatments and a control to test their effectiveness against oak decline and the gypsy moth. The study was being conducted by a multidisciplinary research team composed of USDA Forest Service and university researchers. Research included studies of not only the silvicultural effects, but also the effects on wildlife, soils, and the harvesting methods and equipment.
This paper focuses on assessing harvest productivity and soil site impacts of the harvesting systems used to implement the silvicultural prescriptions including tabulation of soil surface disturbances and changes in soil physical properties of a portion of the most intense thinning operation.
2. Study Areas
The study was implemented on the London Ranger District of the Daniel Boone National
Forest in Southeastern Kentucky. The harvesting units are located west of London in the Cold Hill area with oak and hickory dominated stands ranging in age from 70 to 150 years. The units are generally located on broad ridges with some moderate side slopes (up to 30 percent). Soils are highly weathered, low fertility Ultisols. Stand density before harvest ranged from 100 to 120 ft2/ac and 140 to 160 stems/ac.
The study was designed as a randomized complete block. There are two site types (dry-mesic and dry-xeric) and five treatments (table 1): shelterwood with reserves, oak shelterwood, B-line thinning, oak woodland, and a control (Schweitzer et al., 2008). There are three replicates for a total of 30 units equaling almost 600 acres. Eighteen of the 30 units were mechanically harvested, six of the units were treated chemically and the remaining six were retained undisturbed as controls. Harvesting began in May 2007 and was completed in August 2009.
136 38th Annual COFE Meeting – Engineering Solutions for Non-Industrial Private Forest Operations Hilton Hotel Downtown – Lexington, Kentucky – July 19 - 22, 2015

Table 4.-Treatments on the research study examining sustaining oak systems amid threat of gypsy moth infestation and oak decline research study on the Daniel Boone National Forest.
TREATMENT PRESCRIPTION
1. Control No burn, no disturbance
2. Shelterwood w/ Reserves 10-15 ft2/ac residual BA1, mechanical harvest
3. Oak Shelterwood 60-75 ft2/ac residual BA, herbicide treatment
4. Thinning to B-line Gingrich’s Stocking Chart, mechanical harvest
5. Woodland Thinning 30-50 ft2/ac residual BA, mechanical harvest
1BA = Basal Area
3. Methods A mechanical tree-length harvesting system was used to harvest all units. The system
consisted of a feller buncher, grapple skidder and a knuckleboom loader. Trees larger than 23 inches d.b.h. (diameter at breast height) were felled with a chainsaw. All limbing and topping was performed with a chainsaw in the stand. Products removed from the units included hardwood sawtimber and biomass logs. A biomass log was any material greater than 3 inches in diameter, reasonably straight, at least 10 feet long and that did not meet merchantability specifications of a saw log.
The Forest Operations Research Unit of the USDA Forest Service in Auburn, Alabama measured the productivity and efficiency of the harvesting system and its impact on the stand. This data along with the amount of timber removed from each unit allowed for the calculation of unit productivity and an estimate of cost and efficiency. Soil surface disturbances caused by the harvesting operations were assessed using the point transect method (McMahon, 1995). A total of 9 mutually exclusive disturbance classes were used. Each sample point was further classified by a location type (table 2) Additional soil surface disturbance classes were tabulated on a portion of Unit 31, a shelterwood with reserves thinning operation.
137 38th Annual COFE Meeting – Engineering Solutions for Non-Industrial Private Forest Operations Hilton Hotel Downtown – Lexington, Kentucky – July 19 - 22, 2015

Table 5.-Disturbance classes and location types used to describe harvesting impacts. DISTURBANCE CLASS LOCATION
-Undisturbed -Landing
-Disturbed w/ litter in place -Primary skid trail
-Litter removed & topsoil exposed -Secondary skid trail
-Litter removed & mineral soil exposed -Stand area
-Litter & soil mixed -Road
-Soil exposed > 4 inches -Other (stream bed, SMZ)
-Non-soil (stumps, rocks, logs, etc.)
-Logging slash
-Soil deposited on top of ground
An assessment of soil response to a thinning operation was conducted by measuring
select soil physical properties in a select area of one thinning treatment: shelterwood with reserves. This treatment had the potential for the greatest impact on soil resources due to the higher basal area removals. Three blocks were established that each measured approximately 1,000 ft2 (40 x 25) feet along a hillslope of approximately 25 % with two side by side and the third on the lowest portion of the slope. A grid system was superimposed on each block and sampling points laid out in a 4 x 8 foot grid for a total of 15 grid points per block. At each grid point, a soil core approximately 24 inches in length and 2 inches in diameter was removed, sectioned in 4 inch increments, dried at 105 o C for 48 hours. Dry weights were recorded for each depth increment and final bulk density (BD) and soil moisture contents (SMC w/w) were calculated (Blake and Hartge, (1986). Prior to core removals, soil strength (SS) measurements were conducted by inserting a recording cone penetrometer to a depth of 16 inches and tabulated in 1 inch increments. The resulting data were compiled into cone index values for each 4 inches of soil depth.
Soil data related to BD and SS by depth were analyzed by using a mixed model (PROC MIXED) approach that tested main effects of harvest condition: preharvest vs. postharvest and disturbance class by depth and their interaction.
138 38th Annual COFE Meeting – Engineering Solutions for Non-Industrial Private Forest Operations Hilton Hotel Downtown – Lexington, Kentucky – July 19 - 22, 2015

4. Results and Discussion The research study required that the harvesting be completed with a mechanical
harvesting system. The harvesting crew initially consisted of a rubber-tired feller buncher, a tracked swing-to-tree feller buncher, two grapple skidders and a knuckleboom loader. The rubber-tired feller buncher was equipped with a shear felling head with the assumption that smaller biomass material could be felled more effectively with such a machine. However, after a few weeks the contractor decided that it was better to do all felling with the tracked feller buncher. To balance system productivity both the rubber-tired feller buncher and one of the grapple skidders were removed from the crew. Later in 2007, the tracked feller buncher was replaced with a similar machine with a disc saw. This machine remained with the crew for the remainder of the study. Adverse (wet) weather conditions resulted in the extension of the harvesting well beyond the desired completion date of the end of the second growing season (winter 2008). The wet weather and the resulting slower harvesting productivity led to the decision to add a second harvesting crew (contractor 2) in June 2008. The second harvesting contractor was similarly equipped as the first. In early 2009, the first harvesting crew (contractor 1) stopped participating in the timber harvesting.
In an effort to complete the harvesting by the end of the second growing season the harvesting crews were allowed to work through the normal winter shutdown period (December to April). The crews were closely monitored and not allowed to exceed site disturbance limits set by the Forest Service. Working through the winter months did speed up harvesting but included extended periods of idle time when conditions were too wet. Of the 18 units harvested, 9 were completed by contractor 1, 8 were completed by contractor 2 and 1 unit was started by contractor 1 and finished by contractor 2.
The shelterwood with reserves units averaged 27 acres and took an average of 10 weeks to harvest. The woodland thinning and thinning to B-line units averaged 28 and 26 acres in size and took an average of 7 and 6 weeks respectively to harvest. Woodland thinning Unit 20 took 4 months to harvest. This unit was started by contractor 1 and then later finished by contractor 2. The unit was the largest unit in the study (48 ac) and consisted of several long thin ridge tops which contributed to the extended time to harvest.
Tons per acre removed varied, as expected, by treatment with an average of 77 tons/ac on the shelterwood units, 25 tons/ac on the B-line thinning units and 42 tons/ac on the woodland thinning units. Table 3 shows the removal percentage for each treatment. The thinning treatment, which had the lowest tons per acre removed also had a much lower percentage of Basal Area (BA) removed compared to the percentage of Stems Per Acre (SPA) removed. The percentage of biomass tons removed was also much lower than the percentage
139 38th Annual COFE Meeting – Engineering Solutions for Non-Industrial Private Forest Operations Hilton Hotel Downtown – Lexington, Kentucky – July 19 - 22, 2015

of sawlog tons removed. These results indicate that more small stems were removed in the thinning treatment and this resulted in lower harvesting productivity. The shelterwood treatment, on the other hand, had high percentages of both BA removed and SPA removed indicating a heavier removal across all stem diameters. The product removal percentages were close to being equally split between biomass and sawlogs. Average productivity by treatment decreased as the percent of biomass removed increased. The shelterwood treatments had the highest harvesting productivity (3.98 tons/PMH) and the least percent of biomass removed (54 percent) and the thinning treatments had the lowest harvesting productivity (2.60 tons/PMH) and the highest percentage of biomass removed (78 percent). Figure 1 shows the tons/ac removed for each treatment.
Table 3.-Percentages of Basal Area, Stems/Acre and tons removed.
Treatment1 Percent Removed Percent Removed (tons)
BA2 (ft2) SPA3 Biomass Sawlogs
2. Shelter 78 87 54 46 4.Thin 32 60 78 22
5.WThin 43 68 65 35 1See Table 1 for Treatment Descriptions, 2 Basal Area, 3 Stems/acre
Figure 1.-Tons/ac removed from harvest units by treatment.
140 38th Annual COFE Meeting – Engineering Solutions for Non-Industrial Private Forest Operations Hilton Hotel Downtown – Lexington, Kentucky – July 19 - 22, 2015

Site soil disturbances were tabulated on all harvested units. The disturbance categories are combined into 5 main disturbance types to highlight differences among treatments (Figure 2). The category “Soil exposed” combines the three disturbance classes “Litter removed & topsoil exposed”, “Litter removed & mineral soil exposed”, and “Litter & soil mixed” from Table 2. The “Slash” disturbance class was included to illustrate the amount of biomass left in the units and combines the disturbance classes “Slash” and “Non-soil”. “Non-soil” accounted for a very small percentage of data points of which the majority was downed logs. Eighteen percent of the shelterwood with reserves units were classified as “Slash”, while 9 percent and 11 percent of the thinning to B-line and woodland thinning units, respectively, were classified as “Slash”. “Slash” was defined as any piled limbs and tops located at the survey point.
Figure 2.-Percent of area in various disturbance classes.
“Soil Exposed” ranged from 24 percent on the thinning to B-line units to 32 percent on
the shelterwood with reserves units. “Litter in Place” and “Undisturbed” combined, accounted for 49, 59, and 67 percent in shelterwood with reserves, woodland thinning and thinning to B-line, respectively. Thinning to B-line units had the highest percent area in undisturbed and litter in place which reflects the least average volume of timber removed (25 tons/ac).
Final soil disturbance class tabulation of the area evaluated for soil response (Unit 31) noted the presence of 5 classes: undisturbed (UND), disturbed with litter in place (TWL), soil exposed > 4 inches partitioned into ruts < 6 inches (RUTSLT6) and ruts greater than 6 inches (RUTSGT6) and top soil exposed (TSE). The percentage of each class included UND – 17,8%, TWL – 66.7%, RUTLT6 – 8.9%, RUTGT6 – 4.4%, and TSE – 2.2%. The highest percentage of
141 38th Annual COFE Meeting – Engineering Solutions for Non-Industrial Private Forest Operations Hilton Hotel Downtown – Lexington, Kentucky – July 19 - 22, 2015

disturbance was TWL which matched the overall result for shelterwood with reserves followed by UND. More soil was exposed (TSE) in the overall tabulation compared to the soil evaluation site.
Bulk density increased in response to machine trafficking as indicated by postharvest increases relative to preharvest conditions (Figure 3a). The increase was significant at several depth increments throughout the soil profile: 5% level for the 8 – 12 and 20 - 24 inch soil layers while significance was detected at the 10% level in the 4 – 8 and 12 – 16 inch soil layers. The final BD levels over the depths evaluated may be an indication of the formation of a hardpan in response to harvest trafficking. In comparison, SS was was reduced under postharvest conditions and differences were observed to be significantly different in subsoil layers between 4 and 16 inch soil layers, especially in the 12 – 16 inch layer (Figure 3b). Contrary to BD results, SS declined in response to harvesting operations with SS levels lowered in subsurface layers; the reduction in SS may mitigate the impact of a hardpan layer in subsurface layers.
Pre and post harvest BD values were compared to BD levels derived from a moisture-density compaction test (Proctor). Surface compaction levels of both conditions were less than 1.0 Mg m-3 that was lower than peak levels estimated at 1.53 Mg m-3. Similarly, BD levels measured in the immediate subsurface layer (4 – 8 in) were estimated to be approximately 1.1 and 1.3 Mg m-3, respectively, and less than the 1.77 Mg m-3 estimated from the Proctor test. Soil strength levels greater than 2.5 MPa in the 12 – 16 in subsoil layer may limit root exploration and proliferation (Taylor et al., 1966)
142 38th Annual COFE Meeting – Engineering Solutions for Non-Industrial Private Forest Operations Hilton Hotel Downtown – Lexington, Kentucky – July 19 - 22, 2015

Significance - *** - 0.01%, ** - 0.05%, and * - 0.10%
Figure 3 a - b. Bulk Density (Mg/m 3) (a) and Soil Strength (MPa) (b) Response to a Thinning Operation, Kentucky. Note: Soil Strength is expressed by Cone Index values.
The relationship among BD, SS and SMC was investigated to evaluate their influence (Figure 4 a-c). Bulk density increases occur at the expense of soil structure, decreasing
pore size and volume, in turn affecting water and air infiltration and retention. Soil moisture contents narrowly ranged between 10 and 15% under pre-harvest conditions over a wide range of BD values (~0.8 to 1.6 Mg/m 3) versus elevated moisture contents under postharvest conditions over a slightly smaller range of BD (Figure 4a). This may be an indication of decrease in soil volume with a rearrangement of soil pore volume and size that retained a greater amount of soil moisture (Ampoorter et al., 2010). The relationship between BD and SMC was
-24
-20
-16
-12
-8
-4
00.5 0.7 0.9 1.1 1.3 1.5 1.7
SOIL
DEP
TH (in)
BULK DENSITY (Mg/m3)
PREHARVESTPOSTHARVEST
**
a
-20
-16
-12
-8
-4
00 0.5 1 1.5 2 2.5 3
SOIL
DEP
TH (in)
SOIL STRENGTH (MPa)
PREHARVESTPOSTHARVEST
***
a
b
143 38th Annual COFE Meeting – Engineering Solutions for Non-Industrial Private Forest Operations Hilton Hotel Downtown – Lexington, Kentucky – July 19 - 22, 2015
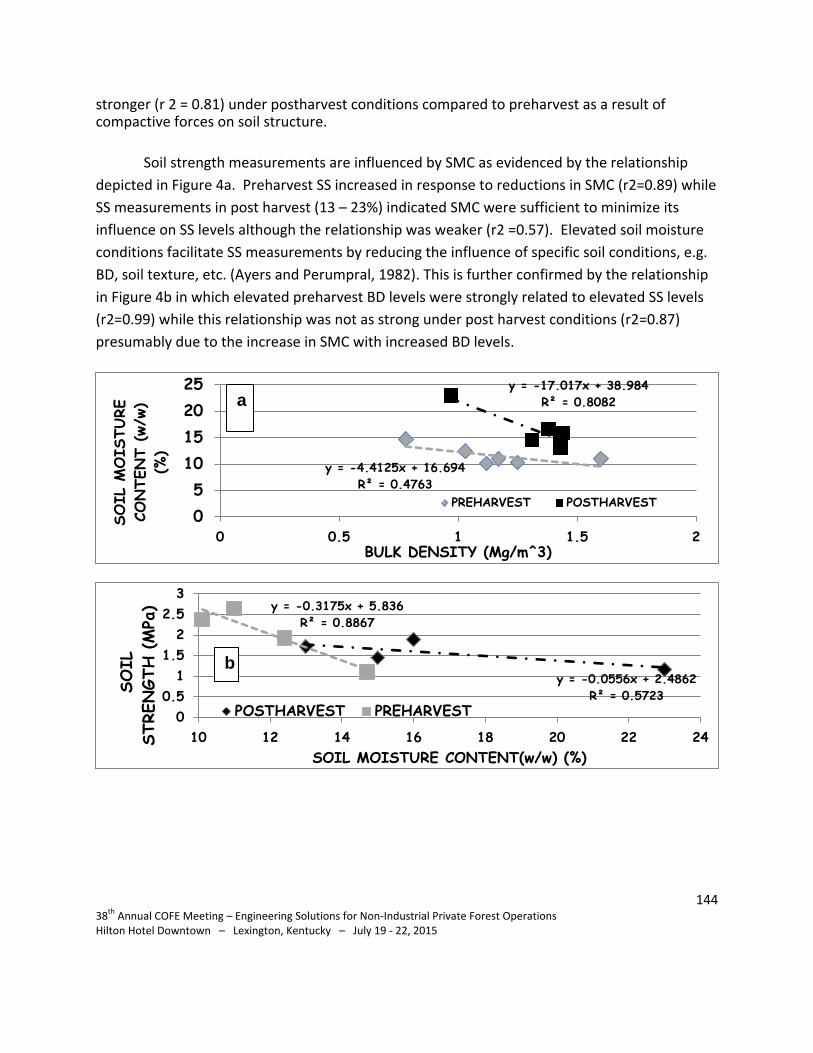
stronger (r 2 = 0.81) under postharvest conditions compared to preharvest as a result of compactive forces on soil structure.
Soil strength measurements are influenced by SMC as evidenced by the relationship
depicted in Figure 4a. Preharvest SS increased in response to reductions in SMC (r2=0.89) while SS measurements in post harvest (13 – 23%) indicated SMC were sufficient to minimize its influence on SS levels although the relationship was weaker (r2 =0.57). Elevated soil moisture conditions facilitate SS measurements by reducing the influence of specific soil conditions, e.g. BD, soil texture, etc. (Ayers and Perumpral, 1982). This is further confirmed by the relationship in Figure 4b in which elevated preharvest BD levels were strongly related to elevated SS levels (r2=0.99) while this relationship was not as strong under post harvest conditions (r2=0.87) presumably due to the increase in SMC with increased BD levels.
y = -4.4125x + 16.694 R² = 0.4763
y = -17.017x + 38.984 R² = 0.8082
05
10152025
0 0.5 1 1.5 2
SOIL
MOIS
TURE
CO
NTE
NT
(w/w
) (%
)
BULK DENSITY (Mg/m^3)
PREHARVEST POSTHARVEST
y = -0.0556x + 2.4862 R² = 0.5723
y = -0.3175x + 5.836 R² = 0.8867
00.5
11.5
22.5
3
10 12 14 16 18 20 22 24
SOIL
ST
RENGT
H (M
Pa)
SOIL MOISTURE CONTENT(w/w) (%)
POSTHARVEST PREHARVEST
a
b
144 38th Annual COFE Meeting – Engineering Solutions for Non-Industrial Private Forest Operations Hilton Hotel Downtown – Lexington, Kentucky – July 19 - 22, 2015

Figure 4 a – c. Relationship among bulk density (BD), soil moisture content (SMC w/w), and soil strength (SS) in response to a thinning operation, Kentucky.
Further assessment of machine impacts was conducted through the tabulation of
surface soil disturbance classes (Figure 5). The disturbance class related to TWL was most often tabulated in the study area and may indicate a minimum of soil damage.
Figure 5. Soil disturbance classes of a study site in response to a thinning operation, Kentucky.
Examination of soil properties by disturbance class was limited to three classes: UND,
TWL, and RUTLT6 due to their prevalence in the study site (Figures 6a & b). Surface BD was elevated in response to surface exposure (RUTLT6) followed by TWL and UND, respectively (Figure 6a). Subsoil BD increased with depth in all classes, and may be an indication of the formation of hardpan development, especially TWL. No significant differences were detected.
y = 1.2111x R² = 0.8684
y = 3.8735x - 1.9603 R² = 0.9867
00.5
11.5
22.5
3
0.75 0.95 1.15 1.35 1.55SOIL
STR
ENGT
H
(MPa
)
BULK DENSITY (Mg/m^3)
POSTHARVEST PREHARVEST
18.8
64.6
10.4 2.1 4.2
010203040506070
UND TWL RUTS< 6" RUTS> 6" TSE
SOIL
DIS
TURB
ANCE
(%
)
SOIL DISTURBANCE CLASS
c
145 38th Annual COFE Meeting – Engineering Solutions for Non-Industrial Private Forest Operations Hilton Hotel Downtown – Lexington, Kentucky – July 19 - 22, 2015

Soil strength levels were higher in UND compared to RUTLT6 and TWL which might not have been expected (Figure 6b). This may be due to less soil moisture contained in UND resulting in more resistance to penetration during SS measurements. Less soil moisture was associated with BD in UND, the lower SMC contributing to higher SS levels of BD when compared to TWL and RUTLT6.
Figure 6 a & b. Soil bulk density (BD) (a) and soil strength (SS) (b) response to soil disturbances during thinning, Kentucky.
-24
-20
-16
-12
-8
-4
00.75 0.95 1.15 1.35 1.55
SOIL
DEP
TH (in)
BULK DENSITY (Mg/m^3)
RUTLT6
TWL
UND
-16
-12
-8
-4
01 1.2 1.4 1.6 1.8 2 2.2 2.4
SOIL
DEP
TH (in)
SOIL STRENGTH (MPa)
RUTLT6
TWL
UND
a
b
146 38th Annual COFE Meeting – Engineering Solutions for Non-Industrial Private Forest Operations Hilton Hotel Downtown – Lexington, Kentucky – July 19 - 22, 2015

5. Conclusions The longevity of this study (May 2007 – August 2009), the addition of a second
harvesting contractor (and subsequent retraction of the first contractor), changing personnel and machines within crews, and adverse weather conditions all complicated the analysis of this study.
Soil disturbance resulting from mechanized ground-based harvesting appeared to be related to the volume removed. More removal was associated with higher levels of soil disturbance and more coverage of logging residues. The amount of stand area impacted by skid trails was relatively low, averaging between 12 percent and 16 percent of total area. This range is in-line with those measured by other studies.
Machine trafficking induced changes in soil physical properties related to BD, SMC and SS as would be expected. Bulk density increased in response to trafficking but final BD levels were lower than maximum levels predicted by Proctor tests. Soil strength declined in response to trafficking, which was atypical and attributed to increased soil moisture levels after trafficking.
Soil disturbances were limited primarily to UND and TWL with a smaller proportion tabulated as RUTLT6, RUTGT6 and TSE. Bulk density levels were elevated in each disturbance class with depth but no significant differences were detected. Soil strength declined in response to disturbance with TWL levels showing a greater difference in the upper 8 inches.
6. References Ayers, P.D. and J.V. Perumpral. 1982. Moisture and density effects on cone index. Trans of
ASAE 25: 1169-1172. Blake, G.R. and K.H. Hartge. 1986. Bulk Density. IN: Klute, A. (ed), Methods of Soil Analysis,
Part 1, 2nd edition. American Society of Agronomy, Madison, WI. Hatchell, G. E., C. W. Ralston, and R. R. Foil. 1970. Soil disturbance in logging. Journal of
Forestry. Vol. 68. No. 12. Pg. 772-775. Kochenderfer, J. N. 1977.Area in skidroads, truck roads, and landings in the central
appalachians. Journal of Forestry. Vol. 75. No. 8. Pg.507-508. McMahon, S. 1995. Accuracy of two ground survey methods for assessing site disturbance.
Journal of Forest Engineering. Vol. 6. No. 2. Pg. 27-33. MitchelL, W. C., and G. R. Trimble, Jr. 1959. How much land is needed for the logging transport
system. Journal of Forestry. Vol.57. No. 1. Pg. 10-12
147 38th Annual COFE Meeting – Engineering Solutions for Non-Industrial Private Forest Operations Hilton Hotel Downtown – Lexington, Kentucky – July 19 - 22, 2015

Schweitzer, C. J., S. Clark, G. Gaines, P. Finke, K. Gottschalk, and D. Loftis. 2008. Integrating land and resource management plans and applied large-scale research on two national forests. In: Integrated restoration of forested ecosystems to achieve multiresource benefits: Proceedings of the 2007 national silviculture workshop. Deal, R. L. Tech. Ed. Gen. Tech. Rep. PNW-GTR-733. Portland, OR: U.S. Department of Agriculture. Forest Service. Pacific Northwest Research Station. Pg. 127-134.
Taylor, H.M., Gene M. Roberson, and Jessie J. Parker, Jr. 1966. Soil strength-root penetration relations for medium to coarse textured soil materials. Soil Science 102:18-22.
148 38th Annual COFE Meeting – Engineering Solutions for Non-Industrial Private Forest Operations Hilton Hotel Downtown – Lexington, Kentucky – July 19 - 22, 2015

Proceedings of the
38th Annual Meeting of the Council on Forest Engineering
Engineering Solutions
for Non-industrial
Private Forest Operations
July 19- 22, 2015 – Hilton Hotel Downtown Lexington, Kentucky, USA
Organized and hosted by the
Partners:
Division 3 - Forest Operations Engineering and Management
Department for Energy Development and Independence Division of Biofuels