sirius satellite radio fi nancial analysis - mark e....
TRANSCRIPT
sirius satellite radiofi nancial analysisDate of Valuation: April 1, 2oo5
jennifer williams [email protected]
adam goldberg [email protected]
brett rockelmann [email protected]
chris capshaw [email protected]
chris lauer [email protected]

i

table of contentsExecutive Summary 1
Industry Overview and Analysis 5Five Forces Model 5
Company Overview 8
Competitive Advantage Analysis 10
Formal Accounting Analysis 11Identify Key Accounting Policies 11
Accounting Flexibility 13
Accounting Strategy Evaluation 14 Accounting Strategy Evaluation 14 Quality of Disclosure 14
Potential “Red Flags” 16Potential “Red Flags” 16
Undo Accounting Distortions 16Undo Accounting Distortions 16
Ratio Analysis and Forecast Financials 17Ratio Analysis and Forecast Financials 17Ratio Analysis and Forecast Financials 17
Sirius Satellite’s Financial Statement 18Sirius Satellite’s Financial Statement 18Sirius Satellite’s Financial Statement 18Ratio OverviewRatio Overview
Liquidity Analysis 19Liquidity Analysis 19
Profi tability Analysis 20Profi tability Analysis 20
Capital Structure Analysis 21Capital Structure Analysis 21
Sirius’ Sustainable Growth Rate 22Sirius’ Sustainable Growth Rate 22
Benchmark Analysis 23Benchmark Analysis 23Liquidity 23Liquidity 23
ii

Profi tability 25
Capital Structure 29
Financial Statement Forecasting 31Sales Growth Rate Forecast 31
Liquidity Forecast 31
Profi tability Forecast 32
Capital Structure Forecast 32
Income Statement Forecast 32
Balance Sheet Forecast 33
Cash Flow Statement Forecast 33
Forecast and Analysis Conclusion 34
Valuation Analysis 35Method of Comparables Valuation 35
Cost of Capital Estimation 36
Sirius Variables 36
Annual Yield 36
Intrinsic Valuation Methods 37Discounted Free Cash Flows 37
Discounted Dividends 38
Discounted Residual Income 38
Abnormal Earnings Growth 39
Altman’s Z-Score 40Altman’s Z-Score 40
Summary of Valuations 41Summary of Valuations 41
References 43References 43References 43
Appendices 44Appendices 44Appendices 443.1 Ratio Analysis 453.1 Ratio Analysis 45
3.2 Balance Sheet 473.2 Balance Sheet 47
3.3 Proforma Balance Sheet 493.3 Proforma Balance Sheet 49
3.4 Income Statement 513.4 Income Statement 51
3.5 Proforma Income Statement 533.5 Proforma Income Statement 53
3.6 Cash Flow Statement 553.6 Cash Flow Statement 55
3.7 Proforma Cash Flow Statement 573.7 Proforma Cash Flow Statement 57
4.1 Free Cash Flow Model 594.1 Free Cash Flow Model 59
4.2 Residual Income Model 614.2 Residual Income Model 61
4.3 Abnormal Earnings Growth Model 634.3 Abnormal Earnings Growth Model 63
Grade Allocation 65Grade Allocation 65iii

iv

executive summarySirius Satellite Radio Inc (NASDAQ – SIRI)As of April 1, 2005
Business Summary
Sirius Satellite Radio Inc is the hottest new company in terms of revolutionizing the
way America listens to music, news, sports, and entertainment. Sirius earned $54.87
million in 2004, while producing a 413% increase from 2003. Sirius offers 120 digital-
quality channels, including 65 channels of commercial free music to its ever growing
audience of 1.24 million subscribers. Sirius’s latest achievements include an exclusive
agreement with Ford Motor Company and becoming the “offi cial satellite radio partner
of the NFL”. 1

Growth of $10,000
Figure 1: The chart above illustrates a company’s growth of $10,000 over the past fi ve years. It compares Sirius Satellite Radio to the radio industry and the overall S&P 500. The S&P is more stable because of the fact that there is diversifi cation which allows for winners and losers. The radio industry is somewhere in between because it is a profi table business, but because of the fact that there are many threats and weaknesses, the various losers balance out the big winners. Sirius’s growth started out on top, but then reduced quite rapidly before the introduction of the satellite radio. Once Sirius introduced satellite radio, its growth has rapidly increased each year, leaving it one step above its competition.
Stock: Sirius Satellite RadioIndustry: RadioIndex: S&P 500Industry: RadioIndex: S&P 500Industry: Radio
Price (current): 52 Week High: 52 Week Low:Volume:Subscribers:Market Cap:Shares Outstanding:Dividend:Yield:
$5.56$9.43$2.0156,882,784$1,240,000$6,790,000,0001,320,000,000$0.000.00%
Management Success: Return on Assets Return on EquityIncome Statement: Revenue Revenue Growth 12/03 - 12/04 Gross Profi t EBITDA Net Income Earnings Per ShareBalance Sheet: Total Cash Total Debt Total Debt/Equity Current RatioCash Flow: From Operations Free Cashfl ow
Sirius Satellite Radio
(32.75%)(48.24%)
$54.87M1499.00%
($73.90M)($458.05M)($587.09M)(0.58)
$528.68M$426.16M0.3963.457
($309.27M)($337.32M)
XM Satellite Radio
(39.66%)(115.14%)
$194.80M354.80%
($56.17M)($306.85M)($631.02M)(3.508)
$447.52M$702.65M1.7061.636
($123.62M)($278.25M)
Financial Focus
M=Millions of Dollars2

Figure 2: The graphs above represent three years in price documentation as well as volumes for both Sirius Satellite Radio and XM Satellite Radio. Sirius Satellite’s daily stock price ranges from $0.39 to $9.48 over the past three years, while, XM Radios stock price ranges from $1.66 to $40.00. Although, Sirius has more volume than XM, XM Radio’s stock price is worth more than Sirius’. Both companies have been steadily increasing in stock price and volume since 2002.
price graph comparison of sirius (top) and xm (bottom)
Sirius
XM
business overview
Sirius Satellite Radio was incorporated on May 17, 1990 as Satellite CD Radio Inc.
On November 18th 1999 the company changed their name to SIRIUS Satellite Radio
Inc, which is the name under which the FCC license to distribute satellite radio was
given to. Sirius Satellite radio currently offers over 100 of music, news, sports, talk,
entertainment, traffi c, weather, and children’s programming to subscribers throughout
the United States. Their primary source of revenue is through subscription fees, with
most of their customers subscribing to Sirius Satellite Radio on either a monthly or a
yearly basis. They also derive revenue from activation fees, advertising sales on non-
music channels and the direct sale of Sirius radios, which are currently sold in over
6,500 retail locations around the nation. As of December 31, 2004, Sirius has had over
1.2 million subscribers and 375 employees.
Sirius Satellite Radio (Sirius) is a member of the broadcast and cable television
industry. This industry contains companies such as Clear Channel Communications,
but Sirius’ main competitor is XM Satellite Radio (XM). Sirius provides customers
with over 120 channels of commercial-free radio, ranging from sports and news to
entertainment and music. Sirius also makes live interviews and musical performances
available to their customers. Sirius’s market cap is found to be $6.79 billion, in
relation to XM, whose market cap is $5.83 billion. Sirius’ high market cap can help the
company grow into the dominant player in the industry.
Due to numerous legal restrictions, such as granting of an FCC license, and high fi xed
start-up costs, Sirius does not have to be concerned with the threat of new entrants
into the broadcast and cable industry. This allows Sirius to focus on concerns with 3
the future of their own company, as opposed to competing with emerging companies.
Although the company has many prospects, it still has a possibility of failure for
several reasons, including disruptions in weather and a lack of fi nancial backing. As of
now, Sirius Radio has taken the right steps to become the world’s largest provider of
satellite radio.
4

market capitalization in billions
Figure Figure 33: The market capitalization of a company refers its size which can be used to compare : The market capitalization of a company refers its size which can be used to compare with other company’s in the same industry. Sirius currently has a market capitalization of $6.79 billion which places the company in the mid cap range. XM, Sirius’ main competitor, has a market capitalization of $5.83 billion. When considering the entire Broadcast and Cable TV industry, XM and Sirius fall short in market cap compared to Clear Channel Communication (CCU). As the leader of market cap, CCU has the largest company size in the industry of $18.26 billion, placing the company in the big/large market cap market. Sirius, XM, and Clear Channel Communication all dwarf the other companies in the industry who together have a market cap of $817.29 million which places them in the small market cap scale.
industry overviewand analysis
Five Forces Modelforce 1: rivalry among existing fi rms
Broadcasting and cable TV is a high growth industry consisting of three key companies:
Clear Channel Communication, Sirius, and XM. Sirius and XM have little differentiation,
mainly in that both provide customers with the service of commercial-free satellite
radio. They differ in the channels they offer and the products that their customers use
to listen to the satellite broadcast.
There is a steep learning curve that exists in the broadcast and cable TV industry. The
amount of research and development it takes to produce satellite radio creates rivalry in 5

an aggressive industry as all players strive to be the largest competitor in the business.
Sirius has high fi xed costs, which mainly consist of the process of creating
satellites and then launching them into space. Once a satellite is in place, variable
costs become almost nonexistent. Sirius has specialized assets for its industry,
consequently, there are high exit barriers that exist.
force 2: threat of new entrants
The economies of scale within the satellite radio industry are incredibly high. The
initial investment, along with the research and development involved in creating
new products, are among the highest costs. A large portion of the investment is in
the satellite. Advertising has also become a major role in the success of Sirius. The
company and product are both relatively new and rely on public image for sales. For
example, Sirius has joined the NFL to become the “Offi cial Radio Satellite Partner of
the NFL”. This partnership relates Sirius to the NFL in the eye of the consumer, and in
return, the connection helps sales tremendously.
Sirius, being one of the fi rst companies to introduce satellite radio, has developed
many fi rst mover advantages. Along with XM, Sirius has virtually taken over the
industry. The two companies have agreed to make unifi ed receivers that will receive
both Sirius and XM satellite signals, an agreement that will put new entrants at a huge
disadvantage. Sirius has also developed many relationships with key companies early,
including several car companies like Ford, Dodge, and BMW.
Sirius has developed many relationships, making broadcasting weather, sports,
entertainment, traffi c, and even children’s programming, trouble-free. Relationships
with companies such as ESPN, CNN, FOX, and the Weather Channel have caught
consumers’ interest in the company. Sirius has also forged strong bonds with the
NFL, NBA, and NHL, covering over 40 professional games a week. Important names
in entertainment like E!, Maxim, and Disney can all be heard on Sirius Radio. New
companies trying to start in the satellite radio industry would fi nd it extremely diffi cult
to compete without these prestigious relationships.
Sirius’ high degree of competitive advantage depends on the relationships it has with
its customers and business partners. Sirius has a wide customer base, serving over
1500 million customers. They offer radio service in various plans giving consumers
a variety of choices, including monthly, yearly, and even lifetime commitments.
Binding these customers to long-term plans poses a challenge for companies to
enter the industry and establish relationships of their own.
The legal barriers in the satellite radio industry primarily consist of broadcast and
satellite licensing. Sirius, along with other companies attempting to emerge in the
industry, is regulated by the Federal Communications Commissions (FCC) under
the Communications Act of 1934. One major advantage Sirius has is its license to
privately operate its own satellite network. Sirius is one of only two companies given
this license. Any companies trying to fi nd a spot in the industry cannot begin without
a satellite license. Unfortunately for them, the FCC is granting few, if any.
force 3: threat of substitute products
In the broadcast industry there are several substitute products, including AM/FM radio 6

and competitors’ satellite radio. Consumers may be willing to listen to AM/FM radio
instead of satellite radio simply because of convenience and cost. On the other hand,
buyers who prefer quality satellite radio broadcasting will only have two choices: Sirius
and XM. In this case, Sirius will not have a high threat of substitutes because there
is only one other major player in the industry as of now. Highly complex technology
and heavy regulations in the industry keeps outsiders from entering into the satellite
radio industry, which allows Sirius and XM to disregard the threat of substitute satellite
products. force 4: bargaining power of buyers
Buyers of satellite radio vary in age from young to old, though a parent or legal
guardian must assume the obligations of the terms and conditions if the subscriber
is a minor. Sirius is currently offering an extensive line of programming, ranging
from sports and entertainment to talk shows, making Sirius appealing to both male
and female audiences. The newest, and arguably most well known, talk show host
to join Sirius’ program lineup is Howard Stern who can bring a vast audience to
Sirius. Income also doesn’t appear to have an impact on possible consumers, as
Sirius is available in range of makes and models of the cars, from Ford to Mercedes
and BMW. Switching costs for buyers is low, because the equipment required to
receive programming is mandated by the FCC to have the ability to receive broadcasts
from both XM or Sirius’ satellites, eliminating the need to buy new equipment when
switching from one provider to another.
With switching costs low and the level of differentiation among satellite radio providers
also low, customers will look at other aspects when deciding which to buy. Potential
buyers will focus on price differences and program availability, making it essential for
providers to offer competitive prices and quality service. This must be done in order to
gain greater market share. Sirius currently holds a customer base of 1.24 million and
expects to double that by the end of 2005. On a volume basis, each customer will have
purchased at least one satellite radio of some type, and will also pay either a monthly
or lifetime fee for the service. There is a mid to high level of price competition, as it
is a highly concentrated industry with low switching costs and a low level of product
differentiation. This gives the buyers substantial bargaining power, meaning Sirius has
less profi tability potential if buyers have considerable power of them.
force 5: bargaining power of suppliers
The wide variety of suppliers in the electronics industry results in weak bargaining
power in relation to Sirius. Sirius has the ability to choose the supplier with the lowest
price, and highest quality. In turn, they have the ability to provide their products to
customers at cheaper prices than their competitors. Although the hardware required
is highly technical, the multitude of suppliers allows Sirius to pick and chose from
whom they want to buy and the amount they want to purchase, giving them an edge
in bargaining power. Sirius has much profi t potential by having an edge over their
suppliers.
7
company overview
strengths
One of Sirius’s paramount strengths is the amount of commercial-free channels
offered. Sirius offers 65 channels with entirely commercial-free listening, while its
closest competitor, XM Satellite Radio, offers only 33 commercial free channels. As
one of the few competitors in the satellite radio industry, Sirius has taken major steps
with the world’s leading companies to set itself apart from the rest.
The leading car companies of the world are seeing just how effective and popular
satellite radio has become. Not only are they recognizing the new technology,
they are choosing Sirius over any of its competitors. Companies such as BMW,
DaimlerChrysler, and Ford are Sirius’ exclusive partners and represent nearly fi fty
percent of all cars sold annually in the United States. Sirius is fast becoming
fashionable in cars, and also becoming popular in boats, RVs, and even homes.
Their newest asset is mobile satellite television which Sirius plans to have available
in vehicles shortly.
Sirius increased its revenue nearly 1500% over the entire year of 2004 and shows the
potential to continue to grow in 2005. Sirius increased its 2005 subscriber guidance
to over 2.5 million. The costs of adding new customers have decreased since the
company’s inception in 2002. As the “Offi cial Satellite Radio Partner of the NFL”,
Sirius does not show signs of slowing down, but signs of continued development
and popularity.
weaknesses
Sirius is still working its way through a developmental stage and therefore, the future
is still unknown. Sirius entered the industry late, following another industry leader,
XM. The success of Sirius depends on the quantity of subscribers, and the late
start has greatly impacted this number. As of January 2004, Sirius had 1.24 million
subscribers compared to XM’s more than 3 million.
Sirius Radio is also weak in its ability to maintain its subscribers. The FCC required
that Sirius produce a product that can be compatible with all radio satellites, including
its competitors. This makes it incredibly simple for customers to change services
without having to pay much money.8
Still developing in a new industry, Sirius is heavily dependent on its third- party
partners. Partnerships with automakers, consumer electronic manufacturers, and
retailers, contribute to the survival of Sirius. If any of these partnerships were to fail,
Sirius would fi nd it diffi cult to survive.
opportunities
Sirius is one of only two big names in the satellite radio industry, and with such
a highly concentrated market there is a big need for innovation. With little to set
them apart from there competitor(s) they must utilize research and development
to explore new ways to distribute satellite radio to their customers. Usually in the
broadcast industry this comes in the form of partnerships. For example, Sirius has
partnered with Dish Network satellite TV, allowing Dish subscribers to access Sirius’
programming through their television set. Another area of opportunity would be in
the product line and programming offered by the company. Is there a product that
allows them to access satellite radio wherever they want to go? XM has just released
a “walkman” like satellite radio with a hefty price tag. Sirius does not offer one yet
but has an opportunity to provide a more affordable alternative. Lastly, what are people
listening to? Sirius just recently signed America’s most controversial talk show host,
Howard Stern. Because love him or hate him, this is sure to be a strong seller for
the company.
threats
Since the satellite radio industry is a new and emerging technology, there is a rising
threat of price competition and competition to be dominant in the industry. Sirius
offers a monthly subscription of $12.95, while XM Radio offers $12.95 every month.
XM offers 150 digital channels, with 67 commercial free, which poses a threat to Sirius
who only offers 120 channels, along with 65 commercial free. In 2004, XM offered
a monthly service of $9.99, but has since changed to $12.95 to match Sirius in the
industry’s price war.
Nature may be the biggest threat to Sirius, as well as XM. Having satellites in space
is extremely costly. Storms and disruptions in space threaten to shutdown these
companies, and imply a huge maintenance cost when something does go wrong.
It is costly to insure problems in space. These are risks many start-up companies do
not wish to face.
Costly operation, expenses, and possible technological failure, threaten the company’s
outlook for shareholders. Subscribers and consumers may be turned off to this new
industry, meaning Sirius has to spend a great deal in advertising and marketing to
emphasize the product as positive and worthwhile. However, rapid technological
and industrial advances could make satellite radio service irrelevant.
9
competitive strategyanalysis
Sirius Satellite Radio uses a differentiated competitive strategy to gain an advantage
in the industry. Sirius poured a large amount of money into research and development
in its earliest stages in order to establish a product that would change the way people
listen to radio. Future research and development costs depend on how Sirius modifi es
its equipment to adapt to future changes in technology. Sirius has also invested in
establishing a solid brand image. Its brand image allows customers to recognize and
identify the company, and may infl uence consumers to purchase Sirius products over
competitors.
Besides Sirius having a strong brand, they also provide superior customer service
and product quality. Sirius allows unsatisfi ed customers to use their personal receiver
from Sirius to switch providers without having to purchase a new receiver. Sirius also
continuously monitors customer ordering patterns to guarantee same-day shipments.
Sirius provides quality products that are portable and have the capability of being
transferred from car to radio and vice versa, with better reception compared to the
traditional car radio.
Although Sirius currently holds a competitive advantage in the industry, it may
not sustain its lead into the future. Sirius Satellite Radio’s business is vulnerable
if its satellites were to become faulty. The satellites and broadcasting studio can be
damaged from natural disasters such as meteor showers, earthquakes, fl oods and
other catastrophic events. The rapid advancement rate of technology could result
in Sirius’s equipment to become obsolete, and so Sirius would lose its competitive
advantage, leading to the company’s downfall.
10

formal accountinganalysis
In the accounting analysis we will be evaluating the credibility of Sirius’ accounting
practices. We will begin by assessing the quality and procedures of Sirius Satellite
Radio. This will be done using the six step qualitative method. The six steps consist
of identifying key accounting policies, accounting fl exibility, accounting strategy
evaluation, quality of disclosure, and potential “red fl ags.” We will also evaluate Sirius
using diagnostic ratios and compare them to Sirius’ main competitor, XM Satellite
Radio. This provides a quantitative look at Sirius’ accounting practices.
Identify Key Accounting Policiesinventory
Sirius Satellite Radio’s lack of tangible inventory results in different accounting policies
than many other companies, as it is a service company, not a retail or manufacturing
company. This lowers Sirius’ assets because there are no abundant amounts of excess
inventory to be accounted as an advantage for the company.
revenue
Sirius’ primary sources of revenue consist of subscription fees, as most customers
subscribe on a monthly or yearly basis. The company also obtains revenue from
activation fees, sales of advertising on commercial channels, and direct sale of satellite
radios. For example, if a customer bought a monthly subscription, he or she would
pay $12.95 at the beginning of each month, and also a $10 or $15 initial activation fee.
For the 2002 fi scal year, Sirius collected $13,759,000 in subscription fees and $534,000
in activation fees. The recognition of these subscription fees is recorded when the
customer subscribes and then amortized throughout the life of the subscription. The
activation fees are recorded when the activation takes place and recorded over a period
of 3.5 years. This is an estimation of the relationship life of a customer.
expenses
Expenses that Sirius incurs include satellite and transition costs, programming
and content, customer service and billing, general and administrative, research and
development, and advertising.
• Satellite and transition costs mostly consist of satellite insurance for the
possibility of unpredicted failure, and operation and maintenance of satellite
11

tracking costs.
• Program and content expenses include acquiring programming from third
parties.
• Customer service and billing consist of costs associated with handling
customer accounts.
• General and administrative expenses include rent and possession,
accounting, legal, and maintenance of shareholder relations. For the year
ending December 31, 2003, the general and administrative expenses jumped
from $5,529 to $36,211, due to increased legal fees. Legal fees and settlement
costs of $6,846 were incurred due to a contract termination with the provider
of Sirius’ subscriber management system, and an $1,158 increase in corporate
insurance. General and administrative fees are not one of Sirius’ largest
expenses due to steady agreements with trustworthy companies.
• Research and development costs for Sirius are expensed as they incur.
• Advertising costs are expensed as they incur over a period of time.
depreciation
Sirius’ satellite systems are depreciated over a 15-year-period, beginning when they
are placed into orbit, using straight-line deprecation. In addition to satellites, satellite
systems also include the cost of construction, launch vehicles, launch insurance, and
capitalized interest. Sirius maintains that the satellites are used consistently over a
15-year period, therefore depreciation would not change on a yearly basis. This could
prove to be an issue if the satellite fails before 15 years because Sirius’ estimates and
accounting would have to be changed accordingly to account for the total use and
projected loss of the satellite.
long-lived assets
Sirius carries its long-lived assets at cost, less accumulated depreciation, in
accordance with the generally accepted accounting principles. When the carrying
amount of a particular asset is not improvable, Sirius reviews the asset for impairment.
If impairment is identifi ed, then the amount will be measured to how far it exceeds fair
value. For example, Sirius has a Federal Communications Commissions (FCC) license,
carried at cost, which must be tested annually for impairments. Impairment would
cause Sirius to expense a portion of its FCC license. Impairments do not occur often,
but Sirius is prepared to account for them and abide by generally accepted accounting
principles.
stock based awards
Sirius uses the intrinsic value method to measure the reimbursement costs of stock-
based awards granted to shareholders. Sirius records non-cash compensation for
awards over the vesting time equal to the surplus of the market price of the common
stock at the date the award is granted. The value of the awards given is amortized to
a non-cash stock compensation account over the vesting period.
12

Since Sirius is in the service industry and has no tangible assets, the company has
several areas with a great deal of fl exibility regarding accounting practices. Most of
the fl exibility comes from the way subscription fees are recognized. Sirius provides
customers with both short-term subscription plans (monthly), and long-term plans
(one-year and lifetime plans). However, Sirius records these revenues the same, that
is, as the service is provided. The subscription fees are then depreciated over the life
of the plan. Also, Sirius estimates that a customer will stay with the company for an
average of 3.5 years. Therefore, the $499.99 that is paid for the lifetime subscription
will be depreciated over the 3.5 year estimated lifetime.
Sirius also has many accounting constraints, especially in how the company records
expenses. For example, due to regulations by the Statement of Financial Accounting
Standards (SFAS), created by the Financial Accounting Standards Board (FASB),
Sirius’ broadcasting costs for a specifi c number of sporting events must be amortized
on an event-by-event basis. The season-long contracts are amortized using the
straight-line method over the duration of the season. The research and development
expenses that go into the creation of new products, as well as the chip sets, are
recorded as they occur.
accounting fl exibility
13

Sirius’ accounting strategy is to act in accordance with generally accepted accounting
principles and the Securities and Exchange Commission (SEC). Sirius has extensive
footnotes disclosing information on their fi nancial statements, which assists in
clarifying any grey areas in reporting. In accordance with being a transparent
company, Sirius fully discloses all information, reporting every number on all fi nancial
statements. For example, viewing the balance sheet and noting that the FCC license
is reported the same from year to year would appear as though Sirius is circumventing
reporting certain criteria. Sirius is not amortizing its FCC license. Thus, Sirius is
over-valuing its FCC license because technology is not infi nitely lived and should
be amortized on a yearly basis.
In the satellite radio industry, Sirius’ main competitor, XM Radio, has similar
accounting strategies. XM and Sirius report inventory similarly, because both are
service companies in which there is not a great deal of inventory. When reporting
revenue, both XM and Sirius derive revenue from subscriber subscriptions and
activation fees, as well as, advertising. Both competitors incur expenses such as
general and administrative and customer service. However, both companies view
depreciation of their satellite systems differently. Sirius depreciates on a 15-year
basis, unlike XM, who depreciates over 17.5-years.
quality of disclosure
Sirius has disclosed information that is openly available to the public through its own
website, its investor’s websites, and government entities such as the Securities and
Exchange Commission (SEC). The company’s website features a corporate overview,
investor relations, and codes of ethic, press releases, and contact information. Each
individual link provides vital information regarding Sirius’ day to day operations and
allows interested customers/investors to personally depict and become educated on
the entire company.
Sirius Satellite Radio discloses extensive footnotes to help investors understand the
fi nancial statements. The company does not guarantee that the information is free
from error, but will try, to the best of their knowledge, to report accurate numbers.
Sirius’ accounting fi rm assure Sirius’s accounting procedures are in line with the
generally accepted accounting principles (GAAP) and the Financial Accounting
accounting strategyevaluation
14

Net Sales/Cash from salesNet Sales/Net Accounts ReceivableNet Sales/Unearned RevenuesNet Sales/Warranty LiabilitiesNet Sales/Inventory
Sales/AssetsChanges in CFFO/OIChanges in CFFO/NOATotal Accruals/Change in SalesPension Expense/SG&AOther Employment Expenses/SG&A
20031N/A0.874N/AN/A
0.010.0150.128-4.830.02N/A
20021N/A0.46N/AN/A
00.2320.144116.30.04N/A
sirius diagnostic ratios
15
Standards Board (FASB), but do not promise that the information is correct.
Sirius does however lack in certain areas of disclosure. The company fails to properly
unveil what exactly their other assets are. We have found that Sirius’ reports neither
accounts receivable or inventory in their fi nancial statements. According to fi nance.
yahoo.com, both of these accounts are listed as zero. We have determined that Sirius
does not have accounts receivable because the company collects subscription fees
prior to service. We have discovered that they do not carry inventory because they are
strictly a service oriented company. Sirius does not record warranty liabilities because
they have no inventory to warrant. Sirius lists pension expenses under other long-term
liabilities and is recognized as the present value of the future obligations. In 2003,
the fi nancial statement footnotes reveal that the company’s pension expenses were
$801,000. As Sirius’s revenue grows, the company will be able to pour more money
into retirement benefi ts. The company’s 10-K and 10-Q, which are reported to the SEC,
fully disclose all activities and actions taken by Sirius and are available to the entire
public.
With no accounts receivable recorded, we assume that their revenues and cash from
sales are the same. Therefore, we arrive at a ratio of one for net sales/cash from sales
for both years of recorded sales. Sirius’ balance sheet lists other assets which led us to
assume that accounts receivable may have been a part of this, yet through research on
fi nance.yahoo.com we found an accounts receivable balance of zero. In contrast, XM’s
net sales/cash from sales result in 1.19 (2003) and 6.79 (2002) because XM does list
accounts receivable as part of their balance sheet.

Satellite Radio for the years 1999 through 2003. For 1999 and 2000, the ratio is zero because no sales were made by either company during these years. From 2002 to 2003 both Sirius’ and XM’s asset turnover ratio made a fairly large increase. Sirius’ increased from 0.0005 to 0.0096, while XM’s increased from 0.0163 to 0.0879.
potential “red fl ags”
A 2002-2003 investigation of Sirius uncovered a debt-restructuring entry under the
expense portion of the income statement. In 2002, Sirius reported ($8,448,000)
compared with 2003 where it was stated at $256,538,000. This sent up a red fl ag
for investors who were studying Sirius’ fi nancial statements. The apprehension
was heightened as net income (net loss) shows ($422,481,000) in 2002 and
($226,215,000) in 2003. After further investigation, it was found that in March of 2003,
Sirius issued 545,012,162 shares of common stock for 91% of outstanding debt. This
lowered the expense balance and the net losses for the year ended 2003. Therefore,
investors can disregard this issue, as Sirius is a new company and the exchange of
stock for debt is consistent with the survival of young companies.
Based on calculations of total accruals/change in sales we arrived at 116.3 for 2002
and -4.83 for 2003. This raised a big red fl ag due to the drastic change. The change
is primarily due to a non-cash gain associated with debt restructuring that occurred
during 2003 causing the nominator (total accruals) to be much smaller than the
previous year.
undo accounting distortions
The accounting distortions may be undone by amortizing the FCC license from year to
year. This would cause Sirius’ assets to decline in amount because the company is not
currently amortizing their FCC license as we feel they should be. Their actions towards
the FCC license leads to an overvalued asset account. Only when Sirius amortizes the
FCC license will the asset account be accurate.
The chart above compares the asset turnover ratio of Sirius to that of its main competitor XM Satellite Radio for the years 1999 through 2003. For 1999 and 2000, the ratio is zero because
16
ratio analysis & forecast fi nancials
Our goal in forecasting the following fi nancial ratios is to fi nd trends and propensities
in past performance for Sirius Satellite Radio. We will examine the fi nancial statements
of Sirius, and its main competitor XM, in order to pinpoint possible opportunities
and threats. The analysis and comparison is done in an effort to forecast the fi nancial
statements for the next ten years. With our data analysis we can predict the longevity
and profi tability of Sirius as a company and to its shareholders. However, we can not
determine the industry’s average because Sirius is a new company and has only one
major competitor, XM. With such a new and highly concentrated industry, information
is limited and each number therefore becomes crucial. The scarce amount of data
hinders our ability to precisely predict future performance. Therefore as analysts we
must dig deeper through the information available to provide a clear and valuable
forecast of Sirius’ fi nancial future.
17

sirius satellite’s fi nancial statement ratio overviewOur goal in forecasting the following fi nancial ratios is to fi nd trends and propensities
in past performance for Sirius Satellite Radio. We will examine the fi nancial statements
of Sirius, and its main competitor XM, in order to pinpoint possible opportunities
and threats. The analysis and comparison is done in an effort to forecast the fi nancial
statements for the next ten years. With our data analysis we can predict the longevity
and profi tability of Sirius as a company and to its shareholders. However, we can not
determine the industry’s average because Sirius is a new company and has only one
major competitor, XM. With such a new and highly concentrated industry, information
is limited and each number therefore becomes crucial. The scarce amount of data
hinders our ability to precisely predict future performance. Therefore as analysts we
must dig deeper through the information available to provide a clear and valuable
forecast of Sirius’ fi nancial future.
Current RatioQuick Asset RatioAccounts Receivable TurnoverDays Sales OutstandingInventory TurnoverDays Supply of InventoryWorking Capital Turnover
19992.852.44N/AN/AN/AN/A0
20003.652.38N/AN/AN/AN/A0
liquidity analysis
20015.695.12N/AN/AN/AN/A0
20024.133.59N/AN/AN/AN/A-0.001
20037.076.71N/AN/AN/AN/A0.04
20043.012.82N/AN/AN/AN/A0.12
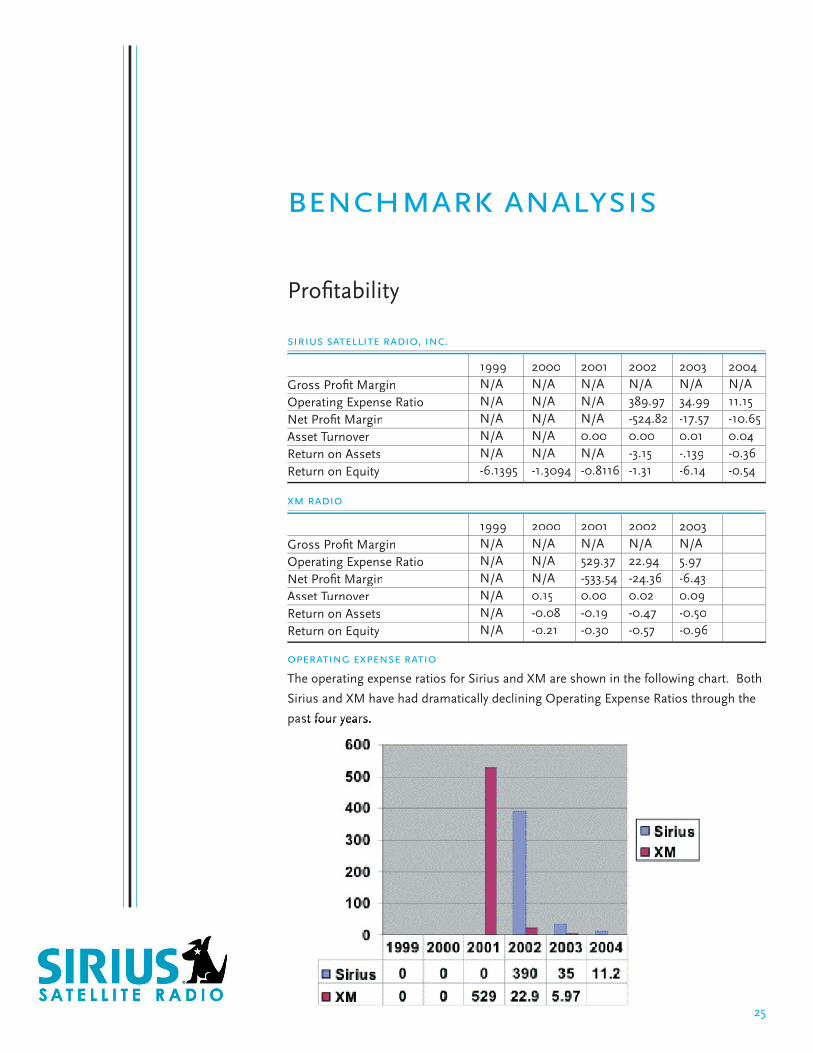
Gross Profi t MarginOperating Expense RatioNet Profi t MarginAsset TurnoverReturn on AssetsReturn on Equity
1999N/AN/AN/AN/AN/A-6.1395
2000N/AN/AN/AN/AN/A-1.3094
profi tability analysis
2001N/AN/AN/A0.00N/A-0.8116
2002N/A389.97-524.820.00-3.15-1.31
2003N/A34.99-17.570.01-.139-6.14
2004N/A11.15-10.650.04-0.36-0.54
Debt to Equity RatioTimes Interest EarnedDebt Service Margin
19994.49N/AN/A
20001.633.74N/A
capital structure analysis
20011.881.88N/A
200218.192.95-7.40
20030.158.66-4.32
20040.66-16.11-2.54
18

liquidity analysis
Current RatioQuick Asset RatioAccounts Receivable TurnoverDays Sales OutstandingInventory TurnoverDays Supply of InventoryWorking Capital Turnover
19992.852.44N/AN/AN/AN/A0
20003.652.38N/AN/AN/AN/A0
sirius satellite radio, inc.
20015.695.12N/AN/AN/AN/A0
20024.133.59N/AN/AN/AN/A-0.001
20037.076.71N/AN/AN/AN/A0.04
20043.012.82N/AN/AN/AN/A0.12
Sirius’ current ratio is on the rise, steadily improving from 1999 to 2004. However,
in 2002 there was a slight fall in the current ratio due to taking on more debt. Sirius
shows a gradual improvement in its quick asset ratio. The ratio was consistent from
1999 to 2000, but in 2001 there was a large increase in quick assets, primarily due to
an enlargement in marketable securities. In 2002 there was a reduction in the quick
asset ratio, due to signifi cant decrease in marketable securities, opposite in relation
to the previous year. In 2003 the ratio nearly doubled because even though liabilities
increased, current assets were up 300 percent. However, in 2004 Sirius took on more
current liabilities, therefore, decreasing their quick asset ratio.
Since Sirius Satellite Radio is a service oriented company, they lack inventory, which
makes it impossible to calculate inventory turnover and days supply of inventory.
Sirius also collects its fees before they provide service to their customers, so as a
result, they have no accounts receivable. Prior to 2002 Sirius did not record any sales;
therefore, working capital turnover was zero. In 2002 sales were recorded, but not
enough to overcome the negative working capital, producing a negative .001 working
capital turnover ratio. In 2003 and 2004 a positive working capital turnover ratio was
recorded of .04 and 0.12 due to an increase of sales for those years.
19

profi tability analysis
For all of our profi tability analysis ratios from 1999 to 2001 there is a value of zero, due
to a start up period were no sales were conducted. Sirius does not have gross profi t
margin because the company is service oriented. The operating expense ratio in 2002
started out at 389.97, but dropped signifi cantly to 34.99 in 2003 and 11.15 in 2004
because of reduced costs and rapidly improving sales. Though sales are growing,
Sirius is still not producing a profi t with a net profi t margin of -10.65 in 2004 and
-17.57 in 2003 up from -524.82 in 2002. Sirius’ asset turnover ratio is listed as zero in
2002 because sales in comparison to their assets were extremely minimal. This ratio
increased in 2003 to .01 and then again to 0.04 in 2004, due to further boost in sales.
Due to a large amount of debt, Sirius has a negative net income, and our return on
assets is also negative at -.315 in 2002 up to -.139 in 2003 and -0.36 in 2004. Sirius’
net income is increasing, therefore, return on equity is getting closer to zero.
Gross Profi t MarginOperating Expense RatioNet Profi t MarginAsset TurnoverReturn on AssetsReturn on Equity
1999N/AN/AN/AN/AN/A-6.1395
2000N/AN/AN/AN/AN/A-1.3094
sirius satellite radio, inc.
2001N/AN/AN/A0.00N/A-0.8116
2002N/A389.97-524.820.00-3.15-1.31
2003N/A34.99-17.570.01-0.139-6.14
2004N/A11.15-10.650.04-0.36-0.54
20

capital structure analysis
Sirius’ debt to equity ratio started out at 4.49 in 1999, but improved to 1.63 in 2000
and 1.88 in 2001, due to an increase in stockholder’s equity and a reduction of
liabilities. This ratio shot to 18.19 in 2002 after Sirius implemented a plan to buyback
much of the company’s own stock. In addition, Sirius drastically reduced the price per
share of common stock sold to various partners such as Ford, and DaimlerChrysler.
This ratio experienced another drastic change in 2003 moving to 0.15 and again
to 0.66 in 2004. As sales increased, so did their stockholder’s equity, moving from
$36,846 the previous year to $1,325,194. As a result of reduced liabilities,
the company’s volatility that is associated with a startup company dropped.
Sirius recorded times interest earned in 2000 of 3.74. The next year, in 2001 it dropped
to about 1.88 because of an increase in borrowing. Since then it has been improving
going from 2.95 in 2002 up to 8.66 for fi scal year 2003, and almost doubling in 2004
to 16.11. Despite the steady increase in sales Sirius is still experiencing negative cash
fl ows. This is evident in the debt service margin ratio, starting out in 2002 with a -7.4
improving to a -4.32 in 2003 and -2.54 in 2004.
Debt to Equity RatioTimes Interest EarnedDebt Service Margin
19994.49N/AN/A
20001.633.74N/A
sirius satellite radio, inc.
20011.881.88N/A
200218.192.95-7.40
20030.158.66-4.32
20040.66-16.11-2.54
21

sirius’ sustainable growth rate
Sirius’ sustainable growth rate (SGR), which is a gauge of how much a business can
grow without borrowing more money, is negative. Sirius’ average SGR over the past
two years is a negative 3.725, due to the fact that Sirius has negative net income. In
its fi rst few years, Sirius has borrowed an extreme amount of money to pay for its
satellites and products, which makes the companies sustainable growth rate negative,
but increasing each year. After Sirius produces a positive SGR, the company will have
to borrow resources from another source to assist in more growth.
22

benchmark analysis
Liquidity
Current RatioQuick Asset RatioAccounts Receivable TurnoverDays Sales OutstandingInventory TurnoverDays Supply of InventoryWorking Capital Turnover
19992.852.44N/AN/AN/AN/A0
20003.652.38N/AN/AN/AN/A0
sirius satellite radio, inc.
20015.695.12N/AN/AN/AN/A0
20024.133.59N/AN/AN/AN/A-0.001
20037.076.71N/AN/AN/AN/A0.04
20043.012.82N/AN/AN/AN/A0.12
Current RatioQuick Asset RatioAccounts Receivable TurnoverDays Sales OutstandingInventory TurnoverDays Supply of InventoryWorking Capital Turnover
1999N/A4.50N/AN/AN/AN/A0
20004.853.35N/AN/AN/AN/A0
xm radio
20012.371.841.12325.89N/AN/A0.0034
2002.360.085.3767.97N/AN/A-0.24
20031.640.696.9752.37N/AN/A0.96
Current Ratio
The following chart shows the current ratios of Sirius and XM from the years 1998
through XM. As shown, Sirius’ current ration has improved over the last 5 years.
In 2003 Sirius had a better current ratio then XM.
23

accounts receivable turnover
The following chart shows the Accounts receivable turnover for Sirius and XM from
1999 to 2004. Sirius does not have any accounts receivable, making the turnover zero
for all years.for all years.
working capital
The following chart shows the working capital of Sirius and XM. Both companies
turned a positive working capital by 2003.turned a positive working capital by 2003.
The previous charts visually explain Sirius’ liquidity analysis compared to its main
competitor, XM. XM’s current ratio was consistently higher then Sirius’ for the fi rst 4
years. By 2003, Sirius’ boosted their current assets and had a higher Current ratio. As
shown on the accounts receivable turnover chart, Sirius has no Receivable turnover.
This is because Sirius has no accounts receivable. The working capital turnover chart
shows that Sirius did not have any turnover until 2002, which was a negative number.
However, in 2003 it slightly increased out of the negatives to .04.24
benchmark analysis
Profi tability
Gross Profi t MarginOperating Expense RatioNet Profi t MarginAsset TurnoverReturn on AssetsReturn on Equity
1999N/AN/AN/AN/AN/A-6.1395
2000N/AN/AN/AN/AN/A-1.3094
sirius satellite radio, inc.
2001N/AN/AN/A0.00N/A-0.8116
2002N/A389.97-524.820.00-3.15-1.31
2003N/A34.99-17.570.01-.139-6.14
2004N/A11.15-10.650.04-0.36-0.54
Gross Profi t MarginOperating Expense RatioNet Profi t MarginAsset TurnoverReturn on AssetsReturn on Equity
1999N/AN/AN/AN/AN/AN/A
2000N/AN/AN/A0.15-0.08-0.21
xm radio
2001N/A529.37-533.540.00-0.19-0.30
2002N/A22.94-24.360.02-0.47-0.57
2003N/A5.97-6.430.09-0.50-0.96
operating expense ratio
The operating expense ratios for Sirius and XM are shown in the following chart. Both
Sirius and XM have had dramatically declining Operating Expense Ratios through the
past four years.past four years.
25

net profi t margin
Net profi t margin for Sirius and XM through the years 1999 though 2004 is shown in
the following chart. This chart shows that both companies have had an improving Net
profi t margin over the past four years.profi t margin over the past four years.
asset turnover
The asset turnover ratios for Sirius and XM are shown below. Both company’s asset
turnover ratios have been gradually improving over the past four years.turnover ratios have been gradually improving over the past four years.
26
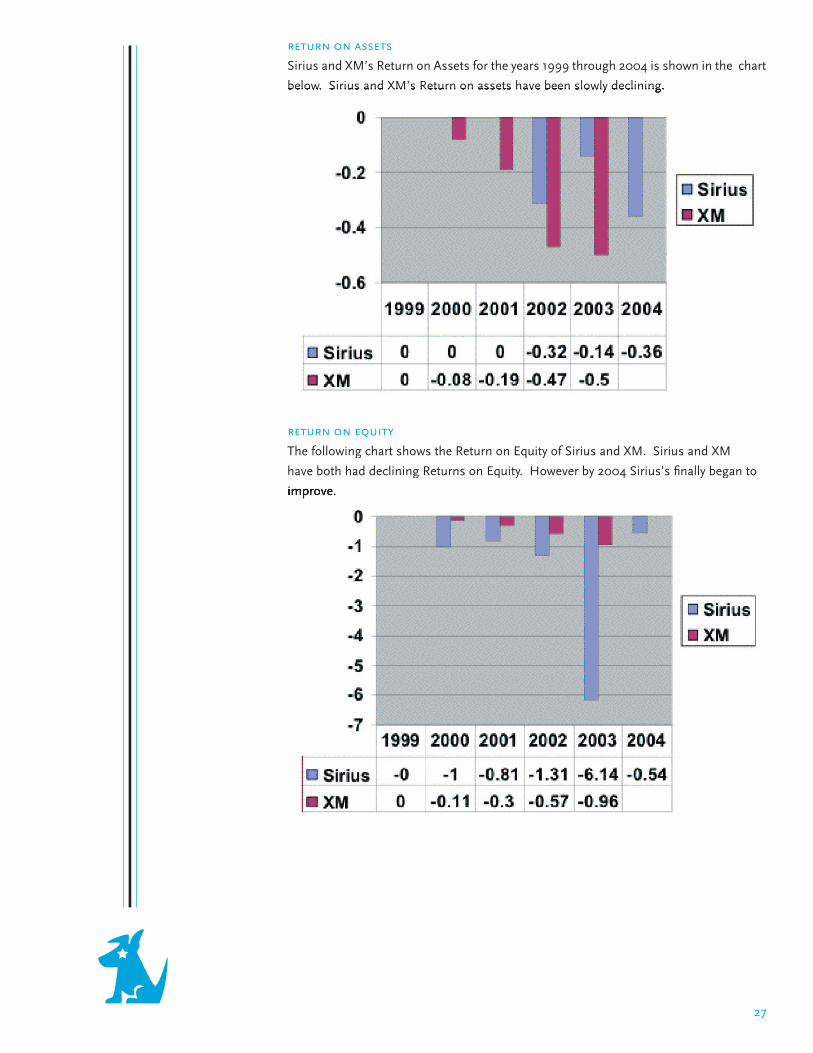
return on assets
Sirius and XM’s Return on Assets for the years 1999 through 2004 is shown in the chart
below. Sirius and XM’s Return on assets have been slowly declining.below. Sirius and XM’s Return on assets have been slowly declining.
return on equity
The following chart shows the Return on Equity of Sirius and XM. Sirius and XM
have both had declining Returns on Equity. However by 2004 Sirius’s fi nally began to
improve.improve.
27

The set of charts show Sirius’ profi tability analysis compared to XM. The operating
expense ratio chart shows declining ratios for both Sirius and XM. XM’s Operating
Expense begins in 2001, while Sirius’ do not start until 2002. The net profi t margins
for both companies are increasing out of the negatives. In 2002 Sirius had a very low
net profi t margin but mad a dramatic increase from -524.82 to -17.57 on 2003. Both
companies have had very low asset turnover ratio. This is because the Satellite radio
industry is new and both companies are just starting out. Therefore, Sirius and XM are
making an extremely small amount of sales per dollar. Sirius’ return on assets starting
in 2002 is negative but increasing. XM on the other hand, has a declining return on
assets. XM has maintained a relatively stable return on equity throughout the past
four years, declining very slightly. Sirius, compared to XM, makes a large decrease
from -1.31 to -6.14.
28

Debt to Equity RatioTimes Interest EarnedDebt Service Margin
19994.49N/AN/A
20001.633.74N/A
sirius satellite radio, inc.
20011.881.88N/A
200218.192.95-7.40
20030.158.66-4.32
20040.66-16.11-2.54
benchmark analysis
Capital Structure
Debt to Equity RatioTimes Interest EarnedDebt Service Margin
1999N/AN/AN/A
20002550.733.74N/A
xm radio
20010.45N/A0.02
20020.45N/A0.56
20032.11N/A2.31
times interest earned
The times interest earned for Sirius Satellite Radio is shown in the chart above. Sirius
had am improving times interest earned until 2004. In 2004 it dropped from 8.66
to -16.11.to -16.11.
29

debt service margin
The Debt service margin for Sirius Satellite Radio is shown in the following chart.
Sirius’ debt service margin has been slowly improving over the past three years.Sirius’ debt service margin has been slowly improving over the past three years.
debt to equity
The chart below shows the debt equity ratios of Sirius and XM. XM as maintained
a stable debt to equity ratio over the past 7 years. Sirius debt to equity has also been
stable with the exception of 2002. In 2002 the ration jumped from 2.03 to 18.19.
The fi nal three charts visualize the capital structure of Sirius compared to XM. Sirius’
times interest earned bounces around from 2000 to 2003. By 2003 it reached its
highest point at 8.66. XM has no times interest earned. Sirius’ debt service margin
is very different compared to XM. Sirius has a negative debt to service margin in
2002 and 2003. XM’s debt service margin starts in 2001 at 1.51 and makes a very large
increase to 230.7. Sirius has had relatively stable debt to equity from 1999 to 2003
with the exception of 2002. In 2003 the ratio jumped up to 18.19. XM’s debt to equity
has slowly increased for the past 4 years.30

fi nancial statementforecasting
Sales Growth Rate (See Appendix 3.1)
For the fi rst three years Sirius had a zero percent sales growth rate. This is because
Sirius was just starting out and fi nanced mainly through debt. Also, Sirius failed to
generate signifi cant revenues from 1999 to 2001. In 2002 and 2003 the sales growth
rate was found to be 805,000% and 1,599%. For 2005, we predict that the company’s
growth will decrease to 303.4% per year because we believe the company will begin
to level off from its large expansion years in 2003 and 2004. We feel that the number
of subscribers will begin to decline, in relation to the size of the company and will
continue to decrease slightly to 298.8%. This continuous trend of diminishing sales
growth continues from 2006 to 2014 as shown in Table 4.1.
Sirius’ growth rate reaches 22.04% in 2014 after increasing from every year from 2002.
We believe that this is an accurate portrayal of the company’s growth rate because
Sirius is a start-up company and will have enormous beginning growth and will taper
off each year there after. In comparison to XM Satellite Radio, our investigation
revealed that the sales growth patterns are quite similar. This is because XM is also
a relatively new company in the satellite radio broadcasting industry.
Liquidity Forecast
We have decided that Sirius’s current ratio would average 5.0 between 2005 and 2014.
We believe that current assets and current liabilities will begin to increase at an equal
rate over the span of ten years. This number was calculated by averaging the current
ratio between 1999 and 2004 and we feel this accurately portrays future growth in
current ratio. We believe Sirius’ quick asset ratio will rise to 8.0 in 2005 due to heavy
increase in sales and will begin to incrementally decrease until 2008, where it will
maintain a 5.0 average. Inventory turnover and accounts receivable turnover ratios
can not be determined because Sirius does not hold inventory and has no accounts
receivable. Due to the fact that we believe Sirius’ current ratio will maintain a steady
rate, the company’s working capital ratio will increase at a stable rate. Sirius’ sales
will increase causing working capital to increase. Overall, Sirius’ liquidity level is
stabilizing.
31

Profi tability Forecast
Sales will begin to even out as the company ages. The operating expenses ratio
will continuously decrease until leveling off due to increases in sales in relation to
operating expenses. Net profi t margin will eventually move into the positive level
because revenues will out way expenses in 2009. The asset turnover ratio will steadily
increase by .01 until 2010 when it stabilizes because sales will increase as compared
to total assets. Return on assets will slightly increase once again becoming positive
in 2009. The return on equity will steadily increase by 1 % until 2010 when it levels
off at 8% for remainder years. Overall, the profi tability of the company will become
positive in 2009 when the company begins to generate revenues.
Capital Structure Forecast
Debt to equity was forecasted using an average of the past fi ve years of fi nancial data
excluding 2002. We excluded 2002 in light of Sirius’ action to buyback a large portion
of their own stock which caused a riff in the trend of data. Based on our forecasts we
are expecting this ratio to be improving. Our forecasts for times interest earned were
also based off of an average and we concluded that it would be steadily improving until
about 2010 where it will start to level out. This is based off the fact that net income
will be increasing as sales are expected to grow. Our predictions for debt service
margin were derived by our assumptions based on other ratios because cash fl ow has
only been recorded for the past two years. With this said we are sure of the fact that
this ratio will be improving along with the others because of the growth and revenue
expected in years to come. In conclusion, Sirius’ capital structure is by accounting
standards unstable yet common for a startup company. It is only a matter of time
before we see a dramatic advance in capital structure as startup debts are paid down
and profi ts rise.
Income Statement Forecast (See Appendix 3.4)
In forecasting numbers for the income statement we fi rst predicted a sales growth rate
for years 2005 through 2014. This allows us to forecast future numbers in the income
statement. For example in 2004 we had a sales growth rate of 519.38% which we used
to fi nd the total revenue by taking the predicted sales rate times the previous year’s
total revenue. Since XM has not released their 10K report for 2004, we are unable to
compare sales growth rates. Through our forecasting we discovered that total revenue
will increase every year reaching $5,290,325,686 in 2014.
By forecasting total revenue we are now able to forecast net income for Sirius. We
calculated net income by taking total revenue for the forecasted year times the net
profi t margin for that same year. From this, one can see that by 2010 Sirius will be
making a profi t of $838,324. This is a turnaround for Sirius since years prior to 2010;
they had not made a profi t.
Income from continuing operations saw a huge jump from 2002 to 2003 because
of debt restructuring, which caused the continuing operating income to increase
from $(109,354,000) to $211,315,000. For 2005 through 2014, the company steadily 32

increased its operating income from $77,888,472 to $1,587,097,706. In 2004
continuing operating income started lower than the previous year because debt
restructuring was nonexistent.
Due to the fact that Sirius is a service company, the company does not have cost of
goods sold or gross profi t. Although they do not have these fi gures, we feel that there
are two major portions of operating expenses. First, we separated operating expenses
into customer operating expense, which is a variable cost. Under customer operating
expenses lays customer service and billing, and subscriber acquisition costs. Next, we
separated fi xed operating expenses, which include satellite and transmission expenses.
We can not forecast certain cost such as satellite and transmission and the cost of
equipment because these are fi xed and will only be incurred in the beginning of our
operation.
It is diffi cult to forecast Sirius’ proforma income statement because they are a start up
company and only have a few years of revenue earnings to base our forecast off of.
Balance Sheet Forecast (See Appendix 3.2)
From the asset turnover ratio, we predicted a steady increase of .01 every year through
2014. We also forecasted the total assets from the asset turnover ratio. For 2005 we
took our estimated total revenue divided by asset turnover, which is 0.02. This shows
that our sales are greater than our total assets, which is where Sirius needs to be.
We predict that Sirius will report the company’s FCC license, under the asset portion
of the balance sheet at around $83,000,000 every year for the next ten years.
According to our accounting distortions, we believe that the FCC license should be
amortized each year, which in return, will decrease the asset portion of Sirius’ balance
sheet. Total current assets are predicted to steadily increase rather evenly from now
until 2014. Total non current assets are predicted to increase but at a more uneven
rate. As Sirius grow, so will total current and non current liabilities.
Cash Flow Statement Forecast (See Appendix 3.6)
Looking at the cash fl ow statement from 1999 until 2004, we do not have a steady
trend on any categories that would allow us to forecast ten years out. Being a new
company, Sirius has volatile fl uctuating cash fl ows from year to year, going from
positive to negative and being nearly impossible to forecast. As a start up company,
the company has different categories compared to a company that has cash fl ows for
many years. This is one of the weaknesses that attribute to being a new company.
However we feel that Sirius wont have positive cash fl ow from operating and investing
activities until 2010.
33

forecast analysis conclusion
After analyzing the industry, it is obvious that Sirius is in a period of growth with
potential profi ts in the near future. With that said, Sirius’ large amount of deg and
relatively new cash fl ows make it an extremely risky investment.
In this segment, different methods are used to value Sirius. This will give us the
opportunity to see whether Sirius is properly valued and if not to then adjust our
investment decision accordingly. Sirius does not pay dividends making the discount
dividend model irrelevant to our valuation analysis. Aside from the discount dividend
model, the methods used to valuate Sirius include free cash fl ows, residual income,
and abnormal earnings growth. After completing these valuations we can decide
based on our actual reported value if Sirius is overvalued, undervalued, or valued
properly.
34
valuation analysis
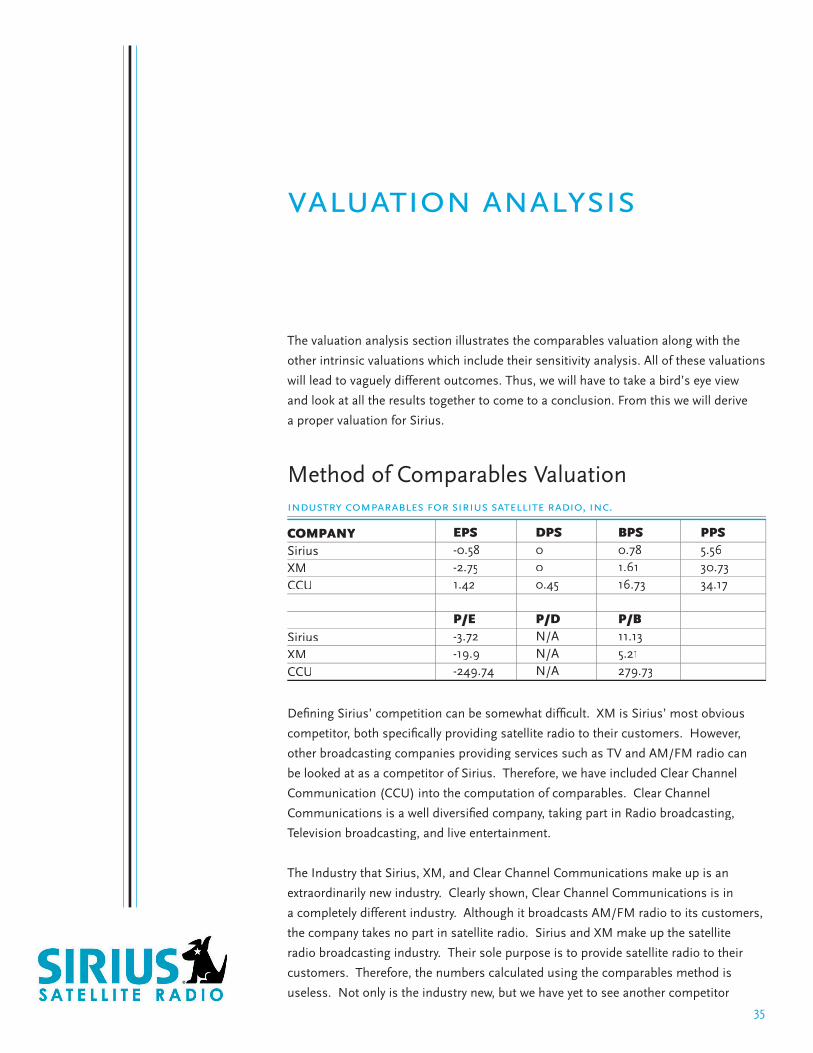
The valuation analysis section illustrates the comparables valuation along with the
other intrinsic valuations which include their sensitivity analysis. All of these valuations
will lead to vaguely different outcomes. Thus, we will have to take a bird’s eye view
and look at all the results together to come to a conclusion. From this we will derive
a proper valuation for Sirius.
Method of Comparables Valuation
COMPANYSiriusXMCCU
SiriusXMCCU
EPS-0.58-2.751.42
P/E-3.72-19.9-249.74
DPS000.45
P/DN/AN/AN/A
industry comparables for sirius satellite radio, inc.
BPS0.781.6116.73
P/B11.135.21279.73
PPS5.5630.7334.17
Defi ning Sirius’ competition can be somewhat diffi cult. XM is Sirius’ most obvious
competitor, both specifi cally providing satellite radio to their customers. However,
other broadcasting companies providing services such as TV and AM/FM radio can
be looked at as a competitor of Sirius. Therefore, we have included Clear Channel
Communication (CCU) into the computation of comparables. Clear Channel
Communications is a well diversifi ed company, taking part in Radio broadcasting,
Television broadcasting, and live entertainment.
The Industry that Sirius, XM, and Clear Channel Communications make up is an
extraordinarily new industry. Clearly shown, Clear Channel Communications is in
a completely different industry. Although it broadcasts AM/FM radio to its customers,
the company takes no part in satellite radio. Sirius and XM make up the satellite
radio broadcasting industry. Their sole purpose is to provide satellite radio to their
customers. Therefore, the numbers calculated using the comparables method is
useless. Not only is the industry new, but we have yet to see another competitor
35

2 year Beta, R-Squared3 year Beta, R-Squared5 year Beta, R-SquaredPublished BetaCost of EquityBefore Tax WACCAfter Tax WACCCost of DebtEffective Tax Rate
4.48, 13.616%3.63, 20.92%4.22, 24.728%4.1615.9%4%8%2.32%-0.01
sirius variables
try and enter the market.
When trying to compare Sirius and XM, using P/E, PD, and P/B are insuffi cient. First
of all, both companies have a negative EPS and when calculating P/E, you exclude all
companies with negative EPS. Comparing Sirius and XM using P/D is also extraneous.
Both companies have never paid out dividends. Finally, without a benchmark BPS,
comparing Sirius and XM would make no sense. We would consider Clear Channels
BPS an outlier and exclude it from our calculations. By comparing Sirius’ book value
to the company’s market value, we found the value of the fi rm to be 8.24.
Cost of Capital Estimation
We calculated Sirius’ cost of equity to be .159. This is the amount of return that Sirius’
common stockholders require. Sirius’ cost of debt is calculated to be 2.32. This is
the rate that Sirius is paying on all of its debt. Sirius has a greater cost of debt because
it is a rather new company and is still fi nancing the company using debt. When
calculating the WACC of Sirius, we found a before tax WACC of .04 and an after tax
WACC of .08. This is an average expected return on the company’s securities.
R-Squared is the measurement of how closely a stock’s performance compares with
the performance of a benchmark index such as the S&P 500, and thus a weight of what
portion of its performance can be explained by the performance of the overall market.
R-Squared values range from zero to one. A rate that is close to zero indicates no
correlation at all; while, a value close to one, specifi es a perfect correlation to the
index. Evaluating a fi ve year r-squared value for Sirius Satellite Radio, we found that
Sirius has a less than average correlation of 0.24728. This value changed to 0.20920
when evaluating only three years of association to the S&P 500, meaning Sirius has
less correlation in the short run. In the shortest run of two years, Sirius Satellite’s
r-squared value is 0.13616; meaning Sirius has little to no correlation to the S&P 500
index.
Annual Yield
To calculate the average risk free rate and then the cost of equity, we decided to use
a fi ve year treasury maturity rate as our annual yield. We determined that a fi ve year
rate was most relevant because most investors invest longer than one or three months
and usually past one to three years. Therefore, a fi ve year rate would be the most
accurate measure to calculate the cost of equity.
36

sensitivity analysis
The fi rst method we used to value Sirius was the free cash fl ow model. To get an
estimated share price, the free cash fl ow model values the fi rm using the weighted
average cost of capital (WACC) based on a fl ow of free cash fl ows. Using ratios and
our free cash fl ow statement, we had to forecast and estimate cash fl ows out to 2014.
To estimate the current share price of Sirius, we must assume these estimated cash
fl ows are correct, and this allows us to forecast the free cash fl ow to Sirius. To fi nd the
free cash fl ow to the fi rm, we added the cash fl ow from operations and cash fl ow used
by investing activities. We found our WACC before tax to be 0.04, which helps us to
fi nd the discounted WACC for the forecasted years. After discounting each WACC back
to 2004, by dividing each number by one plus WACC and raised to each power, we
found the present value of free cash fl ows. The total present value of the annual cash
fl ows came to be $30,198,702. Next, we had to fi nd the present value of the continuing
terminal value. Assuming no growth, we found that to be $2,394,618,146. By adding
in the present value of the annual cash fl ows, we found the value of the fi rm at the end
of 2005 to be $2,424,816,848. To fi nd Sirius’ value of equity, we took the value of the
fi rm and subtracted out the value of debt from the balance sheet. Finally, to fi nd the
estimated value per share, we took our value of equity at the end of 2005 and divided
it by our total number of shares outstanding, which happen to be 1,276,922,634.
intrinsic valuationmethods
Free Cash Flow
g00 0.050.05 0.10.1 0.150.15
0.11 ($0.90) ($0.79) $0.49 $0.49 -1.43-1.430.13 ($0.95) ($0.88) ($0.61) -1.70.15 ($0.97) ($0.94) ($82.00) N/AN/A0.17 ($0.99) -$0.97-$0.97 ($0.91) ($0.57)0.19 ($1.01) ($0.99) ($0.96) ($0.85)
WACC
The chart above shows how different amounts of growth, along with a changing weighted average cost of capital gives Sirius a different value each time. Assuming no growth and an increasing WACC, the share price of Sirius decreases each time. With an 11% WACC and a steady increase in growth, the value of Sirius increases. However, Sirius is a start up company, and these numbers hardly represent the share price. The cash fl ow statement fi gures are skewed and represent a start up company, not a company that has been traded for a while.
37

sensitivity analysis
Discounted Dividends
Sirius Satellite can not be measured by the discounted dividends model. Sirius does
not pay out dividends, meaning calculating the dividends model is impossible and
irrelevant.
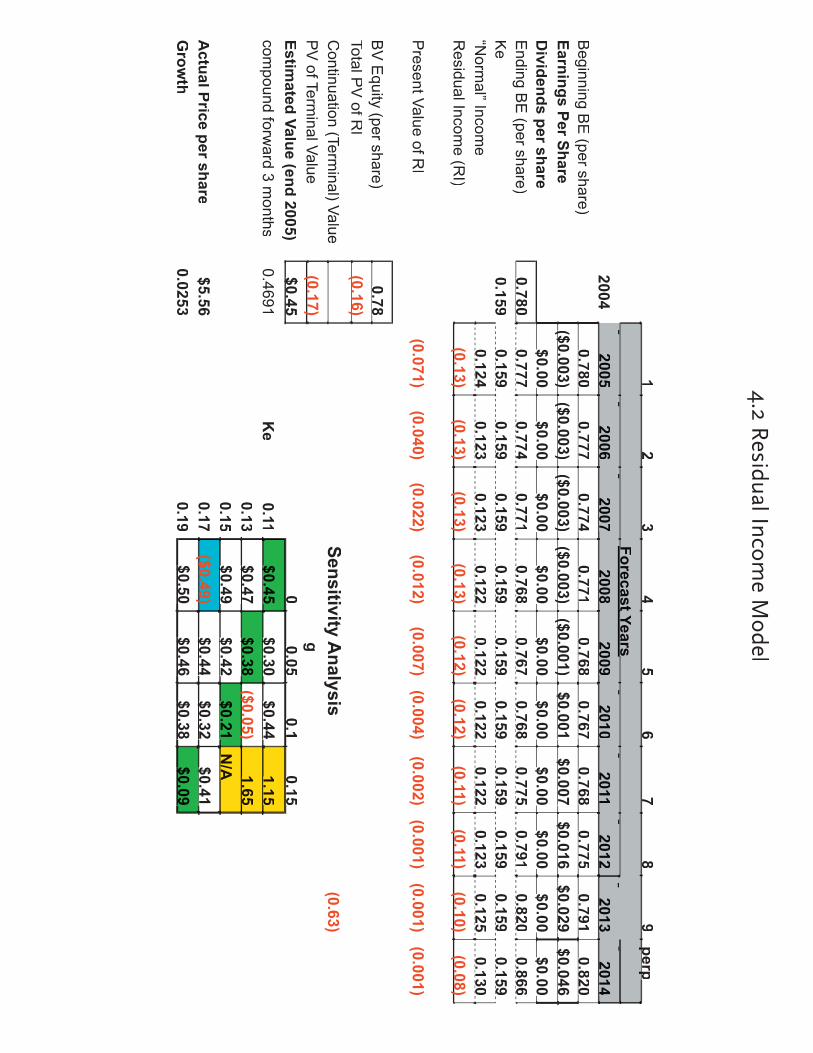
Residual Income
We measured Sirius Satellite using the residual income model based on analyzing a
fl ow of forecasted incomes that have been discounted back to 2004 values. To fi nd
ending book value of equity, we took Sirius’ beginning book value of equity, added in
our earnings per share, and subtracted out dividends per share, which in Sirius’ case,
is always zero. To fi nd “normal” income, we took our ending book value of equity per
share and multiplied it by our cost of equity (Ke). The difference of earnings per share
and “normal” income gives us our residual income. We then discounted all of our
forecasted present value residual incomes back to 2004 present values. For example,
to fi nd our 2005 present value residual income, we took the present value residual
income divided by one plus the growth rate raised to the fi rst power. To fi nd 2006’s
present value residual income, we divided by one plus the growth rate and raised it
to the second power, and so on. We found our total present value of residual income
to be (0.16) and found our present value of our terminal value using our sensitivity
analysis to be (0.15).
With a Ke of 15.9%, we found that Sirius estimated value at the end of 2005 to be
$0.45. We feel that this number is far to low because Sirius is a start up company
and overall, many numbers affect this value per share. Being a start up company with
negative income, no dividends, etc., we feel that this number does not represent Sirius
at all. With an actual price per share of $5.56, Sirius is shown to be over-priced and
not worth investing. However, this is far from the truth because Sirius is a start up
company and will have much growth in the upcoming years.
The chart above shows how different amounts of growth, along with a changing cost of equity gives Sirius a different value each time. We found that with an increase in Ke and a steady growth rate, the share price of Sirius increases. No cost of equity or growth rate can make Sirius close to its actual traded share price. An 11% cost of equity and a 15% growth rate, however, makes Sirius closer to its current share price, but still not comparable. Once again, it is hard to tell using the residual income model if Sirius is over or under valued because they are a start up company with many fl awed and misinterpreted numbers.
g00 0.050.05 0.10.1 0.150.15
Ke 0.11 $0.45 $0.45 $0.45 $0.45 $0.30 $0.30 $0.30 $0.30 $0.44 $0.44 1.151.150.13 $0.47 $0.47 $0.38 $0.38 $0.38 $0.38 ($0.05) 1.651.650.15 $0.49 $0.49 $0.49 $0.49 $0.42 $0.42 $0.21 $0.21 $0.21 $0.21 N/AN/A0.17 ($0.49) $0.44$0.44 $0.32 $0.32 $0.41 $0.41 $0.41 $0.41 0.19 $0.50 $0.50 $0.46 $0.46 $0.38 $0.38 $0.09 $0.09 $0.09
According to this model, Sirius is over-priced to the extreme end. This however is untrue. Sirius’ growth in the upcoming years will change these models and make the share price seem much more reasonable.
38

sensitivity analysis
Abnormal Earnings Growth
After calculating the abnormal earnings growth, we found that Sirius should
be valued at $.08 per share. This is signifi cantly lower then its current share price of
$5.56. We calculated this by dividing the Core Earnings per share by the Capitalization
rate. The Abnormal Earnings Growth model is an ineffi cient method of calculating
Sirius’ share value. Sirius has paid out no dividends and therefore has no dividends
per share, which is part of the reason the Abnormal Earnings Growth model is not very
appropriate.
g00 0.050.05 0.10.1 0.150.15
Ke 0.11 $0.11 $0.11 $0.11 $0.11 $0.11 $0.11 $0.11 $0.11 $0.11 $0.11 0.110.110.13 $0.09 $0.09 $0.09 $0.09 $0.09 $0.09 $0.09 $0.09 $0.09 $0.09 0.090.090.15 $0.08 $0.08 $0.08 $0.08 $0.08 $0.08 $0.08 $0.08 $0.08 $0.08 0.080.080.17 $0.07 $0.07 $0.07 $0.07 $0.07$0.07 $0.07 $0.07 $0.07 $0.07 $0.07 $0.07 0.19 $0.06 $0.06 $0.06 $0.06 $0.06 $0.06 $0.06 $0.06 $0.06
With such a low cost of equity and growth rate, Sirius is a risky fi rm. Since the share
value is so low, Sirius will most likely have trouble pleasing their investors in the near
future.
39

altman’s z-score
The Z-Score for Sirius Satellite Radio is calculated at -1.46. This is low Z-Score and can
be explained by several factors. First of all, Sirius is a very capital intensive company
with a very large amount of assets. The three satellites Sirius has in space are perfect
examples. Since Sirius is still a new company, sales are still very low compared to
total assets. Sales in 2004 were $66,854,000 while total assets were $1,957,613,000.
Also, Sirius has negative earnings before interest and taxes as well as negative
retained earning. Sirius’ 2004 EBIT and retained earnings were $-666,575,000
and $-1,865,856,000. This low Z-Score shows a struggling company with a very
unpredictable and risky future.
Z-Score=
1.2(541,526,000/1,957,613,000) + 1.4(1,865,856,000/1,957,613,000)
+ 3.3(-666,575,000/1,957,613,000)
+ .6(1,000,633,000/956,980,000)
+ 1.0(66,854,000/1,957,613,000)
= (1.4646)
40

summary of valuations
For Sirius Satellite Radio, the valuation models do not closely represent the value of
the company. According to the outcome of our valuation models, there is a fi fty cent
difference in outcomes of share price. The abnormal earnings growth model skewed
the overall outcome of the models because it relies heavily on dividends, in which
Sirius does not pay dividends. Each model does not accurately portray Sirius’ publicly
traded share price because Sirius is a start up company with negative income and
huge expenses, etc. which allows for unrealistic numbers based on the models.
MODELCash FlowResidual IncomeAbnormal Earnings GrowthActual Share Price (4.1.05)
ESTIMATED SHARE PRICE$0.84$0.45$0.08$5.56
According to these estimated share price values, Sirius is outrageously over priced.
However, because Sirius is a start up company, these prices can not be used to
compare and estimate the actual price of Sirius. These numbers will more closely
represent the actual share price in later years, but as of now, Sirius has not been
around long enough to have these models closely determine the price of the fi rm.
It is hard to determine if one should invest in Sirius or not. One can not base
an investment decision on our valuation model fi ndings. From our forecasts, we
see Sirius becoming a profi table company, in which Sirius’ estimated valuation
share prices will increase along with the actual share price. We believe Sirius will
be a profi table investment because they are in a relatively new industry with few
competitors. Car dealerships, radio disk jockeys, and many other companies are
recognizing the foreseeable future of Sirius and have signed contracts with the
company. As of now, Sirius is over-valued and could be considered an investment
to hold, with the possibility of seeing improvements in actual price compared to
share price.
41

42

references
1. www.edgarscan.pwcglobal.com
2. www.fi nance.yahoo.com
3. www.sec.gov
4. www.sirius.com
5. www.xmradio.com
6. www.morningstar.com
43

appendix
3.1 ratio analysis3.2 balance sheet3.3 proforma balance sheet3.4 income statement3.5 proforma income statement3.6 cash fl ow statement3.7 proforma cash fl ow statement4.1 free cash fl ow model4.2 residual income model4.3 abnormal earnings growth model
44
45
3.1 Ratio Analysis

47
3.2 Balance Sheet
49
3.3 ProForma Balance Sheet

51
3.4 Income Statement

53
3.5 ProForma Income Statment

55
3.6 Cash Flow Statement

57
3.7 ProForma Cash Flow Statement

59
4.1 Free Cash Flow Model

61
4.2 Residual Income Model
12
334
5566
788
99perpperpperpperp
Forecast YearsForecast YearsForecast YearsForecast Years
200420052005
20062006
20072007
20082008
20092009
20102010
20112011
20122012
20132013
20142014
Beginning B
E (per share)
0.7800.780
0.7770.777
0.7740.774
0.7710.771
0.7680.768
0.7670.767
0.7680.768
0.7750.775
0.7910.791
0.8200.820
Earnings Per Share($0.003)($0.003)
($0.003)($0.003)
($0.003)($0.003)
($0.003)($0.003)
($0.001)($0.001)
$0.001 $0.001
$0.007 $0.007
$0.016 $0.016
$0.029 $0.029
$0.046 $0.046
Dividends per share
$0.00 $0.00
$0.00 $0.00
$0.00 $0.00
$0.00 $0.00
$0.00 $0.00
$0.00 $0.00
$0.00 $0.00
$0.00 $0.00
$0.00 $0.00
$0.00 $0.00
Ending B
E (per share)
0.7800.780
0.7770.777
0.7740.774
0.7710.771
0.7680.768
0.7670.767
0.7680.768
0.7750.775
0.7910.791
0.8200.820
0.8660.866
Ke
0.1590.1590.159
0.1590.159
0.1590.159
0.1590.159
0.1590.159
0.1590.159
0.1590.159
0.1590.159
0.1590.159
0.1590.159
“Norm
al” Income
0.124 0.124
0.123 0.123
0.123 0.123
0.122 0.122
0.122 0.122
0.122 0.122
0.122 0.122
0.123 0.123
0.125 0.125
0.130 0.130
Residual Incom
e (RI)
(0.13)(0.13)
(0.13)(0.13)
(0.12)(0.12)
(0.11)(0.11)
(0.10)(0.08)
Present Value of R
I(0.071)
(0.040)(0.022)
(0.012)(0.007)
(0.004)(0.002)
(0.001)(0.001)
(0.001)
BV
Equity (per share)
0.780.78
Total PV
of RI
(0.16)C
ontinuation (Terminal) Value
Sensitivity Analysis
(0.63)P
V of Term
inal Value (0.17)
gEstim
ated Value (end 2005)$0.45 $0.45
000.050.05
0.10.1
0.150.15
compound forw
ard 3 months
0.4691K
e0.11
$0.45 $0.45 $0.45 $0.45
$0.30 $0.30 $0.30 $0.30
$0.44 $0.44
1.151.15
0.13$0.47 $0.47
$0.38 $0.38 $0.38 $0.38
($0.05)1.651.65
0.15$0.49 $0.49 $0.49 $0.49
$0.42 $0.42
$0.21 $0.21 $0.21 $0.21
N/A
N/A
Actual Price per share
$5.56 0.17
($0.49)$0.44$0.44
$0.32 $0.32
$0.41 $0.41 $0.41 $0.41
Grow
th0.0253
0.19$0.50 $0.50
$0.46 $0.46
$0.38 $0.38
$0.09 $0.09 $0.09
4.2 Residual Incom
e Model

63
4.3 Abnormal Earnings Growth Model

12
334
5566
788
99perp
Forecast YearsForecast YearsForecast YearsForecast Years
200420052005
20062006
20072007
20082008
20092009
20102010
20112011
20122012
20132013
20142014
EP
S(0.003)
(0.003)(0.003)
(0.003)(0.001)
0.001 0.001
0.007 0.007
0.016 0.016
0.029 0.029
0.046 0.046
DP
S0.00 0.00
0.00 0.00
0.00 0.00
0.00 0.00
0.00 0.00
0.00 0.00
0.00 0.00
0.00 0.00
0.00 0.00
0.00 0.00
DP
S
0.00 0.00
0.00 0.00
0.00 0.00
0.00 0.00
0.00 0.00
0.00 0.00
0.00 0.00
0.00 0.00
0.00 0.00
Cum
-Dividend E
arnings(0.00)
(0.00)(0.00)
(0.00)0.00 0.00
0.01 0.01
0.02 0.02
0.03 0.03
0.05 0.05
Norm
al Earnings
-0.0033-0.0033
-0.0033-0.0033
-0.00398-0.00398
-0.00319-0.00319
-0.00059-0.00059
0.0007910.000791
0.0076930.007693
0.0181620.018162
0.0335530.033553
Abnorm
al Earning G
rowth
Norm
al Earnings
Abnorm
al Earning G
rowth
Norm
al Earnings
(AE
G)
0.00 0.00
(0.00)0.00 0.00
0.00 0.00
0.00 0.00
0.01 0.01
0.01 0.01
0.01 0.01
0.01 0.01
$0.00 P
V Factor
0.8628130.744446
0.6423170.5542
0.4781710.412572
0.3559720.307137
0.265002
PV
of AE
G0.00039
-0.00010.000791
0.0014860.000608
0.0024120.002839
0.0033130.003325
Continuing (Term
inal) Value$0.00
PV
of Terminal Value
$0.00 Total P
V of A
EG
0.015063C
apitalization Rate (perpetuity)
0.159Average perp
$0.01 C
ore EP
S(0.003)
Value Per S
hare$0.08
pv4-D
ec0.079724
fv1-A
prK
e0.159
0.1590.159
0.1590.159
0.1590.159
0.1590.159
0.1590.159
g0.0253
Sensitivity Analysis
g00
0.050.05
0.10.1
0.150.15
Ke
0.11$0.11 $0.11 $0.11 $0.11
$0.11 $0.11 $0.11 $0.11
$0.11 $0.11
0.110.11
0.13$0.09 $0.09
$0.09 $0.09 $0.09 $0.09
$0.09 $0.09 $0.09 $0.09
0.090.09
0.15$0.08 $0.08 $0.08 $0.08
$0.08 $0.08
$0.08 $0.08 $0.08 $0.08
0.080.08
0.17$0.07 $0.07 $0.07 $0.07
$0.07$0.07
$0.07 $0.07
$0.07 $0.07 $0.07 $0.07
0.19$0.06 $0.06
$0.06 $0.06
$0.06 $0.06
$0.06 $0.06 $0.06
4.3 Abnorm
al Earnings Grow
th Model

grade allocation
65
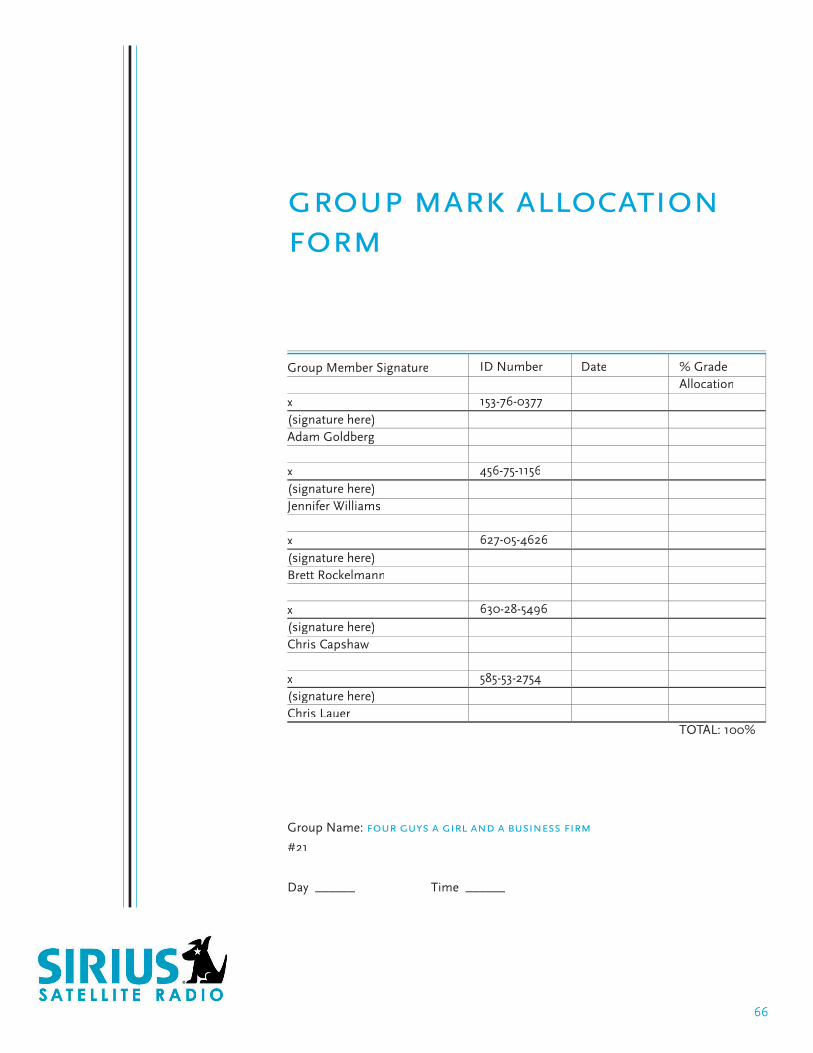
group mark allocation form
Group Member Signature
x(signature here)Adam Goldberg
x(signature here)Jennifer Williams
x(signature here)Brett Rockelmann
x(signature here)Chris Capshaw
x(signature here)Chris Lauer
ID Number
153-76-0377
456-75-1156
627-05-4626
630-28-5496
585-53-2754
Date % Grade Allocation
TOTAL: 100%
Group Name: four guys a girl and a business fi rm
#21
Day ______ Time ______
66