single-particle characterization of sars-cov-2 isoelectric
TRANSCRIPT
Michigan Technological University Michigan Technological University
Digital Commons @ Michigan Tech Digital Commons @ Michigan Tech
Michigan Tech Publications
7-28-2021
Single-particle characterization of SARS-CoV-2 isoelectric point Single-particle characterization of SARS-CoV-2 isoelectric point
and comparison to variants of interest and comparison to variants of interest
Oluwatoyin Areo Michigan Technological University, [email protected]
Pratik U. Joshi Michigan Technological University, [email protected]
Mark Obrenovich Louis Stokes Cleveland VA Medical Center
Moncef Tayahi University of Cincinnati
Caryn L. Heldt Michigan Technological University, [email protected]
Follow this and additional works at: https://digitalcommons.mtu.edu/michigantech-p
Part of the Chemical Engineering Commons
Recommended Citation Recommended Citation Areo, O., Joshi, P. U., Obrenovich, M., Tayahi, M., & Heldt, C. L. (2021). Single-particle characterization of SARS-CoV-2 isoelectric point and comparison to variants of interest. Microorganisms, 9(8). http://doi.org/10.3390/microorganisms9081606 Retrieved from: https://digitalcommons.mtu.edu/michigantech-p/15269
Follow this and additional works at: https://digitalcommons.mtu.edu/michigantech-p
Part of the Chemical Engineering Commons

microorganisms
Communication
Single-Particle Characterization of SARS-CoV-2 IsoelectricPoint and Comparison to Variants of Interest
Oluwatoyin Areo 1,2, Pratik U. Joshi 1,2, Mark Obrenovich 3,4,5, Moncef Tayahi 6 and Caryn L. Heldt 1,2,*
�����������������
Citation: Areo, O.; Joshi, P.U.;
Obrenovich, M.; Tayahi, M.; Heldt,
C.L. Single-Particle Characterization
of SARS-CoV-2 Isoelectric Point and
Comparison to Variants of Interest.
Microorganisms 2021, 9, 1606. https://
doi.org/10.3390/microorganisms9081606
Academic Editor: Teresa
Antonia Santantonio
Received: 13 June 2021
Accepted: 25 July 2021
Published: 28 July 2021
Publisher’s Note: MDPI stays neutral
with regard to jurisdictional claims in
published maps and institutional affil-
iations.
Copyright: © 2021 by the authors.
Licensee MDPI, Basel, Switzerland.
This article is an open access article
distributed under the terms and
conditions of the Creative Commons
Attribution (CC BY) license (https://
creativecommons.org/licenses/by/
4.0/).
1 Department of Chemical Engineering, Michigan Technological University, Houghton, MI 49931, USA;[email protected] (O.A.); [email protected] (P.U.J.)
2 Health Research Institute, Michigan Technological University, Houghton, MI 49931, USA3 Louis Stokes Department of Veterans Affairs Medical Center, Department of Infectious Disease,
Cleveland, OH 44106, USA; [email protected] The Gilgamesh Foundation for Medical Science, Research and Education, Cleveland, OH 44116, USA5 Case Western Reserve University, Department of Chemistry, Cleveland, OH 44106, USA6 Department of Electrical Engineering and Computer Science, University of Cincinnati,
Cincinnati, OH 45221, USA; [email protected]* Correspondence: [email protected]; Tel.: +1-906-487-1134
Abstract: SARS-CoV-2, the cause of COVID-19, is a new, highly pathogenic coronavirus, which is thethird coronavirus to emerge in the past 2 decades and the first to become a global pandemic. Thevirus has demonstrated itself to be extremely transmissible and deadly. Recent data suggest that atargeted approach is key to mitigating infectivity. Due to the proliferation of cataloged protein andnucleic acid sequences in databases, the function of the nucleic acid, and genetic encoded proteins,we make predictions by simply aligning sequences and exploring their homology. Thus, similaramino acid sequences in a protein usually confer similar biochemical function, even from distalor unrelated organisms. To understand viral transmission and adhesion, it is key to elucidate thestructural, surface, and functional properties of each viral protein. This is typically first modeled inhighly pathogenic species by exploring folding, hydrophobicity, and isoelectric point (IEP). Recentevidence from viral RNA sequence modeling and protein crystals have been inadequate, whichprevent full understanding of the IEP and other viral properties of SARS-CoV-2. We have thusexperimentally determined the IEP of SARS-CoV-2. Our findings suggest that for enveloped viruses,such as SARS-CoV-2, estimates of IEP by the amino acid sequence alone may be unreliable. Wecompared the experimental IEP of SARS-CoV-2 to variants of interest (VOIs) using their amino acidsequence, thus providing a qualitative comparison of the IEP of VOIs.
Keywords: emerging viruses; surface characterization; biophysics; adhesion; adsorption; dipole
The recent pandemic involving SARS-CoV-2, which causes COVID-19, representsserious and emerging threats worldwide. While the majority of COVID-19 cases are largelyasymptomatic or mild clinical presentation, some can be severe or deadly in infectedpatients. Severe cases often develop acute respiratory distress syndrome and are deadlyin spite of intubation, mechanical ventilation, and costly ICU care. Coronaviruses, suchas SARS-CoV-2, are single-stranded, RNA macromolecules that have complex surfacephysicochemical properties, which give rise to their adsorption behavior. The adsorptionof the virus to surfaces could give rise to increased transmission. BLAST and FASTA scansare typical search tools, which are performed on a nucleotide or amino acid sequenceto impart structural information or predict the protein function. Information from otherstructural methods, such as protein crystallography, help to elucidate function and behavior.However, we sometimes find that the prediction of function and other features, such asisoelectric point (IEP), are not accurate and experimental measurements must be performed.
Understanding virus adsorption can help to facilitate safe practices. For example,learning how to repel viruses from surfaces or to adsorb them could be used to improve
Microorganisms 2021, 9, 1606. https://doi.org/10.3390/microorganisms9081606 https://www.mdpi.com/journal/microorganisms

Microorganisms 2021, 9, 1606 2 of 6
filtration devices and personal protective equipment. The physicochemical properties of thevirus paired with environmental conditions facilitate virus adsorption [1,2]. The adhesionmechanism through which viruses are adsorbed is driven by electrostatic [3] and van derWaals interactions [4], as described by the extended Derjaguin–Landau–Verwey–Overbeek(XDLVO) model [5,6]. These interactions are controlled by environmental factors such aspH, temperature, and humidity [7]. Disrupting the adsorption of a virus to a surface canbe achieved by manipulating the factors that contribute to the interactions.
Viruses have extremely complicated structures compared to proteins. One of the mostprominent interactions for adsorption is electrostatic. While proteins can be described bytheir charge and IEP, which is the pH at which they are neutrally charged [8,9], this typeof description is more difficult for viral particles. Nonenveloped viruses have a proteinshell that folds into a large nanoparticle structure. However, enveloped viruses, such asSARS-CoV-2, have glycosylations and a lipid bilayer, making surface characterization muchmore difficult to predict and require experimental measurements.
Conventional methods for measuring virus IEP use bulk viral solutions. Zeta potentialmeasures the electrostatic potential difference between the electric double layer surround-ing the virus particle and the surrounding solution at the shear plane [10]. However,zeta potential requires a large volume of highly concentrated virus sample and is limitedby virus solubility [11] and the presence of impurities [12]. Another IEP measurementis isoelectric focusing (IEF) [13] and capillary isoelectric focusing (CIEF) [14]. Both IEFmethods require the fluorescent tagging of viruses, which requires pure, concentratedsolutions [15]. Different methods are needed to measure virus IEP in natural solutionswithout high purity and concentration requirements.
We developed a single-particle method to measure the IEP of virus with an atomicforce microscope (AFM). The technique, called chemical force microscopy (CFM), usesa functionalized AFM tip to measure the adhesion force of the functionalized AFM tipand the virus immobilized on a surface [16,17]. The adhesion is measured in different pHsolutions, thus measuring a range of electrostatic interactions near the IEP. The IEP forthe nonenveloped porcine parvovirus was found to be 4.8–5.1 [16] and this was foundto be similar as the value determined by IEF of 5.0 [18]. However, when the IEP for themain surface protein was calculated with UniProtKB using the entire protein sequence, theIEP was determined to be 5.8 [16]. For the enveloped bovine viral diarrhea virus (BVDV),the discrepancy between the measured IEP value with CFM and the calculation of theIEP of the main spike protein was even greater, at 4.3–4.5 and 6.9, respectively [16]. Dueto the post-translational modifications such as glycosylation, and the presence of a lipidmembrane, it is more imperative that enveloped viruses have a measured IEP and do notuse the calculated value from the spike protein amino acid sequence.
Since CFM is a new method to measure virus IEP, we are still learning about thenuances of this method. The AFM tips used must have a low spring constant (around0.1 N/m), as the forces we are measuring are in the picoNewton range. We have alsofound that the magnitudes of the forces from the carboxylic acid probe are less than thequaternary amine [16,17]. This may be because the charge is permanent on the quaternaryamine versus the carboxylic acid which is deprotonated at most pHs used in this work.We also noticed that the larger the force measured, the larger the spread in the histogramsof the data for each data point. It is likely that the higher the force, the more sensitivethe method is to the contact area of the probe to the virus. There are likely some forcemeasurements that, instead of hitting the virus directly down, may only hit the side of thevirus or the probe, thus reducing the force of that measurement since fewer molecules fromthe tip come into contact with the virus. As we study more viruses, we will continue toperfect this method.
The IEP of SARS-CoV-2 has been calculated in different ways and can be found inTable 1. The IEP ranges from 5.2–6.2. This is a large range when the goal is to either adsorb,trap, or repel the virus using electrostatic forces. The IEP values were obtained based onthe identified proteins on SARS-CoV-2. The FASTA sequence was input into the Protparam

Microorganisms 2021, 9, 1606 3 of 6
tool from the Bioinformatics Resource Portal ExPASy [19] to obtain the values of the IEPbased on the protein sequence. A major disadvantage is that calculated IEP values do notconsider that some amino acids are buried when the protein folds and do not take intoaccount any post-translational modifications.
Table 1. Summary of current IEP values for SARS-CoV-2 S protein.
Calculation/Method Protein IEP Reference
Amino acid sequence SARS-CoV-2 spike glycoprotein 5.9 [20]ProtParam SARS-CoV-2 spike glycoprotein 6.24 [21]ProtParam His-tagged SARS-CoV-2 RBD 1 8.91 [14]
CIEF His-tagged SARS-CoV-2 RBD 1 7.36–9.85 [14]CIEF S1/S2 subunit with His-tag 4.41–5.87 [14]
1 RBD–receptor binding domain.
We used CFM to measure the IEP of SARS-CoV-2. Heat-inactivated and gamma-irradiated SARS-CoV-2 (USA-WA1/2020) isolates from BEI resources were covalently boundto a glass slide (see Figure 1a) and height analysis was performed on a Bruker DimensionICON AFM with the ScanAsyst system (Santa Barbara, CA, USA) using a Bruker AC-40 AFMprobe. The heat-inactivated virus contained many small particles (Figure S1) and was notfurther tested. The gamma-irradiated virus was immobilized on a glass slide, as describedin Figure 1a. NT-MDT CSG10 gold-coated AFM probes were functionalized with thiol-C12molecules that terminated in either a carboxylic acid (for a negatively-charged probe) or a qua-ternary amine (for a positively-charged probe). The adhesion force between the charged probeand the covalently bound virus using NHS/EDC chemistry was measured in 20 mM citratebuffer between pH 4–6 or 20 mM phosphate buffer at pH 7.0 with an AFM. By measuring arange of pHs, the IEP could be determined, as described previously [16,17], and is shown inFigure 1. The measured IEP for SARS-CoV-2 (USA-WA1/2020) was 5.2–5.3. This is on the lowend of the IEPs from the calculated sources shown in Table 1. In our previous study usingthe enveloped virus BVDV, the CFM measurement was very different from the calculatedIEP using the amino acid sequence [16]. We obtained a similar result with the envelopedSARS-CoV-2 in the present study. This trend may be evidence that, unlike nonenvelopedviruses, calculated IEP may be less reliable for an enveloped virus than values obtained usingCFM or another experimental method.
Microorganisms 2021, 9, x FOR PEER REVIEW 3 of 6
trap, or repel the virus using electrostatic forces. The IEP values were obtained based on
the identified proteins on SARS-CoV-2. The FASTA sequence was input into the Prot-
param tool from the Bioinformatics Resource Portal ExPASy [19] to obtain the values of
the IEP based on the protein sequence. A major disadvantage is that calculated IEP values
do not consider that some amino acids are buried when the protein folds and do not take
into account any post-translational modifications.
Table 1. Summary of current IEP values for SARS-CoV-2 S protein.
Calculation/Method Protein IEP Reference
Amino acid sequence SARS-CoV-2 spike glycoprotein 5.9 [20]
ProtParam SARS-CoV-2 spike glycoprotein 6.24 [21]
ProtParam His-tagged SARS-CoV-2 RBD 1 8.91 [14]
CIEF His-tagged SARS-CoV-2 RBD 1 7.36–9.85 [14]
CIEF S1/S2 subunit with His-tag 4.41–5.87 [14] 1 RBD–receptor binding domain.
We used CFM to measure the IEP of SARS-CoV-2. Heat-inactivated and gamma-ir-
radiated SARS-CoV-2 (USA-WA1/2020) isolates from BEI resources were covalently
bound to a glass slide (see Figure 1a) and height analysis was performed on a Bruker Di-
mension ICON AFM with the ScanAsyst system (Santa Barbara, CA, USA) using a Bruker
AC-40 AFM probe. The heat-inactivated virus contained many small particles (Figure S1)
and was not further tested. The gamma-irradiated virus was immobilized on a glass slide,
as described in Figure 1a. NT-MDT CSG10 gold-coated AFM probes were functionalized
with thiol-C12 molecules that terminated in either a carboxylic acid (for a negatively-
charged probe) or a quaternary amine (for a positively-charged probe). The adhesion force
between the charged probe and the covalently bound virus using NHS/EDC chemistry
was measured in 20 mM citrate buffer between pH 4–6 or 20 mM phosphate buffer at pH
7.0 with an AFM. By measuring a range of pHs, the IEP could be determined, as described
previously [16,17], and is shown in Figure 1. The measured IEP for SARS-CoV-2 (USA-
WA1/2020) was 5.2–5.3. This is on the low end of the IEPs from the calculated sources
shown in Table 1. In our previous study using the enveloped virus BVDV, the CFM meas-
urement was very different from the calculated IEP using the amino acid sequence [16].
We obtained a similar result with the enveloped SARS-CoV-2 in the present study. This
trend may be evidence that, unlike nonenveloped viruses, calculated IEP may be less re-
liable for an enveloped virus than values obtained using CFM or another experimental
method.
Figure 1. Isoelectric point determination using CFM. (A) Inactivated SARS-CoV-2 particles were covalently immobilized
on a Au-coated slide that contained a self-assembled monolayer that presented COOH and CH3 functional groups.
NHS/EDC chemistry covalently bound the virus to the COOH groups [16,17]. Au tips were functionalized to provide
either negatively charged carboxyl (COO-) or positively charged quaternary amine (NR4+) groups. Changes in the mean
Figure 1. Isoelectric point determination using CFM. (A) Inactivated SARS-CoV-2 particles were covalently immobilized ona Au-coated slide that contained a self-assembled monolayer that presented COOH and CH3 functional groups. NHS/EDCchemistry covalently bound the virus to the COOH groups [16,17]. Au tips were functionalized to provide either negativelycharged carboxyl (COO−) or positively charged quaternary amine (NR4
+) groups. Changes in the mean adhesion forceswere measured with respect to pH with (B) a NR4
+ probe or (C) a COO− probe. The data points of the mean adhesionforce vs. pH were fit to a sigmoidal curve and the IEP was determined to be the infection point. Each data point represents450 force curves and the histogram for each individual point can be found in Figure S2. * p < 0.05 from student’s t-test.Image A was made with BioRender.com.
Microorganisms 2021, 9, 1606 4 of 6
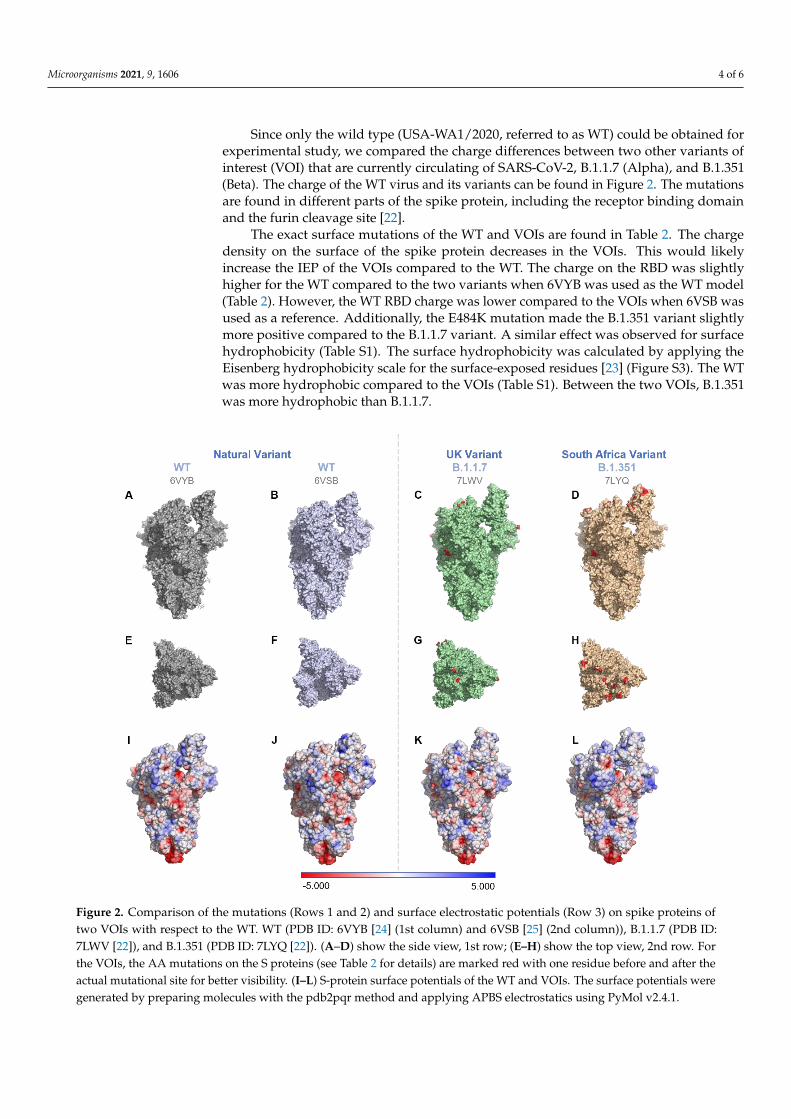
Since only the wild type (USA-WA1/2020, referred to as WT) could be obtained forexperimental study, we compared the charge differences between two other variants ofinterest (VOI) that are currently circulating of SARS-CoV-2, B.1.1.7 (Alpha), and B.1.351(Beta). The charge of the WT virus and its variants can be found in Figure 2. The mutationsare found in different parts of the spike protein, including the receptor binding domainand the furin cleavage site [22].
The exact surface mutations of the WT and VOIs are found in Table 2. The chargedensity on the surface of the spike protein decreases in the VOIs. This would likelyincrease the IEP of the VOIs compared to the WT. The charge on the RBD was slightlyhigher for the WT compared to the two variants when 6VYB was used as the WT model(Table 2). However, the WT RBD charge was lower compared to the VOIs when 6VSB wasused as a reference. Additionally, the E484K mutation made the B.1.351 variant slightlymore positive compared to the B.1.1.7 variant. A similar effect was observed for surfacehydrophobicity (Table S1). The surface hydrophobicity was calculated by applying theEisenberg hydrophobicity scale for the surface-exposed residues [23] (Figure S3). The WTwas more hydrophobic compared to the VOIs (Table S1). Between the two VOIs, B.1.351was more hydrophobic than B.1.1.7.
Microorganisms 2021, 9, x FOR PEER REVIEW 4 of 6
adhesion forces were measured with respect to pH with (B) a NR4+ probe or (C) a COO– probe. The data points of the mean
adhesion force vs. pH were fit to a sigmoidal curve and the IEP was determined to be the infection point. Each data point
represents 450 force curves and the histogram for each individual point can be found in Figure S2. * p < 0.05 from student’s
t-test. Image A was made with BioRender.com.
Since only the wild type (USA-WA1/2020, referred to as WT) could be obtained for
experimental study, we compared the charge differences between two other variants of
interest (VOI) that are currently circulating of SARS-CoV-2, B.1.1.7 (Alpha), and B.1.351
(Beta). The charge of the WT virus and its variants can be found in Figure 2. The mutations
are found in different parts of the spike protein, including the receptor binding domain
and the furin cleavage site [22].
The exact surface mutations of the WT and VOIs are found in Table 2. The charge
density on the surface of the spike protein decreases in the VOIs. This would likely in-
crease the IEP of the VOIs compared to the WT. The charge on the RBD was slightly higher
for the WT compared to the two variants when 6VYB was used as the WT model (Table
2). However, the WT RBD charge was lower compared to the VOIs when 6VSB was used
as a reference. Additionally, the E484K mutation made the B.1.351 variant slightly more
positive compared to the B.1.1.7 variant. A similar effect was observed for surface hydro-
phobicity (Table S1). The surface hydrophobicity was calculated by applying the Eisen-
berg hydrophobicity scale for the surface-exposed residues [23] (Figure S3). The WT was
more hydrophobic compared to the VOIs (Table S1). Between the two VOIs, B.1.351 was
more hydrophobic than B.1.1.7.
Figure 2. Comparison of the mutations (Rows 1 and 2) and surface electrostatic potentials (Row 3) on spike proteins of
two VOIs with respect to the WT. WT (PDB ID: 6VYB [24] (1st column) and 6VSB [25] (2nd column)), B.1.1.7 (PDB ID:
7LWV [22]), and B.1.351 (PDB ID: 7LYQ [22]). (A–D) show the side view, 1st row; (E–H) show the top view, 2nd row. For
the VOIs, the AA mutations on the S proteins (see Table 2 for details) are marked red with one residue before and after
Figure 2. Comparison of the mutations (Rows 1 and 2) and surface electrostatic potentials (Row 3) on spike proteins oftwo VOIs with respect to the WT. WT (PDB ID: 6VYB [24] (1st column) and 6VSB [25] (2nd column)), B.1.1.7 (PDB ID:7LWV [22]), and B.1.351 (PDB ID: 7LYQ [22]). (A–D) show the side view, 1st row; (E–H) show the top view, 2nd row. Forthe VOIs, the AA mutations on the S proteins (see Table 2 for details) are marked red with one residue before and after theactual mutational site for better visibility. (I–L) S-protein surface potentials of the WT and VOIs. The surface potentials weregenerated by preparing molecules with the pdb2pqr method and applying APBS electrostatics using PyMol v2.4.1.

Microorganisms 2021, 9, 1606 5 of 6
Table 2. Comparison of surface charge on S protein of the two VOI with the wild type at pH 7.0.
Pango Lineage Name Mutations PDB Surface Charge(Formal Charge)
Surface Charge(Partial Charge) RBD Charge
WT(Natural variant) USA/WA1/2020
- 6VYB −20 −17 9- 6VSB −26 −23 6
B.1.1.7(UK variant) 20J/501Y.V1
∆69/70∆144YN501YA570DD614GP681H
7LWV −12 −9 7
B.1.351(South Africa variant) 20H/501.V2
K417NE484KN501YD614G
7LYQ −7 −4 8
Surface charges are based on the solvent-accessible (SA) residues calculated in PyMol using APBS electrostatics. The boundary conditionsused for single Debye–Huckel function were as follows: solute dielectric constant—2.000; solvent dielectric constant—78.000; ionicstrength—150 mM; temperature—310 K. RBD charges were calculated by adding the partial charges of the SA resides in the 319–541 regionof chain B for 6VYB, 7LWV, and 7LYQ or chain A for 6VSB. The chain consideration was based on the chain identifier that showed anupconfiguration of the RBD in PyMol.
The IEP of SARS-CoV-2 was determined using CFM. The IEP in 20 mM salt was 5.2–5.3.This is on the low end of values calculated from different amino acid sequences of thespike protein. Enveloped viruses contain glycosylation on their spike proteins that likelychange the IEP, thus requiring a measured IEP compared to a calculated IEP. CFM is a novelmethod to measure virus IEP, which does not require high-purity and high-concentrationvirus stocks; it is a single-particle method that targets the virus particles individually forthe measurement. Without access to VOIs of SARS-CoV-2, their sequence changes wereused to calculate the change in surface charge and hydrophobicity compared to WT. TheVOIs have a lower charge and lower hydrophobicity than the WT, and this may play a rolein the increased transmission of the VOIs.
Supplementary Materials: The following are available online at https://www.mdpi.com/article/10.3390/microorganisms9081606/s1. Figure S1: Topographic images and height analysis. Figure S2:Adhesion and representative force–distance curves. Figure S3: Surface characteristics of S-proteins ofWT and VOI. Table S1: Surface hydrophobicity for the WT and VOI; Raw Data.
Author Contributions: Conceptualization, M.O., M.T. and C.L.H.; methodology, O.A., P.U.J. andC.L.H.; formal analysis, O.A. and P.U.J.; investigation, O.A. and P.U.J.; data curation, O.A. and P.U.J.;writing—original draft preparation, O.A. and P.U.J.; writing—review and editing, M.O. and C.L.H.;visualization, O.A. and P.U.J.; supervision, C.L.H.; project administration, C.L.H.; funding acquisition,C.L.H. All authors have read and agreed to the published version of the manuscript.
Funding: The authors thank NSF (CAREER-1451959) and NIH (R21AI150962) for funding of this work.
Data Availability Statement: All data generated or analyzed during this study are included in thispublished article (and its supplementary information files).
Acknowledgments: The authors thank BEI resources for the SARS-CoV-2 isolates. MilliporeSigmagenerously provided some chemicals used in this work.
Conflicts of Interest: The authors declare no conflict of interest. The funders had no role in the designof the study; in the collection, analyses, or interpretation of data; in the writing of the manuscript, orin the decision to publish the results.
References1. Aboubakr, A.H.; Sharafeldin, T.A.; Goyal, S.M. Stability of SARS-CoV-2 and other coronaviruses in the environment and on
common touch surfaces and the influence of climatic conditions: A review. Transbound. Emerg. Dis. 2021, 68, 296–312. [CrossRef][PubMed]
2. Joonaki, E.; Hassanpouryouzband, A.; Heldt, C.L.; Areo, O. Surface Chemistry Can Unlock Drivers of Surface Stability ofSARS-CoV-2 in a Variety of Environmental Conditions. Chem 2020, 6, 2135–2146. [CrossRef]

Microorganisms 2021, 9, 1606 6 of 6
3. Vega, E.; Garland, J.; Pillai, S.D. Electrostatic Forces Control Nonspecific Virus Attachment to Lettuce. J. Food Prot. 2008, 71,522–529. [CrossRef] [PubMed]
4. Van Oss, C. Acid—base interfacial interactions in aqueous media. Colloids Surfaces A Physicochem. Eng. Asp. 1993, 78, 1–49.[CrossRef]
5. Dang, H.T.; Tarabara, V.V. Virus deposition onto polyelectrolyte-coated surfaces: A study with bacteriophage MS2. J. ColloidInterface Sci. 2019, 540, 155–166. [CrossRef] [PubMed]
6. Chrysikopoulos, C.V.; Syngouna, V.I. Attachment of bacteriophages MS2 and ΦX174 onto kaolinite and montmorillonite:Extended-DLVO interactions. Colloids Surfaces B Biointerfaces 2012, 92, 74–83. [CrossRef]
7. Boone, S.A.; Gerba, C.P. Significance of Fomites in the Spread of Respiratory and Enteric Viral Disease. Appl. Environ. Microbiol.2007, 73, 1687–1696. [CrossRef]
8. Guo, S.; Zhu, X.; Janczewski, D.; Lee, S.S.C.; He, T.; Teo, S.L.M.; Vancso, G.J. Measuring protein isoelectric points by AFM-basedforce spectroscopy using trace amounts of sample. Nat. Nanotechnol. 2016, 11, 817–823. [CrossRef]
9. Michen, B.; Graule, T. Isoelectric points of viruses. J. Appl. Microbiol. 2009, 109, 388–397. [CrossRef]10. Bhattacharjee, S. DLS and zeta potential—What they are and what they are not? J. Control. Release 2016, 235, 337–351. [CrossRef]11. Samandoulgou, I.; Fliss, I.; Jean, J. Zeta Potential and Aggregation of Virus-Like Particle of Human Norovirus and Feline
Calicivirus under Different Physicochemical Conditions. Food Environ. Virol. 2015, 7, 249–260. [CrossRef]12. Dika, C.; Duval, J.F.; Francius, G.; Perrin, A.; Gantzer, C. Isoelectric point is an inadequate descriptor of MS2, Phi X 174 and PRD1
phages adhesion on abiotic surfaces. J. Colloid Interface Sci. 2015, 446, 327–334. [CrossRef]13. Heffron, J.; Mayer, B.K. Improved Virus Isoelectric Point Estimation by Exclusion of Known and Predicted Genome-Binding
Regions. Appl. Environ. Microbiol. 2020, 86, e01674-20. [CrossRef]14. Krebs, F.; Scheller, C.; Grove-Heike, K.; Pohl, L.; Watzig, H. Isoelectric point determination by imaged CIEF of commercially
available SARS-CoV-2 proteins and the hACE2 receptor. Electrophoresis 2021, 42, 687–692. [CrossRef] [PubMed]15. Hristova, S.H.; Zhivkov, A.M. Isoelectric point of free and adsorbed cytochrome c determined by various methods. Colloids
Surfaces B Biointerfaces 2019, 174, 87–94. [CrossRef]16. Mi, X.; Bromley, E.K.; Joshi, P.U.; Long, F.; Heldt, C.L. Virus Isoelectric Point Determination Using Single-Particle Chemical Force
Microscopy. Langmuir 2019, 36, 370–378. [CrossRef] [PubMed]17. Mi, X.; Heldt, C.L. Single-particle chemical force microscopy to characterize virus surface chemistry. BioTechniques 2020, 69,
363–370. [CrossRef] [PubMed]18. Weichert, W.S.; Parker, J.; Wahid, A.; Chang, S.-F.; Meier, E.; Parrish, C.R. Assaying for Structural Variation in the Parvovirus
Capsid and Its Role in Infection. Virology 1998, 250, 106–117. [CrossRef]19. Swiss Institute of Bioinformations (SIB). ExPASy: ProtParam Tool. Available online: https://web.expasy.org/protparam/
(accessed on 15 May 2021).20. Pandey, L.M. Surface engineering of personal protective equipments (PPEs) to prevent the contagious infections of SARS-CoV-2.
Surf. Eng. 2020, 36, 901–907. [CrossRef]21. Scheller, C.; Krebs, F.; Minkner, R.; Astner, I.; Gil-Moles, M.; Watzig, H. Physicochemical properties of SARS-CoV-2 for drug
targeting, virus inactivation and attenuation, vaccine formulation and quality control. Electrophoresis 2020, 41, 1137–1151.[CrossRef] [PubMed]
22. Gobeil, S.M.; Janowska, K.; McDowell, S.; Mansouri, K.; Parks, R.; Stalls, V.; Kopp, M.F.; Manne, K.; Saunders, K.; Edwards, R.J.;et al. Effect of natural mutations of SARS-CoV-2 on spike structure, conformation and antigenicity. bioRxiv 2021. [CrossRef]
23. Heldt, C.L.; Zahid, A.; Vijayaragavan, K.S.; Mi, X. Experimental and computational surface hydrophobicity analysis of anon-enveloped virus and proteins. Colloids Surf. B Biointerfaces 2017, 153, 77–84. [CrossRef] [PubMed]
24. Walls, A.C.; Park, Y.J.; Tortorici, M.A.; Wall, A.; McGuire, A.T.; Veesler, D. Structure, Function, and Antigenicity of the SARS-CoV-2Spike Glycoprotein. Cell 2020, 181, 281–292 e6. [PubMed]
25. Wrapp, D.; Wang, N.; Corbett, K.S.; Goldsmith, J.A.; Hsieh, C.-L.; Abiona, O.; Graham, B.S.; McLellan, J.S. Cryo-EM structure ofthe 2019-nCoV spike in the prefusion conformation. Science 2020, 367, 1260–1263. [CrossRef] [PubMed]