single nucleotide polymorphism in the neuroplastin locus.pdf
DESCRIPTION
Single nucleotide polymorphism in the neuroplastin locus.pdfTRANSCRIPT

OPEN
ORIGINAL ARTICLE
Single nucleotide polymorphism in the neuroplastin locusassociates with cortical thickness and intellectual ability inadolescentsS Desrivières1,2, A Lourdusamy1,2, C Tao3, R Toro4,5, T Jia1,2, E Loth1,2, LM Medina1,2, A Kepa1,2, A Fernandes1,2, B Ruggeri1,2,FM Carvalho1,2, G Cocks1, T Banaschewski6,7, GJ Barker1, ALW Bokde8, C Büchel9, PJ Conrod1,10, H Flor11, A Heinz12, J Gallinat12,H Garavan13,14, P Gowland14, R Brühl15, C Lawrence16, K Mann6, MLP Martinot17,18, F Nees11, M Lathrop19, J-B Poline20, M Rietschel6,P Thompson21, M Fauth-Bühler22, MN Smolka23,24, Z Pausova25, T Paus16,26,27, J Feng3,28, G Schumann1,2 and the IMAGEN Consortium29
Despite the recognition that cortical thickness is heritable and correlates with intellectual ability in children and adolescents, thegenes contributing to individual differences in these traits remain unknown. We conducted a large-scale association study in 1583adolescents to identify genes affecting cortical thickness. Single-nucleotide polymorphisms (SNPs; n= 54 837) within genes whoseexpression changed between stages of growth and differentiation of a human neural stem cell line were selected for associationanalyses with average cortical thickness. We identified a variant, rs7171755, associating with thinner cortex in the left hemisphere(P= 1.12 × 10⁻⁷), particularly in the frontal and temporal lobes. Localized effects of this SNP on cortical thickness differently affectedverbal and nonverbal intellectual abilities. The rs7171755 polymorphism acted in cis to affect expression in the human brain of thesynaptic cell adhesion glycoprotein-encoding gene NPTN. We also found that cortical thickness and NPTN expression were onaverage higher in the right hemisphere, suggesting that asymmetric NPTN expression may render the left hemisphere moresensitive to the effects of NPTN mutations, accounting for the lateralized effect of rs7171755 found in our study. Altogether, ourfindings support a potential role for regional synaptic dysfunctions in forms of intellectual deficits.
Molecular Psychiatry advance online publication, 11 February 2014; doi:10.1038/mp.2013.197
Keywords: adolescent; cortical thickness; intelligence; lateralization; neural stem cell; neuroimaging
INTRODUCTIONGenetic factors have a significant contribution in defining brainstructure and cognition. In particular, cortical thickness is heritable,with the strongest genetic influences (heritability range, 0.50–0.90)showing region- and age-specific variations1 that seem to followpatterns of brain maturation from childhood to early adulthood.Cortical thickness also closely correlates with intellectual ability innormally developing children and adolescents.2,3 Yet, little isknown about the genetic factors accounting for interindividualdifferences in both of these traits.
Advances in neuroimaging studies have enabled the demon-stration of spatiotemporal alterations in brain structure andfunction that occur over a lifetime. This plasticity is particularlyimportant during adolescence, when both hormonal and socialenvironments change dramatically. Whereas white matterincreases linearly during this period,4 regional changes in corticalgray matter are nonlinear.5 Localized, region-specific brain graymatter maturation progresses in patterns that appear to followcognitive and functional maturation.6 Roughly, areas involved inspatial orientation (parietal lobes) and more advanced functions
1Institute of Psychiatry, King’s College, London, UK; 2MRC Social, Genetic and Developmental Psychiatry Centre, Institute of Psychiatry, King's College London, London, UK;3Center for Computational Systems Biology, Fudan University, Shanghai, China; 4Human Genetics and Cognitive Functions, Institut Pasteur, Paris, France; 5CNRS URA 2182, Genes,synapses and cognition, Institut Pasteur, Paris, France; 6Department of Child and Adolescent Psychiatry and Psychotherapy, Central Institute of Mental Health, Mannheim,Germany; 7Medical Faculty Mannheim, University of Heidelberg, Mannheim, Germany; 8Institute of Neuroscience, Trinity College Dublin, Dublin, Ireland; 9Department of SystemsNeuroscience, Universitaetsklinikum Hamburg Eppendorf, Hamburg, Germany; 10Department of Psychiatry, Université de Montreal, CHU Ste Justine Hospital, Montreal, QC,Canada; 11Department of Cognitive and Clinical Neuroscience, Central Institute of Mental Health, Medical Faculty Mannheim, Heidelberg University, Mannheim, Germany;12Department of Psychiatry and Psychotherapy, Campus Charité Mitte, Charité—Universitätsmedizin, Berlin, Germany; 13Institute of Neuroscience, Trinity College Dublin, Dublin,Ireland; 14Departments of Psychiatry and Psychology, University of Vermont, Burlington, VT, USA; 15Physikalisch-Technische Bundesanstalt (PTB), Braunschweig und Berlin, Berlin,Germany; 16School of Psychology, University of Nottingham, Nottingham, UK; 17Institut National de la Santé et de la Recherche Médicale, INSERM CEA Unit 1000 ‘Imaging &Psychiatry’, University Paris Sud, Orsay, France; 18AP-HP Department of Adolescent Psychopathology and Medicine, Maison de Solenn, University Paris Descartes, Paris, France;19Centre National de Génotypage, Evry, France; 20Neurospin, Commissariat àl'Energie Atomique et aux Energies Alternatives, Paris, France; 21Imaging Genetics Center/Laboraroryof Neuro Imaging, UCLA School of Medicine, Los Angeles, CA, USA; 22Department of Addictive Behaviour and Addiction Medicine, Medical Faculty Mannheim, Central Institute ofMental Health, Heidelberg University, Mannheim, Germany; 23Department of Psychiatry and Psychotherapy, Technische Universität Dresden, Dresden, Germany; 24Department ofPsychology, Neuroimaging Center, Technische Universität Dresden, Dresden, Germany; 25The Hospital for Sick Children, University of Toronto, Toronto, ON, Canada; 26RotmanResearch Institute, University of Toronto, Toronto, ON, Canada; 27Montreal Neurological Institute, McGill University, Montreal, Canada and 28Department of Computer Science andCentre for Scientific Computing, Warwick University, Coventry, UK. Correspondence: Dr S Desrivières, MRC Social, Genetic and Developmental Psychiatry Centre, Institute ofPsychiatry, King's College London, 16 De Crespigny Park, Denmark Hill, London SE5 8AF, UK.E-mail: [email protected] 29 August 2013; revised 19 November 2013; accepted 9 December 2013
Molecular Psychiatry (2014), 1–12© 2014 Macmillan Publishers Limited All rights reserved 1359-4184/14
www.nature.com/mp
(frontal lobe) mature around adolescence, after areas of the brainassociated with more basic functions (occipital lobe) and beforethe temporal cortex. Measures of cortical thickness revealedasymmetrical changes in the brain of normally developingchildren and adolescents. Of notable significance, changes incortical thickness in the left hemisphere have been found tocorrelate with performance of children on a test of general verbalintellectual functioning.2 This plasticity appears to be important inshaping behaviors and cognitive processes that contribute tonormal development into adulthood.Twin studies have demonstrated that brain structure is under
significant genetic influence,7 with cortical thickness showing highheritability in children1,8 and adults.9,10 Differences in heritabilityare nonetheless notable. First, comparison of estimates of geneticeffects in the left and right hemispheres indicate that these valuesare higher for the left hemisphere, suggesting that the language-dominant left cerebral cortex may be under stronger geneticcontrol than the right cortex.8 Second, age-related differences inthe heritability of cortical thickness in children and adolescentshave been reported: although regions of primary sensory andmotor cortex, which develop earlier, show relatively greatergenetic effects in childhood than in adolescence, regions withinthe frontal cortex, parietal and temporal lobes, associated withcomplex cognitive processes, such as language executive functionand social cognition, show relatively greater genetic effects inadolescence.1 Thus, as suggested by these studies, it would seemnecessary to consider both region-specific effects and develop-mental stage (that is, age) of individuals while investigating linksbetween genes, cortical thickness and behavior.At the cellular level, changes in cortical thickness during
adolescence are consistent with known cellular maturationalalterations, such as the changes in synaptic density11 andintracortical myelination12 occurring during this developmentalstage. Thus, the age-related changes in heritability noted abovemay be linked to the timing of the expression of given set ofgenes involved in specific stages of neural development. It hasbeen postulated that cortical thickness is determined by thenumber of neurons within radial units of the cortex, and that adiminished ability of the neurogenic progenitors contained inthese units to proliferate or to generate neurons will result in athinner cortex.13,14 According to this, genes involved in neuralprogenitor cell division and/or differentiation are expected toinfluence cortical thickness. Yet, although cortical thickness isheritable and closely correlates with cognitive ability in childrenand adolescents,3 the genes influencing these traits remain to beidentified.Therefore, aiming at identifying genes influencing cortical
thickness, we decided to focus our analysis on genes relevantfor neural progenitor cell proliferation and differentiation. For thispurpose, we selected genes whose expression changed betweenvarious stages of growth and differentiation of a human neuralprogenitor cell line. We then conducted association analyses ofgenetic variations at the selected gene loci and cortical thicknessat each hemisphere. Using this approach, we uncovered a genelinking cortical thickness to cognition.
MATERIALS AND METHODSParticipantsData analyzed in this study were obtained from 1583 14-year-oldadolescents, participants of the IMAGEN project, for which magneticresonance images passing quality control procedures were available.Recruitment procedures have been described previously,15 and writteninformed consent was obtained from all participants and their legalguardians. Individuals completed an extensive battery of neuropsychologi-cal, clinical, personality and drug use assessments online and at the testingcenters. Participants were excluded if they had contraindications formagnetic resonance imaging (for example, metal implants and
claustrophobia). Some individuals were only included in part of the analyses,depending on availability of the genotype, imaging and cognitive data foreach participant. The characteristics of this sample are described in Table 1.
Cognitive assessmentThe Block Design and Matrix Reasoning subtests of the WechslerIntelligence Scale for Children-Fourth Edition16 were computed togenerate a Perceptual Reasoning Index and assess nonverbal intelligence(nonverbal intelligence quotient (IQ)). The Similarities and Vocabularysubtests were computed to generate a Verbal Comprehension Indexmeasuring verbal concept formation, that is, the subjects’ ability to verballyreason (referred to as verbal IQ). For this, single test scores were convertedto more precise age-equivalent scores values. Score values of the relevantsubtests were summed to generate indices for Perceptual Reasoning orVerbal Comprehension. To control for differences in developmental statusbetween participants, pubertal status of the sample was assessed using thePuberty Development Scale,17 which provides an eight-item self-reportmeasure of physical development based on the Tanner stages.
SNP genotyping and quality controlDNA purification and genotyping were performed by the Centre Nationalde Génotypage in Paris. DNA was purified from whole-blood samples (~10ml) preserved in BD Vacutainer EDTA tubes (Becton, Dickinson andCompany, Oxford, UK) using the Gentra Puregene Blood Kit (Qiagen,Manchester, UK) according to the manufacturer’s instructions. A total of705 and 1382 individuals were genotyped with the Illumina (LittleChesterford, UK) Human610-Quad Beadchip and Illumina Human660-Quad Beadchip, respectively. For each genotyping platform the followingquality control was performed separately. Single-nucleotide polymorph-isms (SNPs) with call rates o95%, minor allele frequency o5%, deviationfrom the Hardy–Weinberg equilibrium (P⩽ 1× 10⁻³) and nonautosomalSNPs were excluded from the analyses. Individuals with excessive missinggenotypes (failure rate >5%) were also excluded. Population homogeneitywas examined with the Structure software using HapMap populations asreference groups.18 Individuals with divergent ancestry (from Utahresidents with ancestry from northern and western Europe) were excluded.Identity-by-state clustering and multidimentional scaling were used to
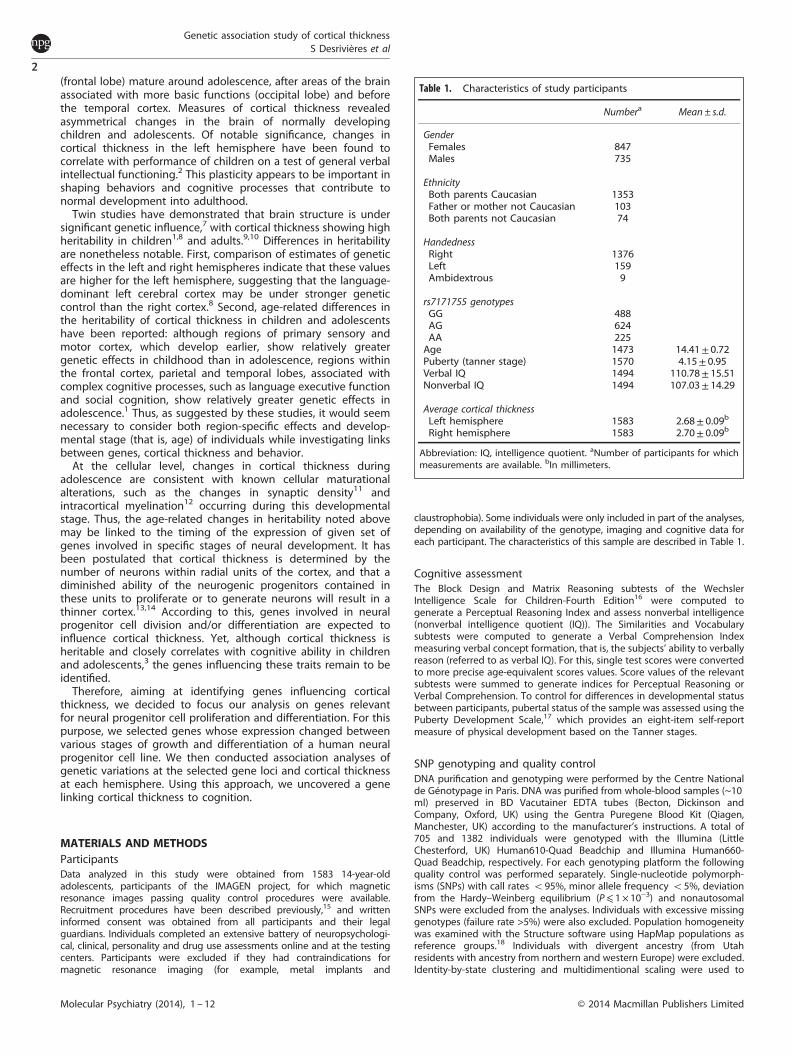
Table 1. Characteristics of study participants
Numbera Mean± s.d.
GenderFemales 847Males 735
EthnicityBoth parents Caucasian 1353Father or mother not Caucasian 103Both parents not Caucasian 74
HandednessRight 1376Left 159Ambidextrous 9
rs7171755 genotypesGG 488AG 624AA 225Age 1473 14.41± 0.72Puberty (tanner stage) 1570 4.15± 0.95Verbal IQ 1494 110.78± 15.51Nonverbal IQ 1494 107.03± 14.29
Average cortical thicknessLeft hemisphere 1583 2.68± 0.09b
Right hemisphere 1583 2.70± 0.09b
Abbreviation: IQ, intelligence quotient. aNumber of participants for whichmeasurements are available. bIn millimeters.
Genetic association study of cortical thicknessS Desrivières et al
2
Molecular Psychiatry (2014), 1 – 12 © 2014 Macmillan Publishers Limited

estimate cryptic relatedness for each pair of individuals using the PLINKsoftware19 and closely related individuals were eliminated from thesubsequent analysis. We applied principal component analysis to removeremaining outliers,20 defined as individuals located at more than four s.d.of the mean principal component analysis scores on one of the first 20dimensions. Finally, the integrated genotypes from both IlluminaHuman610 Quad BeadChip and Human660-Quad BeadChip were com-bined and platform- specific SNPs were removed. After the quality controlmeasures, we obtained a total of 466 125 SNPs in 1834 individuals.
Magnetic resonance imagingFull details of the magnetic resonance imaging acquisition protocols andquality checks have been described previously.21 Brain images weresegmented with the FreeSurfer software package (http://surfer.nmr.mgh.harvard.edu/) and the entire cortex of each individual was inspected forinaccuracies. Individuals with major malformations of the cerebral cortexwere excluded from further analysis. Out of 1909 images, 1584 passedthese quality control checks. In addition to global mean thickness of theleft and right cerebral hemispheres, neuroimaging measures includedcortical thickness for 33 individual regions per hemisphere. These werecombined to produce weighted average thickness (weighted for surface ateach region) for the four cerebral lobes (that is, frontal, temporal, parietaland occipital). The effect of magnetic resonance imaging site wascontrolled by adding it as a nuisance covariate in all statistical analyses.
Human neural stem cell cultureThe human neural stem cell line SPC-04 was generated from 10-week-oldhuman fetal spinal cord22 and was cultured mainly as previouslydescribed.23 In brief, cells were plated on tissue culture flasks that hadbeen freshly coated with laminin (20 μgml− 1 in Dulbecco’s modifiedEagle’s medium:F12 for 3 h at 37 °C), at a density of 20 000 cells cm−2 androutinely grown into a reduced minimum media formulation consisting ofDulbecco’s modified Eagle’s medium:F12 with 0.03% human serumalbumin, 100 μgml− 1 human Apo-transferrin, 16.2 μgml− 1 putrescinedihydrochloride, 5 μgml− 1 human insulin, 60 ngml− 1 progesterone, 2 mM
L- glutamine and 40 ngml− 1 sodium selenite. This reduced minimummedium was also supplemented with growth factors (10 ngml− 1 basicfibroblast growth factor and 20 ngml− 1 epidermal growh factor) and 100nM 4-hydroxy-tamoxifen. Cell differentiation was triggered when cellsreached about 80% confluence by depleting the medium of growth factorsand 4-hydroxy-tamoxifen. This was achieved in two steps. First, the growthfactor- and 4-hydroxy-tamoxifen-depleted medium was supplementedwith 10 μM of the γ-secretase inhibitor N-[N-(3,5-difluorophenacetyl)-L-alanyl]-S-phenylglycine t-butyl ester and 100 nM all-trans-retinoic acid for48 h. We referred to this stage as ‘pre-differentiation’. Afterward,differentiation was achieved by maintaining the cells in reduced minimummedia without any supplements for up to 7 days, with media changeevery 2 days.
RNA extraction and microarray analyses and SNP selectionRNA was extracted from triplicate SPC04 differentiation experiments usingthe RNeasy Mini Kit (Qiagen), according to the manufacturer’s instructions.Total RNA samples were processed using the TargetAmp-Nano Labeling Kit(Cambio, Cambridge, UK) and hybridized to Illumina HumanHT-12 v4Expression BeadChips according to the manufacturers’ instructions at theBiomedical Genomics microarray core facility of the University of California,San Diego, CA, USA. Raw data were extracted by the Illumina BeadStudiosoftware and further processed in R statistical environment (http://www.r-project.org) using the lumi24 and limma25 Bioconductor packages. Rawexpression data were log2 transformed and normalized by quantilenormalization. Differential expression between each differentiated versusundifferentiated conditions was assessed using the linear model formicroarray analyses package. P-values were adjusted for multiple testingaccording to the false discovery rate procedure of Benjamini andHochberg, and differentially expressed genes were selected at falsediscovery rate o5%. See Supplementary Table 1 for the list of differentiallyexpressed genes. The functional annotation clustering tool, part of theDatabase for Annotation, Visualisation and Integrated Discovery26 wasused to determine enrichment of functional groups in genes’ listgenerated from the microarray analyses. SNPs (n= 59 643) lying within±10 kB of each differentially expressed autosomal genes were selected forgenetic association studies; of these, n= 54 837 passed genetic qualitycontrols and were used in further association analyses.
Genetic associationsLinear regression analyses were performed in PLINK19 using averagecortical thickness of the left or right hemisphere as a dependent variableand the additive dosage of each SNP as an independent variable ofinterest, controlling for covariates of age, sex, puberty and the first fourprincipal components from multidimentional scaling analysis. Dummycovariates were also used to control for different scanning sites. Genome-wide complex trait analysis27 was used to estimate the proportion ofphenotypic variance in left cortical thickness explained by all genotypedSNPs and SNPs selected from our differential gene expression analyses.The genome-wide complex trait analysis was fitted using a restrictedmaximum likelihood method. The Broad Institute’s SNAP online plottingtool28 was used to generate the regional association and recombinationrate plots.The same conditions were used when investigating the association
between rs7171755 and IQ except that ethnicity was also included as anuisance covariate. Given correlations between brain volume (that is, thesum of all cortical and subcortical gray and white matter, excludingventricle and cerebrospinal fluid), cortical thickness, cortical surface areaand IQ, left surface area was also included as a covariate when using brainvolume or IQ as a variable. For the associations of rs7171755 with brainvolume, linear regression analyses were performed using site, sex, leftsurface area and four multidimentional scaling components as covariates.Handedness influenced none of the above associations and was notincluded as a covariate in our analyses. Mediation analyses betweenSNP× left (average or frontal) cortical thickness × non verbal IQ wereperformed in SPSS (version 20.0) using the PROCESS boostrappingprocedure29 with 1000 boostrap samples used to calculate 95% confidenceinterval estimates of indirect effects.Bonferroni corrections adjusting for the total number of tests in each
analysis were performed to control for multiple testing. For thegenotypes × cortical thickness association analyses with the selected 54837 SNPs, on the left and right hemispheres, the corresponding signifi-cance threshold was P=4.56 × 10⁻⁷.
Meta-analytic association of rs7171755 with brain volumes inENIGMAWe have used the ENIGMA data set, the largest meta-analysis ofgene× neuroimaging phenotypes, to investigate association ofrs7171755 with total brain volume, the brain phenotype most closelyrelated to cortical thickness available in this data set. Association ofrs7171755 with brain volume was performed using the online toolEnigmaVis,30 generating an interactive association plot. Only the healthysubsample (N= 5775) of ENIGMA, for which this brain volume wasavailable, were included in the meta-analysis.
Bootstraping procedureTo provide bias-reduced estimates of the associations reported above, weused a bootstrap resampling approach31 for linear regression models inthe following way: first, subjects were resampled with replacement fromthe subjects passing quality controls criteria, here referred to as thebootstrap sample. Second, the coefficient βSNP for the SNP of interest fromthe bootstrap sample was calculated. We shuffled the SNP column of thebootstrap sample 100 000 times and recalculated the βSNP, generating aNULL distribution of βSNP for the bootstrap sample, denoted as βNULL.Third, the Pemp (empirical P-value) of the bootstrap sample wasdetermined as the portion of βNULL greater than βSNP. We repeated thisbootstrap procedure 10 000 times to obtain an empirical distribution of theP-values for each variable of interest.
Least square kernel machine association tests for candidate genesAs genetic association testing based on single SNPs might suffer from lowpower, we have also used a more sophisticated lease square kernelmachine (LSKM) procedure that we have recently developed to analyzejoint effects of several SNPs with imaging traits32 to detect possible geneticinfluences on cortical thickness. In short, this procedure comparesindividuals’ allele profiles, composes a similarity matrix (Kernel Matrix),and then determines to what extent the similarity matrix explainsvariations in the phenotype. A summary statistics is used to evaluate thesignificance under null hypothesis. We considered SNPs within ±10 kb of agene’s transcript region as ‘belonging to’ the corresponding gene. In thecurrent analysis, a gene-wide identity-by-state matrix was used as the
Genetic association study of cortical thicknessS Desrivières et al
3
© 2014 Macmillan Publishers Limited Molecular Psychiatry (2014), 1 – 12

similarity matrix. After quality control, 2659 out of the ~3540 genesdifferentially expressed in our microarray analyses were retained andsubjected to the LSKM analysis. As for the single SNP association analyses,recruitment site, gender, age, puberty, ethnicity and the four firstmultidimentional scaling components were used as covariates in theLSKM analyses.
NPTN expression on mouse brain samplesRNA samples extracted from CD1 mouse brains at embryonic day 10 (E10),E14, E18 and at postnatal (P) stages 1 week, 1 month or 6 months wereobtained from AMS Biotechnology (Abingdon-on-Thames, UK). Whole-brain mouse RNAs extracted from pools of five and three embryos were
used for the E10 and E14 stages, respectively. RNAs extracted from thefrontal cortex were used for later developmental stages (that is, E18–P6months). In this case, triplicate samples from independent brains wereanalyzed for each stage, except for the P6 month stage for which datawere derived from a single mouse brain. Complementary DNAs obtainedby reverse transcription using the SuperScript III First-Strand SynthesisSystem (Invitrogen, Paisley, UK) following the manufacturer’s instructionswere amplified by PCR with GAPDH as an internal control, using thefollowing forward and reverse primers: GAPDH-F 5′-TGTTCCTACCCCCAATGTGT-3′; GAPDH-R 5′- CCTGCTTCACCACCTTCTTG-3′; NPTN-F 5′-GCCTTTCTTGGGAATTCTGGC-3′; NPTN-R 5′- AGAGTTGGTTTTCATTGGTCCAG-3′. PCRs were run in triplicate in the Applied Biosystems real-timePCR device (7900HT Fast Real-Time PCR system) in 20 μl reactions
Figure 1. Differentiation of SPC04 neural progenitor cells in culture. (a) Changes that accompany differentiation are evident when comparingmorphology of undifferentiated, proliferating cells (A) or pre-differentiated cells (B) with that of cells that have been induced to differentiatefor 3 days (C) or 7 days (D). (b) Venn diagram representing number of genes differentially expressed between undifferentiated cells and eachof the three stages of differentiation and their intersection. und, undifferentiated; pre, pre-differentiated; 3 d, differentiated for 3 days;7 d, differentiated for 7 days. Scale bars represent 100 μm.
Genetic association study of cortical thicknessS Desrivières et al
4
Molecular Psychiatry (2014), 1 – 12 © 2014 Macmillan Publishers Limited
containing 4 μl complementary DNA, 0.5 μM of each forward and reverseprimers and 1× Power SYBR Green Mix (Applied Biosystems, Paisley, UK)using the following cycles: 95 °C for 15min and 40 cycles at 95 °C for 30 sand 59 °C for 30 s. The PCR reaction products were evaluated by a meltingcurve analysis. Relative quantification of the PCR products was performedusing the SDS software (Applied Biosystems) comparing threshold cycles(Ct). NPTN mRNA levels were first normalized to that of GAPDH(ΔCt = CtNPTN−CtGAPDH) at each developmental stage, and changesin expression relative to E10 were calculated as 2− (ΔCt−ΔCtE10). Statisticalanalysis (one-way analysis of variance, followed by Bonferroni-based posthoc analysis with α=0.05, two sided) was performed comparing expressionof triplicates at the E18, P1 week and P1 month stages to that at E10.
NPTN expression in human brain samplesExpression of NPTN in the human brain was investigated using twodatabases. To study effects of rs7171755 on NPTN expression (probe 33624,targeting NM_001161363 and NM_012428), we used the publicly availableBrainCloud database (http://BrainCloud.jhmi.edu/), which includes data ongene expression and genotypes from post-mortem dorsolateral prefrontalcortex samples collected from 272 subjects across the lifetime. In thisdatabase, transcript expression levels were measured on Illumina Oligosetarray of 49 152 probes, and genotyping was performed using IlluminaInfinium II or HD Gemini 1M Duo BeadChips.33 The genetic data sets wereobtained from dbGaP at http://www.ncbi.nlm.nih.gov/gap through dbGaPaccession number phs000417.v1.p1. Submission of the data phs000417.v1.p1 to dbGaP was provided by Drs Barbara Lipska and Joel Kleinman. Datacollection was through a collaborative study sponsored by the NationalInstitute of Mental Health Intramural Research Program. Initial report onthis data set is from Colantuoni et al.33 For this study, we considered onlysamples with good RNA quality (RNA integrity number⩾ 8). Statistical
analyses measuring effects of rs7171755 on the postnatal expression ofNPTN were performed on 147 samples (individuals⩾ 0.5 year old) bygeneral linear models controlling for age, ethnicity and RNA quality.To investigate possible differences in NPTN expression between brain
hemispheres, we analyzed a database (GEO series GSE25219) containinggenome-wide gene expression data from 16 brain regions on bothhemispheres, collected from 57 subjects across the lifetime (N=1340 post-mortem brain samples).34 Paired sample t-tests were performed comparingexpression of NPTN on the right and the left hemisphere for each sample,controlling for the developmental stage and RNA integrity factor.
RESULTSSelection of genes involved in neural progenitor functionWe first selected genes differentially expressed at any stage ofproliferation and differentiation of a human neural stem cell line,SPC04. These cells proliferated readily in undifferentiated condi-tions and acquired a typical neural morphology, with well-developed neurites as early as 3 days after induction ofdifferentiation (Figure 1a). Microarray analyses, comparing geneexpression profiles of undifferentiated cells with pre-differentiatedcells, or cells that have been induced to differentiate for 3 or 7days, led to identification of ~3540 genes that were differentiallyexpressed between these stages, with most of the changes ingene expression occurring 7 days after differentiation (Figure 1b).Gene ontology clustering analyses indicated enrichment of genesdownregulated (n= 1605) at differentiation day 7 for genesinvolved in cell cycle (enrichment score: 44.57) and DNA metabolicprocesses (enrichment score: 16.92). Upregulated genes (n= 1675)
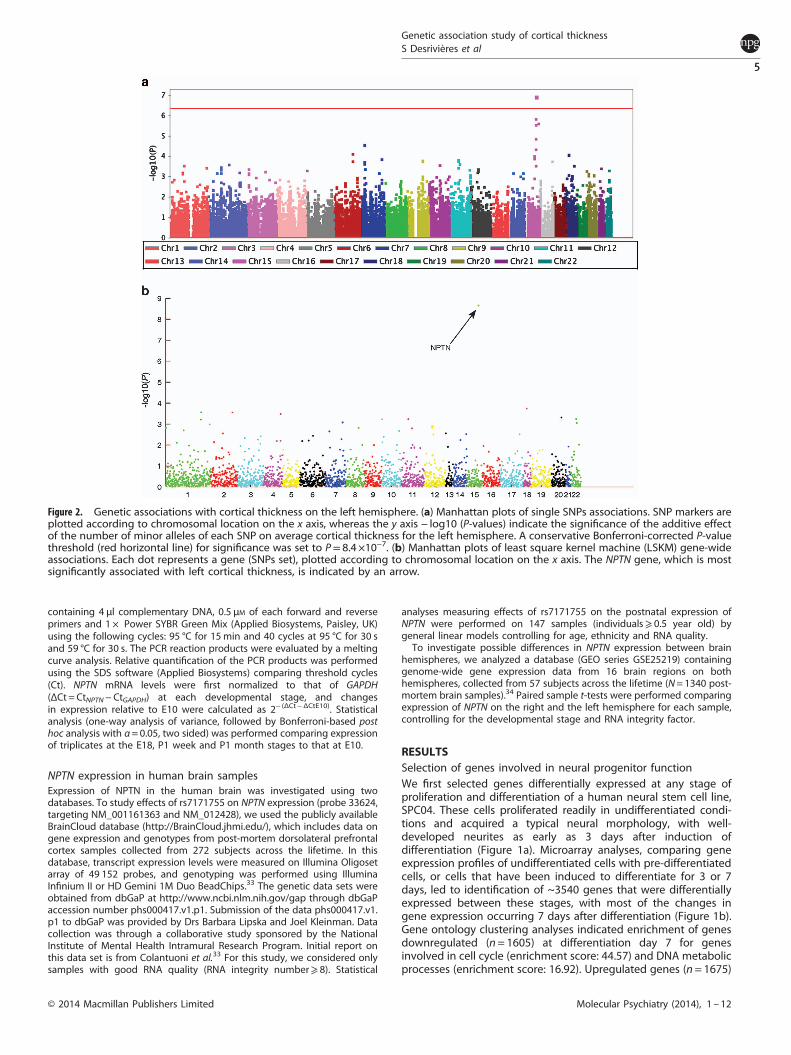
Figure 2. Genetic associations with cortical thickness on the left hemisphere. (a) Manhattan plots of single SNPs associations. SNP markers areplotted according to chromosomal location on the x axis, whereas the y axis − log10 (P-values) indicate the significance of the additive effectof the number of minor alleles of each SNP on average cortical thickness for the left hemisphere. A conservative Bonferroni-corrected P-valuethreshold (red horizontal line) for significance was set to P= 8.4 ×10⁻⁷. (b) Manhattan plots of least square kernel machine (LSKM) gene-wideassociations. Each dot represents a gene (SNPs set), plotted according to chromosomal location on the x axis. The NPTN gene, which is mostsignificantly associated with left cortical thickness, is indicated by an arrow.
Genetic association study of cortical thicknessS Desrivières et al
5
© 2014 Macmillan Publishers Limited Molecular Psychiatry (2014), 1 – 12

were mainly enriched for genes involved in cell adhesion(enrichment score: 7.97), synaptic transmission (enrichment score:5.83), neuron morphogenesis and differentiation (enrichmentscore: 5.46) and synapse formation and organization (enrichmentscore: 4.43). SNPs (n= 59 643) located within ±10 kb of differen-tially expressed autosomal genes were selected for associationwith cortical thickness.
Large-scale association studies with cortical thickness inadolescentsGiven that left-right asymmetry of the brain is a well-knownphenomenon35,36 that may be triggered by left-right differentialgene expression,37,38 we analyzed each hemisphere separately.Highest associations with left cortical thickness were found forSNPs on chromosome 15 (Figure 2a, Table 2 and SupplementaryFigure 1), with one SNP, rs7171755 (β=− 0.01973; P= 1.12× 10⁻⁷),passing the threshold of Bonferroni-corrected significance (theBonferroni-adjusted significance threshold for association with theselected 54 837 SNPs, on the left and right hemispheres, wasP= 4.56× 10⁻⁷). In the right hemisphere, highest associations withcortical thickness were found on chromosome 11 (SupplementaryFigure 2); however, none remained significant after Bonferronicorrection for multiple testing. rs7171755 was associated with rightcortical thickness at P= 3.22× 10⁻⁴ (β=− 0.0134; Table 2). Neitherhandedness nor ethnicity influenced this association. It is worthpointing out that our gene selection procedure resulted insignificant gene enrichment: estimation of the variance explainedby the SNPs using Genome-wide Complex Trait Analysis27
indicated that the 59 643 selected SNPs explain 13.3% (s.e. =0.093, P=0.02) of the total variance in left cortical thickness, afivefold enrichment relative to the 22.2% (s.e. = 0.195, P=0.03)variance explained by considering all 506 932 genotyped SNPssimultaneously.The number of minor alleles at rs7171755 was inversely
correlated with average cortical thickness. In the left hemisphere,
we observed a decrease of 0.0189mm (that is, 0.7% of the averageleft cortical thickness) per risk allele, explaining 2% of variance. Toinvestigate whether effects of rs7171755 on cortical thicknessdiffered across brain regions, we processed the segmented left andright cortical lobes (frontal, temporal, parietal and occipital) into 66cortical subregions39 and performed linear regressions, analyzingassociations of rs7171755 with cortical thickness within eachregion. Region-specific effects of rs7171755 on cortical thicknesswere observed, with most significant overall influences on thecortical thickness in the left temporal (β=− 0.0275; P= 1.23× 10⁻⁷),frontal (β=− 0.0212; P=6.98× 10⁻⁷) and parietal (β=− 0.0170;P= 1.684× 10⁻⁴) lobes. In the right hemisphere, associations weresignificant only for the frontal and temporal lobes (β=− 0.0169;P= 8.91× 10⁻⁵ and β=− 0.0165; P= 1.667× 10⁻³, respectively). Afurther refined neuroanatomical segmentation revealed that theseasymmetric associations occurred throughout the left frontalcortex, including the lateral orbitofrontal, the caudal middle frontaland the superior frontal cortex, the para- and pre-central regionand the pars orbitalis. Other significant associations were observedin the left superior and middle temporal cortices and in the leftsupramarginal region (Table 3).The SNP rs7171755 is located less than 2 kb downstream of the
NPTN gene and is in high linkage disequilibrium with other SNPswithin the NPTN locus. Regional association analysis for SNPsaround rs7171755 clearly show that NPTN is the candidate geneassociated with this signal: the SNPs with the smallest P-values, allin high linkage disequilibrium with rs7171755, are located acrossthis gene (Figure 3).To confirm our finding and to test for a possible significance of
joint contribution of multiple SNPs within the NPTN locus to leftcerebral cortex thickness, we performed gene-wide SNP-setsanalyses using the LSKM approach.32,40,41 The results indicate that,in addition to rs7171755, eight SNPs: rs7176637, rs11854138,rs8028749, rs12185108, rs1564492, rs899981, rs7178269 andrs4075802, in the NPTN locus, jointly show significant association
Table 2. Top 20 SNPs associating with left cortical thickness
CHR SNP Position Minor allele Cortical thickness
Left Right
βa P-valueb βa P-valueb
15 rs7171755 71637633 A −0.01973 1.12E− 07 −0.01343 3.22E− 0415 rs7176637 71637807 A −0.0178 1.38E− 06 −0.01031 0.00533615 rs16944739 89055629 T −0.01987 2.27E− 06 −0.01542 2.54E− 0415 rs899981 71722382 A −0.01744 2.71E− 06 −0.01128 0.00248715 rs12185108 71680005 T 0.01593 1.29E− 05 0.008699 0.017597 rs245974 29262381 C −0.01586 2.62E− 05 −0.01151 0.0023287 rs4722754 28113977 C 0.02535 2.72E− 05 0.01814 0.0027515 rs922687 71635861 A 0.01495 4.36E− 05 0.007401 0.043596 rs2318064 124231122 A −0.01793 7.05E− 05 −0.01407 0.00184918 rs3875089 22699431 C −0.01967 7.63E− 05 −0.01765 3.91E− 0418 rs17614110 22683167 T −0.02191 8.79E− 05 −0.01991 3.71E− 0415 rs1491636 66717647 T 0.01509 9.44E− 05 0.01189 0.00213315 rs12901345 66720414 C 0.01443 1.26E− 04 0.01008 0.0075927 rs4571657 139901359 A −0.02581 1.36E− 04 −0.02143 0.0015611 rs721607 56754408 C 0.0164 1.45E− 04 0.01924 8.20E− 069 rs1571930 100459653 G −0.01861 1.57E− 04 −0.0192 9.74E− 0511 rs2282624 56758487 C 0.01486 1.67E− 04 0.01576 6.58E− 059 rs2900547 100464426 A −0.01853 1.70E− 04 −0.01897 1.18E− 046 rs4897561 124233916 C −0.01762 1.70E− 04 −0.01384 0.0031916 rs1870846 81266758 C 0.02995 1.71E− 04 0.03208 5.67E− 05
Abbreviation: SNP, single-nucleotide polymorphism. aβ is the regression coefficient that represents changes in the average hemispheric cortical thicknessvalues owing to the additive effect of the minor alleles of the SNPs (that is, positive means minor allele increases thickness). bP is the significance of β(uncorrected for multiple comparisons).
Genetic association study of cortical thicknessS Desrivières et al
6
Molecular Psychiatry (2014), 1 – 12 © 2014 Macmillan Publishers Limited

with average left cortical thickness (P= 1.264 × 10⁻⁸; Figure 2b). Asfor the single SNP analyses, the most significant associations wereobserved, in decreasing order, in the left temporal(P= 1.97 × 10⁻¹⁰), left frontal (P= 1.87 × 10⁻⁸), left parietal(P= 4.59 × 10⁻⁵) and right frontal (P= 6× 10⁻⁴) lobes. More refinedregion-specific analyses confirmed the single SNP associationsdescribed above (Supplementary Table 2). To demonstrate the
stability of the above associations and obtain unbiased estimationof the genetic effects, we used a bootstrapping resamplingprocedure.31,42 Effects of rs7171755 on left cortical thickness wereconfirmed, with a decrease of 0.0196mm per risk allele. Effects ofthis variant were also confirmed for the hemispheric lobes (leftfrontal lobe: β=− 0.022, Pemp=1× 10⁻⁶; left temporal lobe:β=− 0.027, Pemp=1× 10⁻⁶; left parietal lobe: β=− 0.017, Pemp=
Table 3. Associations of rs7171755 across brain regions
Linear regression Bootstrap
Left hemisphere Right hemisphere Left hemisphere Right hemisphere
β P-value β P-value β Pemp β Pemp
Frontal lobeCaudal middle frontal −0.024 1.53E−04 −0.020 1.22E− 03 −0.024 5.8E−05Lateral orbito frontal −0.027 2.47E−05 −0.016 9.60E− 03 −0.027 1.10E−05Paracentral −0.025 2.04E−04 −0.018 1.17E− 02 −0.025 1.1E−04Pars orbitalis −0.034 3.48E−04 −0.025 8.62E− 03 −0.037 5.4E−05Precentral −0.024 2.73E−05 −0.014 1.58E− 02 −0.025 1.2E−05Superior frontal −0.022 1.23E−04 −0.018 2.66E− 03 –0.023 3.7E−05
Parietal lobeSupramarginal −0.026 2.81E−05 −0.017 4.91E− 03 −0.026 1.3E−05
Temporal lobeBank of the STS −0.027 9.02E− 04 −0.028 5.88E−04 −0.024 2.93E− 03Fusiform −0.024 6.73E−05 −0.014 1.46E− 02 −0.023 5.6E−05Inferior temporal −0.030 7.98E−05 −0.012 1.12E− 01 −0.029 7.2−05Middle temporal −0.032 1.36E−05 −0.015 3.48E− 02 −0.032 3.0E−06Superior temporal −0.027 6.95E−05 −0.021 1.36E− 03 −0.027 4.0E−05
Abbreviation: Pemp, empirical P-value. Only indicated in this table are regions for which P-values remained significant after Bonferroni correction for multipletesting (highlighted in bold). Regression coefficients (β) and P-values obtained using the original linear regression model or the bootstrap approach areindicated.
Figure 3. SNPs within the NPTN locus are associated with cortical thickness in the left hemisphere. Regional association and recombinationrate plots for SNPs around rs7171755, genotyped in our sample. The SNP with the most significant association is denoted with a red diamond.The left y axis represents − log10 P-values for association with cortical thickness in the left hemisphere, the right y axis represents therecombination rate and the x axis represents base pair positions along the chromosome (human genome Build 36).
Genetic association study of cortical thicknessS Desrivières et al
7
© 2014 Macmillan Publishers Limited Molecular Psychiatry (2014), 1 – 12

7.1 × 10⁻⁵; right frontal lobe: β=− 0.017, P= 3.3 × 10⁻⁵ and righttemporal lobe: β=− 0.017, P= 6.64 × 10⁻⁴) and individual region ofinterests (Table 3 and Supplementary Figure 3).In order to have sufficient power to unambiguously reject an
observed association, a sample size larger than that of the originalstudy is required.43 However, a replication sample larger thanthe IMAGEN sample, with comparable phenotypic characteristics,including assessment of cortical thickness during adolescence isnot yet available. We have nonetheless attempted to overcomethese limitations by further testing rs7171755 in the ENIGMA dataset, a meta-analysis of gene × neuroimaging phenotypes, wherewe analyzed its association with brain volume. As corticalthickness measures were not available in the ENIGMA samples,brain volume was the most closely related brain phenotypeavailable.44 The correlation between brain volume and corticalthickness on the left hemisphere in the IMAGEN sample was high(r(1188) = 0.491; P= 4.29 × 10−73). Upon measuring association ofrs7171755 with brain volume, we found in the IMAGEN sample, anassociation of rs7171755 with significant decrease of brain volumeof 3080mm3 (β=− 3080, P= 0.0457) per risk allele. We havereplicated this finding in the subsample of healthy individuals(n= 5775) of ENIGMA, using the EnigmaVis tool,30 confirming thenegative effects of the risk allele on brain volume (decrease of5945.91mm3 per risk allele: β=− 5945.91, P= 0.00327;Supplementary Figure 4). Altogether, these results further supporta role for NPTN-related genotypes in influencing brain structure.
Association of rs7171755 with adolescents’ intellectual abilityThe results presented above, along with previous findingsshowing relationships between intellectual ability and corticalthickness in healthy subjects, predominantly in frontal andtemporal cortical regions,2,3 suggest that rs7171755 mightinfluence cognitive ability. To test this, and assess gene–brain–behavior relationships, we estimated Pearson’s correlationsbetween indices of intellectual ability and cortical thickness inour sample and found significant positive correlations betweenaverage cortical thickness and nonverbal IQ, which were morepronounced in the left hemisphere (r(1168) = 0.074; P= 0.012 and r(1168) = 0.06; P= 0.041, in the left and right hemisphere,respectively; see Supplementary Table 3). A positive correlationbetween left cortical thickness and school performance was alsoobserved (r(1168) = 0.062; P= 0.033). Correlations with verbal IQwere not significant at an unadjusted Po0.05. In the regions ofthe left cerebral cortex most significantly affected by rs7171755,that is, the left temporal and frontal cortices, correlations were alsosignificant for nonverbal IQ (r(1170) = 0.061; P= 0.036; and r(1170) = 0.075; P= 0.011, respectively); there was also borderlinesignificance for correlations with verbal IQ (in the temporal lobeonly (r(1170) = 0.059; P= 0.044)).These results suggested that, by affecting cortical thickness,
rs7171755 might influence IQ. Mediation analyses performed totest this hypothesis indicated that the minor A-allele at rs7171755associates with lower scores for nonverbal IQ (β=− 1.239;P= 0.0219). This association was mediated by significant indirecteffects (that is, via left frontal lobe thickness) of this SNP onnonverbal IQ (β=− 0.1851; 95% confidence interval (−0.391;−0.046)), whereas direct effects of the SNP on nonverbal IQ werenot significant (95% confidence interval (−2.12; 0.023)). Surpris-ingly, rs7171755 also associated with verbal IQ (β=− 1.5048;P= 0.0076), an association that was not mediated by indirecteffects on mean or temporal thickness. This suggested that morelocalized effects of rs7171755 on brain structure might underliethis association. To test this, we investigated correlations betweenverbal IQ and cortical thickness in language-related region ofinterests in the left frontal and temporal lobes where effects ofrs7171755 on cortical thickness were strongest (see Table 3): thepars orbitalis and the middle temporal and superior temporal
regions. Positive correlations between verbal IQ and corticalthickness were found in the pars orbitalis (r(1170) = 0.080;P= 0.006), while a trend was also found in the middle temporalgyrus (r(1170) = 0.055; P= 0.060). No correlation was observed withthickness in the superior temporal gyrus. Mediation analysesindicated that indirect effects (β=− 0.1486; 95% confidenceinterval (−0.3347; −0.0376)) of rs7171755 on left pars orbitalisthickness partially contributed to its association with verbal IQ,with other factors accounting for the remaining effects(β=− 1.3562; P= 0.0165).Boostrapping analysis revealed similarly negative effect of
rs717175 on IQ with a decrease in intelligence by about 1.81points and 1.41 points per allele for verbal and nonverbal IQ,respectively (β=− 1.808, P= 0.002 and β=− 1.407, P= 0.008; forverbal and nonverbal IQ, respectively; Supplementary Figure 3),accounting for 0.7 and 0.5% of the total variance in IQ,respectively. Altogether, these analyses indicate that the minorallele at rs7171755, via its effects on cortical thickness, particularlyin the left frontal lobe, negatively has an impact on intellectualabilities.
Effects of rs7171755 on NPTN expressionNPTN, a gene selected for our analyses because of its increasedexpression in differentiating human neural progenitor cells(1.5-fold increase at differentiation day 7 compared withundifferentiated cells; false discovery rate o0.05) encodes spliceisoforms of neuroplastin, a synaptic cell adhesion glycoprotein.45
This induction of NPTN occurs at a time when neurites are welldeveloped, and appears to coincide with induction of genesinvolved in cell adhesion and synaptic transmission (see above).To confirm this, we investigated patterns of NPTN expression inthe brain. First, we investigated changes in NPTN expression in themouse brain during stages of embryonic and postnatal develop-ment. One-way analysis of variance indicated that, although levelsof NPTN mRNA are low in the mouse neocortex during embryonicdevelopment, expression of this gene is markedly increased in thefirst week after birth, reaching maximum levels 1 month after birth(F(3, 8) = 53.83; P= 1.2 × 10⁻⁵), a time period that corresponds toadolescence in mice (Figure 4a). To confirm relevance of ourfindings to human brain development, we interrogated theBrainCloud database, which contains genome-wide expressiondata of the prefrontal cortex of 272 individuals across the lifespanas well as their genotype information.33 Investigations of changesin NPTN expression in the human prefrontal cortex across lifetimeconfirmed the expression patterns observed in the mouse brain.Although levels of NPTN (isoforms NM_001161363 andNM_012428) were low during early fetal development, itsexpression increased at later stages of development to reachmaximum levels in childhood through early adulthood, afterwhich expression declines (Figure 4b). To gain functional insightinto these changing expression patterns, we searched for geneswhose expression correlated with that of NPTN in the humanprefrontal cortex across the lifespan and examined their enrich-ment for functional gene groups. Expression of NPTN positivelycorrelated with a cluster of 721 genes (r>0.6) enriched for genesinvolved in energy metabolism (n= 36 (7%), P= 1.08 × 10⁻¹¹),synaptic transmission (n= 27 (5%), P= 7.98 × 10⁻⁷) as well aslearning and memory (n= 14 (3%), P= 2.3 × 10⁻⁵). Lists ofcorrelated genes and their grouping into functional clusters arecontained in Supplementary Tables 4 and 5, respectively.We then investigated possible cis-effects of rs7171755 on NPTN
expression, by testing whether rs7171755 genotypes correlatedwith differences in NPTN expression. We found that expressionof NPTN differed by genotypes; individuals homozygotic for theminor A-allele at rs7171755 had lower expression of this gene(P= 0.009; Figure 4c). Remarkably, this difference was most
Genetic association study of cortical thicknessS Desrivières et al
8
Molecular Psychiatry (2014), 1 – 12 © 2014 Macmillan Publishers Limited

notable from adolescence to early adulthood (late 20 s; Figure 4b),suggesting age-dependent effects of rs7171755.The results presented above point to a lateralized effect of
rs7171755, associated with cortical thickness predominantly in theleft hemisphere. We analyzed this further, investigating possibleasymmetries in cortical thickness and NPTN expression. For thispurpose, we performed paired samples t-tests that indicated that,although cortical thickness correlated well between hemispheres (r(1583)= 0.864) in our sample, the cortex was on average 0.012mmthicker on the right hemisphere (t(1582)= 9.818, P=3.977× 10⁻²²).To test for asymmetric expression of NPTN in the human brain, weanalyzed a database (GEO series GSE25219) containing geneexpression data from 16 brain regions on both hemispheres(n=1340 post-mortem brain samples).34 Paired samples t-testscomparing expression on NPTN in the right vs the left hemisphereindicated that RNA levels of this gene were higher in the righthemisphere than in the left (NPTN left−NPTN right =− 0.0377,t(523) =− 2.703, P=0.007). These results illustrate asymmetries inthe human brain, with both cortical thickness and NPTN expression
being more pronounced in the right hemisphere. The observedasymmetry in NPTN expression may render the left hemispheremore sensitive to the effects of NPTN mutations, accounting for thelateralized effects of rs7171755 found in our study.
DISCUSSIONIn this study, we have used a large sample of healthy adolescentsto investigate the genetic basis of interindividual variations incortical thickness and relevant cognitive phenotypes. Weperformed transcriptional profiling of human neural progenitorcells for neural gene enrichment to allow targeted SNP selectionfor association analyses with structural neuroimaging andcognitive phenotypes. Using this combined, hypothesis driven,approach we were able to identify the NPTN locus as contributingto individual differences in brain structure and cognition. TheSNPs within NPTN associate with cortical thickness in the lefthemisphere, most significantly in areas associated with highercognitive functions including regions throughout the left frontal
Figure 4. Developmental stage- and genotype-specific expression of NPTN in the cerebral cortex. (a) Highest expression of Nptn in theadolescent mouse brain. Nptn mRNA levels in the whole-mouse brain at embryonic day 14 (E14), and in the frontal cortex at E18 or 1 week, 1month and 6 months postnatally (P) were calculated relative to expression in the brain at E10. Statistical analysis compared expression at E10,E18, P1 week and P1 month. ***Po5×10−4. (b) Changes in expression of NPTN across lifespan in the dorsolateral prefrontal cortex of individualsstratified by rs7171755 genotypes. Each subject is colored to indicate its rs7171755 genotype, with the thick dotted curves representing anestimate of the local mean (loess) of NPTN expression for each genotype as it varies across age. Only samples with RNA quality RNA integritynumber (RIN)⩾ 8 are displayed. (c) Statistical analysis of a subset of the data displayed in b, visualizing differences in NPTN expression betweenrs7171755 genotypes in the postnatal brain (age⩾ 0.5 year). The y axis represents NPTN expression after controlling for age, ethnicity and RNAquality (RIN). The x axis represents genotype groups. For b and c, rs7171755 genotypes: dark blue, AA; light blue, AG; pink, GG.
Genetic association study of cortical thicknessS Desrivières et al
9
© 2014 Macmillan Publishers Limited Molecular Psychiatry (2014), 1 – 12

and temporal cortices and the left supramarginal area. The minorallele at rs7171755, which associates with lower cortical thicknessat those regions and decreased performance of adolescents ontests of intellectual ability, also associates with lower expression ofNPTN in the human prefrontal cortex. We have provided additionalcorroborative evidence from the ENIGMA study, the largestgene × neuroimaging meta-analysis study to date by demonstrat-ing the association of NPTN rs7171755 with brain volume, ameasure of brain structure related to cortical thickness. We alsoprovide evidence for asymmetries in the human brain andpropose that asymmetry in NPTN expression may render the lefthemisphere more sensitive to the effects of NPTN mutations,accounting for the lateralized effects of rs7171755 found inour study.In keeping with our data, asymmetric genetic influences on
brain structure have previously been reported, specifically in thefrontal and language-related left temporal cortices, where corticalgray matter distribution displays high heritability.7 Our study, on acohort very homogenous for age (that is, 14 year), yielded resultsconsistent with a previous report,3 which described positivecorrelations, peaking in late childhood/early adolescence,between cortical thickness and levels of intelligence, particularlyin the prefrontal cortex. This age homogeneity is a criticalcharacteristic of our sample, given the reported changes incorrelations between intelligence and cortical thickness fromchildhood to early adulthood.3 Our data also support the notionthat cortical thickness differentially has an impact on verbal andnonverbal abilities. Although average thickness, particularly in theprefrontal cortex, influenced nonverbal cognitive abilities, moreregionally restricted structural effects may control verbal abilities.In this context, our identification of the pars orbitalis as a regionmediating such effects is notable, as this is a part of the Brocalanguage area selectively involved in processing the semanticaspects of sentences.46 Regionally specific cortical thinning in thepars orbitalis has been documented in individuals with DiGeorge,velocardiofacial syndrome,47 whose cognitive deficits includelanguage and speech delays.48
In line with the proposed role of NPTN in neurite outgrowth, wefound that induction of this gene in cultured neural progenitor cellsoccurs at a time when neurites are well developed, coinciding withinduction of genes involved in cell adhesion and synaptictransmission. We also found that NPTN is expressed in the brainat periods of intense neuronal activation and synaptic activity,which fits well with the emerging role of this gene as encoding acell adhesion protein regulating neuritogenesis and synapticplasticity.49–51 Our results also indicate that expression of NPTN inthe cerebral cortex is highest around adolescence, a period that inhumans is accompanied by decrease in gray matter in frontal,parietal and temporal areas.5 This and the proposed role of NPTN inneurite outgrowth and synaptic plasticity suggest that, at thecellular level, synaptic architecture of the cerebral cortex underliethe observed differences in cortical thickness and cognitive abilities.A role for deregulation of NPTN in disorders of the nervous
system is also emerging. NPTN and other genes involved in neuriteoutgrowth have recently been identified as direct targets ofFOXP2,52 a transcription factor that when mutated causes amonogenic speech and language disorder in humans53 and thereduced dosage of which impairs synaptic plasticity, motor-skilllearning and ultrasonic vocalizations in mice,54,55 and disruptsvocal learning in songbirds.56 In agreement with our data, thissuggests that similar to FOXP2, NPTN may be involved in learningvocal and nonvocal skills. Furthermore, functional polymorphismsin the NPTN promoter that may confer susceptibility to schizo-phrenia have been identified.57 Analyzing data from the 1000Genomes Project, we found substantial linkage disequilibrium(D′= 1, r2 = 0.502; data not shown) between rs7171755 andrs3743500, one of these promoter polymorphisms associatedwith schizophrenia. Taken together, these data highlight a
potential role for NPTN and, more generally, synaptic dysfunctionsin forms of intellectual deficits.Such aspects of neural development have long been thought to
underlie formation of higher-order cortical functions. The synapticarchitecture of the cortex has been proposed to define the extentof intellectual capacity: changes in dendritic arborization andspine structure are commonly observed in brain tissue of patientswith various types of intellectual disabilities,58,59 and mutationsare found in many different types of cognitive disorders, includingintellectual disability, schizophrenia and autism spectrum dis-orders, which affect synaptic morphology and plasticity.60–62 Themost recent observations using animal models of intellectualdisability/autism spectrum disorder indicate that the pace ofmaturation of dentritic spine synapses in early postnatal life is vitalfor normal intellectual development.63 It is of interest that thosedendritic spines that become larger and functionally stronger (thatis, more stable synapses) too early in development triggersubsequent cognitive deficits.63
It should be noted that the effect sizes observed in ourexperiments are small, as might be expected from mutations inhuman genes that regulate late events in neural differentiation.Such mutations may not cause gross cortical malformations, butrather more subtle cognitive and behavioral defects. Given thisand the age specificity of our observations, a major challengeremains to generate additional studies to replicate our findings.Nonetheless, we have partly overcome these limitations, furthertesting the relevance of NPTN genotypes for interindividualvariations in brain structure in our sample and in the ENIGMAconsortium for meta-analysis of large neuroimaging and geneticsdata set, and demonstrated the negative association of thers7171755 risk allele with brain volume, further supporting a rolefor NPTN in influencing brain structure. There still is a need todirectly replicate our findings. Even more thrilling is the prospectof applying our approach to the longitudinal study of normal aswell as learning disabled and psychiatric samples to investigatespatiotemporal alterations in the genetic influences reported here.
CONFLICT OF INTERESTDr Barker receives honoraria for teaching from General Electric and acts as aconsultant for IXICO. Dr Banaschewski served in an advisory or consultancy role forHexal Pharma, Lilly, Medice, Novartis, PCM scientific, Shire and Viforpharma. Hereceived conference attendance support and conference support or receivedspeaker’s fee by Lilly, Janssen McNeil, Medice, Novartis and Shire. He is/has beeninvolved in clinical trials conducted by Lilly, Shire and Viforpharma. The present workis unrelated to the above grants and relationships. The remainig authors declare noconflict of interest.
ACKNOWLEDGMENTSWe thank Dr Gary Hardiman for the microarray hybridizations and Professor JackPrice for giving us the SPC04 cells. This work was supported by the European Union-funded FP6 Integrated Project IMAGEN (Reinforcement-related behavior in normalbrain function and psychopathology) (LSHM-CT- 2007-037286), the German Ministryof Education and Research (BMBF Grant # 01EV0711 and eMED ‘Alcoholism’), the FP7project IMAGEMEND (Development of effective imaging tools for diagnosis,monitoring and management of mental disorders) and the Innovative MedicineInitiative Project EU-AIMS (115300-2), as well as the Medical Research CouncilProgramme Grant ‘Developmental pathways into adolescent substance abuse’(G93558), the Swedish Research Council (FORMAS) and the United Kingdom NationalInstitute for Health Research (NIHR) Biomedical Research Centre Mental Health.
REFERENCES1 Lenroot RK, Schmitt JE, Ordaz SJ, Wallace GL, Neale MC, Lerch JP et al. Differences
in genetic and environmental influences on the human cerebral cortex associatedwith development during childhood and adolescence. Hum Brain Mapp 2009; 30:163–174.
Genetic association study of cortical thicknessS Desrivières et al
10
Molecular Psychiatry (2014), 1 – 12 © 2014 Macmillan Publishers Limited

2 Sowell ER, Thompson PM, Leonard CM, Welcome SE, Kan E, Toga AW. Long-itudinal mapping of cortical thickness and brain growth in normal children.J Neurosci 2004; 24: 8223–8231.
3 Shaw P, Greenstein D, Lerch J, Clasen L, Lenroot R, Gogtay N et al. Intellectualability and cortical development in children and adolescents. Nature 2006; 440:676–679.
4 Perrin JS, Herve PY, Leonard G, Perron M, Pike GB, Pitiot A et al. Growth of whitematter in the adolescent brain: role of testosterone and androgen receptor.J Neurosci 2008; 28: 9519–9524.
5 Giedd JN, Blumenthal J, Jeffries NO, Castellanos FX, Liu H, Zijdenbos A et al. Braindevelopment during childhood and adolescence: a longitudinal MRI study. NatNeurosci 1999; 2: 861–863.
6 Gogtay N, Giedd JN, Lusk L, Hayashi KM, Greenstein D, Vaituzis AC et al. Dynamicmapping of human cortical development during childhood through early adult-hood. Proc Natl Acad Sci USA 2004; 101: 8174–8179.
7 Thompson PM, Cannon TD, Narr KL, van Erp T, Poutanen VP, Huttunen M et al.Genetic influences on brain structure. Nat Neurosci 2001; 4: 1253–1258.
8 Yoon U, Fahim C, Perusse D, Evans AC. Lateralized genetic and environmentalinfluences on human brain morphology of 8-year-old twins. Neuroimage 2010; 53:1117–1125.
9 Joshi AA, Lepore N, Joshi SH, Lee AD, Barysheva M, Stein JL et al. The contributionof genes to cortical thickness and volume. Neuroreport 2011; 22: 101–105.
10 Panizzon MS, Fennema-Notestine C, Eyler LT, Jernigan TL, Prom-Wormley E, NealeM et al. Distinct genetic influences on cortical surface area and cortical thickness.Cereb Cortex 2009; 19: 2728–2735.
11 Huttenlocher PR. Synaptic density in human frontal cortex-developmental chan-ges and effects of aging. Brain Res 1979; 163: 195–205.
12 Yakovlev PI, Lecours AR. The myelogenetic cycles of regional maturation ofthe brain. In: Minkowski A (ed). Regional Development of the Brain in Early Life.Blackwell Scientific Boston: MA, USA, 1967, pp 3–70.
13 Rakic P. Specification of cerebral cortical areas. Science 1988; 241: 170–176.14 Pontious A, Kowalczyk T, Englund C, Hevner RF. Role of intermediate progenitor
cells in cerebral cortex development. Dev Neurosci 2008; 30: 24–32.15 Schumann G, Loth E, Banaschewski T, Barbot A, Barker G, Buchel C et al. The
IMAGEN study: reinforcement-related behaviour in normal brain function andpsychopathology. Mol Psychiatry 2010; 15: 1128–1139.
16 Wechsler D. The Wechsler Intelligence Scale for Children—Fourth Edition. Technicaland Interpretive Manual. Psychological Association: San Antonio, TX, USA, 2003.
17 Petersen AC, Crockett L, Richards M, Boxer A. A self-report measure of pubertalstatus: reliability, validity, and initial norms. J Youth Adolesc 1988; 17: 117–133.
18 Pritchard JK, Stephens M, Donnelly P. Inference of population structure usingmultilocus genotype data. Genetics 2000; 155: 945–959.
19 Purcell S, Neale B, Todd-Brown K, Thomas L, Ferreira MA, Bender D et al. PLINK: atool set for whole-genome association and population-based linkage analyses.Am J Hum Genet 2007; 81: 559–575.
20 Price AL, Patterson NJ, Plenge RM, Weinblatt ME, Shadick NA, Reich D. Principalcomponents analysis corrects for stratification in genome-wide association stu-dies. Nat Genet 2006; 38: 904–909.
21 Schilling C, Kuhn S, Paus T, Romanowski A, Banaschewski T, Barbot A et al. Corticalthickness of superior frontal cortex predicts impulsiveness and perceptual rea-soning in adolescence. Mol Psychiatry 2012; 18: 624–630.
22 Cocks G, Romanyuk N, Amemori T, Jendelova P, Forostyak O, Jeffries AR et al.Conditionally immortalized stem cell lines from human spinal cord retain regionalidentity and generate functional V2a interneurons and motorneurons. Stem CellRes Ther 2013; 4: 69.
23 Pollock K, Stroemer P, Patel S, Stevanato L, Hope A, Miljan E et al. A conditionallyimmortal clonal stem cell line from human cortical neuroepithelium for thetreatment of ischemic stroke. Exp Neurol 2006; 199: 143–155.
24 Du P, Kibbe WA, Lin SM. lumi: a pipeline for processing Illumina microarray.Bioinformatics 2008; 24: 1547–1548.
25 Smyth GK. Limma: linear models for microarray data. In: Gentleman R, Carey V,Dudoit S, Irizarry R, Huber W (eds). Bioinformatics and Computational BiologySolutions using R and Bioconductor. Springer: New York, 2005, pp 397–420.
26 Huang DW, Sherman BT, Lempicki RA. Systematic and integrative analysis of largegene lists using DAVID bioinformatics resources. Nat Protoc 2009; 4: 44–57.
27 Yang J, Lee SH, Goddard ME, Visscher PM. GCTA: a tool for genome-wide complextrait analysis. Am J Hum Genet 2011; 88: 76–82.
28 Johnson AD, Handsaker RE, Pulit SL, Nizzari MM, O'Donnell CJ, de Bakker PI. SNAP:a web-based tool for identification and annotation of proxy SNPs using-HapMap. Bioinformatics 2008; 24: 2938–2939.
29 Hayes, AF. Introduction to Mediation, Moderation, and Conditional ProcessAnalysis: A Regression-Based Approach. 1st edn. The Guilford Press: New York, NY,USA, 2013.
30 Novak NM, Stein JL, Medland SE, Hibar DP, Thompson PM, Toga AW. EnigmaVis:online interactive visualization of genome-wide association studies of the
Enhancing NeuroImaging Genetics through Meta-Analysis (ENIGMA) consortium.Twin Res Hum Genet 2012; 15: 414–418.
31 Sun L, Bull SB. Reduction of selection bias in genomewide studies by resampling.Genet Epidemiol 2005; 28: 352–367.
32 Ge T, Feng J, Hibar DP, Thompson PM, Nichols TE. Increasing power for voxel-wise genome-wide association studies: the random field theory, least squarekernel machines and fast permutation procedures. Neuroimage 2012; 63:858–873.
33 Colantuoni C, Lipska BK, Ye T, Hyde TM, Tao R, Leek JT et al. Temporal dynamicsand genetic control of transcription in the human prefrontal cortex. Nature 2011;478: 519–523.
34 Kang HJ, Kawasawa YI, Cheng F, Zhu Y, Xu X, Li M et al. Spatio-temporal trans-criptome of the human brain. Nature 2011; 478: 483–489.
35 Galaburda AM, LeMay M, Kemper TL, Geschwind N. Right-left asymmetrics inthe brain. Science 1978; 199: 852–856.
36 Toga AW, Thompson PM. Mapping brain asymmetry. Nat Rev Neurosci 2003; 4:37–48.
37 Sun T, Patoine C, Abu-Khalil A, Visvader J, Sum E, Cherry TJ et al. Early asymmetryof gene transcription in embryonic human left and right cerebral cortex. Science2005; 308: 1794–1798.
38 Chang S, Johnston RJ Jr, Hobert O. A transcriptional regulatory cascade thatcontrols left/right asymmetry in chemosensory neurons of C. elegans. Genes Dev2003; 17: 2123–2137.
39 Hagmann P, Cammoun L, Gigandet X, Meuli R, Honey CJ, Wedeen VJ et al.Mapping the structural core of human cerebral cortex. PLoS Biol 2008; 6:e159.
40 Kwee LC, Liu D, Lin X, Ghosh D, Epstein MP. A powerful and flexible multilocusassociation test for quantitative traits. Am J Hum Genet 2008; 82: 386–397.
41 Liu D, Lin X, Ghosh D. Semiparametric regression of multidimensional geneticpathway data: least-squares kernel machines and linear mixed models. Biometrics2007; 63: 1079–1088.
42 Faye LL, Sun L, Dimitromanolakis A, Bull SB. A flexible genome-widebootstrap method that accounts for ranking and threshold-selectionbias in GWAS interpretation and replication study design. Stat Med 2011; 30:1898–1912.
43 Tversky A, Kahneman D. Belief in the law of small numbers. Psychol Bull 1971; 75:105–110.
44 Stein JL, Medland SE, Vasquez AA, Hibar DP, Senstad RE, Winkler AM et al.Identification of common variants associated with human hippocampal andintracranial volumes. Nat Genet 2012; 44: 552–561.
45 Hill IE, Selkirk CP, Hawkes RB, Beesley PW. Characterization of novel glycoproteincomponents of synaptic membranes and postsynaptic densities, gp65 and gp55,with a monoclonal antibody. Brain Res 1988; 461: 27–43.
46 Dapretto M, Bookheimer SY. Form and content: dissociating syntax and semanticsin sentence comprehension. Neuron 1999; 24: 427–432.
47 Bearden CE, van Erp TG, Dutton RA, Tran H, Zimmermann L, Sun D et al. Mappingcortical thickness in children with 22q11.2 deletions. Cereb Cortex 2007; 17:1889–1898.
48 Gerdes M, Solot C, Wang PP, Moss E, LaRossa D, Randall P et al. Cognitive andbehavior profile of preschool children with chromosome 22q11.2 deletion. Am JMed Genet 1999; 85: 127–133.
49 Smalla KH, Matthies H, Langnase K, Shabir S, Bockers TM, Wyneken U et al. Thesynaptic glycoprotein neuroplastin is involved in long-term potentiation at hip-pocampal CA1 synapses. Proc Natl Acad Sci USA 2000; 97: 4327–4332.
50 Empson RM, Buckby LE, Kraus M, Bates KJ, Crompton MR, Gundelfinger ED et al.The cell adhesion molecule neuroplastin-65 inhibits hippocampal long-termpotentiation via a mitogen-activated protein kinase p38-dependent reduction insurface expression of GluR1-containing glutamate receptors. J Neurochem 2006;99: 850–860.
51 Owczarek S, Soroka V, Kiryushko D, Larsen MH, Yuan Q, Sandi C et al.Neuroplastin-65 and a mimetic peptide derived from its homophilic binding sitemodulate neuritogenesis and neuronal plasticity. J Neurochem 2011; 117:984–994.
52 Vernes SC, Oliver PL, Spiteri E, Lockstone HE, Puliyadi R, Taylor JM et al. Foxp2regulates gene networks implicated in neurite outgrowth in the developing brain.PLoS Genet 2011; 7: e1002145.
53 Lai CS, Fisher SE, Hurst JA, Vargha-Khadem F, Monaco AP. A forkhead-domaingene is mutated in a severe speech and language disorder. Nature 2001; 413:519–523.
54 Groszer M, Keays DA, Deacon RM, de Bono JP, Prasad-Mulcare S, Gaub S et al.Impaired synaptic plasticity and motor learning in mice with a point mutationimplicated in human speech deficits. Curr Biol 2008; 18: 354–362.
55 Shu W, Cho JY, Jiang Y, Zhang M, Weisz D, Elder GA et al. Altered ultrasonicvocalization in mice with a disruption in the Foxp2 gene. Proc Natl Acad Sci USA2005; 102: 9643–9648.
Genetic association study of cortical thicknessS Desrivières et al
11
© 2014 Macmillan Publishers Limited Molecular Psychiatry (2014), 1 – 12

56 Haesler S, Wada K, Nshdejan A, Morrisey EE, Lints T, Jarvis ED et al. FoxP2expression in avian vocal learners and non-learners. J Neurosci 2004; 24:3164–3175.
57 Saito A, Fujikura-Ouchi Y, Kuramasu A, Shimoda K, Akiyama K, Matsuoka H et al.Association study of putative promoter polymorphisms in the neuroplastin geneand schizophrenia. Neurosci Lett 2007; 411: 168–173.
58 Huttenlocher PR. Dendritic and synaptic pathology in mental retardation. PediatrNeurol 1991; 7: 79–85.
59 Purpura DP. Dendritic spine ‘dysgenesis’ and mental retardation. Science 1974;186: 1126–1128.
60 Gilman SR, Chang J, Xu B, Bawa TS, Gogos JA, Karayiorgou M et al. Diverse types ofgenetic variation converge on functional gene networks involved in schizo-phrenia. Nat Neurosci 2012; 15: 1723–1728.
61 van Bokhoven H. Genetic and epigenetic networks in intellectual disabilities. AnnuRev Genet 2011; 45: 81–104.
62 Gilman SR, Iossifov I, Levy D, Ronemus M, Wigler M, Vitkup D. Rare de novovariants associated with autism implicate a large functional network of genesinvolved in formation and function of synapses. Neuron 2011; 70: 898–907.
63 Clement JP, Aceti M, Creson TK, Ozkan ED, Shi Y, Reish NJ et al. PathogenicSYNGAP mutations impair cognitive development by disrupting maturation ofdendritic spine synapses. Cell 2012; 151: 709–723.
This work is licensed under a Creative Commons Attribution-NonCommercial-NoDerivs 3.0 Unported License. To view a copy of
this license, visit http://creativecommons.org/licenses/by-nc-nd/3.0/
Supplementary Information accompanies the paper on the Molecular Psychiatry website (http://www.nature.com/mp)
Genetic association study of cortical thicknessS Desrivières et al
12
Molecular Psychiatry (2014), 1 – 12 © 2014 Macmillan Publishers Limited