single-molecule fluorescence spectroscopy maps the folding landscape of a large protein menahem...
TRANSCRIPT

Single-molecule fluorescence spectroscopy maps the folding
landscape of a large protein
Menahem Pirchi, Guy Ziv, Inbal Riven, sharona sedghani Cohen, nir Zohar, Yoav Barak & Gilad Haran
Gong, Ping
Department of Chemistry and Biochemistry
University of Delaware

Small
single-domain protein
Two-state folding behavior
Smooth
Minimize the number of
intermediates and kinetic traps
Large protein
with multiple domains
More than 70% of eukaryotic proteome
Metastable intermediates
Complex folding pathway

Single-molecule fluorescence resonance energy transfer
spectroscopy
(smFRET)
3
Reliable "ruler" for measuring structural changes in proteins
Dispelling unknown orientation factor
From PubMed: http://www.ncbi.nlm.nih.gov/pubmed/7577238

4
Adenylate kinase
Labeled at position 73 and 203
Encapsulated within lipid vesicles
Series of GdmCl concentrations
Pirchi, M. et al. Nat. Commun. 2:493 doi:10.1038/ncomms1504 (2011).

In lack of a very long single-molecule temporal trajectory that maps the whole landscape
Multiple short trajectories collected in experimentAvailability of a large number of equilibrium trajectories facilitates reconstruction of the folding landscape
Pirchi, M. et al. Nat. Commun. 2:493 doi:10.1038/ncomms1504 (2011).
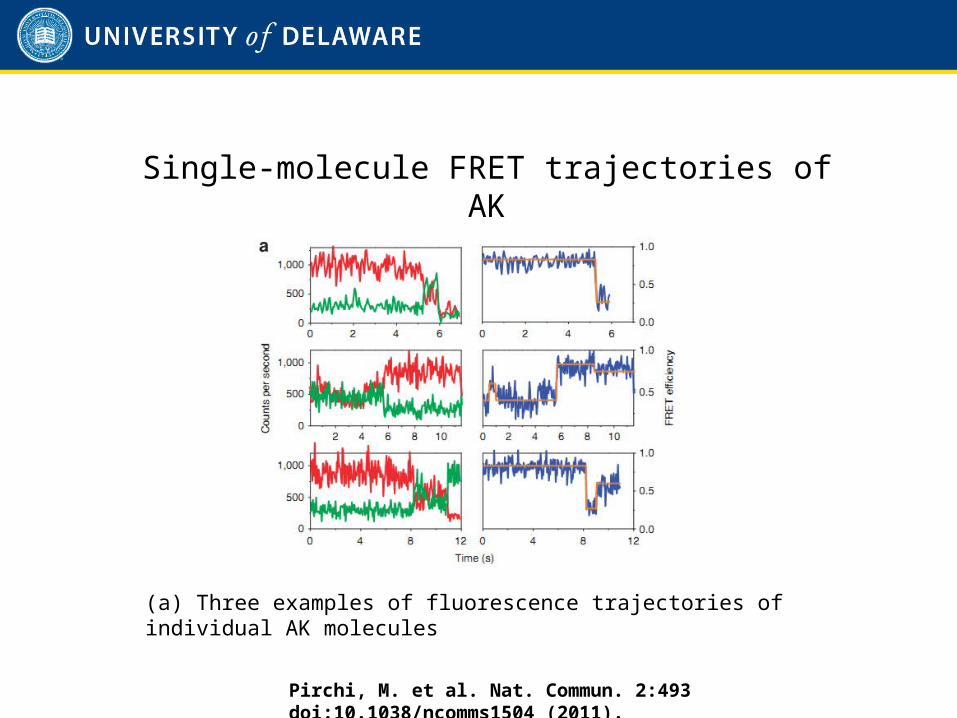
(a) Three examples of fluorescence trajectories of individual AK molecules
Single-molecule FRET trajectories of AK
Pirchi, M. et al. Nat. Commun. 2:493 doi:10.1038/ncomms1504 (2011).
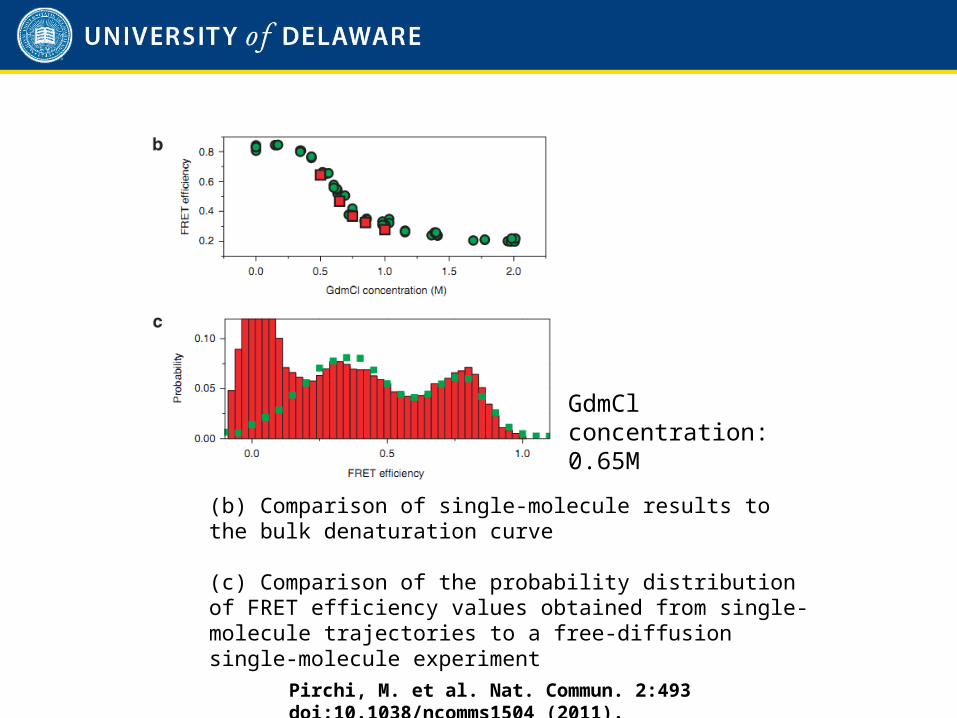
(b) Comparison of single-molecule results to the bulk denaturation curve
(c) Comparison of the probability distribution of FRET efficiency values obtained from single-molecule trajectories to a free-diffusion single-molecule experiment
Pirchi, M. et al. Nat. Commun. 2:493 doi:10.1038/ncomms1504 (2011).
GdmCl concentration: 0.65M

Change-point analysis of trajectories
Transition density map constructed from the 0.65M GdmCl data set
Pirchi, M. et al. Nat. Commun. 2:493 doi:10.1038/ncomms1504 (2011).

HMM reveals six states
• HMM: Hidden Markov Model
• State is not directly visible • Output (dependent on the state) is visible • The sequence of tokens generated by an HMM gives some
information about the sequence of states
From wikipedia: http://en.wikipedia.org/wiki/Hidden_Markov_model

• The dynamics obey detailed balance —the flux from i to j equals the flux from j to i.
• Add an extra state presenting the photobleached molecules.
• Baum-Welch algorithm is used to obtain a maximum likelihood estimate of the HMM parameters.

Correlation between the transition density map based on change-point analysis and maps based on the HMM analysis
Focusing on the data set taken at 0.65 M GdmCl
Repeat the HMM analysis for different values of N, from 2 to 14.
Use the HMM parameters to generate a transition map
cross-correlated this map with the one obtained from the change-point analysis.
optimal N is between 5 to 7
Pirchi, M. et al. Nat. Commun. 2:493 doi:10.1038/ncomms1504 (2011).

State probability distribution histograms, as a function of GdmCl concentration
State connectivity changes with denaturant concentration
Pirchi, M. et al. Nat. Commun. 2:493 doi:10.1038/ncomms1504 (2011).
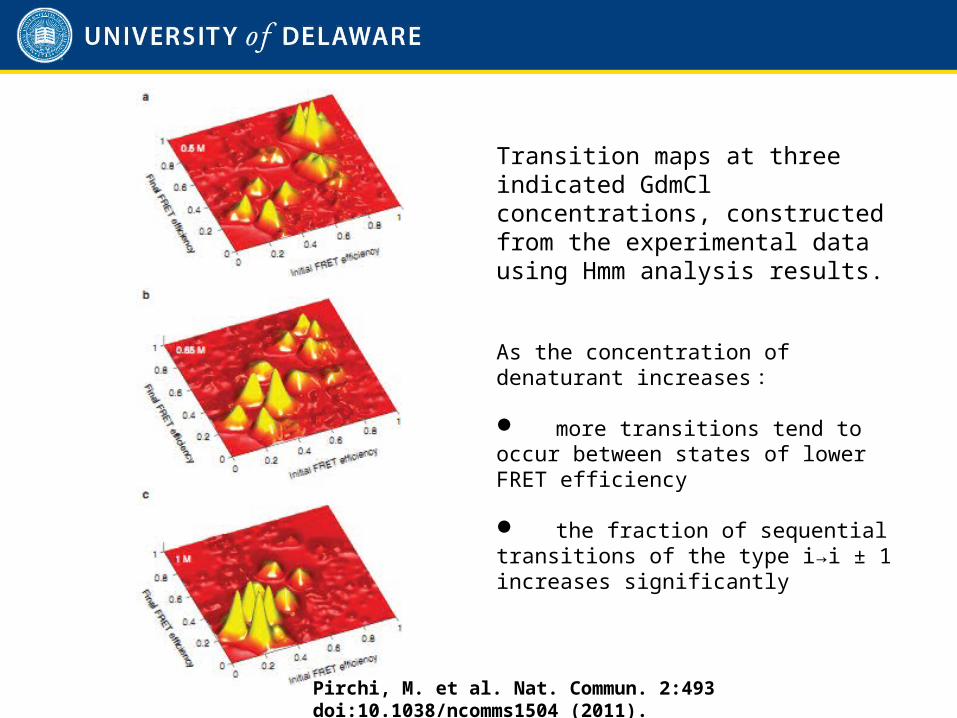
Transition maps at three indicated GdmCl concentrations, constructed from the experimental data using Hmm analysis results.
As the concentration of denaturant increases:
more transitions tend to occur between states of lower FRET efficiency
the fraction of sequential transitions of the type i→i ± 1 increases significantly
Pirchi, M. et al. Nat. Commun. 2:493 doi:10.1038/ncomms1504 (2011).

One-dimensional projections of the folding landscape of AK at the three indicated GdmCl concentrations
The widths of the lines depict the relative productive flux flowing between each pair of states
their colours represent the transition rates.
Pirchi, M. et al. Nat. Commun. 2:493 doi:10.1038/ncomms1504 (2011).

Discussion
• Single-molecule FRET spectroscopy can provide a comprehensive description of the folding landscape of a large, multidomain protein
• The dynamics involve a large set of possible pathways on the landscape
• Provides the experimental means to characterize folding dynamics-- considerably richer than the simple sequential dynamics
• Suggest to combine the results from our smFRET experiment with those obtained from a method like native-state hydrogen exchange, also combine computer simulations and measurements