single-family real estate market statistics · 2020-03-17 · single-family real estate market...
TRANSCRIPT

SINGLE-FAMILY REAL ESTATE MARKET STATISTICS POWERED BY REALCOMP REALTORS® FEBRUARY 2020
Local Market Update – February 2020A Research Tool Provided by Realcomp
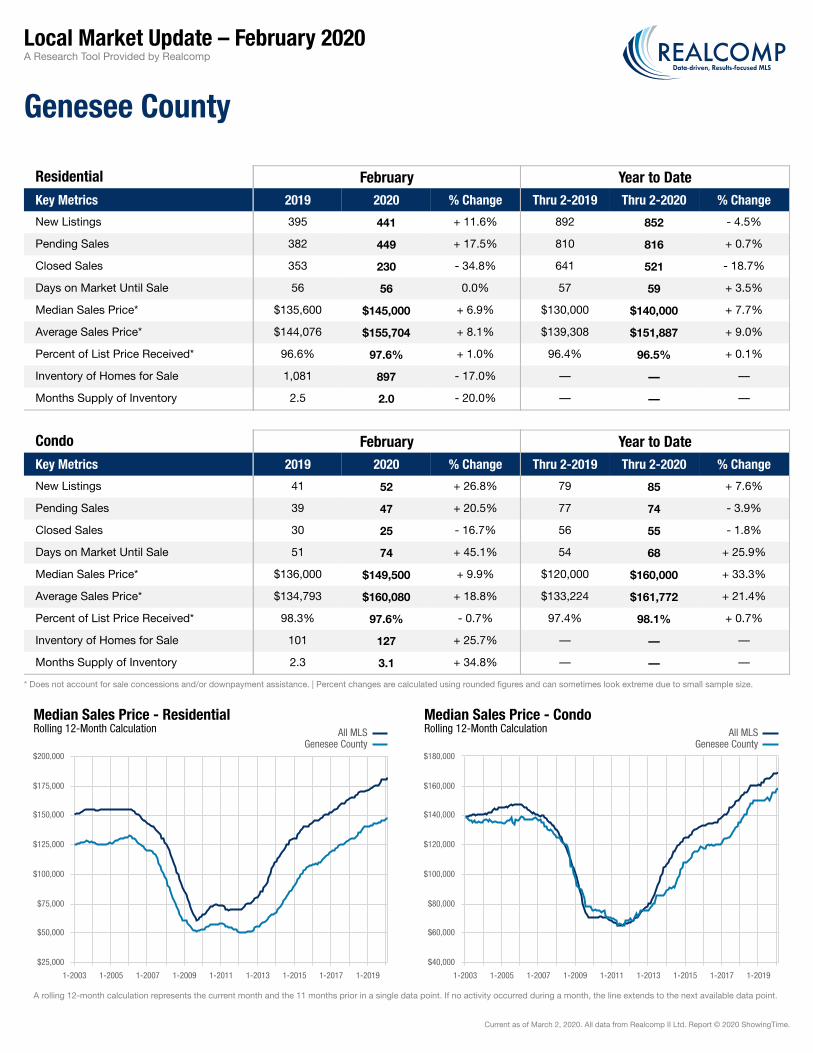
Genesee County
Residential February Year to DateKey Metrics 2019 2020 % Change Thru 2-2019 Thru 2-2020 % Change
New Listings 395 441 + 11.6% 892 852 - 4.5%
Pending Sales 382 449 + 17.5% 810 816 + 0.7%
Closed Sales 353 230 - 34.8% 641 521 - 18.7%
Days on Market Until Sale 56 56 0.0% 57 59 + 3.5%
Median Sales Price* $135,600 $145,000 + 6.9% $130,000 $140,000 + 7.7%
Average Sales Price* $144,076 $155,704 + 8.1% $139,308 $151,887 + 9.0%
Percent of List Price Received* 96.6% 97.6% + 1.0% 96.4% 96.5% + 0.1%
Inventory of Homes for Sale 1,081 897 - 17.0% –– –– ––
Months Supply of Inventory 2.5 2.0 - 20.0% –– –– ––
Condo February Year to DateKey Metrics 2019 2020 % Change Thru 2-2019 Thru 2-2020 % Change
New Listings 41 52 + 26.8% 79 85 + 7.6%
Pending Sales 39 47 + 20.5% 77 74 - 3.9%
Closed Sales 30 25 - 16.7% 56 55 - 1.8%
Days on Market Until Sale 51 74 + 45.1% 54 68 + 25.9%
Median Sales Price* $136,000 $149,500 + 9.9% $120,000 $160,000 + 33.3%
Average Sales Price* $134,793 $160,080 + 18.8% $133,224 $161,772 + 21.4%
Percent of List Price Received* 98.3% 97.6% - 0.7% 97.4% 98.1% + 0.7%
Inventory of Homes for Sale 101 127 + 25.7% –– –– ––
Months Supply of Inventory 2.3 3.1 + 34.8% –– –– ––
* Does not account for sale concessions and/or downpayment assistance. | Percent changes are calculated using rounded figures and can sometimes look extreme due to small sample size.
A rolling 12-month calculation represents the current month and the 11 months prior in a single data point. If no activity occurred during a month, the line extends to the next available data point.
Median Sales Price - ResidentialRolling 12-Month Calculation All MLS
Genesee County
1-2003 1-2005 1-2007 1-2009 1-2011 1-2013 1-2015 1-2017 1-2019
$25,000
$50,000
$75,000
$100,000
$125,000
$150,000
$175,000
$200,000
Median Sales Price - CondoRolling 12-Month Calculation All MLS
Genesee County
1-2003 1-2005 1-2007 1-2009 1-2011 1-2013 1-2015 1-2017 1-2019
$40,000
$60,000
$80,000
$100,000
$120,000
$140,000
$160,000
$180,000
Current as of March 2, 2020. All data from Realcomp II Ltd. Report © 2020 ShowingTime.

Local Market Update – February 2020A Research Tool Provided by Realcomp
Huron County
Residential February Year to DateKey Metrics 2019 2020 % Change Thru 2-2019 Thru 2-2020 % Change
New Listings 9 11 + 22.2% 21 21 0.0%
Pending Sales 3 3 0.0% 8 11 + 37.5%
Closed Sales 5 6 + 20.0% 11 12 + 9.1%
Days on Market Until Sale 82 141 + 72.0% 88 151 + 71.6%
Median Sales Price* $250,000 $128,450 - 48.6% $125,000 $127,950 + 2.4%
Average Sales Price* $276,680 $136,167 - 50.8% $179,782 $140,596 - 21.8%
Percent of List Price Received* 96.7% 97.6% + 0.9% 94.5% 95.2% + 0.7%
Inventory of Homes for Sale 60 63 + 5.0% –– –– ––
Months Supply of Inventory 7.6 5.9 - 22.4% –– –– ––
Condo February Year to DateKey Metrics 2019 2020 % Change Thru 2-2019 Thru 2-2020 % Change
New Listings 0 0 0.0% 0 0 0.0%
Pending Sales 0 0 0.0% 0 0 0.0%
Closed Sales 0 0 0.0% 0 0 0.0%
Days on Market Until Sale –– –– –– –– –– ––
Median Sales Price* –– –– –– –– –– ––
Average Sales Price* –– –– –– –– –– ––
Percent of List Price Received* –– –– –– –– –– ––
Inventory of Homes for Sale 1 1 0.0% –– –– ––
Months Supply of Inventory –– 1.0 –– –– –– ––
* Does not account for sale concessions and/or downpayment assistance. | Percent changes are calculated using rounded figures and can sometimes look extreme due to small sample size.
A rolling 12-month calculation represents the current month and the 11 months prior in a single data point. If no activity occurred during a month, the line extends to the next available data point.
Median Sales Price - ResidentialRolling 12-Month Calculation All MLS
Huron County
1-2003 1-2005 1-2007 1-2009 1-2011 1-2013 1-2015 1-2017 1-2019
$25,000
$50,000
$75,000
$100,000
$125,000
$150,000
$175,000
$200,000
Median Sales Price - CondoRolling 12-Month Calculation All MLS
Huron County
1-2003 1-2005 1-2007 1-2009 1-2011 1-2013 1-2015 1-2017 1-2019
$50,000
$100,000
$150,000
$200,000
$250,000
$300,000
$350,000
$400,000
Current as of March 2, 2020. All data from Realcomp II Ltd. Report © 2020 ShowingTime.

Local Market Update – February 2020A Research Tool Provided by Realcomp
Jackson County
Residential February Year to DateKey Metrics 2019 2020 % Change Thru 2-2019 Thru 2-2020 % Change
New Listings 163 172 + 5.5% 366 368 + 0.5%
Pending Sales 146 56 - 61.6% 308 151 - 51.0%
Closed Sales 133 120 - 9.8% 283 246 - 13.1%
Days on Market Until Sale 95 88 - 7.4% 91 83 - 8.8%
Median Sales Price* $125,000 $151,000 + 20.8% $130,000 $139,200 + 7.1%
Average Sales Price* $141,160 $171,023 + 21.2% $148,283 $156,885 + 5.8%
Percent of List Price Received* 96.4% 96.6% + 0.2% 96.4% 96.6% + 0.2%
Inventory of Homes for Sale 488 571 + 17.0% –– –– ––
Months Supply of Inventory 2.5 3.3 + 32.0% –– –– ––
Condo February Year to DateKey Metrics 2019 2020 % Change Thru 2-2019 Thru 2-2020 % Change
New Listings 8 7 - 12.5% 20 14 - 30.0%
Pending Sales 6 1 - 83.3% 12 5 - 58.3%
Closed Sales 6 4 - 33.3% 15 6 - 60.0%
Days on Market Until Sale 47 83 + 76.6% 94 72 - 23.4%
Median Sales Price* $125,965 $199,750 + 58.6% $136,335 $86,750 - 36.4%
Average Sales Price* $151,753 $178,100 + 17.4% $139,789 $134,567 - 3.7%
Percent of List Price Received* 98.1% 97.1% - 1.0% 96.5% 94.6% - 2.0%
Inventory of Homes for Sale 24 21 - 12.5% –– –– ––
Months Supply of Inventory 4.2 3.5 - 16.7% –– –– ––
* Does not account for sale concessions and/or downpayment assistance. | Percent changes are calculated using rounded figures and can sometimes look extreme due to small sample size.
A rolling 12-month calculation represents the current month and the 11 months prior in a single data point. If no activity occurred during a month, the line extends to the next available data point.
Median Sales Price - ResidentialRolling 12-Month Calculation All MLS
Jackson County
1-2003 1-2005 1-2007 1-2009 1-2011 1-2013 1-2015 1-2017 1-2019
$25,000
$50,000
$75,000
$100,000
$125,000
$150,000
$175,000
$200,000
Median Sales Price - CondoRolling 12-Month Calculation All MLS
Jackson County
1-2003 1-2005 1-2007 1-2009 1-2011 1-2013 1-2015 1-2017 1-2019
$0
$50,000
$100,000
$150,000
$200,000
$250,000
Current as of March 2, 2020. All data from Realcomp II Ltd. Report © 2020 ShowingTime.

Local Market Update – February 2020A Research Tool Provided by Realcomp
Lapeer County
Residential February Year to DateKey Metrics 2019 2020 % Change Thru 2-2019 Thru 2-2020 % Change
New Listings 75 92 + 22.7% 186 200 + 7.5%
Pending Sales 64 89 + 39.1% 135 166 + 23.0%
Closed Sales 62 64 + 3.2% 111 118 + 6.3%
Days on Market Until Sale 65 62 - 4.6% 57 62 + 8.8%
Median Sales Price* $197,500 $214,950 + 8.8% $180,000 $199,950 + 11.1%
Average Sales Price* $212,427 $225,656 + 6.2% $202,743 $220,280 + 8.6%
Percent of List Price Received* 97.4% 96.7% - 0.7% 97.1% 96.7% - 0.4%
Inventory of Homes for Sale 273 261 - 4.4% –– –– ––
Months Supply of Inventory 2.9 2.5 - 13.8% –– –– ––
Condo February Year to DateKey Metrics 2019 2020 % Change Thru 2-2019 Thru 2-2020 % Change
New Listings 3 2 - 33.3% 7 4 - 42.9%
Pending Sales 2 2 0.0% 4 5 + 25.0%
Closed Sales 2 2 0.0% 2 5 + 150.0%
Days on Market Until Sale 78 9 - 88.5% 78 42 - 46.2%
Median Sales Price* $137,000 $179,000 + 30.7% $137,000 $138,000 + 0.7%
Average Sales Price* $137,000 $179,000 + 30.7% $137,000 $149,500 + 9.1%
Percent of List Price Received* 91.9% 96.6% + 5.1% 91.9% 92.4% + 0.5%
Inventory of Homes for Sale 11 18 + 63.6% –– –– ––
Months Supply of Inventory 3.9 6.0 + 53.8% –– –– ––
* Does not account for sale concessions and/or downpayment assistance. | Percent changes are calculated using rounded figures and can sometimes look extreme due to small sample size.
A rolling 12-month calculation represents the current month and the 11 months prior in a single data point. If no activity occurred during a month, the line extends to the next available data point.
Median Sales Price - ResidentialRolling 12-Month Calculation All MLS
Lapeer County
1-2003 1-2005 1-2007 1-2009 1-2011 1-2013 1-2015 1-2017 1-2019
$50,000
$75,000
$100,000
$125,000
$150,000
$175,000
$200,000
Median Sales Price - CondoRolling 12-Month Calculation All MLS
Lapeer County
1-2003 1-2005 1-2007 1-2009 1-2011 1-2013 1-2015 1-2017 1-2019
$50,000
$75,000
$100,000
$125,000
$150,000
$175,000
$200,000
Current as of March 2, 2020. All data from Realcomp II Ltd. Report © 2020 ShowingTime.

Local Market Update – February 2020A Research Tool Provided by Realcomp
Lenawee County
Residential February Year to DateKey Metrics 2019 2020 % Change Thru 2-2019 Thru 2-2020 % Change
New Listings 84 133 + 58.3% 161 233 + 44.7%
Pending Sales 71 69 - 2.8% 142 142 0.0%
Closed Sales 66 72 + 9.1% 125 151 + 20.8%
Days on Market Until Sale 86 117 + 36.0% 90 109 + 21.1%
Median Sales Price* $142,450 $145,000 + 1.8% $136,500 $138,000 + 1.1%
Average Sales Price* $145,683 $160,514 + 10.2% $150,800 $153,660 + 1.9%
Percent of List Price Received* 98.4% 95.2% - 3.3% 97.9% 96.0% - 1.9%
Inventory of Homes for Sale 299 356 + 19.1% –– –– ––
Months Supply of Inventory 2.8 3.1 + 10.7% –– –– ––
Condo February Year to DateKey Metrics 2019 2020 % Change Thru 2-2019 Thru 2-2020 % Change
New Listings 5 3 - 40.0% 10 11 + 10.0%
Pending Sales 4 2 - 50.0% 8 4 - 50.0%
Closed Sales 2 2 0.0% 4 4 0.0%
Days on Market Until Sale 164 69 - 57.9% 92 77 - 16.3%
Median Sales Price* $182,950 $248,192 + 35.7% $156,500 $248,192 + 58.6%
Average Sales Price* $182,950 $248,192 + 35.7% $158,225 $253,360 + 60.1%
Percent of List Price Received* 95.1% 110.1% + 15.8% 97.5% 109.2% + 12.0%
Inventory of Homes for Sale 13 16 + 23.1% –– –– ––
Months Supply of Inventory 3.7 3.6 - 2.7% –– –– ––
* Does not account for sale concessions and/or downpayment assistance. | Percent changes are calculated using rounded figures and can sometimes look extreme due to small sample size.
A rolling 12-month calculation represents the current month and the 11 months prior in a single data point. If no activity occurred during a month, the line extends to the next available data point.
Median Sales Price - ResidentialRolling 12-Month Calculation All MLS
Lenawee County
1-2003 1-2005 1-2007 1-2009 1-2011 1-2013 1-2015 1-2017 1-2019
$50,000
$75,000
$100,000
$125,000
$150,000
$175,000
$200,000
Median Sales Price - CondoRolling 12-Month Calculation All MLS
Lenawee County
1-2003 1-2005 1-2007 1-2009 1-2011 1-2013 1-2015 1-2017 1-2019
$50,000
$100,000
$150,000
$200,000
$250,000
$300,000
$350,000
Current as of March 2, 2020. All data from Realcomp II Ltd. Report © 2020 ShowingTime.
Local Market Update – February 2020A Research Tool Provided by Realcomp
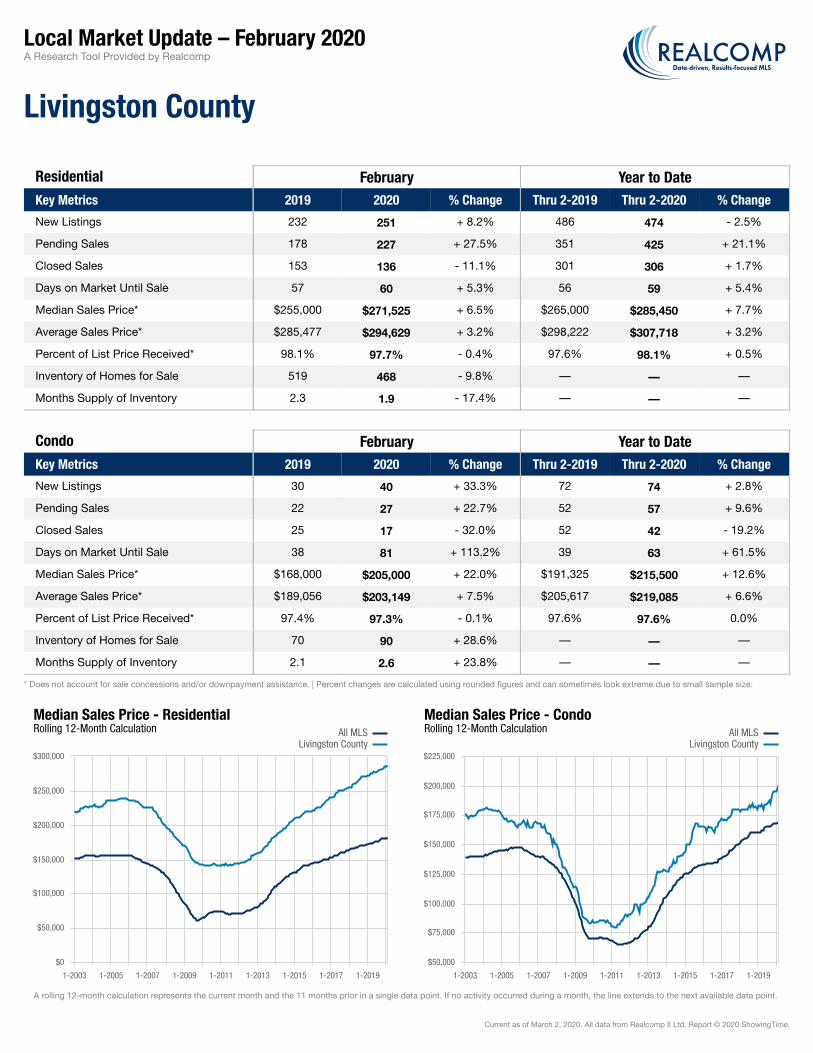
Livingston County
Residential February Year to DateKey Metrics 2019 2020 % Change Thru 2-2019 Thru 2-2020 % Change
New Listings 232 251 + 8.2% 486 474 - 2.5%
Pending Sales 178 227 + 27.5% 351 425 + 21.1%
Closed Sales 153 136 - 11.1% 301 306 + 1.7%
Days on Market Until Sale 57 60 + 5.3% 56 59 + 5.4%
Median Sales Price* $255,000 $271,525 + 6.5% $265,000 $285,450 + 7.7%
Average Sales Price* $285,477 $294,629 + 3.2% $298,222 $307,718 + 3.2%
Percent of List Price Received* 98.1% 97.7% - 0.4% 97.6% 98.1% + 0.5%
Inventory of Homes for Sale 519 468 - 9.8% –– –– ––
Months Supply of Inventory 2.3 1.9 - 17.4% –– –– ––
Condo February Year to DateKey Metrics 2019 2020 % Change Thru 2-2019 Thru 2-2020 % Change
New Listings 30 40 + 33.3% 72 74 + 2.8%
Pending Sales 22 27 + 22.7% 52 57 + 9.6%
Closed Sales 25 17 - 32.0% 52 42 - 19.2%
Days on Market Until Sale 38 81 + 113.2% 39 63 + 61.5%
Median Sales Price* $168,000 $205,000 + 22.0% $191,325 $215,500 + 12.6%
Average Sales Price* $189,056 $203,149 + 7.5% $205,617 $219,085 + 6.6%
Percent of List Price Received* 97.4% 97.3% - 0.1% 97.6% 97.6% 0.0%
Inventory of Homes for Sale 70 90 + 28.6% –– –– ––
Months Supply of Inventory 2.1 2.6 + 23.8% –– –– ––
* Does not account for sale concessions and/or downpayment assistance. | Percent changes are calculated using rounded figures and can sometimes look extreme due to small sample size.
A rolling 12-month calculation represents the current month and the 11 months prior in a single data point. If no activity occurred during a month, the line extends to the next available data point.
Median Sales Price - ResidentialRolling 12-Month Calculation All MLS
Livingston County
1-2003 1-2005 1-2007 1-2009 1-2011 1-2013 1-2015 1-2017 1-2019
$0
$50,000
$100,000
$150,000
$200,000
$250,000
$300,000
Median Sales Price - CondoRolling 12-Month Calculation All MLS
Livingston County
1-2003 1-2005 1-2007 1-2009 1-2011 1-2013 1-2015 1-2017 1-2019
$50,000
$75,000
$100,000
$125,000
$150,000
$175,000
$200,000
$225,000
Current as of March 2, 2020. All data from Realcomp II Ltd. Report © 2020 ShowingTime.
Local Market Update – February 2020A Research Tool Provided by Realcomp
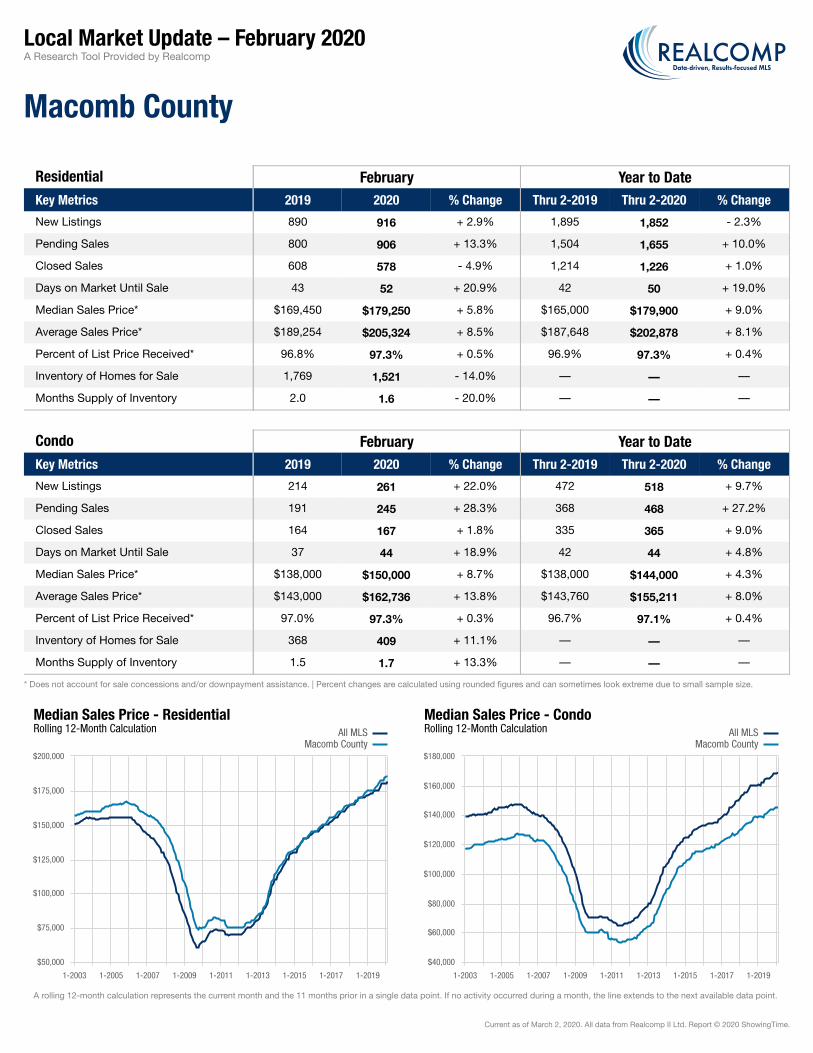
Macomb County
Residential February Year to DateKey Metrics 2019 2020 % Change Thru 2-2019 Thru 2-2020 % Change
New Listings 890 916 + 2.9% 1,895 1,852 - 2.3%
Pending Sales 800 906 + 13.3% 1,504 1,655 + 10.0%
Closed Sales 608 578 - 4.9% 1,214 1,226 + 1.0%
Days on Market Until Sale 43 52 + 20.9% 42 50 + 19.0%
Median Sales Price* $169,450 $179,250 + 5.8% $165,000 $179,900 + 9.0%
Average Sales Price* $189,254 $205,324 + 8.5% $187,648 $202,878 + 8.1%
Percent of List Price Received* 96.8% 97.3% + 0.5% 96.9% 97.3% + 0.4%
Inventory of Homes for Sale 1,769 1,521 - 14.0% –– –– ––
Months Supply of Inventory 2.0 1.6 - 20.0% –– –– ––
Condo February Year to DateKey Metrics 2019 2020 % Change Thru 2-2019 Thru 2-2020 % Change
New Listings 214 261 + 22.0% 472 518 + 9.7%
Pending Sales 191 245 + 28.3% 368 468 + 27.2%
Closed Sales 164 167 + 1.8% 335 365 + 9.0%
Days on Market Until Sale 37 44 + 18.9% 42 44 + 4.8%
Median Sales Price* $138,000 $150,000 + 8.7% $138,000 $144,000 + 4.3%
Average Sales Price* $143,000 $162,736 + 13.8% $143,760 $155,211 + 8.0%
Percent of List Price Received* 97.0% 97.3% + 0.3% 96.7% 97.1% + 0.4%
Inventory of Homes for Sale 368 409 + 11.1% –– –– ––
Months Supply of Inventory 1.5 1.7 + 13.3% –– –– ––
* Does not account for sale concessions and/or downpayment assistance. | Percent changes are calculated using rounded figures and can sometimes look extreme due to small sample size.
A rolling 12-month calculation represents the current month and the 11 months prior in a single data point. If no activity occurred during a month, the line extends to the next available data point.
Median Sales Price - ResidentialRolling 12-Month Calculation All MLS
Macomb County
1-2003 1-2005 1-2007 1-2009 1-2011 1-2013 1-2015 1-2017 1-2019
$50,000
$75,000
$100,000
$125,000
$150,000
$175,000
$200,000
Median Sales Price - CondoRolling 12-Month Calculation All MLS
Macomb County
1-2003 1-2005 1-2007 1-2009 1-2011 1-2013 1-2015 1-2017 1-2019
$40,000
$60,000
$80,000
$100,000
$120,000
$140,000
$160,000
$180,000
Current as of March 2, 2020. All data from Realcomp II Ltd. Report © 2020 ShowingTime.

Local Market Update – February 2020A Research Tool Provided by Realcomp
Monroe County
Residential February Year to DateKey Metrics 2019 2020 % Change Thru 2-2019 Thru 2-2020 % Change
New Listings 134 125 - 6.7% 281 277 - 1.4%
Pending Sales 142 150 + 5.6% 241 277 + 14.9%
Closed Sales 86 103 + 19.8% 179 203 + 13.4%
Days on Market Until Sale 68 75 + 10.3% 73 71 - 2.7%
Median Sales Price* $156,000 $176,000 + 12.8% $170,000 $176,000 + 3.5%
Average Sales Price* $166,621 $190,480 + 14.3% $181,408 $193,634 + 6.7%
Percent of List Price Received* 97.7% 96.0% - 1.7% 98.0% 96.0% - 2.0%
Inventory of Homes for Sale 421 373 - 11.4% –– –– ––
Months Supply of Inventory 2.8 2.4 - 14.3% –– –– ––
Condo February Year to DateKey Metrics 2019 2020 % Change Thru 2-2019 Thru 2-2020 % Change
New Listings 7 5 - 28.6% 18 12 - 33.3%
Pending Sales 7 4 - 42.9% 10 14 + 40.0%
Closed Sales 1 4 + 300.0% 8 13 + 62.5%
Days on Market Until Sale 144 47 - 67.4% 77 53 - 31.2%
Median Sales Price* $180,000 $124,950 - 30.6% $164,750 $115,000 - 30.2%
Average Sales Price* $180,000 $146,225 - 18.8% $178,925 $136,185 - 23.9%
Percent of List Price Received* 94.8% 97.5% + 2.8% 96.8% 96.5% - 0.3%
Inventory of Homes for Sale 23 13 - 43.5% –– –– ––
Months Supply of Inventory 3.3 1.7 - 48.5% –– –– ––
* Does not account for sale concessions and/or downpayment assistance. | Percent changes are calculated using rounded figures and can sometimes look extreme due to small sample size.
A rolling 12-month calculation represents the current month and the 11 months prior in a single data point. If no activity occurred during a month, the line extends to the next available data point.
Median Sales Price - ResidentialRolling 12-Month Calculation All MLS
Monroe County
1-2003 1-2005 1-2007 1-2009 1-2011 1-2013 1-2015 1-2017 1-2019
$50,000
$75,000
$100,000
$125,000
$150,000
$175,000
$200,000
Median Sales Price - CondoRolling 12-Month Calculation All MLS
Monroe County
1-2003 1-2005 1-2007 1-2009 1-2011 1-2013 1-2015 1-2017 1-2019
$50,000
$75,000
$100,000
$125,000
$150,000
$175,000
$200,000
Current as of March 2, 2020. All data from Realcomp II Ltd. Report © 2020 ShowingTime.
Local Market Update – February 2020A Research Tool Provided by Realcomp
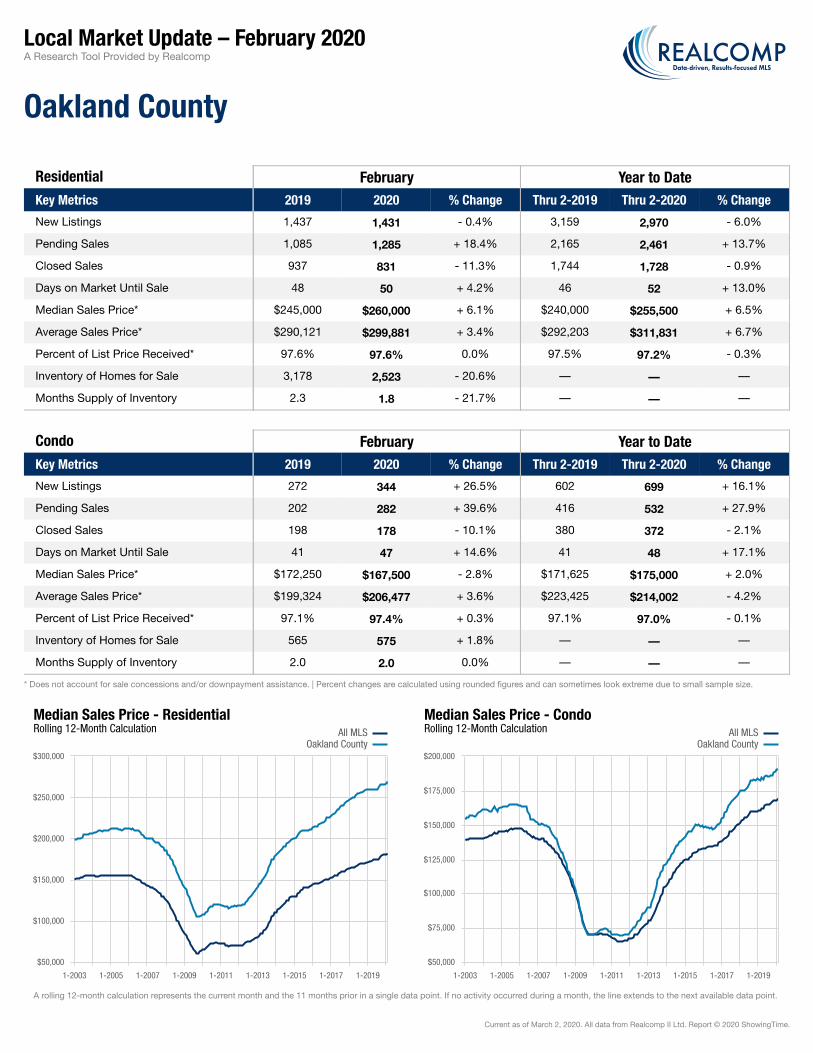
Oakland County
Residential February Year to DateKey Metrics 2019 2020 % Change Thru 2-2019 Thru 2-2020 % Change
New Listings 1,437 1,431 - 0.4% 3,159 2,970 - 6.0%
Pending Sales 1,085 1,285 + 18.4% 2,165 2,461 + 13.7%
Closed Sales 937 831 - 11.3% 1,744 1,728 - 0.9%
Days on Market Until Sale 48 50 + 4.2% 46 52 + 13.0%
Median Sales Price* $245,000 $260,000 + 6.1% $240,000 $255,500 + 6.5%
Average Sales Price* $290,121 $299,881 + 3.4% $292,203 $311,831 + 6.7%
Percent of List Price Received* 97.6% 97.6% 0.0% 97.5% 97.2% - 0.3%
Inventory of Homes for Sale 3,178 2,523 - 20.6% –– –– ––
Months Supply of Inventory 2.3 1.8 - 21.7% –– –– ––
Condo February Year to DateKey Metrics 2019 2020 % Change Thru 2-2019 Thru 2-2020 % Change
New Listings 272 344 + 26.5% 602 699 + 16.1%
Pending Sales 202 282 + 39.6% 416 532 + 27.9%
Closed Sales 198 178 - 10.1% 380 372 - 2.1%
Days on Market Until Sale 41 47 + 14.6% 41 48 + 17.1%
Median Sales Price* $172,250 $167,500 - 2.8% $171,625 $175,000 + 2.0%
Average Sales Price* $199,324 $206,477 + 3.6% $223,425 $214,002 - 4.2%
Percent of List Price Received* 97.1% 97.4% + 0.3% 97.1% 97.0% - 0.1%
Inventory of Homes for Sale 565 575 + 1.8% –– –– ––
Months Supply of Inventory 2.0 2.0 0.0% –– –– ––
* Does not account for sale concessions and/or downpayment assistance. | Percent changes are calculated using rounded figures and can sometimes look extreme due to small sample size.
A rolling 12-month calculation represents the current month and the 11 months prior in a single data point. If no activity occurred during a month, the line extends to the next available data point.
Median Sales Price - ResidentialRolling 12-Month Calculation All MLS
Oakland County
1-2003 1-2005 1-2007 1-2009 1-2011 1-2013 1-2015 1-2017 1-2019
$50,000
$100,000
$150,000
$200,000
$250,000
$300,000
Median Sales Price - CondoRolling 12-Month Calculation All MLS
Oakland County
1-2003 1-2005 1-2007 1-2009 1-2011 1-2013 1-2015 1-2017 1-2019
$50,000
$75,000
$100,000
$125,000
$150,000
$175,000
$200,000
Current as of March 2, 2020. All data from Realcomp II Ltd. Report © 2020 ShowingTime.

Local Market Update – February 2020A Research Tool Provided by Realcomp
Sanilac County
Residential February Year to DateKey Metrics 2019 2020 % Change Thru 2-2019 Thru 2-2020 % Change
New Listings 33 43 + 30.3% 66 76 + 15.2%
Pending Sales 25 24 - 4.0% 42 63 + 50.0%
Closed Sales 26 25 - 3.8% 42 41 - 2.4%
Days on Market Until Sale 91 120 + 31.9% 110 109 - 0.9%
Median Sales Price* $87,500 $99,000 + 13.1% $125,000 $99,000 - 20.8%
Average Sales Price* $125,087 $143,038 + 14.4% $152,461 $152,702 + 0.2%
Percent of List Price Received* 94.5% 93.3% - 1.3% 93.2% 92.8% - 0.4%
Inventory of Homes for Sale 164 142 - 13.4% –– –– ––
Months Supply of Inventory 4.9 4.6 - 6.1% –– –– ––
Condo February Year to DateKey Metrics 2019 2020 % Change Thru 2-2019 Thru 2-2020 % Change
New Listings 0 0 0.0% 1 1 0.0%
Pending Sales 0 0 0.0% 1 0 - 100.0%
Closed Sales 1 0 - 100.0% 2 0 - 100.0%
Days on Market Until Sale 57 –– –– 54 –– ––
Median Sales Price* $151,250 –– –– $130,625 –– ––
Average Sales Price* $151,250 –– –– $130,625 –– ––
Percent of List Price Received* 94.6% –– –– 89.6% –– ––
Inventory of Homes for Sale 1 2 + 100.0% –– –– ––
Months Supply of Inventory 0.5 2.0 + 300.0% –– –– ––
* Does not account for sale concessions and/or downpayment assistance. | Percent changes are calculated using rounded figures and can sometimes look extreme due to small sample size.
A rolling 12-month calculation represents the current month and the 11 months prior in a single data point. If no activity occurred during a month, the line extends to the next available data point.
Median Sales Price - ResidentialRolling 12-Month Calculation All MLS
Sanilac County
1-2003 1-2005 1-2007 1-2009 1-2011 1-2013 1-2015 1-2017 1-2019
$25,000
$50,000
$75,000
$100,000
$125,000
$150,000
$175,000
$200,000
Median Sales Price - CondoRolling 12-Month Calculation All MLS
Sanilac County
1-2003 1-2005 1-2007 1-2009 1-2011 1-2013 1-2015 1-2017 1-2019
$0
$50,000
$100,000
$150,000
$200,000
$250,000
Current as of March 2, 2020. All data from Realcomp II Ltd. Report © 2020 ShowingTime.

Local Market Update – February 2020A Research Tool Provided by Realcomp
St. Clair County
Residential February Year to DateKey Metrics 2019 2020 % Change Thru 2-2019 Thru 2-2020 % Change
New Listings 156 179 + 14.7% 342 354 + 3.5%
Pending Sales 139 154 + 10.8% 283 301 + 6.4%
Closed Sales 143 109 - 23.8% 231 229 - 0.9%
Days on Market Until Sale 59 59 0.0% 55 58 + 5.5%
Median Sales Price* $149,950 $155,000 + 3.4% $149,450 $159,900 + 7.0%
Average Sales Price* $158,282 $171,448 + 8.3% $159,802 $171,595 + 7.4%
Percent of List Price Received* 96.5% 96.9% + 0.4% 96.2% 96.1% - 0.1%
Inventory of Homes for Sale 478 448 - 6.3% –– –– ––
Months Supply of Inventory 2.6 2.6 0.0% –– –– ––
Condo February Year to DateKey Metrics 2019 2020 % Change Thru 2-2019 Thru 2-2020 % Change
New Listings 11 10 - 9.1% 21 22 + 4.8%
Pending Sales 9 9 0.0% 18 11 - 38.9%
Closed Sales 12 1 - 91.7% 15 13 - 13.3%
Days on Market Until Sale 52 75 + 44.2% 45 94 + 108.9%
Median Sales Price* $146,500 $187,500 + 28.0% $155,000 $114,000 - 26.5%
Average Sales Price* $163,825 $187,500 + 14.5% $162,533 $170,838 + 5.1%
Percent of List Price Received* 97.6% 91.5% - 6.3% 98.2% 95.6% - 2.6%
Inventory of Homes for Sale 21 30 + 42.9% –– –– ––
Months Supply of Inventory 2.0 2.8 + 40.0% –– –– ––
* Does not account for sale concessions and/or downpayment assistance. | Percent changes are calculated using rounded figures and can sometimes look extreme due to small sample size.
A rolling 12-month calculation represents the current month and the 11 months prior in a single data point. If no activity occurred during a month, the line extends to the next available data point.
Median Sales Price - ResidentialRolling 12-Month Calculation All MLS
St. Clair County
1-2003 1-2005 1-2007 1-2009 1-2011 1-2013 1-2015 1-2017 1-2019
$50,000
$75,000
$100,000
$125,000
$150,000
$175,000
$200,000
Median Sales Price - CondoRolling 12-Month Calculation All MLS
St. Clair County
1-2003 1-2005 1-2007 1-2009 1-2011 1-2013 1-2015 1-2017 1-2019
$40,000
$60,000
$80,000
$100,000
$120,000
$140,000
$160,000
$180,000
Current as of March 2, 2020. All data from Realcomp II Ltd. Report © 2020 ShowingTime.

Local Market Update – February 2020A Research Tool Provided by Realcomp
Tuscola County
Residential February Year to DateKey Metrics 2019 2020 % Change Thru 2-2019 Thru 2-2020 % Change
New Listings 14 20 + 42.9% 42 39 - 7.1%
Pending Sales 24 41 + 70.8% 51 65 + 27.5%
Closed Sales 29 19 - 34.5% 46 38 - 17.4%
Days on Market Until Sale 96 74 - 22.9% 88 65 - 26.1%
Median Sales Price* $90,000 $138,000 + 53.3% $87,451 $126,450 + 44.6%
Average Sales Price* $92,555 $154,489 + 66.9% $99,873 $132,516 + 32.7%
Percent of List Price Received* 97.4% 97.6% + 0.2% 96.5% 97.4% + 0.9%
Inventory of Homes for Sale 84 65 - 22.6% –– –– ––
Months Supply of Inventory 2.7 1.9 - 29.6% –– –– ––
Condo February Year to DateKey Metrics 2019 2020 % Change Thru 2-2019 Thru 2-2020 % Change
New Listings 0 0 0.0% 0 1 ––
Pending Sales 0 1 –– 1 1 0.0%
Closed Sales 0 0 0.0% 1 0 - 100.0%
Days on Market Until Sale –– –– –– 136 –– ––
Median Sales Price* –– –– –– $135,000 –– ––
Average Sales Price* –– –– –– $135,000 –– ––
Percent of List Price Received* –– –– –– 96.5% –– ––
Inventory of Homes for Sale 0 0 0.0% –– –– ––
Months Supply of Inventory –– –– –– –– –– ––
* Does not account for sale concessions and/or downpayment assistance. | Percent changes are calculated using rounded figures and can sometimes look extreme due to small sample size.
A rolling 12-month calculation represents the current month and the 11 months prior in a single data point. If no activity occurred during a month, the line extends to the next available data point.
Median Sales Price - ResidentialRolling 12-Month Calculation All MLS
Tuscola County
1-2003 1-2005 1-2007 1-2009 1-2011 1-2013 1-2015 1-2017 1-2019
$25,000
$50,000
$75,000
$100,000
$125,000
$150,000
$175,000
$200,000
Median Sales Price - CondoRolling 12-Month Calculation All MLS
Tuscola County
1-2003 1-2005 1-2007 1-2009 1-2011 1-2013 1-2015 1-2017 1-2019
$40,000
$60,000
$80,000
$100,000
$120,000
$140,000
$160,000
$180,000
Current as of March 2, 2020. All data from Realcomp II Ltd. Report © 2020 ShowingTime.
Local Market Update – February 2020A Research Tool Provided by Realcomp
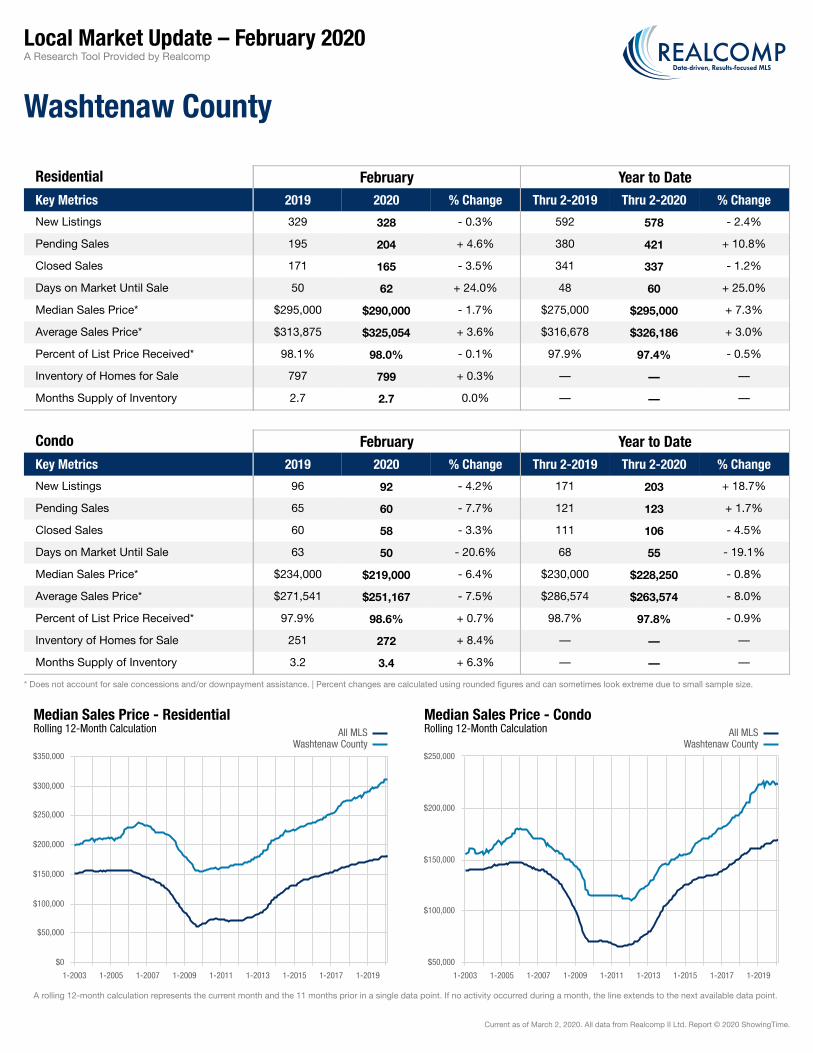
Washtenaw County
Residential February Year to DateKey Metrics 2019 2020 % Change Thru 2-2019 Thru 2-2020 % Change
New Listings 329 328 - 0.3% 592 578 - 2.4%
Pending Sales 195 204 + 4.6% 380 421 + 10.8%
Closed Sales 171 165 - 3.5% 341 337 - 1.2%
Days on Market Until Sale 50 62 + 24.0% 48 60 + 25.0%
Median Sales Price* $295,000 $290,000 - 1.7% $275,000 $295,000 + 7.3%
Average Sales Price* $313,875 $325,054 + 3.6% $316,678 $326,186 + 3.0%
Percent of List Price Received* 98.1% 98.0% - 0.1% 97.9% 97.4% - 0.5%
Inventory of Homes for Sale 797 799 + 0.3% –– –– ––
Months Supply of Inventory 2.7 2.7 0.0% –– –– ––
Condo February Year to DateKey Metrics 2019 2020 % Change Thru 2-2019 Thru 2-2020 % Change
New Listings 96 92 - 4.2% 171 203 + 18.7%
Pending Sales 65 60 - 7.7% 121 123 + 1.7%
Closed Sales 60 58 - 3.3% 111 106 - 4.5%
Days on Market Until Sale 63 50 - 20.6% 68 55 - 19.1%
Median Sales Price* $234,000 $219,000 - 6.4% $230,000 $228,250 - 0.8%
Average Sales Price* $271,541 $251,167 - 7.5% $286,574 $263,574 - 8.0%
Percent of List Price Received* 97.9% 98.6% + 0.7% 98.7% 97.8% - 0.9%
Inventory of Homes for Sale 251 272 + 8.4% –– –– ––
Months Supply of Inventory 3.2 3.4 + 6.3% –– –– ––
* Does not account for sale concessions and/or downpayment assistance. | Percent changes are calculated using rounded figures and can sometimes look extreme due to small sample size.
A rolling 12-month calculation represents the current month and the 11 months prior in a single data point. If no activity occurred during a month, the line extends to the next available data point.
Median Sales Price - ResidentialRolling 12-Month Calculation All MLS
Washtenaw County
1-2003 1-2005 1-2007 1-2009 1-2011 1-2013 1-2015 1-2017 1-2019
$0
$50,000
$100,000
$150,000
$200,000
$250,000
$300,000
$350,000
Median Sales Price - CondoRolling 12-Month Calculation All MLS
Washtenaw County
1-2003 1-2005 1-2007 1-2009 1-2011 1-2013 1-2015 1-2017 1-2019
$50,000
$100,000
$150,000
$200,000
$250,000
Current as of March 2, 2020. All data from Realcomp II Ltd. Report © 2020 ShowingTime.

Local Market Update – February 2020A Research Tool Provided by Realcomp
Wayne County
Residential February Year to DateKey Metrics 2019 2020 % Change Thru 2-2019 Thru 2-2020 % Change
New Listings 1,814 1,875 + 3.4% 3,733 3,835 + 2.7%
Pending Sales 1,244 1,651 + 32.7% 2,531 3,017 + 19.2%
Closed Sales 1,111 991 - 10.8% 2,230 2,088 - 6.4%
Days on Market Until Sale 47 47 0.0% 46 47 + 2.2%
Median Sales Price* $125,000 $130,000 + 4.0% $121,750 $129,900 + 6.7%
Average Sales Price* $156,889 $162,676 + 3.7% $150,771 $160,296 + 6.3%
Percent of List Price Received* 95.7% 95.1% - 0.6% 95.7% 95.4% - 0.3%
Inventory of Homes for Sale 4,395 3,818 - 13.1% –– –– ––
Months Supply of Inventory 2.9 2.4 - 17.2% –– –– ––
Condo February Year to DateKey Metrics 2019 2020 % Change Thru 2-2019 Thru 2-2020 % Change
New Listings 218 240 + 10.1% 435 488 + 12.2%
Pending Sales 154 202 + 31.2% 303 380 + 25.4%
Closed Sales 127 139 + 9.4% 251 263 + 4.8%
Days on Market Until Sale 39 54 + 38.5% 37 48 + 29.7%
Median Sales Price* $140,000 $159,500 + 13.9% $145,500 $145,000 - 0.3%
Average Sales Price* $184,572 $200,290 + 8.5% $179,477 $180,078 + 0.3%
Percent of List Price Received* 97.4% 96.4% - 1.0% 97.0% 96.6% - 0.4%
Inventory of Homes for Sale 493 539 + 9.3% –– –– ––
Months Supply of Inventory 2.6 2.8 + 7.7% –– –– ––
* Does not account for sale concessions and/or downpayment assistance. | Percent changes are calculated using rounded figures and can sometimes look extreme due to small sample size.
A rolling 12-month calculation represents the current month and the 11 months prior in a single data point. If no activity occurred during a month, the line extends to the next available data point.
Median Sales Price - ResidentialRolling 12-Month Calculation All MLS
Wayne County
1-2003 1-2005 1-2007 1-2009 1-2011 1-2013 1-2015 1-2017 1-2019
$0
$50,000
$100,000
$150,000
$200,000
Median Sales Price - CondoRolling 12-Month Calculation All MLS
Wayne County
1-2003 1-2005 1-2007 1-2009 1-2011 1-2013 1-2015 1-2017 1-2019
$40,000
$60,000
$80,000
$100,000
$120,000
$140,000
$160,000
$180,000
Current as of March 2, 2020. All data from Realcomp II Ltd. Report © 2020 ShowingTime.