singapore telecommunications limited and subsidiary companies · pdf filesingapore...
TRANSCRIPT
Singapore Telecommunications Limited
And Subsidiary Companies
MANAGEMENT DISCUSSION AND ANALYSIS OF FINANCIAL CONDITION, RESULTS OF OPERATIONS
AND CASH FLOWS FOR THE FOURTH QUARTER AND YEAR
ENDED 31 MARCH 2017
The financial statements of the Group are prepared in accordance with Singapore Financial Reporting Standards, which are the same, in material respects, to International Financial Reporting Standards. The financial statements for the year ended, and as at, 31 March 2017 are audited. Numbers in all tables may not exactly add due to rounding. For all pages, "@" denotes more than +/- 500%, "*" denotes less than +/- S$0.5 million or A$0.5 million and “**” denotes less than +/- 0.05%, unless otherwise indicated. For all tables, a negative sign for year-on-year change denotes a decrease in operating revenue, expense, gain or loss.

Singapore Telecommunications Ltd And Subsidiary Companies Table Of Contents Section 1 : Group Pg
Financial Highlights………………….…………………………………………………………………1 Group Summary Income Statements……...…………………………………………………………3 Business Segments……………………………………………………………………………………4 Final Dividend……..…………………………………………..………………..….………..…………5 Review of Group Operating Performance………………………………………………………… 5 Sequential Quarterly Results…………………………………………………………………………8 Outlook For The Financial Year Ending 31 March 2018……………………………………………9 Operating Revenue……………………………………………………………………………………11 Operating Expenses……………………………………………………………………………………13 Staff Costs……………………………………………………………………………………………. 14 Net Finance Expense…………………………………………………………………………………15 Exceptional Items………………………………………………………………………………………16 Tax Expense……………………………………………………………………………………………17 Summary Statements Of Financial Position…………………………………………………………18 Liquidity And Gearing………………………………………………………………………………… 19 Cash Flow And Capital Expenditure…………………………………………………………………20 Other Information…………………………………………………………………………………….. 21
Section 2 : Group Consumer
Financial Highlights……………………………………………………………………………………22 Group Consumer Summary Income Statements…..………………………………………………23 Operating Highlights…….……….…………………………………………………………………. 24 Singapore Consumer Summary Income Statements………...……………………………………25 Australia Consumer Summary Income Statements….………..……………………………………28
Section 3 : Group Enterprise
Financial Highlights……………………………………………………………………………………32 Group Enterprise Summary Income Statements…..………………………………………………33 Operating Highlights……..………...……………………………………………………………… 34 Singapore Enterprise………..…………………………………………………………………………36 Australia Enterprise………….…………………………………………………………………………37
Section 4 : Group Digital Life
Financial Highlights……………………………………………………………………………………38 Group Digital Life Summary Income Statements…………...………………………………………39 Operating Highlights………..…..…………………………………………………………………. 40

Singapore Telecommunications Ltd And Subsidiary Companies Table Of Contents (continued) Section 5 : Associates/ Joint Ventures Pg
Financial Highlights…………………………………………………………………………………42 Share Of Results Of Associates/ Joint Ventures………………………………………………43 Group's Proforma Information………………………………………………………………………52 Cash Dividends/ Distributions Received From Associates/ Joint Ventures…………………55 Key Operational Data………………………………………………………………………………56
Section 6 : Product Information
Singapore Mobile (Product View)…………………..…………………………………………… 57 Australia Mobile (Product View)………………………………………………………………… 58 Singtel TV (Product View)…………………………………………………………………………59 Singapore Consumer Home………………………………………………………………………59 Other Products………………………………………………………………………………………60
Section 7 : Glossary………………………………………………………………………………62
Appendix 1 : Group Summary Income StatementsAppendix 2 : Group Statements Of Financial PositionAppendix 3 : Cash Flow Statements of Singapore And OptusAppendix 4 : Optus Financials In Australian DollarsAppendix 5 : Currency Risk Management & Other Matters

Singapore Telecommunications Ltd And Subsidiary Companies Page 1 SECTION 1 : GROUP
FINANCIAL HIGHLIGHTS
FOR THE FOURTH QUARTER ENDED 31 MARCH 2017
Operating revenue grew 5.2% and would have grown 2.1% in constant currency terms1 on higher Data and Internet, Equipment sales and ICT services.
EBITDA rose 3.7%. It would have been stable in constant currency terms1.
Weaker results at Airtel India on aggressive price competition resulted in stable associates’ net profit contributions2 and underlying net profit. Excluding Airtel, the associates’ net profit contributions2 rose 12% and underlying net profit increased 7.0%.
With lower exceptional losses, net profit grew 1.8%. Excluding Airtel, net profit was up 9.1%.
Free cash flow up 12% to S$764 million due mainly to timing difference in Tekomsel’s dividend payment partially offset by higher capital expenditure.
FINANCIAL HIGHLIGHTS
FOR THE YEAR ENDED 31 MARCH 2017
Operating revenue fell 1.5% impacted by the decline in mobile termination rates3 (“rates change”) in Australia. Excluding the rates change3, operating revenue would have increased 2.0%.
EBITDA was stable.
The associates’ net profit contributions2 grew 8.4%, and underlying net profit was up 2.9%. Excluding Airtel, the associates’ net profit
contributions2 rose 13% and underlying net profit grew 4.5%.
Net profit was stable, with exceptional losses compared to exceptional gains last year. Excluding Airtel, net profit was up 2.3%.
Free cash flow increased by 18% to S$3.20 billion4 on working capital movements and higher dividends from associates partly offset by higher capital expenditure.
1 Assuming constant exchange rates for the Australian Dollar, United States Dollar and/or regional currencies
(Indian Rupee, Indonesian Rupiah, Philippine Peso and Thai Baht) from the corresponding period/year ended 31 March 2016.
2 Exclude certain exceptional items of Airtel, AIS and SingPost classified under exceptional items of Singtel Group.
3 Effective from 1 January 2016, mobile termination rates in Australia declined and reduced the Group’s operating revenue by S$583 million (A$566 million) for FY 2017, with minimal impact on profitability.
4 Before S$142 million (A$134 million) paid to the Australian Taxation Office (“ATO”) for amended assessments in December 2016 quarter.
Singapore Telecommunications Ltd And Subsidiary Companies Page 2 SECTION 1 : GROUP
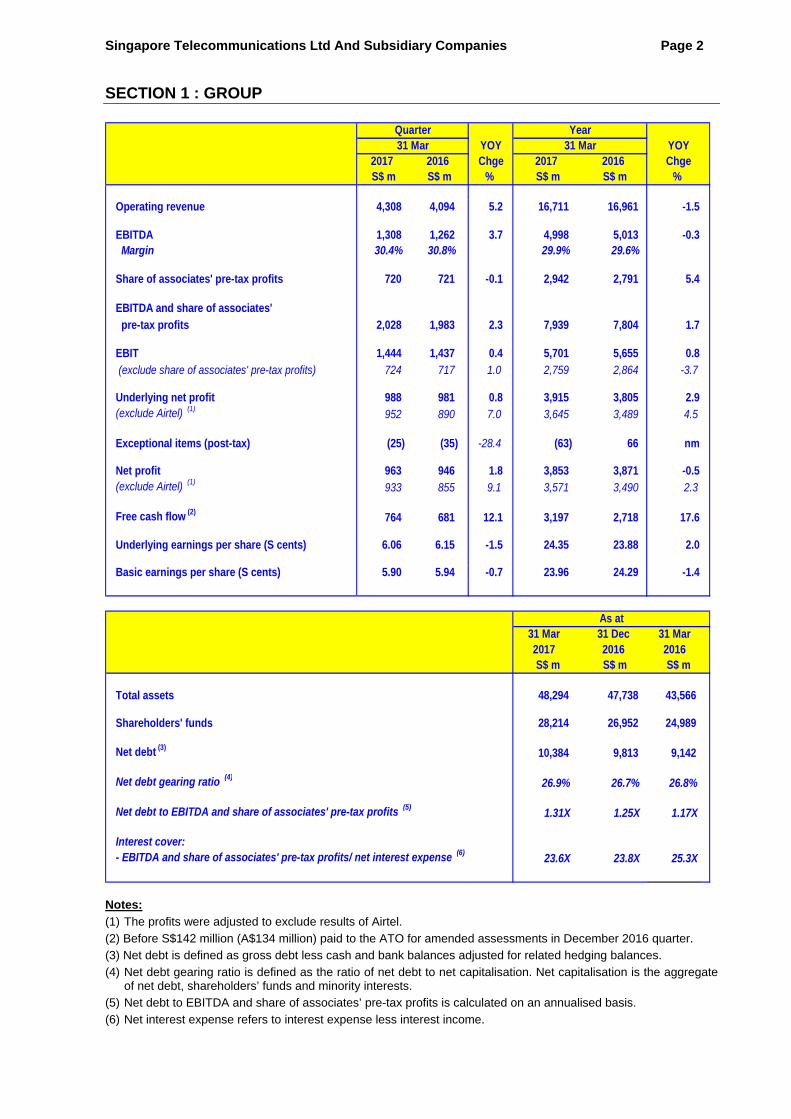
Operating revenue 4,308 4,094 5.2 16,711 16,961 -1.5
EBITDA 1,308 1,262 3.7 4,998 5,013 -0.3 Margin 30.4% 30.8% 29.9% 29.6%
Share of associates' pre-tax profits 720 721 -0.1 2,942 2,791 5.4
EBITDA and share of associates'
pre-tax profits 2,028 1,983 2.3 7,939 7,804 1.7
EBIT 1,444 1,437 0.4 5,701 5,655 0.8
(exclude share of associates' pre-tax profits) 724 717 1.0 2,759 2,864 -3.7
Underlying net profit 988 981 0.8 3,915 3,805 2.9(exclude Airtel) (1)
952 890 7.0 3,645 3,489 4.5
Exceptional items (post-tax) (25) (35) -28.4 (63) 66 nm
Net profit 963 946 1.8 3,853 3,871 -0.5(exclude Airtel) (1)
933 855 9.1 3,571 3,490 2.3
Free cash flow (2)764 681 12.1 3,197 2,718 17.6
Underlying earnings per share (S cents) 6.06 6.15 -1.5 24.35 23.88 2.0 Basic earnings per share (S cents) 5.90 5.94 -0.7 23.96 24.29 -1.4
31 Mar 31 Dec 31 Mar2017 2016 2016
Total assets 48,294 47,738 43,566
Shareholders' funds 28,214 26,952 24,989
Net debt (3)10,384 9,813 9,142
Net debt gearing ratio (4)26.9% 26.7% 26.8%
Net debt to EBITDA and share of associates' pre-tax profits (5)1.31X 1.25X 1.17X
Interest cover: - EBITDA and share of associates' pre-tax profits/ net interest expense (6)
23.6X 23.8X 25.3X
YOY31 Mar31 Mar
% Chge
S$ m S$ m S$ mChge
Quarter YearYOY
2017 2016 2017
As at
2016S$ m
S$ m S$ mS$ m
%
Notes:
(1) The profits were adjusted to exclude results of Airtel.
(2) Before S$142 million (A$134 million) paid to the ATO for amended assessments in December 2016 quarter.
(3) Net debt is defined as gross debt less cash and bank balances adjusted for related hedging balances.
(4) Net debt gearing ratio is defined as the ratio of net debt to net capitalisation. Net capitalisation is the aggregate of net debt, shareholders’ funds and minority interests.
(5) Net debt to EBITDA and share of associates’ pre-tax profits is calculated on an annualised basis.
(6) Net interest expense refers to interest expense less interest income.

Singapore Telecommunications Ltd And Subsidiary Companies Page 3 SECTION 1 : GROUP GROUP SUMMARY INCOME STATEMENTS For The Fourth Quarter And Year Ended 31 March 2017
Operating revenue 4,308 4,094 5.2 16,711 16,961 -1.5Operating expenses (3,061) (2,865) 6.8 (11,929) (12,097) -1.4
1,247 1,229 1.5 4,782 4,864 -1.7
Other income 61 33 87.7 215 148 45.2
EBITDA 1,308 1,262 3.7 4,998 5,013 -0.3- EBITDA margin 30.4% 30.8% 29.9% 29.6%
Share of associates' pre-tax profits 720 721 -0.1 2,942 2,791 5.4
EBITDA and share of associates' pre-tax profits 2,028 1,983 2.3 7,939 7,804 1.7
Depreciation (513) (476) 7.9 (1,960) (1,892) 3.6Amortisation of intangibles (72) (70) 2.9 (279) (257) 8.7
(585) (545) 7.2 (2,239) (2,149) 4.2
1,444 1,437 0.4 5,701 5,655 0.8
Net finance expense
- net interest expense (89) (85) 4.7 (337) (309) 9.0 - other finance income/ (loss) 7 (7) nm 77 44 75.5
(82) (91) -10.0 (260) (265) -2.0
Profit before exceptional items and tax 1,362 1,346 1.2 5,441 5,390 0.9
Taxation (381) (371) 2.8 (1,548) (1,597) -3.1
Profit after tax 981 975 0.5 3,894 3,793 2.7
Minority interests 8 6 37.5 22 13 73.6
Underlying net profit 988 981 0.8 3,915 3,805 2.9
(25) (35) -28.4 (63) 66 nm
Net profit 963 946 1.8 3,853 3,871 -0.5
Depreciation as % of revenue 12% 12% 12% 11%
EBIT
Exceptional items (post-tax)
S$ m S$ m % S$ m S$ m %2017 2016 Chge 2017 2016 Chge
YOYQuarter Year31 Mar YOY 31 Mar
Unless otherwise stated, the presentation of income statements in this document is consistent with prior periods. For income statements presented in accordance with FRS 1, Presentation of Financial Statements, please refer to “SGX Appendix 7.2 Announcement”.

Singapore Telecommunications Ltd And Subsidiary Companies Page 4 SECTION 1 : GROUP BUSINESS SEGMENTS The Group is organised by three business segments, Group Consumer, Group Enterprise and Group Digital Life, to better serve the evolving needs of its customers and to capture growth opportunities globally.
Group Consumer comprises the consumer businesses across Singapore and Australia, as
well as the Group’s investments, mainly, AIS and Intouch in Thailand, Airtel in India, Africa and Sri Lanka, Globe in the Philippines, and Telkomsel in Indonesia. It focuses on driving greater value and performance from the core carriage business including mobile, pay TV, fixed broadband and voice, as well as equipment sales.
Group Enterprise comprises the business groups across Singapore, Australia, United States of America, Europe and the region, and focuses on growing the Group’s position in the enterprise markets. Key services include mobile, equipment sales, fixed voice and data, managed services, cloud computing, cyber security, IT and professional consulting.
Group Digital Life (“GDL”) focuses on using the latest Internet technologies and assets of the Group operating companies to develop new revenue and growth engines by entering adjacent businesses where it has a competitive advantage. It focuses on three key businesses in digital life – digital marketing (Amobee), regional premium OTT video (HOOQ) and advanced analytics and intelligence capabilities (DataSpark), in addition to strengthening its role as Singtel’s digital innovation engine through Innov8.
Corporate comprises the costs of Group functions not allocated to the business segments. The following table shows the operating performance of the three business segments:
Operating revenue
Group Consumer 2,457 2,295 7.1 9,572 10,110 -5.3
Group Enterprise 1,723 1,679 2.6 6,600 6,397 3.2
Core Business 4,181 3,974 5.2 16,172 16,507 -2.0Group Digital Life 127 120 5.8 539 454 18.7
Group 4,308 4,094 5.2 16,711 16,961 -1.5
EBITDA
Group Consumer 908 846 7.4 3,295 3,266 0.9Group Enterprise 466 475 -1.9 1,913 1,959 -2.3
Core Business 1,374 1,321 4.0 5,208 5,225 -0.3Group Digital Life (36) (39) -7.5 (122) (137) -10.6Corporate (30) (20) 47.0 (88) (76) 16.8
Group 1,308 1,262 3.7 4,998 5,013 -0.3
Group Consumer 513 481 6.5 1,771 1,811 -2.2Group Enterprise 294 313 -5.9 1,268 1,337 -5.1
Core Business 807 794 1.7 3,039 3,148 -3.5Group Digital Life (53) (57) -6.7 (190) (206) -7.4Corporate (30) (21) 47.3 (90) (79) 14.2
Group 724 717 1.0 2,759 2,864 -3.7
Quarter31 Mar YOY
Chge%S$ m S$ m
20162017S$ m S$ m %
EBIT (exclude share of associates' pre-tax profits)
Year31 Mar YOY
2017 2016 Chge

Singapore Telecommunications Ltd And Subsidiary Companies Page 5 SECTION 1 : GROUP FINAL DIVIDEND The Directors have proposed a final ordinary dividend of 10.7 cents per share (FY2016: 10.7 cents per share), totalling approximately S$1.75 billion in respect of the current financial year ended 31 March 2017. Together with the interim dividend of 6.8 cents per share amounting to S$1.11 billion paid in the quarter, the total amount of ordinary dividends in respect of the current financial year ended 31 March 2017 would be 17.5 cents per share (FY2016: 17.5 cents per share), totalling approximately S$2.86 billion. This represented a payout ratio of 73% of underlying net profit. REVIEW OF GROUP OPERATING PERFORMANCE For The Fourth Quarter Ended 31 March 2017 Intense competition with sustained aggressive pricing by the new market entrant in India had significantly impacted Airtel’s and the Group’s results. Consequently, underlying net profit was stable in the quarter. Excluding Airtel, however, underlying net profit grew a robust 7.0% underpinned by strong performances from consumer businesses in Singapore and Australia, as well as higher contribution from Telkomsel. In constant currency terms, underlying net profit was down 1.4% and excluding Airtel, underlying net profit was up 4.8%. Operating revenue grew 5.2% on higher Data and Internet, Equipment sales and ICT services. EBITDA rose 3.7% on revenue growth and strong cost management, offsetting investments in content, ICT capabilities and network expansion. In constant currency terms, operating revenue grew 2.1% and EBITDA was stable. Group Consumer contributed 57% (Q4 FY2016: 56%) and 69% (Q4 FY2016: 67%) to the Group’s operating revenue and EBITDA respectively. EBITDA grew 7.4% on increase of 7.1% in operating revenue. In constant currency terms, operating revenue and EBITDA rose 2.5% and 2.6% respectively. Singapore Consumer reported growth in EBITDA and EBIT of 4.9% and 9.4% respectively amid a highly competitive market. Operating revenue was stable as higher Equipment sales and Consumer Home Services were offset by lower voice services. Mobile Communications revenue was flat as strong data growth in both prepaid and postpaid was offset by declines in local and roaming voice. Other income increased significantly on various one-off gains and lower foreign exchange losses. In Australia, operating revenue grew 3.1% driven by higher NBN revenue and Equipment sales, partly offset by increased mobile service credits from device repayment plans. EBITDA was up 2.2% on higher revenue and miscellaneous income offsetting increased content costs. Group Enterprise contributed 40% (Q4 FY2016: 41%) and 36% (Q4 FY2016: 38%) to the Group’s operating revenue and EBITDA respectively. In Singapore Enterprise, operating revenue grew 3.0% on higher ICT revenue while EBITDA was stable with investments in cyber security and ICT capabilities. Optus Business reported declines in operating revenue and EBITDA of 4.3% and 14% respectively due to continued intense price competition in Australia as well as increased doubtful debts. Consequently, Group Enterprise’s operating revenue increased 2.6% while EBITDA declined 1.9%.

Singapore Telecommunications Ltd And Subsidiary Companies Page 6 SECTION 1 : GROUP GDL contributed 3% (Q4 FY2016: 3%) to the Group’s operating revenue. Operating revenue grew 5.8% driven by Amobee’s social, video and display businesses. Excluding revenue from Amobee’s low-margin publisher business which ceased operations in the preceding quarter, operating revenue grew 16%. Negative EBITDA fell 7.5% mainly due to lower losses at Amobee offset by higher investments in content and marketing spend as HOOQ ramped up its businesses. The acquisition of Turn in April 2017 has enhanced Amobee’s scale as an integrated player with comprehensive media, technology and analytics capabilities. Depreciation and amortisation charges rose 7.2% mainly on higher network investments and depreciation from DC West, a data centre commissioned in December 2016. EBIT (before share of results of associates) was stable at S$724 million. As at 31 March 2017, the combined mobile customer base of the Group and its regional associates was 638 million. Excluding Airtel which had posted steep decline in earnings, the net profit contributions from associates increased strongly by 12% mainly from Telkomsel, NetLink Trust and Intouch (acquired in November 2016) partly offset by declines at AIS and Globe. Net finance expense fell 10% due mainly to lower net fair value losses on interest rate swaps. Profit before exceptional items and tax grew 1.2%, while underlying net profit was stable with higher tax expense attributable mainly to recognition of withholding tax on Telkomsel’s interim dividend this quarter. The Group recorded net exceptional losses of S$25 million in the quarter, down from S$35 million in the last corresponding quarter. Net profit grew 1.8% after including the exceptional losses. In constant currency terms, net profit was stable. Free cash flow for the quarter increased 12% to S$764 million mainly due to timing difference in Telkomsel’s dividend payment partly offset by higher capital expenditure. The Group continued to maintain a healthy capital structure. As at 31 March 2017, net debt gearing ratio was 26.9%, stable from a quarter ago. The Group has successfully diversified its earnings base through its expansion and investments in overseas markets. Hence, the Group is exposed to currency movements. On a proportionate basis if the associates are consolidated line-by-line, operations outside Singapore accounted for three-quarters of both the Group’s proportionate revenue and EBITDA.
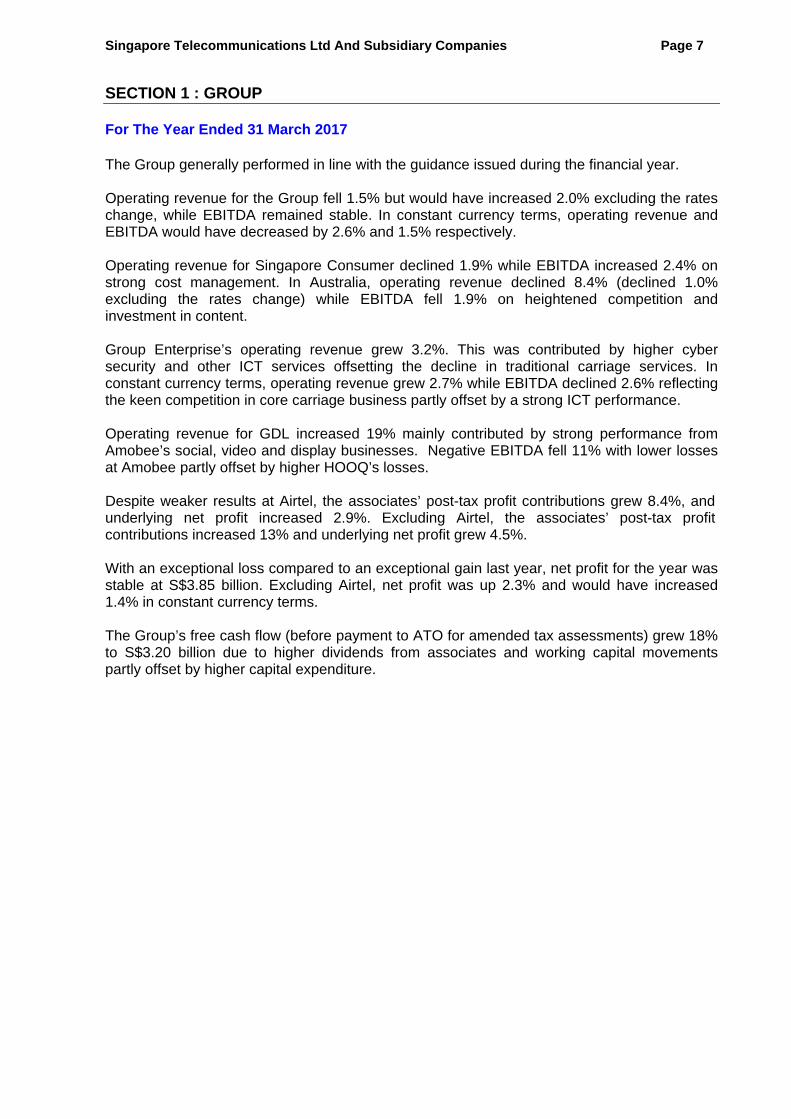
Singapore Telecommunications Ltd And Subsidiary Companies Page 7 SECTION 1 : GROUP For The Year Ended 31 March 2017 The Group generally performed in line with the guidance issued during the financial year. Operating revenue for the Group fell 1.5% but would have increased 2.0% excluding the rates change, while EBITDA remained stable. In constant currency terms, operating revenue and EBITDA would have decreased by 2.6% and 1.5% respectively. Operating revenue for Singapore Consumer declined 1.9% while EBITDA increased 2.4% on strong cost management. In Australia, operating revenue declined 8.4% (declined 1.0% excluding the rates change) while EBITDA fell 1.9% on heightened competition and investment in content. Group Enterprise’s operating revenue grew 3.2%. This was contributed by higher cyber security and other ICT services offsetting the decline in traditional carriage services. In constant currency terms, operating revenue grew 2.7% while EBITDA declined 2.6% reflecting the keen competition in core carriage business partly offset by a strong ICT performance. Operating revenue for GDL increased 19% mainly contributed by strong performance from Amobee’s social, video and display businesses. Negative EBITDA fell 11% with lower losses at Amobee partly offset by higher HOOQ’s losses. Despite weaker results at Airtel, the associates’ post-tax profit contributions grew 8.4%, and underlying net profit increased 2.9%. Excluding Airtel, the associates’ post-tax profit
contributions increased 13% and underlying net profit grew 4.5%. With an exceptional loss compared to an exceptional gain last year, net profit for the year was stable at S$3.85 billion. Excluding Airtel, net profit was up 2.3% and would have increased 1.4% in constant currency terms. The Group’s free cash flow (before payment to ATO for amended tax assessments) grew 18% to S$3.20 billion due to higher dividends from associates and working capital movements partly offset by higher capital expenditure.

Singapore Telecommunications Ltd And Subsidiary Companies Page 8 SECTION 1 : GROUP SEQUENTIAL QUARTERLY RESULTS Results for the current quarter compared to the preceding quarter ended 31 December 2016 were as follows:
31 Mar 31 Dec
2017 2016S$ m S$ m
Operating revenue 4,308 4,410 -2.3
EBITDA 1,308 1,221 7.2
- margin 30.4% 27.7%
Share of associates' pre-tax profits 720 718 0.3
EBIT 1,444 1,376 4.9
Underlying net profit 988 994 -0.6(excluding Airtel) 952 946 0.6
Exceptional items (post-tax) (25) (22) 15.7
Net profit 963 973 -1.0(excluding Airtel) 933 930 0.3
Free cash flow (1) 764 559 36.5
%
QuarterQOQChge
Note:
(1) Before S$142 million (A$134 million) paid to the ATO for amended assessments in December 2016 quarter. Compared to the preceding quarter, operating revenue declined reflecting seasonally lower Equipment sales and lower mobile service revenue in Australia. EBITDA, however, grew 7.2% from higher NBN revenue in Australia and lower selling costs. Underlying net profit was stable after including foreign exchange and fair value losses as compared to gains in the preceding quarter, as well as higher withholding taxes from associates’ dividends. The increase in free cash flow was mainly due to higher dividends received from associates, mainly from Telkomsel.

Singapore Telecommunications Ltd And Subsidiary Companies Page 9 SECTION 1 : GROUP OUTLOOK FOR THE FINANCIAL YEAR ENDING 31 MARCH 2018 Macro-economic environment and currency The guidance for FY2018 is based on the following economic growth projections, and average exchange rates for the financial year ended 31 March 2017:
GDP growth 5
2017
Singapore
1% to 3% Australia 2.5% to 3% United States 2% India 8% Indonesia 5% Philippines 7% Thailand 3% Airtel’s key countries in Africa
1% to 7%
Average exchange rates
FY 2017
Australian Dollar
AUD 1
SGD 1.0426 United States Dollar USD 1 SGD 1.3841 Indonesian Rupiah SGD 1 IDR 9,591 Indian Rupee SGD 1 INR 48.7 Thailand Baht SGD 1 THB 25.4 Philippine Peso
SGD 1 PHP 34.8
Strategic Focus Singtel aims to drive sustainable growth from its core business in Singapore and Australia by capturing the rising demand for data services and accelerating growth in ICT services, including cyber security, cloud computing and smart cities solutions. It continues to invest in networks, spectrum, technology and content to enhance customer experience and drive differentiation in the market. With its scale and operating experience, the Group is well-placed to compete and win. Group Digital Life will leverage global opportunities in digital marketing, data analytics and premium video services. Amobee is expected to grow strongly in video, mobile and social marketing, while HOOQ continues to enhance its content and distribution. Singtel has given an undertaking to IMDA to divest its stake in NetLink Trust to less than 25% ownership by 22 April 2018. Singtel does not have effective control over NetLink Trust and equity accounts for NetLink Trust in the Group’s results. For the financial year ended 31 March 2017, NetLink Trust contributed S$130 million (including S$57 million of amortised gain arising from deferred gain on disposal of assets and business) or 3% to the Group’s underlying net profit. NetLink Trust does not contribute materially to the Group’s earnings. The financial impact from divestment of NetLink Trust will be recorded as an exceptional item of the Group.
5 Singapore’s GDP is based on Ministry of Trade and Industry (February 2017). Australia’s GDP is based on
Reserve Bank of Australia (May 2017) and the rest are based on World Bank (January 2017). The GDP growth for Australia is based on fiscal year ending June 2018 and for United States is based on fiscal year ending March 2018.

Singapore Telecommunications Ltd And Subsidiary Companies Page 10 SECTION 1 : GROUP Group 6
Consolidated revenue for the Group is expected to grow by mid single digit and EBITDA to grow by low single digit. Capital expenditure is expected to approximate S$2.6 billion. This reflects the Group’s multi-year investments in unified billing and customer care systems which incorporate advanced analytics to drive better customer experience as well as continued strategic investments in mobile network and ICT. In Australia, Optus continues to expand its regional 4G coverage and deepen its network for seamless delivery of videos and other bandwidth-intensive content. Cash capital expenditure is expected to be around S$2.4 billion, with A$1.5 billion for Optus and S$0.8 billion for the rest of Singtel Group. Free cash flow, excluding spectrum payments and dividends from associates, is projected to be around S$1.8 billion. Spectrum payments in Singapore and Australia are expected to be approximately S$1.0 billion. Dividends from the regional associates are expected to be around S$1.4 billion, with first time inclusion of dividends from Intouch and expected lower payout from AIS. Key Business Units Core Business (comprising Group Consumer and Group Enterprise) In the Core Business, both operating revenue and EBITDA are expected to grow by low
single digit.
Mobile service revenue from Australia is projected to grow by low single digit. Mobile Communications revenue from Singapore is expected to decline by low single digit. Group ICT revenue (comprising Managed Services and Business Solutions) is projected to
increase by mid single digit. This includes cyber security revenue of S$550 million to S$650 million.
Group Digital Life 6 Amobee Group is expected to contribute S$1.2 billion to S$1.3 billion in operating
revenue 7 and targets breakeven in EBITDA.
Negative EBITDA from Group Digital Life is expected to reduce to approximately S$100 million.
6 Including contribution from Turn, Inc. from 1 April 2017 and excluding any other new acquisition.
7 Includes intragroup revenue.
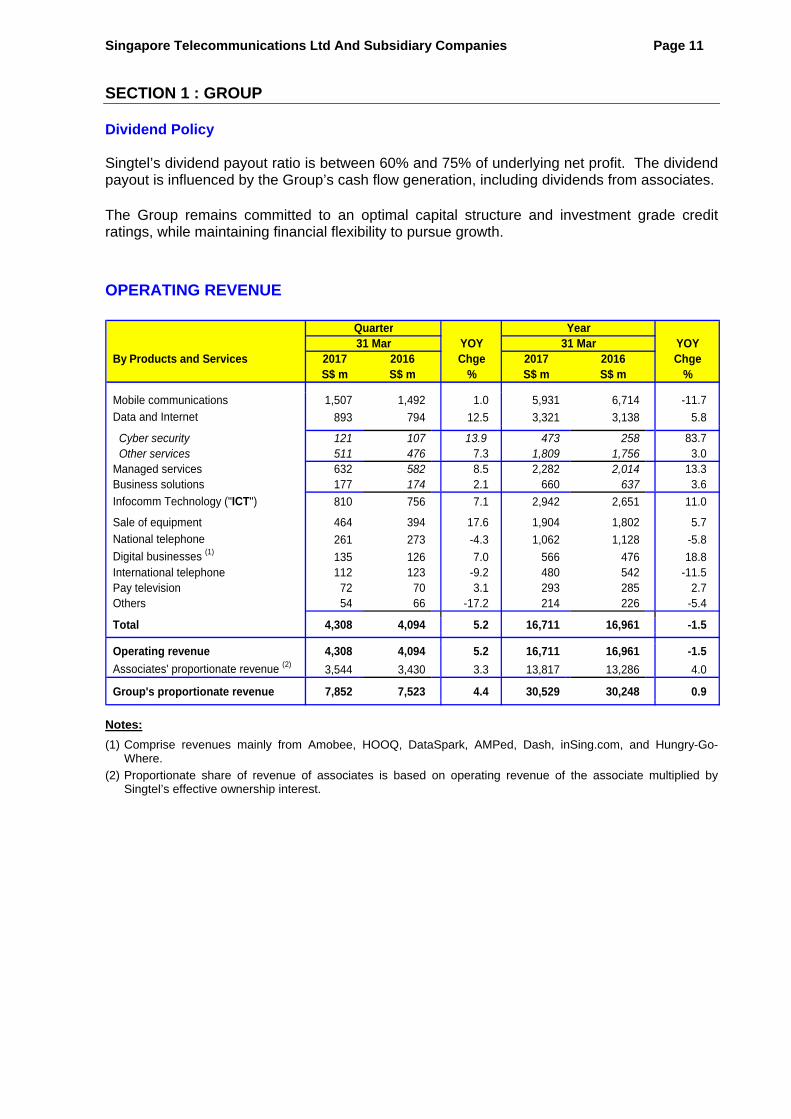
Singapore Telecommunications Ltd And Subsidiary Companies Page 11 SECTION 1 : GROUP Dividend Policy Singtel’s dividend payout ratio is between 60% and 75% of underlying net profit. The dividend payout is influenced by the Group’s cash flow generation, including dividends from associates. The Group remains committed to an optimal capital structure and investment grade credit ratings, while maintaining financial flexibility to pursue growth.
OPERATING REVENUE
By Products and Services
Mobile communications 1,507 1,492 1.0 5,931 6,714 -11.7
Data and Internet 893 794 12.5 3,321 3,138 5.8
Cyber security 121 107 13.9 473 258 83.7 Other services 511 476 7.3 1,809 1,756 3.0Managed services 632 582 8.5 2,282 2,014 13.3Business solutions 177 174 2.1 660 637 3.6
Infocomm Technology ("ICT") 810 756 7.1 2,942 2,651 11.0
Sale of equipment 464 394 17.6 1,904 1,802 5.7
National telephone 261 273 -4.3 1,062 1,128 -5.8
Digital businesses (1) 135 126 7.0 566 476 18.8International telephone 112 123 -9.2 480 542 -11.5Pay television 72 70 3.1 293 285 2.7Others 54 66 -17.2 214 226 -5.4
Total 4,308 4,094 5.2 16,711 16,961 -1.5
Operating revenue 4,308 4,094 5.2 16,711 16,961 -1.5
Associates' proportionate revenue (2) 3,544 3,430 3.3 13,817 13,286 4.0
Group's proportionate revenue 7,852 7,523 4.4 30,529 30,248 0.9
%2017 2016 Chge 2017 2016 ChgeS$ m S$ m % S$ m S$ m
YOYQuarter Year31 Mar YOY 31 Mar
Notes:
(1) Comprise revenues mainly from Amobee, HOOQ, DataSpark, AMPed, Dash, inSing.com, and Hungry-Go-Where.
(2) Proportionate share of revenue of associates is based on operating revenue of the associate multiplied by Singtel’s effective ownership interest.

Singapore Telecommunications Ltd And Subsidiary Companies Page 12 SECTION 1 : GROUP
Operating Revenue Mix 2017 2016 2017 2016% % % %
Mobile communications 35.0 36.4 35.5 39.6Data and Internet 20.7 19.4 19.9 18.5
Cyber security 2.8 2.6 2.8 1.5 Other services 11.9 11.6 10.8 10.4Managed services 14.7 14.2 13.7 11.9Business solutions 4.1 4.2 3.9 3.8ICT 18.8 18.5 17.6 15.6
Sale of equipment 10.8 9.6 11.4 10.6National telephone 6.1 6.7 6.4 6.7Digital businesses 3.1 3.1 3.4 2.8International telephone 2.6 3.0 2.9 3.0Pay television 1.7 1.7 1.8 1.7Others 1.3 1.6 1.3 1.3Total 100.0 100.0 100.0 99.8
Quarter Year31 Mar 31 Mar
Operating revenue of the Group grew 5.2% and would have increased 2.1% in constant currency terms. Mobile Communications was stable but would have declined 2.8% in constant currency terms. The decline reflected the impact of higher mobile service credits from device repayment plans in Australia and lower voice and SMS revenues not fully offset by higher data. Data and Internet revenue increased 13% driven by higher NBN revenue in Australia on strong customer growth and timing of migration payments, as well as increased demand for international circuits and bandwidth in Singapore. Revenue from ICT grew 7.1% with growth in cyber security and provision of government infrastructure services in Singapore, partially offset by some large one-off project revenues in Australia in the last corresponding quarter. Equipment sales grew 18% due to higher volume of handset sales driven by continued demand for smartphones. Including the proportionate share of operating revenue from the associates, the Group’s enlarged revenue grew 4.4% to S$7.85 billion with strong growth at Telkomsel.
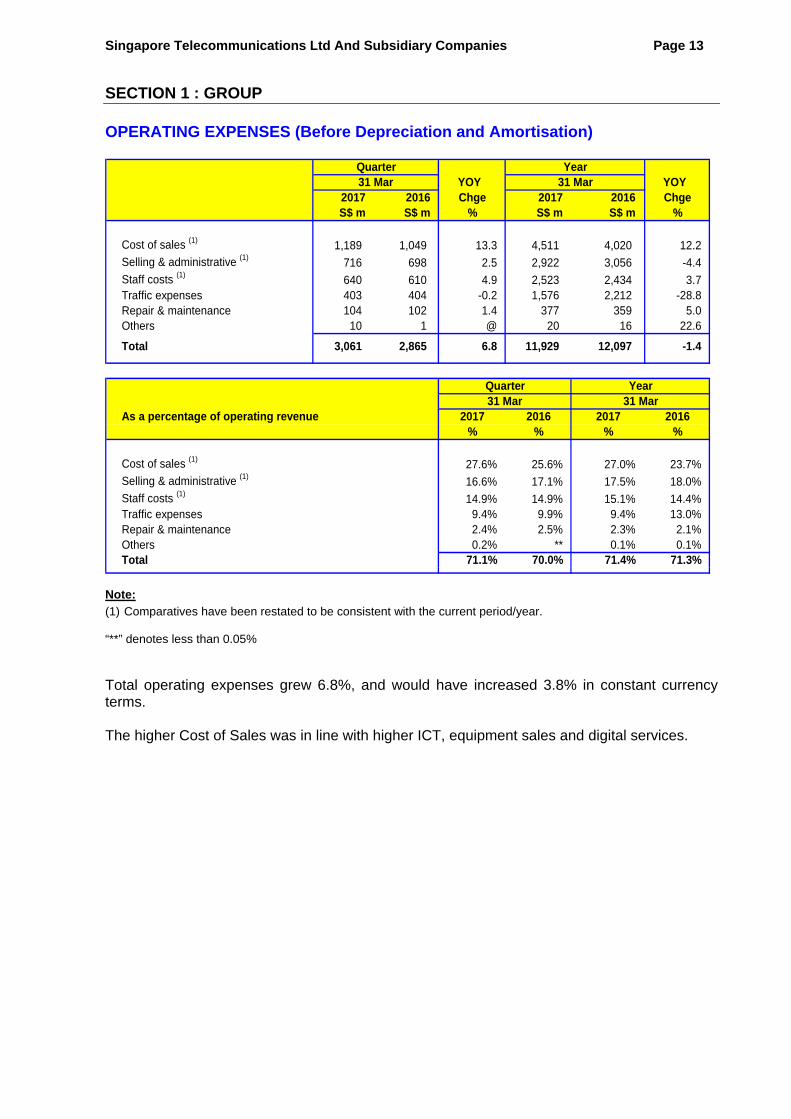
Singapore Telecommunications Ltd And Subsidiary Companies Page 13 SECTION 1 : GROUP OPERATING EXPENSES (Before Depreciation and Amortisation)
YOY YOY2017 2016 2017 2016S$ m S$ m S$ m S$ m
Cost of sales (1) 1,189 1,049 13.3 4,511 4,020 12.2
Selling & administrative (1) 716 698 2.5 2,922 3,056 -4.4
Staff costs (1) 640 610 4.9 2,523 2,434 3.7Traffic expenses 403 404 -0.2 1,576 2,212 -28.8Repair & maintenance 104 102 1.4 377 359 5.0Others 10 1 @ 20 16 22.6
Total 3,061 2,865 6.8 11,929 12,097 -1.4
As a percentage of operating revenue
Cost of sales (1) 27.6% 25.6% 27.0% 23.7%
Selling & administrative (1) 16.6% 17.1% 17.5% 18.0%
Staff costs (1) 14.9% 14.9% 15.1% 14.4%Traffic expenses 9.4% 9.9% 9.4% 13.0%Repair & maintenance 2.4% 2.5% 2.3% 2.1%Others 0.2% ** 0.1% 0.1%Total 71.1% 70.0% 71.4% 71.3%
% %2017 2016 2017 2016
Chge
Quarter Year31 Mar 31 Mar
Chge% %
%
Year31 MarQuarter
31 Mar
%
Note:
(1) Comparatives have been restated to be consistent with the current period/year.
“**” denotes less than 0.05%
Total operating expenses grew 6.8%, and would have increased 3.8% in constant currency terms. The higher Cost of Sales was in line with higher ICT, equipment sales and digital services.
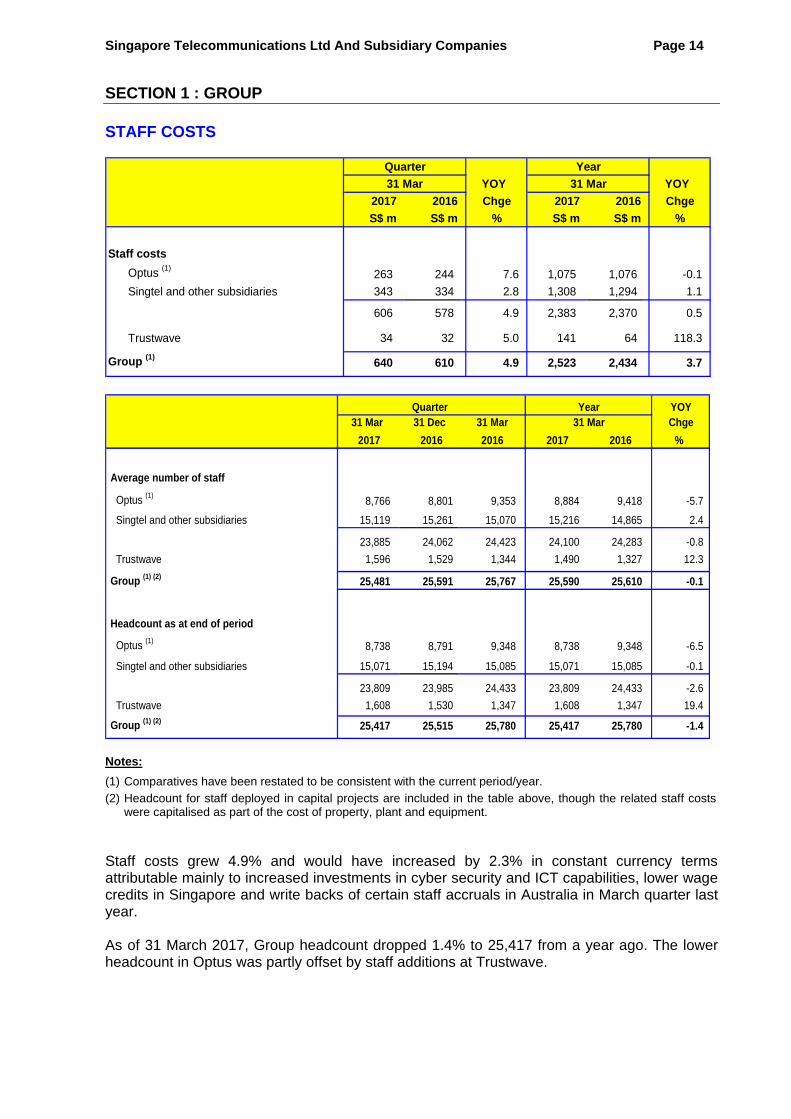
Singapore Telecommunications Ltd And Subsidiary Companies Page 14 SECTION 1 : GROUP STAFF COSTS
YOY YOY
2017 2016 2017 2016
S$ m S$ m S$ m S$ m
Staff costs
Optus (1)263 244 7.6 1,075 1,076 -0.1
Singtel and other subsidiaries 343 334 2.8 1,308 1,294 1.1
606 578 4.9 2,383 2,370 0.5
Trustwave 34 32 5.0 141 64 118.3
Group (1)640 610 4.9 2,523 2,434 3.7
% %
Quarter Year
31 Mar 31 Mar
Chge Chge
31 Mar 31 Dec 31 Mar
2016 %
Average number of staff
Optus (1)8,766 8,801 9,353 8,884 9,418 -5.7
Singtel and other subsidiaries 15,119 15,261 15,070 15,216 14,865 2.4
23,885 24,062 24,423 24,100 24,283 -0.8
Trustwave 1,596 1,529 1,344 1,490 1,327 12.3
Group (1) (2) 25,481 25,591 25,767 25,590 25,610 -0.1
Headcount as at end of period
Optus (1)8,738 8,791 9,348 8,738 9,348 -6.5
Singtel and other subsidiaries 15,071 15,194 15,085 15,071 15,085 -0.1
23,809 23,985 24,433 23,809 24,433 -2.6
Trustwave 1,608 1,530 1,347 1,608 1,347 19.4
Group (1) (2) 25,417 25,515 25,780 25,417 25,780 -1.4
2017 2016 2017 2016
Quarter Year YOY31 Mar Chge
Notes:
(1) Comparatives have been restated to be consistent with the current period/year.
(2) Headcount for staff deployed in capital projects are included in the table above, though the related staff costs were capitalised as part of the cost of property, plant and equipment.
Staff costs grew 4.9% and would have increased by 2.3% in constant currency terms attributable mainly to increased investments in cyber security and ICT capabilities, lower wage credits in Singapore and write backs of certain staff accruals in Australia in March quarter last year. As of 31 March 2017, Group headcount dropped 1.4% to 25,417 from a year ago. The lower headcount in Optus was partly offset by staff additions at Trustwave.

Singapore Telecommunications Ltd And Subsidiary Companies Page 15 SECTION 1 : GROUP NET FINANCE EXPENSE
2017 2016 2017 2016S$ m S$ m S$ m S$ m
Net interest expense - Interest income 2 3 -22.2 10 10 -3.0 - Interest expense (95) (95) 0.1 (363) (348) 4.2 (93) (92) 0.8 (353) (338) 4.4
- Net interest income from NetLink Trust (1)4 7 -45.8 16 29 -44.3
(89) (85) 4.7 (337) (309) 9.0
Other finance income - Dividend income from Southern Cross/ PCHL 15 13 20.8 61 43 42.0
- Investment income (2)* 1 nm 1 2 -36.4
- Net foreign exchange (losses)/ gains (non-trade) (6) (7) -8.6 8 2 285.7
- Net fair value (losses) / gains (3)(3) (13) -80.5 7 (3) nm
7 (7) nm 77 44 75.5
Net finance expense (82) (91) -10.0 (260) (265) -2.0
Chge Chge% %
Quarter Year31 Mar YOY 31 Mar YOY
Notes:
(1) Comprise interest earned on the unitholder’s loan to NetLink Trust, net of the finance lease expenses on the exchange buildings leased from NetLink Trust.
(2) Comprise mainly dividend income from Available-For-Sale investments.
(3) Comprise mainly adjustments for hedging instruments measured at fair values under FRS 39, Financial Instruments: Recognition and Measurement.
“*” denotes less than S$0.5 million Net interest income from NetLink Trust declined due to lower interest income as a result of partial repayment of unitholder's loan by NetLink Trust. Net foreign exchange losses arose mainly from revaluation losses of fixed deposits on depreciation of the US Dollar. Net fair value losses of S$3 million was recorded from mark-to-market valuation of interest rate swaps, lower than S$13 million of loss in the same quarter last year.
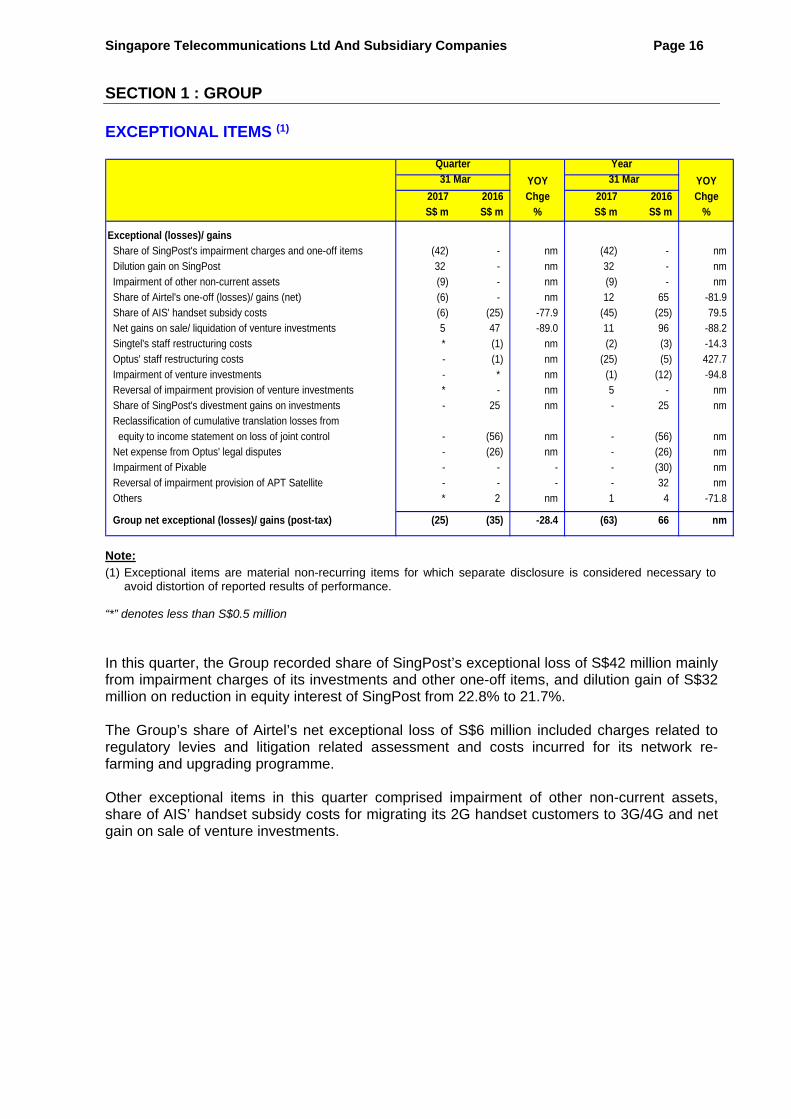
Singapore Telecommunications Ltd And Subsidiary Companies Page 16 SECTION 1 : GROUP EXCEPTIONAL ITEMS (1)
2017 2016 2017 2016
S$ m S$ m S$ m S$ m
Exceptional (losses)/ gains
Share of SingPost's impairment charges and one-off items (42) - nm (42) - nm
Dilution gain on SingPost 32 - nm 32 - nm
Impairment of other non-current assets (9) - nm (9) - nm
Share of Airtel's one-off (losses)/ gains (net) (6) - nm 12 65 -81.9
Share of AIS' handset subsidy costs (6) (25) -77.9 (45) (25) 79.5 Net gains on sale/ liquidation of venture investments 5 47 -89.0 11 96 -88.2
Singtel's staff restructuring costs * (1) nm (2) (3) -14.3
Optus' staff restructuring costs - (1) nm (25) (5) 427.7
Impairment of venture investments - * nm (1) (12) -94.8 Reversal of impairment provision of venture investments * - nm 5 - nm
Share of SingPost's divestment gains on investments - 25 nm - 25 nm
Reclassification of cumulative translation losses from
equity to income statement on loss of joint control - (56) nm - (56) nm Net expense from Optus' legal disputes - (26) nm - (26) nm
Impairment of Pixable - - - - (30) nm
Reversal of impairment provision of APT Satellite - - - - 32 nm
Others * 2 nm 1 4 -71.8
Group net exceptional (losses)/ gains (post-tax) (25) (35) -28.4 (63) 66 nm
Chge Chge
% %
Quarter Year31 Mar YOY 31 Mar YOY
Note:
(1) Exceptional items are material non-recurring items for which separate disclosure is considered necessary to avoid distortion of reported results of performance.
“*” denotes less than S$0.5 million In this quarter, the Group recorded share of SingPost’s exceptional loss of S$42 million mainly from impairment charges of its investments and other one-off items, and dilution gain of S$32 million on reduction in equity interest of SingPost from 22.8% to 21.7%. The Group’s share of Airtel’s net exceptional loss of S$6 million included charges related to regulatory levies and litigation related assessment and costs incurred for its network re-farming and upgrading programme. Other exceptional items in this quarter comprised impairment of other non-current assets, share of AIS’ handset subsidy costs for migrating its 2G handset customers to 3G/4G and net gain on sale of venture investments.

Singapore Telecommunications Ltd And Subsidiary Companies Page 17 SECTION 1 : GROUP TAX EXPENSE
2017 2016 2017 2016
S$ m S$ m S$ m S$ m
Income tax expense
Optus 116 107 7.8 361 396 -8.9
Singtel and other subsidiaries 20 47 -56.8 177 196 -9.9
Tax expense of Singtel and subsidiaries (a) 136 154 -11.9 537 592 -9.2
Share of associates' tax expense (b) 197 193 2.0 849 861 -1.4
Withholding and dividend distribution taxes on
associates' dividend income (1)48 24 105.1 161 145 11.6
Total 381 371 2.8 1,548 1,597 -3.1
Profit before exceptional items and tax 1,362 1,346 1.2 5,441 5,390 0.9
Exclude:
Share of associates' pre-tax profits (720) (721) -0.1 (2,942) (2,791) 5.4
Adjusted pre-tax profit (c) 642 625 2.6 2,499 2,599 -3.8
Effective tax rate of Singtel and subsidiaries (a)/(c) 21.2% 24.7% 21.5% 22.8%
Share of associates' pre-tax profits (d) 720 721 -0.1 2,942 2,791 5.4
Effective tax rate of associates (b)/(d) 27.4% 26.8% 28.9% 30.8%
Chge Chge
% %
Quarter Year
31 Mar YOY 31 Mar YOY
Note:
(1) Withholding and Indian dividend distribution taxes are deducted at source when dividends are remitted by the overseas associates. For accounting purposes, the dividend income and related withholding or dividend distribution taxes are accrued when declared by the associates. Dividend income has no impact on the income statement of the Group as they are eliminated at Group. The cash inflows upon the receipt of dividend are shown in Section 5.
The Group’s tax expense increased mainly due to recognition of withholding tax on Telkomsel’s interim dividend this quarter. However, effective tax rate of Singtel and its subsidiaries was lower due mainly to write back of some tax expenses relating to prior periods in the quarter.
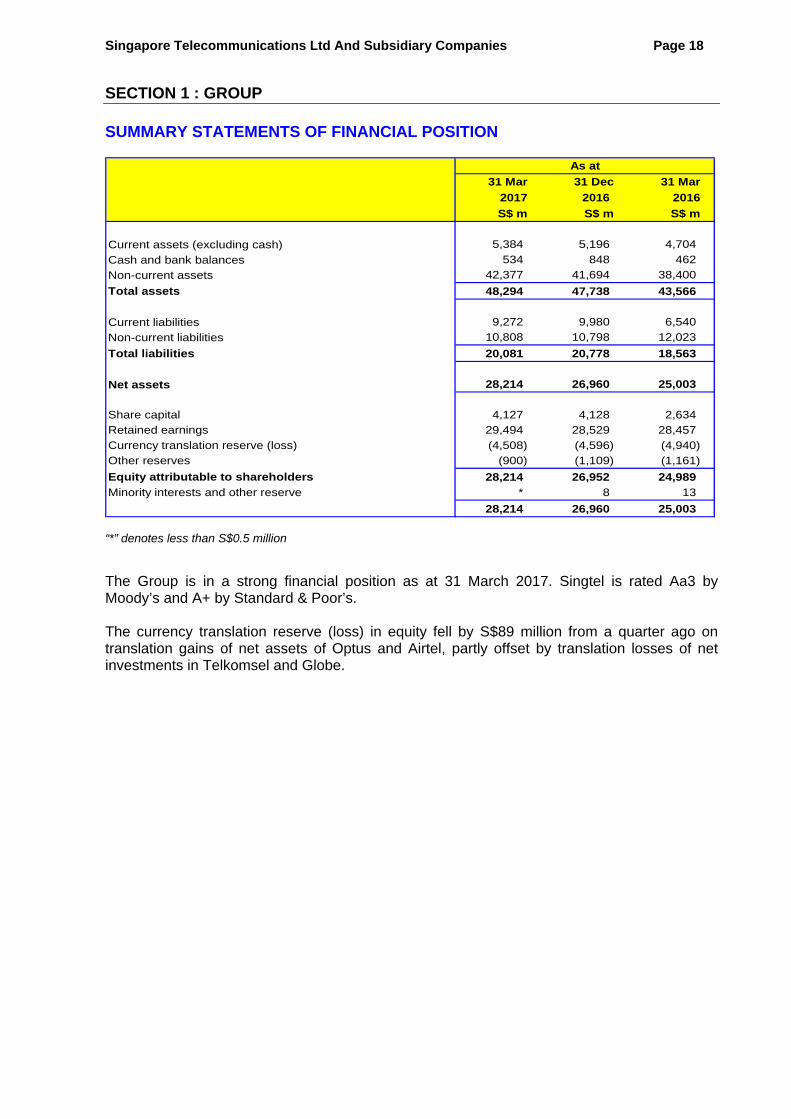
Singapore Telecommunications Ltd And Subsidiary Companies Page 18 SECTION 1 : GROUP SUMMARY STATEMENTS OF FINANCIAL POSITION
31 Mar 31 Dec 31 Mar
2017 2016 2016
S$ m S$ m S$ m
Current assets (excluding cash) 5,384 5,196 4,704
Cash and bank balances 534 848 462
Non-current assets 42,377 41,694 38,400
Total assets 48,294 47,738 43,566
Current liabilities 9,272 9,980 6,540
Non-current liabilities 10,808 10,798 12,023
Total liabilities 20,081 20,778 18,563
Net assets 28,214 26,960 25,003
Share capital 4,127 4,128 2,634
Retained earnings 29,494 28,529 28,457
Currency translation reserve (loss) (4,508) (4,596) (4,940)
Other reserves (900) (1,109) (1,161)
Equity attributable to shareholders 28,214 26,952 24,989
Minority interests and other reserve * 8 13
28,214 26,960 25,003
As at
“*” denotes less than S$0.5 million The Group is in a strong financial position as at 31 March 2017. Singtel is rated Aa3 by Moody’s and A+ by Standard & Poor’s. The currency translation reserve (loss) in equity fell by S$89 million from a quarter ago on translation gains of net assets of Optus and Airtel, partly offset by translation losses of net investments in Telkomsel and Globe.
Singapore Telecommunications Ltd And Subsidiary Companies Page 19 SECTION 1 : GROUP LIQUIDITY AND GEARING
31 Mar 31 Dec 31 Mar
2017 2016 2016
S$ m S$ m S$ m
Gross debt
Current debt 3,134 3,178 686
Non-current debt 8,052 8,091 9,255
Gross debt as reported in statement of financial position 11,186 11,269 9,941
Related net hedging asset (1) (268) (608) (337)
Hedged gross debt 10,918 10,661 9,604
Less : Cash and bank balances (534) (848) (462)
Net debt 10,384 9,813 9,142
Gross debt gearing ratio (2) 27.9% 28.3% 27.8%
Net debt gearing ratio 26.9% 26.7% 26.8%
As at
Notes:
(1) The net hedging asset relates to the fair values of cross currency and interest rate swaps.
(2) Gross debt gearing ratio refers to the ratio of gross debt to gross capitalisation. Gross capitalisation is the aggregate of gross debt, shareholders’ funds and minority interests.
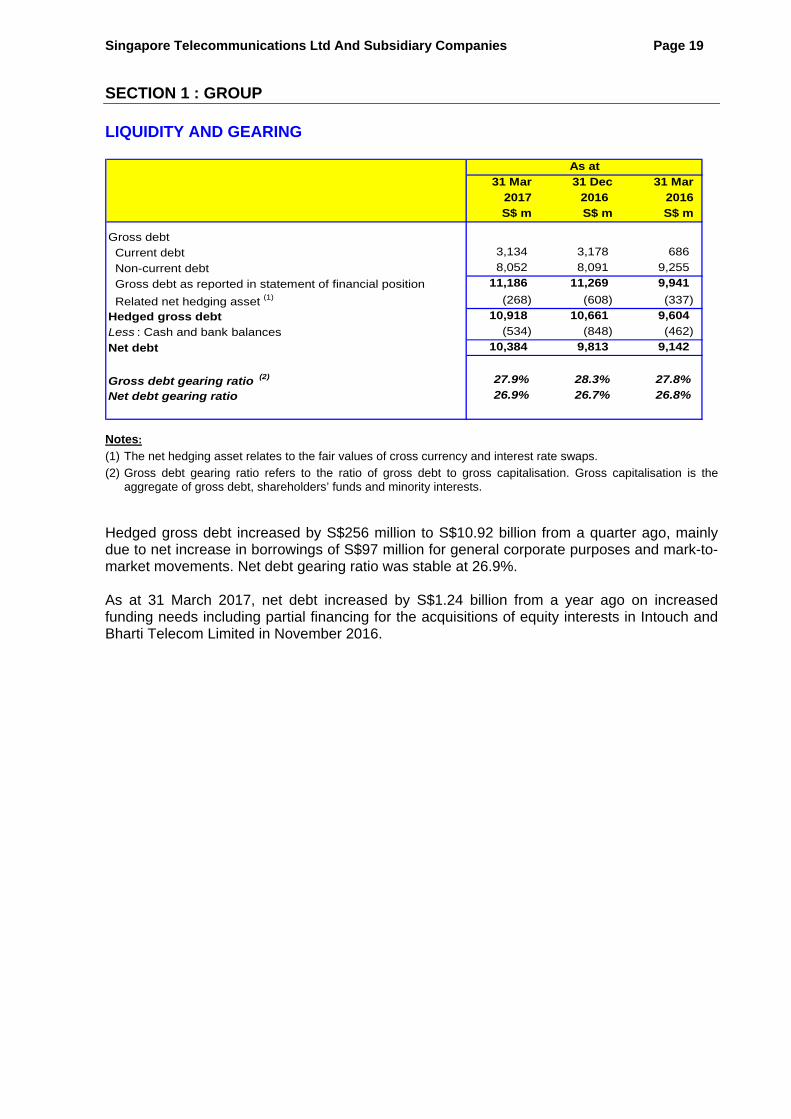
Hedged gross debt increased by S$256 million to S$10.92 billion from a quarter ago, mainly due to net increase in borrowings of S$97 million for general corporate purposes and mark-to-market movements. Net debt gearing ratio was stable at 26.9%. As at 31 March 2017, net debt increased by S$1.24 billion from a year ago on increased funding needs including partial financing for the acquisitions of equity interests in Intouch and Bharti Telecom Limited in November 2016.

Singapore Telecommunications Ltd And Subsidiary Companies Page 20 SECTION 1 : GROUP CASH FLOW AND CAPITAL EXPENDITURE
31 Mar 31 Mar 31 Dec2017 2016 2016 2017 2016S$ m S$ m S$ m S$ m S$ m
Net cash inflow from operating activities Profit before exceptional items and tax 1,362 1,346 1,335 5,441 5,390 0.9Non-cash items (41) (108) (118) (456) (390) 16.9Operating cash flow before working capital changes 1,321 1,238 1,217 4,985 5,000 -0.3Changes in operating assets and liabilities (94) 12 47 (492) (1,042) -52.8
1,227 1,250 1,263 4,493 3,958 13.5Cash paid to employees under performance share plans - - - * (3) nmTax paid on operating activities (1)
(109) (102) (276) (679) (525) 29.2Operating cash flow before dividends from associates 1,118 1,148 987 3,814 3,430 11.2Dividends/ Distributions received from associates 331 66 59 1,656 1,351 22.6Withholding tax paid on dividends received (32) (6) (6) (155) (133) 16.8
1,416 1,208 1,041 5,315 4,648 14.4Net cash outflow for investing activities
Accrued capital expenditure (956) (1,046) (582) (2,447) (2,435) 0.5Changes in creditors' balances 303 519 (42) 186 505 -63.1Cash capital expenditure (653) (527) (624) (2,261) (1,930) 17.1Investment in associates * (215) (2,470) (2,472) (215) @Deferred proceeds/ proceeds on disposal of associates 18 1 1 62 16 294.2Unitholder loan repaid by NetLink Trust - 510 - - 510 nmPurchase of spectrum * - - (126) (72) 75.4Purchase of other intangibles (24) (22) (37) (132) (102) 29.9Payment for purchase of subsidiaries, net of cash acquired - - - (5) (1,059) -99.5Investment in venture investments (7) (13) (6) (35) (39) -10.4Proceeds from disposal of venture investments 16 5 5 75 81 -7.7Proceeds from disposal of property, plant and equipment * * 1 34 6 500.0Withholding tax paid on interest received on inter-company loans (13) (14) - (27) (27) 1.5Others 18 30 15 54 91 -40.7
(644) (244) (3,115) (4,832) (2,740) 76.4Net cash (outflow)/ inflow for financing activities
Net increase/ (decrease) in borrowings 97 (11) 832 1,158 1,129 2.6Settlement of swap for bonds repaid 16 - - 16 - nmNet interest paid on borrowings and swaps (72) (80) (102) (351) (336) 4.7Final dividend paid to shareholders - - - (1,706) (1,705) **Interim dividend paid to shareholders (1,110) (1,084) - (1,110) (1,084) 2.4Proceeds from issue of shares - - 1,603 1,602 - nmPurchase of performance shares (6) (6) (6) (27) (44) -38.3Others * 1 (5) (5) (3) 42.4
(1,075) (1,181) 2,323 (422) (2,044) -79.3
Net (decrease)/ increase in cash and cash equivalents (303) (216) 248 60 (136) nmExchange effects on cash and cash equivalents (12) (8) 14 12 35 -65.8Group cash and cash equivalents at beginning 848 686 585 462 563 -17.9
Group cash and cash equivalents at end 534 462 848 534 462 15.6
Group free cash flow
Singapore 248 253 387 1,040 869 19.7
Optus (1)217 368 (23) 514 631 -18.5
Group free cash flow (before associates' dividends) (1) 465 621 364 1,554 1,500 3.6
Dividends received from associates (net of withholding tax) 299 60 53 1,500 1,218 23.2
Group free cash flow (1) 764 681 417 3,054 2,718 12.4
(exclude ATO tax payment ) 764 681 559 3,197 2,718 17.6
Optus free cash flow (in A$) (1)202 358 (22) 500 617 -19.0
(exclude ATO tax payment ) 202 358 112 634 617 2.7
Cash capex to operating revenue 15% 13% 14% 14% 11%
Quarter Year31 Mar
Chge%
YOY
“*” denotes less than S$0.5 million, “**” denotes less than 0.05%, and “@” denotes more than 500%
Note: (1) After S$142 million (A$134 million) paid to the ATO for amended assessments in December 2016 quarter.
Singapore Telecommunications Ltd And Subsidiary Companies Page 21 SECTION 1 : GROUP Net cash inflow from operating activities (before associates’ dividends) for the quarter fell 2.6% mainly due to working capital movements. Gross dividends from the associates rose mainly due to receipt of Telkomsel’s interim dividend for its 2016 financial year in the quarter. Consequently, total cash flow from operations increased 17% to S$1.42 billion. Net cash outflow for investing activities was S$644 million. Cash capital expenditure grew 24% to S$653 million. Capital expenditure comprised S$251 million for Singapore and S$402 million (A$375 million) for Australia. In Singapore, major capital investments in the quarter included S$87 million for fixed and data infrastructure, S$48 million for mobile networks, S$43 million for information systems and S$24 million for ICT investments. In Australia, capital investments in mobile networks, and fixed and other core infrastructure amounted to A$205 million and A$169 million respectively. With higher dividends from associates partly offset by higher capital expenditure, the Group’s free cash flow grew 12% to S$764 million. Net cash financing outflow of S$1.08 billion mainly comprised interim dividend payment of S$1.11 billion in respect of the current financial year and interest payments of S$72 million, partly offset by net increase in borrowings of S$97 million. Overall cash balance decreased S$314 million from a quarter ago, and the cash balance was S$534 million as at 31 March 2017. OTHER INFORMATION Update on results of General Spectrum Auction (“GSA”) in Singapore On 4 April 2017, Singtel Mobile Singapore Pte. Ltd., a wholly owned subsidiary of Singtel, successfully acquired the maximum allowable spectrum across the 700 MHz, 900 MHz and 2.5 GHz bands for S$564 million at the first stage of the GSA. The next stage is the assignment stage, which will determine the specific spectrum bands to be allocated to the winning bidders. Change in trustee-manager for NetLink Trust
Singtel has undertaken to the IMDA to reduce its stake in NetLink Trust to less than 25% before April 2018. As part of the divestment process, NetLink Management Pte. Ltd., a new independent trustee-manager, has replaced CityNet Infrastructure Management Pte. Ltd. as the trustee-manager of NetLink Trust with effect from 13 April 2017. The change does not affect NetLink Trust’s services and the management and staff of NetLink Trust continue to manage its business and operations.

Singapore Telecommunications Ltd And Subsidiary Companies Page 22 SECTION 2 : GROUP CONSUMER
GROUP CONSUMER
MANAGEMENT DISCUSSION AND ANALYSIS Group Consumer comprises the consumer businesses across Singapore and Australia, as well as the regional associates in the emerging markets. The results shown in this section are for the consumer businesses across Singapore and Australia only. The results of the regional associates are discussed in Section 5. FINANCIAL HIGHLIGHTS
FOR THE FOURTH QUARTER ENDED 31 MARCH 2017
Operating revenue at S$2.46 billion – up 7.1%. EBITDA at S$908 million – up 7.4%. EBIT at S$513 million – up 6.5%.
FOR THE YEAR ENDED 31 MARCH 2017 Operating revenue at S$9.57 billion – down 5.3% (stable excluding the
rates change). EBITDA stable at S$3.30 billion. EBIT at S$1.77 billion – down 2.2%.

Singapore Telecommunications Ltd And Subsidiary Companies Page 23 SECTION 2 : GROUP CONSUMER GROUP CONSUMER SUMMARY INCOME STATEMENTS For The Fourth Quarter And Year Ended 31 March 2017
2017 2016 2017 2016S$ m S$ m S$ m S$ m
Operating revenue 2,457 2,295 7.1 9,572 10,110 -5.3
Operating expenses (1,594) (1,475) 8.1 (6,453) (6,970) -7.4
863 820 5.3 3,119 3,141 -0.7
Other income 45 26 70.5 176 126 40.1
EBITDA 908 846 7.4 3,295 3,266 0.9
- margin 37.0% 36.9% 34.4% 32.3%
Depreciation & amortisation (396) (365) 8.5 (1,524) (1,455) 4.7
513 481 6.5 1,771 1,811 -2.2
Year31 Mar YOY
Chge%
YOYChge
%
EBIT
Quarter
31 Mar
Cost of sales (2) (3) 565 508 11.2 2,289 2,130 7.5Selling & administrative (2) 467 469 -0.3 2,004 2,157 -7.1
Traffic expenses 257 231 11.3 987 1,528 -35.4Staff costs (2) 231 204 13.2 914 913 0.1
Repair & maintenance 58 57 2.3 212 204 4.2
Others 16 7 131.3 48 39 23.5
Operating expenses 1,594 1,475 8.1 6,453 6,970 -7.4
31 Mar YOY
2017 2016
S$ mS$ m % S$ m S$ m %
31 Mar YOY
Quarter
Chge Chge 2017 2016
Year
Notes: (1) The above figures include the costs of International Group division which have responsibility over the
regional associates. (2) Comparatives have been restated to be consistent with the current quarter/year. (3) Cost of sales include costs of content and programming.

Singapore Telecommunications Ltd And Subsidiary Companies Page 24 SECTION 2 : GROUP CONSUMER GROUP CONSUMER OPERATING HIGHLIGHTS
For The Fourth Quarter Ended 31 March 2017 Group Consumer recorded strong operating performance across Singapore and Australia in this quarter. Australia Consumer contributed 76% (Q4 FY2016: 75%) and 80% (Q4 FY2016: 79%) to the Group Consumer’s operating revenue and EBITDA respectively. The Australian Dollar strengthened 6% against the Singapore Dollar from the same quarter last year. Operating revenue and EBITDA grew strongly by 7.1% and 7.4% respectively while EBIT increased 6.5% after including higher depreciation and amortisation charges. In constant currency terms, operating revenue and EBITDA increased 2.5% and 2.6% respectively while EBIT grew 2.0%. For The Year Ended 31 March 2017 The Australian Dollar appreciated 2% against the Singapore Dollar from last year. For the year ended 31 March 2017, operating revenue declined by 5.3% (stable excluding the rates change) while EBITDA was stable and EBIT declined 2.2% on higher depreciation and amortisation charges with increased investments in mobile network and spectrum. SEQUENTIAL QUARTERLY RESULTS Results for the current quarter compared to the preceding quarter ended 31 December 2016 were as follows:
31 Mar 31 Dec2017 2016S$ m S$ m
Operating revenue 2,457 2,578 -4.7
Operating expenses (1,594) (1,805) -11.7
EBITDA 908 809 12.3
- margin 37.0% 31.4%
513 421 21.8
QOQChge
%
Quarter
EBIT
Operating revenue decreased mainly due to seasonally higher Equipment sales across Singapore and Australia in the preceding December quarter. Both EBITDA and EBIT improved mainly from higher NBN revenue in Australia and lower selling costs.
Singapore Telecommunications Ltd And Subsidiary Companies Page 25 SECTION 2 : GROUP CONSUMER SINGAPORE CONSUMER SUMMARY INCOME STATEMENTS For The Fourth Quarter And Year Ended 31 March 2017
2017 2016 2017 2016S$ m S$ m S$ m S$ m
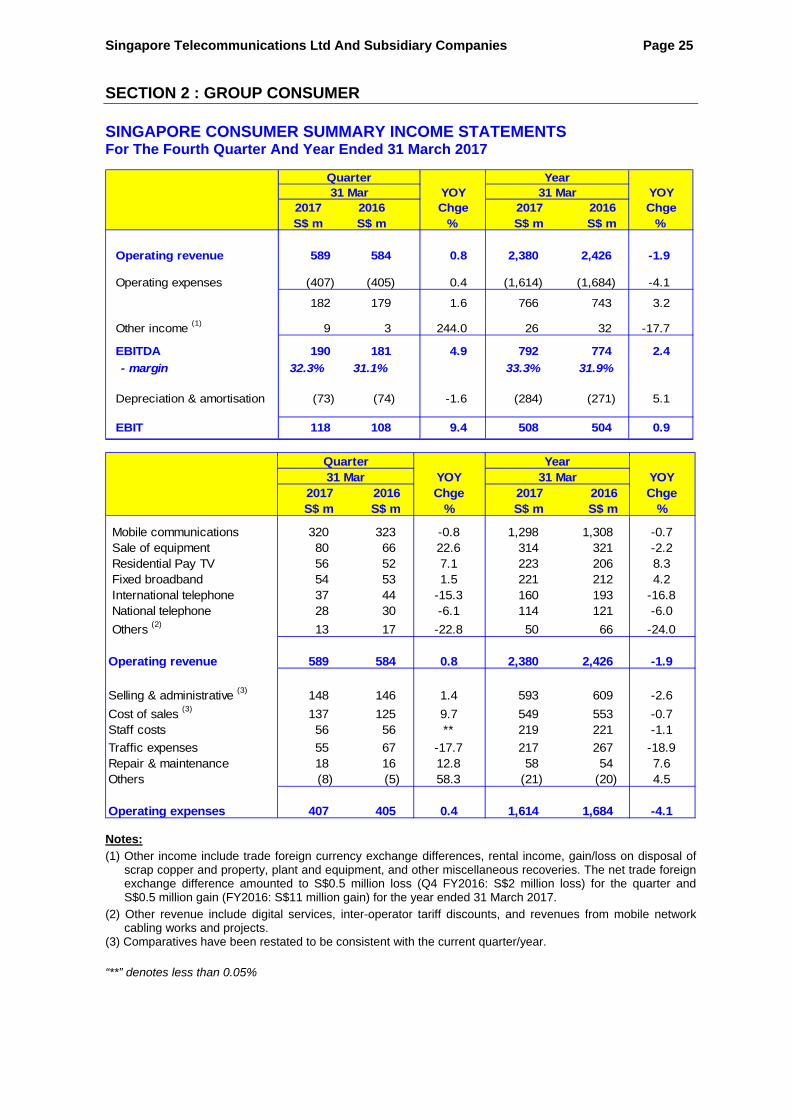
Operating revenue 589 584 0.8 2,380 2,426 -1.9
Operating expenses (407) (405) 0.4 (1,614) (1,684) -4.1
182 179 1.6 766 743 3.2
Other income (1)
9 3 244.0 26 32 -17.7
EBITDA 190 181 4.9 792 774 2.4
- margin 32.3% 31.1% 33.3% 31.9%
Depreciation & amortisation (73) (74) -1.6 (284) (271) 5.1
118 108 9.4 508 504 0.9
Year31 Mar YOY 31 Mar
Quarter
EBIT
YOY
Chge Chge% %
YOY YOY2017 2016 Chge 2017 2016 ChgeS$ m S$ m S$ m S$ m
Mobile communications 320 323 -0.8 1,298 1,308 -0.7 Sale of equipment 80 66 22.6 314 321 -2.2 Residential Pay TV 56 52 7.1 223 206 8.3 Fixed broadband 54 53 1.5 221 212 4.2 International telephone 37 44 -15.3 160 193 -16.8 National telephone 28 30 -6.1 114 121 -6.0
Others (2) 13 17 -22.8 50 66 -24.0
Operating revenue 589 584 0.8 2,380 2,426 -1.9
Selling & administrative (3) 148 146 1.4 593 609 -2.6
Cost of sales (3) 137 125 9.7 549 553 -0.7Staff costs 56 56 ** 219 221 -1.1
Traffic expenses 55 67 -17.7 217 267 -18.9Repair & maintenance 18 16 12.8 58 54 7.6Others (8) (5) 58.3 (21) (20) 4.5 Operating expenses 407 405 0.4 1,614 1,684 -4.1
% %
Quarter Year31 Mar 31 Mar
Notes:
(1) Other income include trade foreign currency exchange differences, rental income, gain/loss on disposal of scrap copper and property, plant and equipment, and other miscellaneous recoveries. The net trade foreign exchange difference amounted to S$0.5 million loss (Q4 FY2016: S$2 million loss) for the quarter and S$0.5 million gain (FY2016: S$11 million gain) for the year ended 31 March 2017.
(2) Other revenue include digital services, inter-operator tariff discounts, and revenues from mobile network cabling works and projects.
(3) Comparatives have been restated to be consistent with the current quarter/year.
(3 “**” denotes less than 0.05%
Singapore Telecommunications Ltd And Subsidiary Companies Page 26 SECTION 2 : GROUP CONSUMER SINGAPORE CONSUMER OPERATING PERFORMANCE For The Fourth Quarter Ended 31 March 2017 In this quarter, Singapore Consumer reported growth in EBITDA and EBIT of 4.9% and 9.4% respectively amid a highly competitive market. Operating revenue was stable as higher Equipment sales and Consumer Home Services were offset by lower voice services. Equipment sales grew a strong 23% on higher sales volume as well as increased mix of higher tier handsets. Mobile Communications revenue was stable as strong data growth in both prepaid and postpaid was offset by declines in local and roaming voice. The postpaid customer base grew 42,0008 during the quarter boosted by successful promotions. The prepaid customer base rebounded positively this quarter with net additions of 7,000 on launch of new product. At the recent spectrum auction, Singtel successfully acquired the maximum allowable spectrum in the 700 MHz, 900 MHz and 2.5 GHz bands for S$564 million. As the 700 MHz spectrum band is the most efficient and versatile spectrum band for LTE networks, the investment puts Singtel in a strong position to support IoT and 5G initiatives in the future. Consumer Home Services which comprise fixed broadband, residential pay TV and voice revenue was up 3.3%. Excluding one-off customer bill rebates for service outage, fixed broadband revenue grew 6% driven mainly by more customer upgrades to higher speed fibre plans and increased subscriptions of value-added services. Singtel TV’s operating revenue grew by a strong 7.1% due to contributions from the sub-license of content rights for the Premier League 2016/2017 season (Q4 FY2016: Nil). The number of customers who have signed up for ‘on-the-go’ services, namely the Cast OTT and Singtel TV Go companion apps, grew by 14,000 in the quarter to 47,000 as at end of March 2017. International Telephone revenue declined significantly by 15% on popularity of OTT apps. The impact of the decline was partially mitigated by lower outpayment costs. Overall operating expenses remained flat on strong cost management. Cost of sales increased in line with higher smartphones sales while traffic expenses fell due to lower data roaming rates. Other income increased significantly on various one-off gains and lower foreign exchange loss on revaluation of trade balances.
8 Based on total product view (i.e. included Enterprise mobile).

Singapore Telecommunications Ltd And Subsidiary Companies Page 27 SECTION 2 : GROUP CONSUMER For The Year Ended 31 March 2017 Operating revenue for the year ended 31 March 2017 declined 1.9% on lower voice services (local, international and roaming) and Equipment sales. Mobile Communications revenue was stable with strong growth in mobile data offsetting the decline in local and roaming voice revenues. Consumer Home Services revenue increased by 4.4% on strong growth in fixed broadband, and residential TV services with contributions from the sub-license of content rights for the Premier League 2016/2017 season (FY2016: Nil). With strong cost management, EBITDA increased 2.4% while EBIT remained stable on higher depreciation charges from increased network investments. SEQUENTIAL QUARTERLY RESULTS Results for the current quarter compared to the preceding quarter ended 31 December 2016 were as follows:
31 Mar 31 Dec2017 2016S$ m S$ m
Operating revenue 589 657 -10.4
Operating expenses (407) (480) -15.3
EBITDA 190 185 3.1
- margin 32.3% 28.1%
118 115 2.6 EBIT
QuarterQOQChge
%
Operating revenue declined 10% due to seasonally higher Equipment sales in the preceding December quarter. EBITDA, however, grew 3.1% on lower selling costs due to lower connections.

Singapore Telecommunications Ltd And Subsidiary Companies Page 28 SECTION 2 : GROUP CONSUMER AUSTRALIA CONSUMER SUMMARY INCOME STATEMENTS For The Fourth Quarter And Year Ended 31 March 2017
Operating revenue 1,741 1,689 3.1 6,897 7,532 -8.4
Operating expense (1,099) (1,050) 4.6 (4,623) (5,161) -10.4
642 639 0.6 2,274 2,372 -4.1
Other income 34 22 50.7 142 90 57.8
EBITDA 676 661 2.2 2,416 2,462 -1.9
- margin 38.8% 39.2% 35.0% 32.7%
Depreciation & amortisation 300 287 4.6 1,187 1,160 2.3
EBIT 376 374 0.4 1,229 1,301 -5.6
A$ m A$ m A$ m A$ m
YOY
2017 2016 Chge 2017 2016 Chge
% %
Quarter Year31 Mar YOY 31 Mar
Incoming 47 50 -4.7 194 772 -74.9Outgoing 873 901 -3.1 3,473 3,664 -5.2
Total Mobile Service 920 950 -3.2 3,667 4,436 -17.3Equipment 314 287 9.7 1,339 1,272 5.2
Total Mobile Revenue 1,235 1,237 -0.2 5,006 5,708 -12.3
Voice 91 102 -10.8 380 415 -8.5Broadband 112 120 -6.7 460 502 -8.2PayTV 25 25 -0.2 103 95 8.4
Mass Market Fixed Onnet 228 247 -7.7 944 1,012 -6.8
Mass Market Fixed Offnet (1) 126 51 145.7 327 164 99.7Total Mass Market Fixed 354 298 18.6 1,270 1,176 8.0
Data & IP 58 55 5.0 231 236 -2.2Voice 26 27 -3.8 108 129 -16.6Satellite 68 71 -4.0 281 283 -0.5
Total Wholesale Fixed 153 154 -0.7 620 649 -4.4
Operating revenue 1,741 1,689 3.1 6,897 7,532 -8.4
Chge
A$ m A$ m % A$ m A$ m %
2017 2016 Chge 2017 2016
Quarter Year31 Mar YOY 31 Mar YOY
Note: (1) Included NBN migration and site preparation revenues of A$66 million for the quarter (Q4 FY2016: A$20
million) and A$124 million (FY2016: A$73 million) for the year ended 31 March 2017.

Singapore Telecommunications Ltd And Subsidiary Companies Page 29 SECTION 2 : GROUP CONSUMER
Cost of sales (1) 399 379 5.2 1,666 1,545 7.8
Selling & administrative (1) 296 316 -6.4 1,350 1,511 -10.7
Traffic expenses 188 162 15.9 739 1,235 -40.2
Staff costs (1) 158 141 11.7 655 665 -1.6
Repair & maintenance 37 40 -8.5 147 146 0.3
Other 22 12 87.5 67 58 14.9
Operating expenses 1,099 1,050 4.6 4,623 5,161 -10.4
YOY
Quarter Year31 Mar YOY 31 Mar
%
2017 2016 Chge 2017 2016 Chge
A$ m A$ m % A$ m A$ m
Note: (1) Comparatives have been restated to be consistent with the current quarter/year. AUSTRALIA CONSUMER OPERATING PERFORMANCE For The Fourth Quarter Ended 31 March 2017 Australia Consumer reported an increase in operating revenue of 3.1% despite continued intense competition. The increase was driven by higher NBN revenue and Equipment sales partially offset by increased mobile service credits from device repayment plans. Outgoing mobile service revenue fell 3.1% and would be up 3.7% excluding the impact of device repayment plan credits. Australia Consumer reported the highest quarterly mobile customer net additions in the last five years. The postpaid handset customer base continued to grow strongly by 78,0009 this quarter, with the branded handset customer base increasing by 70,000. The prepaid handset customer base grew 64,000 from a quarter ago. Blended mobile ARPU was stable year-on-year excluding the impact of device repayment plan credits. The number of 4G mobile customers increased by 254,000 this quarter, resulting in the total 4G customer base increasing to 5.72 million10 as at 31 March 2017. Optus continued to invest in its mobile networks, reaching 96.1% of 4G population coverage with 5,872 sites upgraded to 4Gs, of which 4,893 have been upgraded to 700 MHz spectrum. This quarter, Optus has also taken a step towards 5G, switching on 4.5G network services across the suburb of Macquarie Park in NSW and achieving speeds of up to 1.03 Gbps during testing. Optus has also launched native Voice over WiFi – or WiFi Calling – which allows customers to easily make and receive calls, SMS and MMS where there is an accessible WiFi service, such as home or public WiFi. With a compatible handset, WiFi Calling allows calls to switch between WiFi and mobile networks easily for optimal user experience. 9 Including Enterprise customers, Optus’ total postpaid handset customer base grew 83,000. 10 Including Enterprise customers, Optus’ total number of 4G customers increased from 5.54 million a quarter ago to 5.80 million.

Singapore Telecommunications Ltd And Subsidiary Companies Page 30 SECTION 2 : GROUP CONSUMER Demonstrating its commitment to relentless improvement across both the fixed and mobile networks, the ongoing network investment programme has resulted in Optus being ranked first in the monthly Netflix ISP Speed index for 19 consecutive months. Continued focus on product innovation, network investment and customer advocacy have resulted in significant improvements in the Consumer market NPS11 score, which increased from 8 to 11 in the quarter. In Mass Market Fixed, operating revenue grew 19% mainly on higher NBN revenue driven by NBN customer growth of 115,000 from a year ago and timing of migration payments. Excluding NBN migration and preparation fees, Mass Market Fixed revenue grew 3.5%. Wholesale fixed revenue was stable year-on-year mainly attributable to decline in satellite revenue offset by higher Data & IP revenues. Total operating expenses increased 4.6% mainly from higher traffic expenses. Traffic expenses were up due to customer growth and NBN access fees. Cost of sales increased on higher equipment sales and increased content and programming costs. Staff costs in the same quarter last year included write backs of certain accruals not repeated this quarter. Other income increased 51% on various one-off miscellaneous gains and recoveries. Consequently, EBITDA increased 2.2% and EBITDA margin declined slightly to 38.8% in the quarter. EBIT remained stable after including depreciation and amortisation expense which increased 4.6% on higher investments in mobile network and spectrum. For The Year Ended 31 March 2017 For the year ended 31 March 2017, operating revenue declined 8.4% but increased 2.8% excluding the impacts of mobile service credits from device repayment plans and rate change which reduced revenue in the first three quarters. With lower operating revenue, EBITDA declined 1.9%. On 12 April 2017, the Australian Communication and Media Authority completed the auction of the remaining unallocated portion of the 700 MHz 'digital dividend' spectrum. TPG Internet Pty Ltd, having successfully acquired 2x10 MHz of the spectrum, has indicated that it will enter the market as a fourth mobile operator.
11 The Net Promoter Score (“NPS”) is a widely used metric to measure customer experience by scoring the willingness of customers to recommend a brand following an interaction with the company.
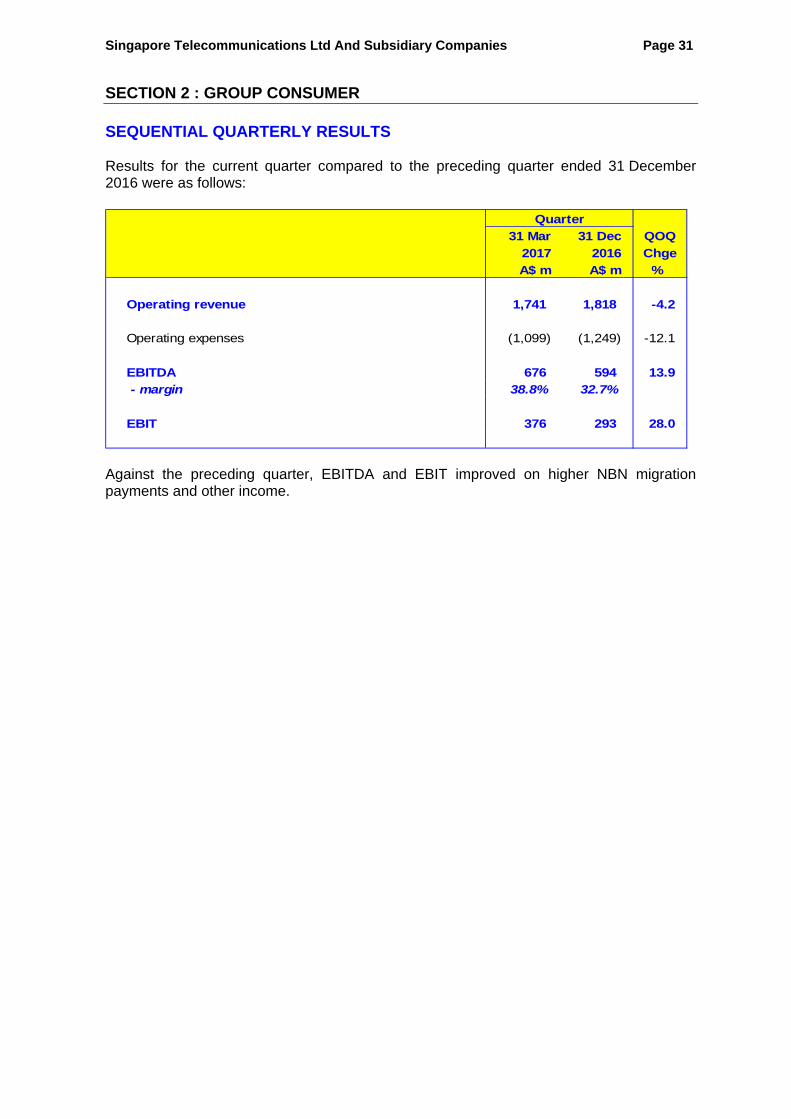
Singapore Telecommunications Ltd And Subsidiary Companies Page 31 SECTION 2 : GROUP CONSUMER SEQUENTIAL QUARTERLY RESULTS Results for the current quarter compared to the preceding quarter ended 31 December 2016 were as follows:
31 Mar 31 Dec
2017 2016
A$ m A$ m
Operating revenue 1,741 1,818 -4.2
Operating expenses (1,099) (1,249) -12.1
EBITDA 676 594 13.9
- margin 38.8% 32.7%
EBIT 376 293 28.0
Quarter
QOQ
Chge
%
Against the preceding quarter, EBITDA and EBIT improved on higher NBN migration payments and other income.
Singapore Telecommunications Ltd And Subsidiary Companies Page 32 SECTION 3 : GROUP ENTERPRISE
GROUP ENTERPRISE
MANAGEMENT DISCUSSION AND ANALYSIS
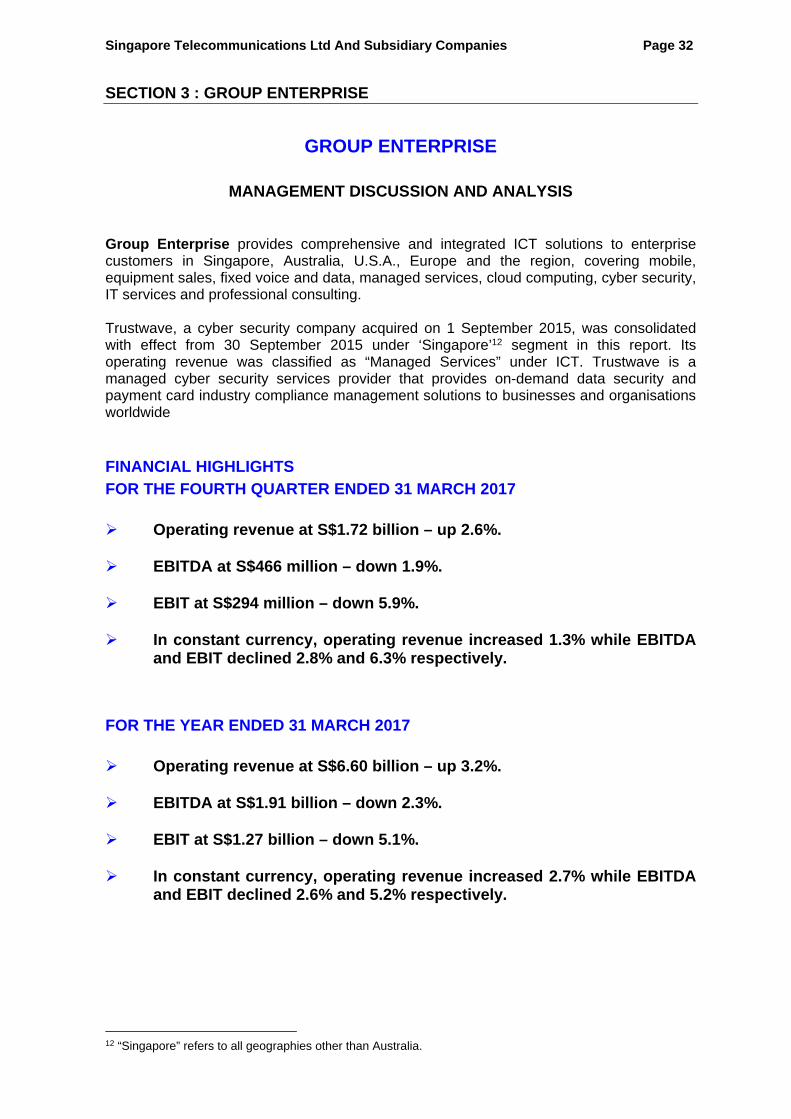
Group Enterprise provides comprehensive and integrated ICT solutions to enterprise customers in Singapore, Australia, U.S.A., Europe and the region, covering mobile, equipment sales, fixed voice and data, managed services, cloud computing, cyber security, IT services and professional consulting. Trustwave, a cyber security company acquired on 1 September 2015, was consolidated with effect from 30 September 2015 under ‘Singapore’12 segment in this report. Its operating revenue was classified as “Managed Services” under ICT. Trustwave is a managed cyber security services provider that provides on-demand data security and payment card industry compliance management solutions to businesses and organisations worldwide FINANCIAL HIGHLIGHTS
FOR THE FOURTH QUARTER ENDED 31 MARCH 2017
Operating revenue at S$1.72 billion – up 2.6%.
EBITDA at S$466 million – down 1.9%.
EBIT at S$294 million – down 5.9%.
In constant currency, operating revenue increased 1.3% while EBITDA
and EBIT declined 2.8% and 6.3% respectively.
FOR THE YEAR ENDED 31 MARCH 2017
Operating revenue at S$6.60 billion – up 3.2%. EBITDA at S$1.91 billion – down 2.3%.
EBIT at S$1.27 billion – down 5.1%.
In constant currency, operating revenue increased 2.7% while EBITDA
and EBIT declined 2.6% and 5.2% respectively.
12 “Singapore” refers to all geographies other than Australia.
Singapore Telecommunications Ltd And Subsidiary Companies Page 33 SECTION 3 : GROUP ENTERPRISE
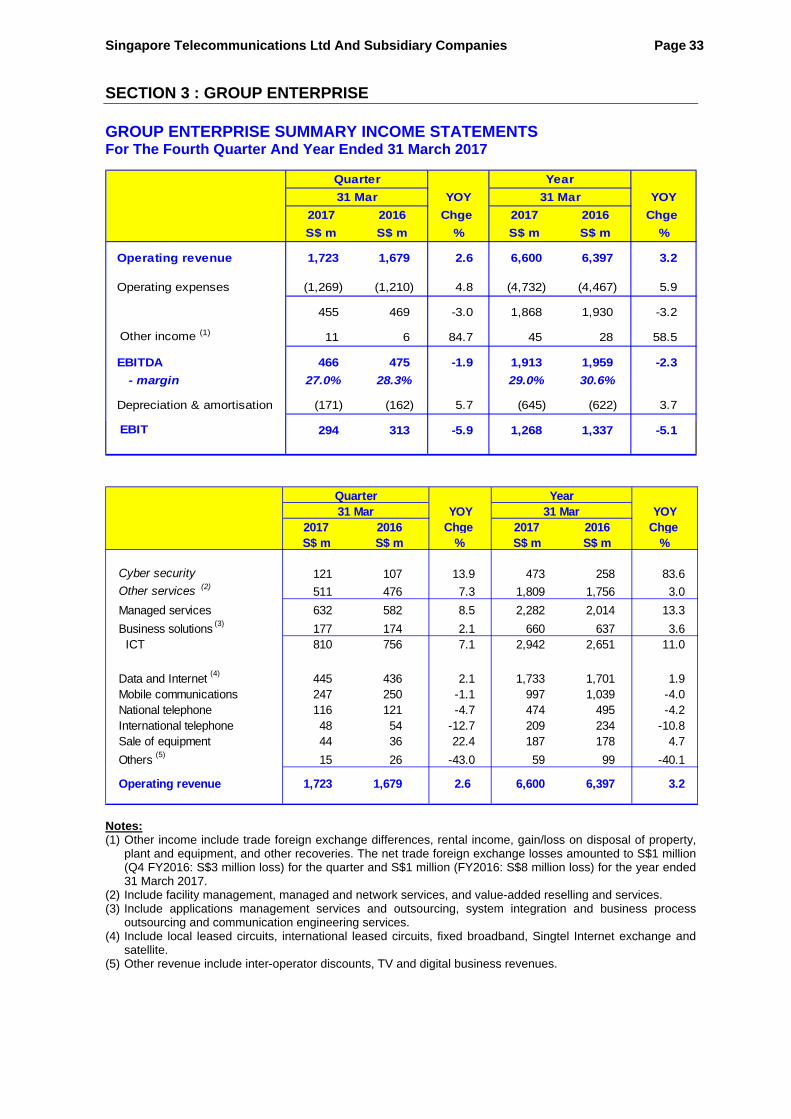
GROUP ENTERPRISE SUMMARY INCOME STATEMENTS For The Fourth Quarter And Year Ended 31 March 2017
Operating revenue 1,723 1,679 2.6 6,600 6,397 3.2
Operating expenses (1,269) (1,210) 4.8 (4,732) (4,467) 5.9
455 469 -3.0 1,868 1,930 -3.2
Other income (1) 11 6 84.7 45 28 58.5
EBITDA 466 475 -1.9 1,913 1,959 -2.3
- margin 27.0% 28.3% 29.0% 30.6%
Depreciation & amortisation (171) (162) 5.7 (645) (622) 3.7
EBIT 294 313 -5.9 1,268 1,337 -5.1
Quarter Year
31 Mar YOY 31 Mar YOY
Chge
S$ m S$ m % S$ m S$ m %
2017 2016 Chge 2017 2016
Cyber security 121 107 13.9 473 258 83.6
Other services (2) 511 476 7.3 1,809 1,756 3.0
Managed services 632 582 8.5 2,282 2,014 13.3
Business solutions (3)
177 174 2.1 660 637 3.6 ICT 810 756 7.1 2,942 2,651 11.0
Data and Internet (4)
445 436 2.1 1,733 1,701 1.9Mobile communications 247 250 -1.1 997 1,039 -4.0National telephone 116 121 -4.7 474 495 -4.2International telephone 48 54 -12.7 209 234 -10.8Sale of equipment 44 36 22.4 187 178 4.7
Others (5) 15 26 -43.0 59 99 -40.1
Operating revenue 1,723 1,679 2.6 6,600 6,397 3.2
%2017 2016 Chge 2017 2016 Chge S$ m S$ m % S$ m S$ m
Quarter Year31 Mar YOY 31 Mar YOY
Notes: (1) Other income include trade foreign exchange differences, rental income, gain/loss on disposal of property,
plant and equipment, and other recoveries. The net trade foreign exchange losses amounted to S$1 million (Q4 FY2016: S$3 million loss) for the quarter and S$1 million (FY2016: S$8 million loss) for the year ended 31 March 2017.
(2) Include facility management, managed and network services, and value-added reselling and services. (3) Include applications management services and outsourcing, system integration and business process
outsourcing and communication engineering services. (4) Include local leased circuits, international leased circuits, fixed broadband, Singtel Internet exchange and
satellite. (5) Other revenue include inter-operator discounts, TV and digital business revenues.
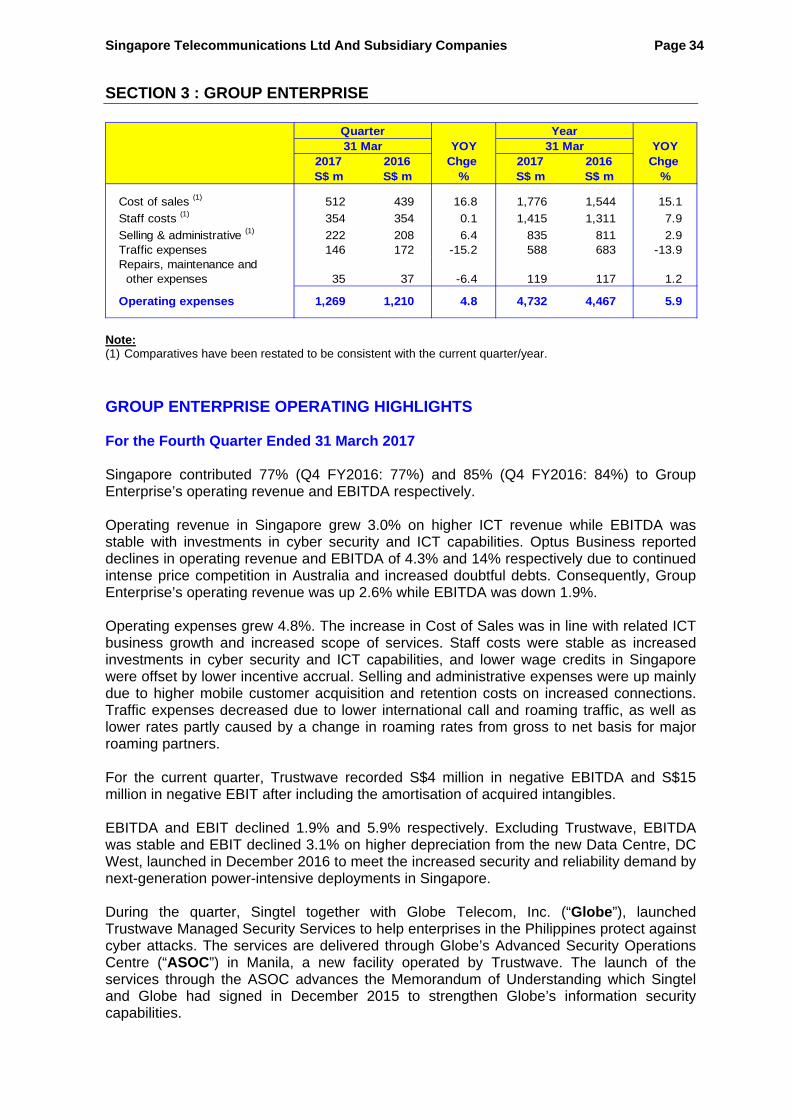
Singapore Telecommunications Ltd And Subsidiary Companies Page 34 SECTION 3 : GROUP ENTERPRISE
Cost of sales (1) 512 439 16.8 1,776 1,544 15.1
Staff costs (1) 354 354 0.1 1,415 1,311 7.9
Selling & administrative (1) 222 208 6.4 835 811 2.9Traffic expenses 146 172 -15.2 588 683 -13.9Repairs, maintenance and other expenses 35 37 -6.4 119 117 1.2
Operating expenses 1,269 1,210 4.8 4,732 4,467 5.9
%2017 2016 Chge 2017 2016 Chge S$ m S$ m % S$ m S$ m
Quarter Year31 Mar YOY 31 Mar YOY
Note: (1) Comparatives have been restated to be consistent with the current quarter/year.
GROUP ENTERPRISE OPERATING HIGHLIGHTS For the Fourth Quarter Ended 31 March 2017 Singapore contributed 77% (Q4 FY2016: 77%) and 85% (Q4 FY2016: 84%) to Group Enterprise’s operating revenue and EBITDA respectively. Operating revenue in Singapore grew 3.0% on higher ICT revenue while EBITDA was stable with investments in cyber security and ICT capabilities. Optus Business reported declines in operating revenue and EBITDA of 4.3% and 14% respectively due to continued intense price competition in Australia and increased doubtful debts. Consequently, Group Enterprise’s operating revenue was up 2.6% while EBITDA was down 1.9%. Operating expenses grew 4.8%. The increase in Cost of Sales was in line with related ICT business growth and increased scope of services. Staff costs were stable as increased investments in cyber security and ICT capabilities, and lower wage credits in Singapore were offset by lower incentive accrual. Selling and administrative expenses were up mainly due to higher mobile customer acquisition and retention costs on increased connections. Traffic expenses decreased due to lower international call and roaming traffic, as well as lower rates partly caused by a change in roaming rates from gross to net basis for major roaming partners. For the current quarter, Trustwave recorded S$4 million in negative EBITDA and S$15 million in negative EBIT after including the amortisation of acquired intangibles. EBITDA and EBIT declined 1.9% and 5.9% respectively. Excluding Trustwave, EBITDA was stable and EBIT declined 3.1% on higher depreciation from the new Data Centre, DC West, launched in December 2016 to meet the increased security and reliability demand by next-generation power-intensive deployments in Singapore. During the quarter, Singtel together with Globe Telecom, Inc. (“Globe”), launched Trustwave Managed Security Services to help enterprises in the Philippines protect against cyber attacks. The services are delivered through Globe’s Advanced Security Operations Centre (“ASOC”) in Manila, a new facility operated by Trustwave. The launch of the services through the ASOC advances the Memorandum of Understanding which Singtel and Globe had signed in December 2015 to strengthen Globe’s information security capabilities.

Singapore Telecommunications Ltd And Subsidiary Companies Page 35 SECTION 3 : GROUP ENTERPRISE
Singtel also announced that it had entered into a consortium agreement to co-build a new international submarine cable system named INDIGO. The INDIGO cable system will span approximately 9,000 kilometres and connect Singapore and Perth, and onwards to Sydney. The construction of the INDIGO cable system is expected to be completed by mid-2019. Singtel continued to be recognised as a leading next-generation telecom service provider in the Asia Pacific, enabling digital transformation with its extensive suite of cloud and cyber security services portfolio.13 For the Year Ended 31 March 2017 For the year ended 31 March 2017, Group Enterprise’s operating revenue grew 3.2%. This was contributed by higher cyber security and other ICT services offsetting the decline in traditional carriage services. Overall EBITDA declined 2.3% and EBIT declined by 5.1% after including the amortisation of acquired intangibles of Trustwave. Excluding Trustwave, EBITDA and EBIT would have declined by 1.2% and 1.8% respectively. SEQUENTIAL QUARTERLY RESULTS Results for the current quarter compared to the preceding quarter ended 31 December 2016 were as follows:
31 Mar
Operating revenue 1,723 1,685 2.3
Operating expenses (1,269) (1,243) 2.1
EBITDA 466 455 2.2
- margin 27.0% 27.0%
EBIT 294 299 -1.5
Quarter
31 Dec QOQ
2017 2016 Chge
S$ m S$ m %
EBITDA grew 2.2% on higher operating revenue propelled by growth in ICT and Data and Internet revenues partially offset by decline in traditional carriage services. EBIT declined 1.5% mainly due to higher depreciation from the new Data Centre launched in December 2016.
13 IDC ITMarketScape: Asia/Pacific Next-Generation Telcos: Telecom Services 2016-2017 Vendor Assessment
Singapore Telecommunications Ltd And Subsidiary Companies Page 36 SECTION 3 : GROUP ENTERPRISE
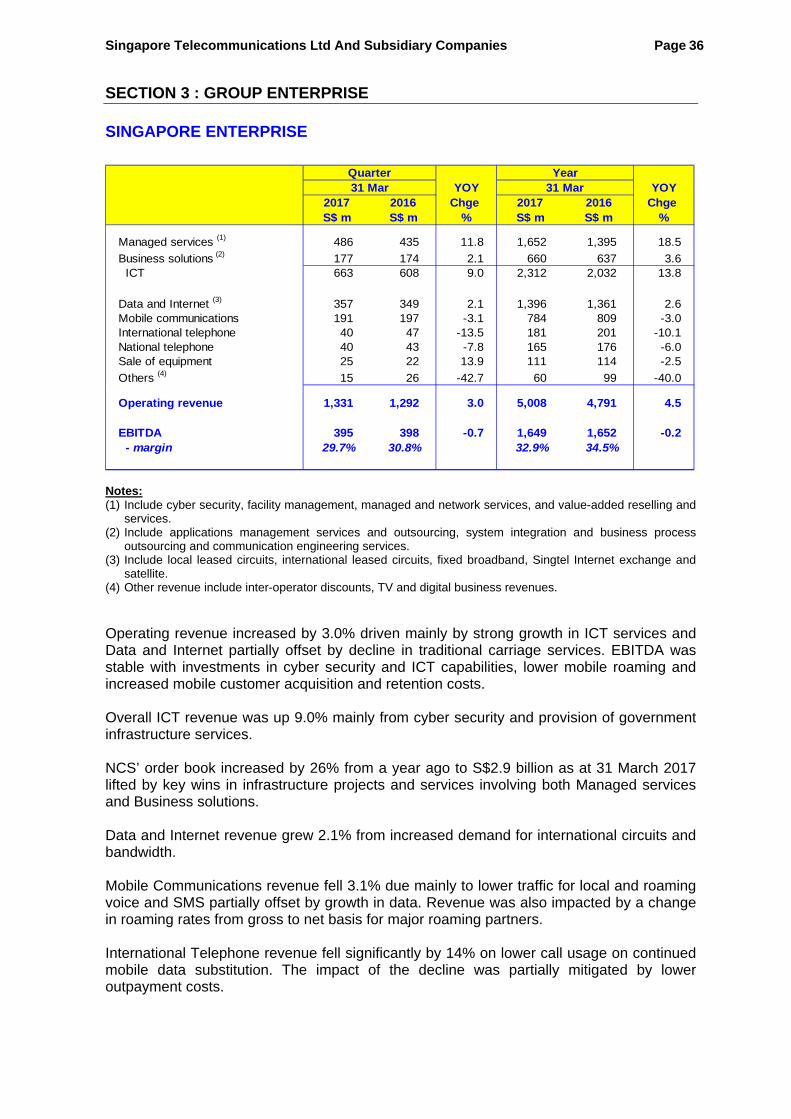
SINGAPORE ENTERPRISE
Managed services (1) 486 435 11.8 1,652 1,395 18.5
Business solutions (2) 177 174 2.1 660 637 3.6 ICT 663 608 9.0 2,312 2,032 13.8
Data and Internet (3) 357 349 2.1 1,396 1,361 2.6Mobile communications 191 197 -3.1 784 809 -3.0International telephone 40 47 -13.5 181 201 -10.1National telephone 40 43 -7.8 165 176 -6.0Sale of equipment 25 22 13.9 111 114 -2.5
Others (4) 15 26 -42.7 60 99 -40.0
Operating revenue 1,331 1,292 3.0 5,008 4,791 4.5
EBITDA 395 398 -0.7 1,649 1,652 -0.2 - margin 29.7% 30.8% 32.9% 34.5%
Quarter Year31 Mar YOY 31 Mar YOY
%2017 2016 Chge 2017 2016 Chge S$ m S$ m % S$ m S$ m
Notes: (1) Include cyber security, facility management, managed and network services, and value-added reselling and
services. (2) Include applications management services and outsourcing, system integration and business process
outsourcing and communication engineering services. (3) Include local leased circuits, international leased circuits, fixed broadband, Singtel Internet exchange and
satellite. (4) Other revenue include inter-operator discounts, TV and digital business revenues. Operating revenue increased by 3.0% driven mainly by strong growth in ICT services and Data and Internet partially offset by decline in traditional carriage services. EBITDA was stable with investments in cyber security and ICT capabilities, lower mobile roaming and increased mobile customer acquisition and retention costs. Overall ICT revenue was up 9.0% mainly from cyber security and provision of government infrastructure services. NCS’ order book increased by 26% from a year ago to S$2.9 billion as at 31 March 2017 lifted by key wins in infrastructure projects and services involving both Managed services and Business solutions. Data and Internet revenue grew 2.1% from increased demand for international circuits and bandwidth. Mobile Communications revenue fell 3.1% due mainly to lower traffic for local and roaming voice and SMS partially offset by growth in data. Revenue was also impacted by a change in roaming rates from gross to net basis for major roaming partners. International Telephone revenue fell significantly by 14% on lower call usage on continued mobile data substitution. The impact of the decline was partially mitigated by lower outpayment costs.
Singapore Telecommunications Ltd And Subsidiary Companies Page 37 SECTION 3 : GROUP ENTERPRISE
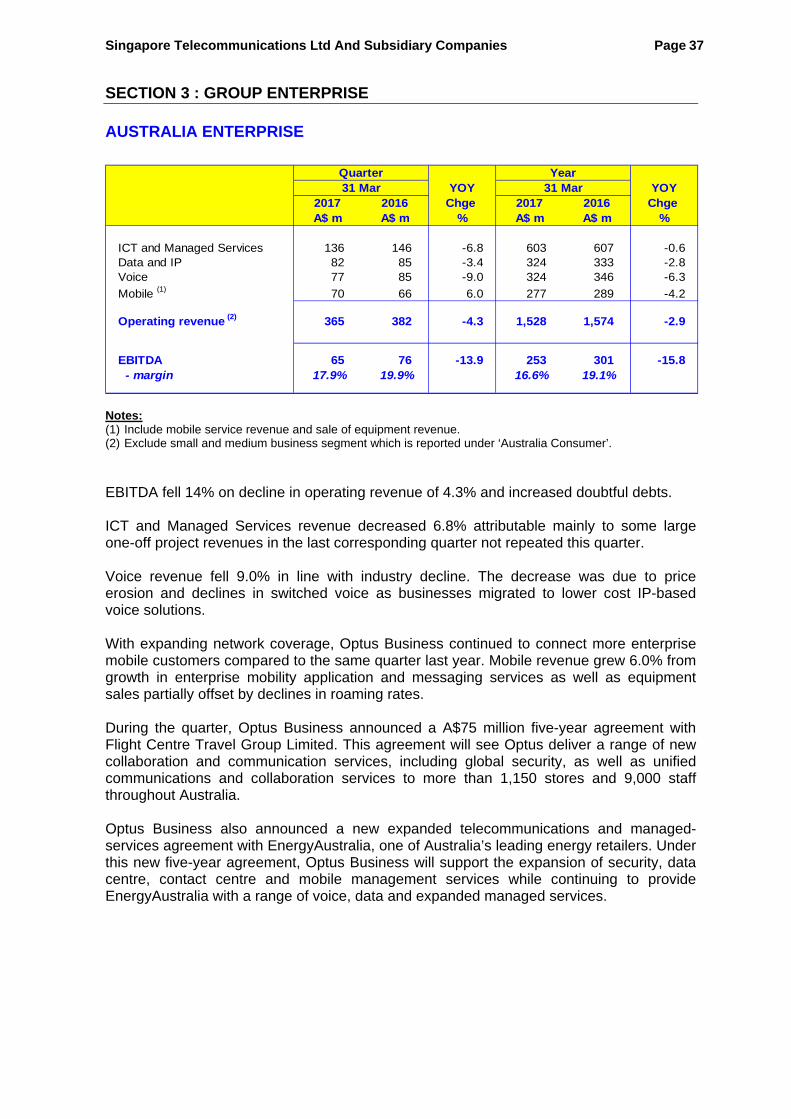
AUSTRALIA ENTERPRISE
ICT and Managed Services 136 146 -6.8 603 607 -0.6Data and IP 82 85 -3.4 324 333 -2.8Voice 77 85 -9.0 324 346 -6.3
Mobile (1) 70 66 6.0 277 289 -4.2
Operating revenue (2) 365 382 -4.3 1,528 1,574 -2.9
EBITDA 65 76 -13.9 253 301 -15.8 - margin 17.9% 19.9% 16.6% 19.1%
31 Mar YOY 31 Mar YOYQuarter Year
%2017 2016 Chge 2017 2016 Chge A$ m A$ m % A$ m A$ m
Notes: (1) Include mobile service revenue and sale of equipment revenue. (2) Exclude small and medium business segment which is reported under ‘Australia Consumer’. EBITDA fell 14% on decline in operating revenue of 4.3% and increased doubtful debts. ICT and Managed Services revenue decreased 6.8% attributable mainly to some large one-off project revenues in the last corresponding quarter not repeated this quarter. Voice revenue fell 9.0% in line with industry decline. The decrease was due to price erosion and declines in switched voice as businesses migrated to lower cost IP-based voice solutions. With expanding network coverage, Optus Business continued to connect more enterprise mobile customers compared to the same quarter last year. Mobile revenue grew 6.0% from growth in enterprise mobility application and messaging services as well as equipment sales partially offset by declines in roaming rates. During the quarter, Optus Business announced a A$75 million five-year agreement with Flight Centre Travel Group Limited. This agreement will see Optus deliver a range of new collaboration and communication services, including global security, as well as unified communications and collaboration services to more than 1,150 stores and 9,000 staff throughout Australia. Optus Business also announced a new expanded telecommunications and managed-services agreement with EnergyAustralia, one of Australia’s leading energy retailers. Under this new five-year agreement, Optus Business will support the expansion of security, data centre, contact centre and mobile management services while continuing to provide EnergyAustralia with a range of voice, data and expanded managed services.

Singapore Telecommunications Ltd And Subsidiary Companies Page 38 SECTION 4 : GROUP DIGITAL LIFE
GROUP DIGITAL LIFE
MANAGEMENT DISCUSSION AND ANALYSIS
Group Digital Life (“GDL”) focuses on using the latest Internet technologies and assets of the Group’s operating companies to develop new revenue and growth engines by entering into adjacent businesses where it has a competitive advantage. GDL has three key businesses – digital marketing (Amobee), regional premium OTT video (HOOQ) and advanced analytics and intelligence capabilities (DataSpark), and it also serves as Singtel’s digital innovation engine through Innov8.
FINANCIAL HIGHLIGHTS
FOR THE FOURTH QUARTER ENDED 31 MARCH 2017
Operating revenue at S$127 million – up 5.8%.
Negative EBITDA of S$36 million.
Including amortisation of acquired intangibles, negative EBIT of S$53 million.
FOR THE YEAR ENDED 31 MARCH 2017
Operating revenue at S$539 million – up 19%.
Negative EBITDA of S$122 million.
Negative EBIT of S$190 million.
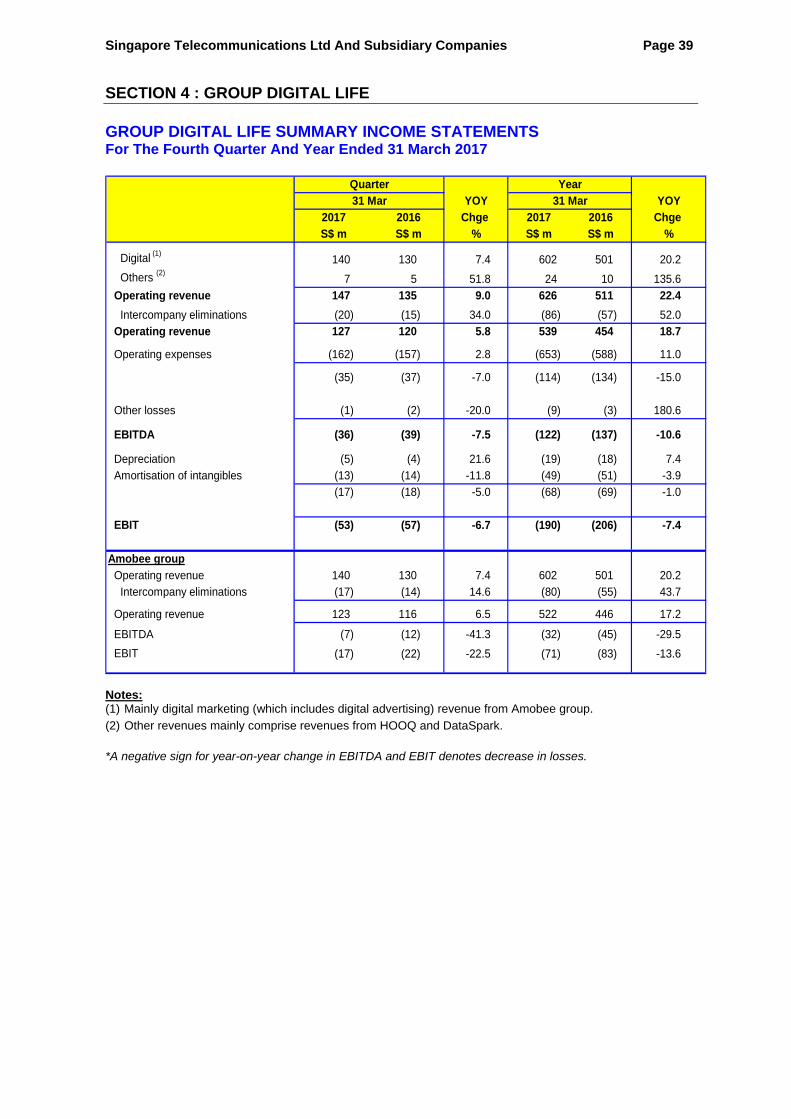
Singapore Telecommunications Ltd And Subsidiary Companies Page 39 SECTION 4 : GROUP DIGITAL LIFE GROUP DIGITAL LIFE SUMMARY INCOME STATEMENTS For The Fourth Quarter And Year Ended 31 March 2017
Digital (1)140 130 7.4 602 501 20.2
Others (2)7 5 51.8 24 10 135.6
Operating revenue 147 135 9.0 626 511 22.4
Intercompany eliminations (20) (15) 34.0 (86) (57) 52.0
Operating revenue 127 120 5.8 539 454 18.7
Operating expenses (162) (157) 2.8 (653) (588) 11.0
(35) (37) -7.0 (114) (134) -15.0
Other losses (1) (2) -20.0 (9) (3) 180.6
EBITDA (36) (39) -7.5 (122) (137) -10.6
Depreciation (5) (4) 21.6 (19) (18) 7.4
Amortisation of intangibles (13) (14) -11.8 (49) (51) -3.9
(17) (18) -5.0 (68) (69) -1.0
(53) (57) -6.7 (190) (206) -7.4
Operating revenue 140 130 7.4 602 501 20.2
Intercompany eliminations (17) (14) 14.6 (80) (55) 43.7
Operating revenue 123 116 6.5 522 446 17.2
EBITDA (7) (12) -41.3 (32) (45) -29.5
(17) (22) -22.5 (71) (83) -13.6
Chge 2017 2016 Chge
Year
YOY 31 Mar YOY
% S$ m S$ m %
EBIT
Amobee group
EBIT
S$ m
Quarter
S$ m
2017 2016
31 Mar
Notes:
(1) Mainly digital marketing (which includes digital advertising) revenue from Amobee group.
(2) Other revenues mainly comprise revenues from HOOQ and DataSpark.
*A negative sign for year-on-year change in EBITDA and EBIT denotes decrease in losses.

Singapore Telecommunications Ltd And Subsidiary Companies Page 40 SECTION 4 : GROUP DIGITAL LIFE
Cost of sales (1)110 103 7.3 445 347 28.0
Staff costs 33 33 0.3 135 156 -13.6
Selling & administrative (1)16 17 -8.3 60 68 -12.2
Others 3 5 -40.0 13 16 -16.4
Operating expenses 162 157 653 588
Quarter Year31 Mar YOY 31 Mar YOY
2017 2016 Chge 2017 2016 Chge
2.8 11.0
S$ m S$ m % S$ m S$ m %
Note:
(1) Comparatives have been restated to be consistent with current quarter/year. GROUP DIGITAL LIFE OPERATING HIGHLIGHTS For The Fourth Quarter Ended 31 March 2017 Operating revenue for the quarter grew 5.8% to S$127 million, driven by higher advertising revenue mainly from Amobee’s social, video and display businesses. Excluding revenue from low-margin Amobee’s publisher business which ceased operations in the preceding quarter, operating revenue grew 16%. Negative EBITDA decreased by 7.5% to S$36 million mainly due to lower losses at Amobee, partly offset by higher investments in content and marketing spend as HOOQ ramped up its businesses. Negative EBIT was S$53 million, after accounting for depreciation and amortisation of acquired intangibles for Amobee group. Amobee continued to expand its suite of solutions for social. In the quarter, it provides customers the opportunity to augment their digital, video and mobile marketing campaigns by showcasing their brands on Instagram Stories in between user stories. Amobee also launched its Pinterest digital advertising solutions in Australia, helping brands to scale their presence on Pinterest to reach audiences. Burt’s Bees, a US Unilever-owned organic beauty brand, is a new client added to Amobee Instagram Stories. Other new clients added in the quarter included Arby’s, Valvoline and Georgia Pacific. On 10 April 2017, Amobee completed the acquisition of Turn, Inc., (“Turn”) a leading provider of a global technology platform for marketers and agencies. With this acquisition, Amobee is now one of the largest independent digital marketing technology company globally with a strong platform for growth. This acquisition also expanded Amobee’s existing programmatic and data management capabilities and offered marketers an independent end-to-end advertising and data management platform across all channels, formats and devices, as well as advanced analytics and media planning capabilities. HOOQ launched its transactional video-on-demand (“TVOD”) service in the Philippines, India, Indonesia and Thailand in this quarter, and is the first player in Asia to introduce the Bonus TVOD service, enabling customers to enjoy watching a movie per month from the VOD rental store as part of their monthly subscription. Bonus TVOD is available in the Philippines, Indonesia and Thailand.
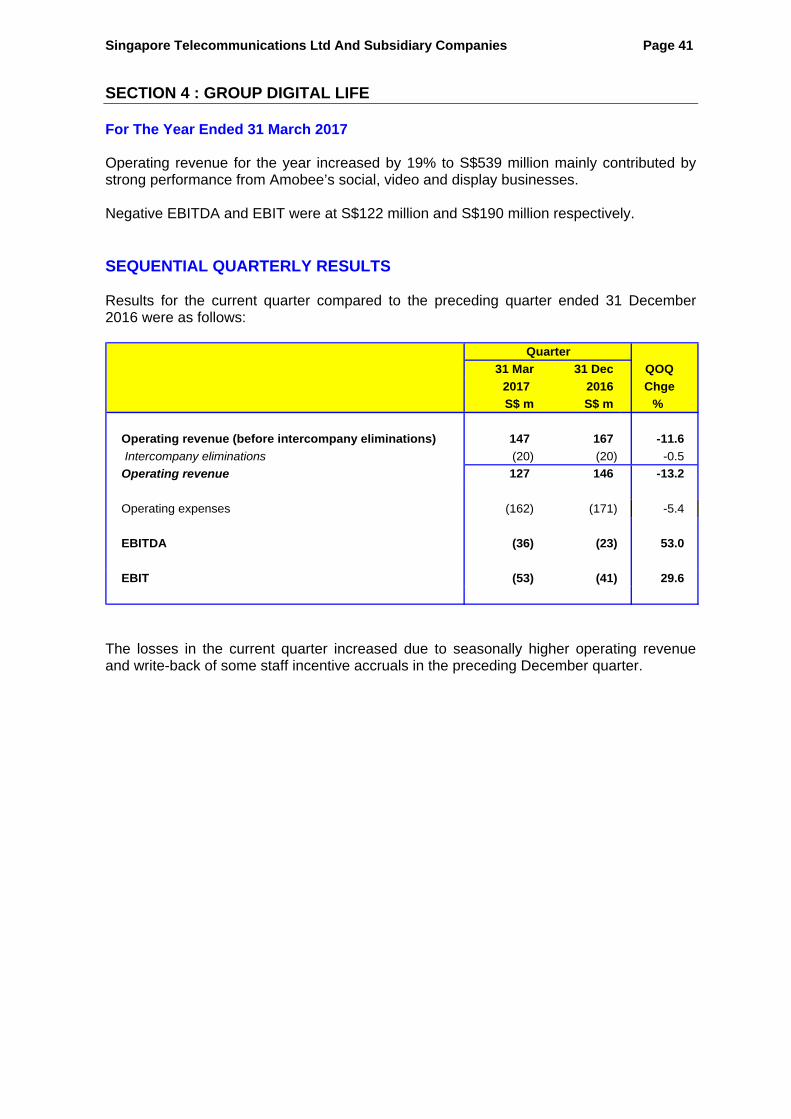
Singapore Telecommunications Ltd And Subsidiary Companies Page 41 SECTION 4 : GROUP DIGITAL LIFE For The Year Ended 31 March 2017 Operating revenue for the year increased by 19% to S$539 million mainly contributed by strong performance from Amobee’s social, video and display businesses. Negative EBITDA and EBIT were at S$122 million and S$190 million respectively. SEQUENTIAL QUARTERLY RESULTS Results for the current quarter compared to the preceding quarter ended 31 December 2016 were as follows:
31 Mar 31 Dec QOQ
2017 2016 Chge
S$ m S$ m %
Operating revenue (before intercompany eliminations) 147 167 -11.6
Intercompany eliminations (20) (20) -0.5
Operating revenue 127 146 -13.2
Operating expenses (162) (171) -5.4
EBITDA (36) (23) 53.0
EBIT (53) (41) 29.6
Quarter
The losses in the current quarter increased due to seasonally higher operating revenue and write-back of some staff incentive accruals in the preceding December quarter.

Singapore Telecommunications Ltd And Subsidiary Companies Page 42 SECTION 5: ASSOCIATES / JOINT VENTURES
FINANCIAL HIGHLIGHTS FOR THE FOURTH QUARTER ENDED 31 MARCH 2017
With weaker profits at Airtel, the associates’ pre-tax and post-tax underlying profit14 contributions were stable.
Excluding Airtel, pre-tax and post-tax underlying profit14 contributions increased 13% and 12% respectively mainly from Telkomsel, NetLink Trust and Intouch (acquired in November 2016) partly offset by declines at AIS and Globe.
If the regional currencies had remained stable from last corresponding quarter, the pre-tax and post-tax underlying profit14 contributions from the associates would have declined by 1.5% and 2.3% respectively.
The Group’s combined mobile customer base15 was 638 million, stable from a quarter ago.
FOR THE YEAR ENDED 31 MARCH 2017 Associates’ pre-tax and post-tax underlying profit14 contributions grew by
5.4% and 8.4% respectively. Excluding Airtel, pre-tax and post-tax underlying profit14 contributions would grow by 12% and 13% respectively mainly from Telkomsel, NetLink Trust and Intouch, partly offset by declines at AIS and Globe.
If the regional currencies had remained stable from last year, the pre-tax and post-tax underlying profit14 contributions from the associates would have increased by 5.6% and 8.3% respectively.
14 Exclude certain exceptional items of Airtel, AIS and SingPost classified under exceptional items of Singtel Group. 15 Combined mobile customer base here refers to the total number of mobile customers in Singtel, Optus and the
regional associates.
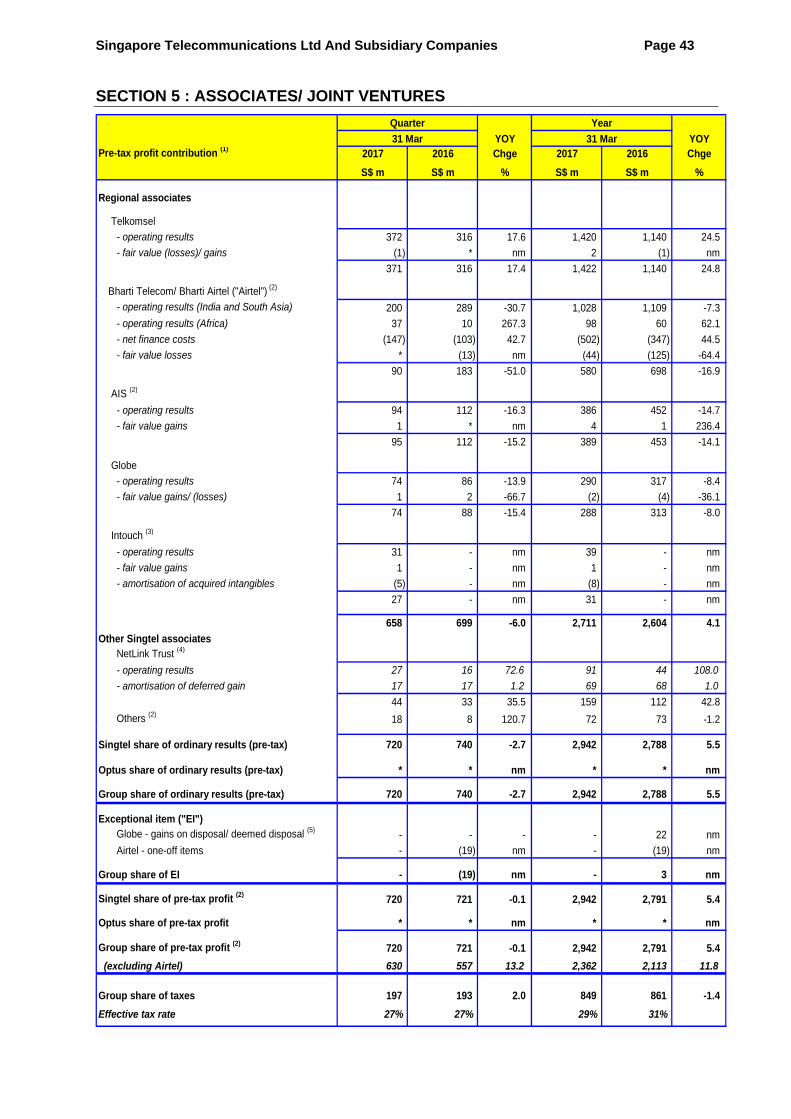
Singapore Telecommunications Ltd And Subsidiary Companies Page 43 SECTION 5 : ASSOCIATES/ JOINT VENTURES
Pre-tax profit contribution (1) 2017 2016 2017 2016
S$ m S$ m S$ m S$ m
Regional associates
Telkomsel
- operating results 372 316 17.6 1,420 1,140 24.5
- fair value (losses)/ gains (1) * nm 2 (1) nm
371 316 17.4 1,422 1,140 24.8
Bharti Telecom/ Bharti Airtel ("Airtel") (2)
- operating results (India and South Asia) 200 289 -30.7 1,028 1,109 -7.3
- operating results (Africa) 37 10 267.3 98 60 62.1
- net finance costs (147) (103) 42.7 (502) (347) 44.5
- fair value losses * (13) nm (44) (125) -64.4
90 183 -51.0 580 698 -16.9
AIS (2)
- operating results 94 112 -16.3 386 452 -14.7
- fair value gains 1 * nm 4 1 236.4
95 112 -15.2 389 453 -14.1
Globe
- operating results 74 86 -13.9 290 317 -8.4
- fair value gains/ (losses) 1 2 -66.7 (2) (4) -36.1
74 88 -15.4 288 313 -8.0
Intouch (3)
- operating results 31 - nm 39 - nm
- fair value gains 1 - nm 1 - nm
- amortisation of acquired intangibles (5) - nm (8) - nm
27 - nm 31 - nm
658 699 -6.0 2,711 2,604 4.1
Other Singtel associates NetLink Trust (4)
- operating results 27 16 72.6 91 44 108.0
- amortisation of deferred gain 17 17 1.2 69 68 1.0
44 33 35.5 159 112 42.8
Others (2)18 8 120.7 72 73 -1.2
Singtel share of ordinary results (pre-tax) 720 740 -2.7 2,942 2,788 5.5
Optus share of ordinary results (pre-tax) * * nm * * nm
Group share of ordinary results (pre-tax) 720 740 -2.7 2,942 2,788 5.5
Exceptional item ("EI") Globe - gains on disposal/ deemed disposal (5) - - - - 22 nm
Airtel - one-off items - (19) nm - (19) nm
Group share of EI - (19) nm - 3 nm
Singtel share of pre-tax profit (2) 720 721 -0.1 2,942 2,791 5.4
Optus share of pre-tax profit * * nm * * nm
Group share of pre-tax profit (2) 720 721 -0.1 2,942 2,791 5.4
(excluding Airtel) 630 557 13.2 2,362 2,113 11.8
Group share of taxes 197 193 2.0 849 861 -1.4
Effective tax rate 27% 27% 29% 31%
Quarter
31 Mar YOYChge
%
Year
31 Mar YOYChge
%
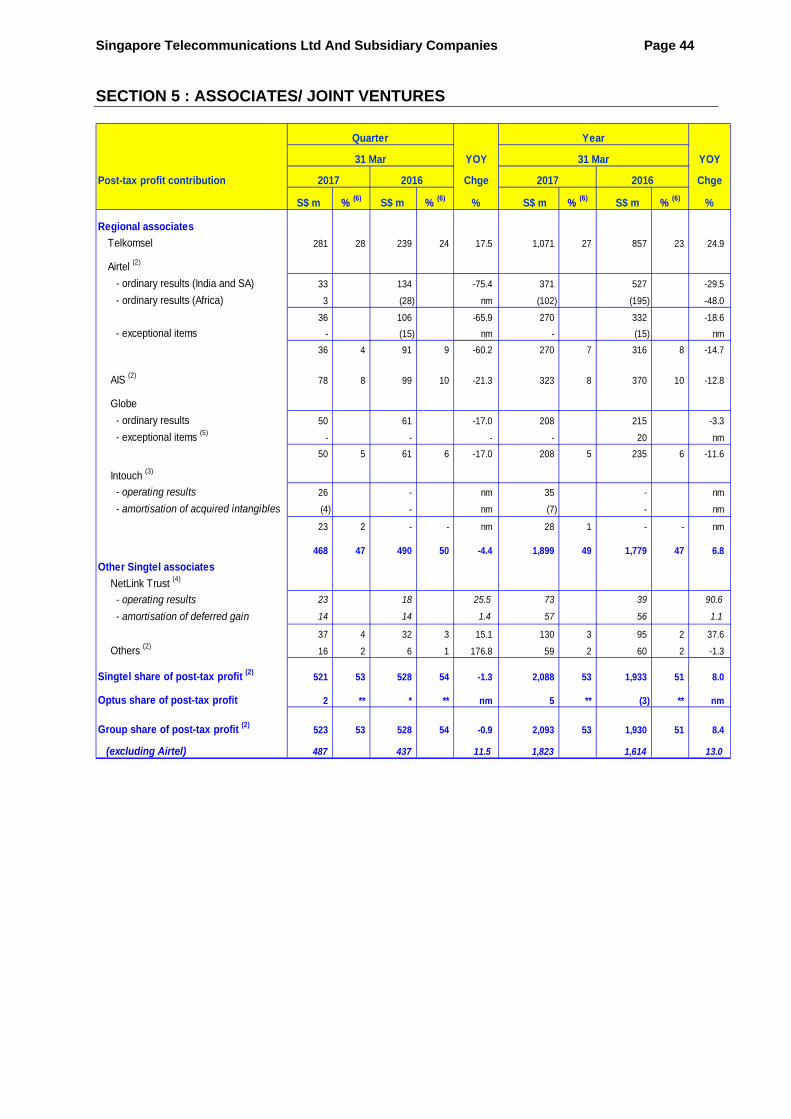
Singapore Telecommunications Ltd And Subsidiary Companies Page 44 SECTION 5 : ASSOCIATES/ JOINT VENTURES
Post-tax profit contribution
S$ m % (6) S$ m % (6) S$ m % (6) S$ m % (6)
Regional associates
Telkomsel 281 28 239 24 17.5 1,071 27 857 23 24.9
Airtel (2)
- ordinary results (India and SA) 33 134 -75.4 371 527 -29.5
- ordinary results (Africa) 3 (28) nm (102) (195) -48.0
36 106 -65.9 270 332 -18.6
- exceptional items - (15) nm - (15) nm
36 4 91 9 -60.2 270 7 316 8 -14.7
AIS (2)78 8 99 10 -21.3 323 8 370 10 -12.8
Globe
- ordinary results 50 61 -17.0 208 215 -3.3
- exceptional items (5)- - - - 20 nm
50 5 61 6 -17.0 208 5 235 6 -11.6
Intouch (3)
- operating results 26 - nm 35 - nm
- amortisation of acquired intangibles (4) - nm (7) - nm
23 2 - - nm 28 1 - - nm
468 47 490 50 -4.4 1,899 49 1,779 47 6.8
Other Singtel associates
NetLink Trust (4)
- operating results 23 18 25.5 73 39 90.6
- amortisation of deferred gain 14 14 1.4 57 56 1.1
37 4 32 3 15.1 130 3 95 2 37.6
Others (2)16 2 6 1 176.8 59 2 60 2 -1.3
Singtel share of post-tax profit (2)521 53 528 54 -1.3 2,088 53 1,933 51 8.0
Optus share of post-tax profit 2 ** * ** nm 5 ** (3) ** nm
Group share of post-tax profit (2)523 53 528 54 -0.9 2,093 53 1,930 51 8.4
(excluding Airtel) 487 437 11.5 1,823 1,614 13.0
%
2016
Quarter
31 Mar
2017
YOY
Chge
%
Year
31 Mar YOY
2017 2016 Chge

Singapore Telecommunications Ltd And Subsidiary Companies Page 45 SECTION 5 : ASSOCIATES/ JOINT VENTURES
Post-tax profit contribution
(in constant currency) (7) 2017 2016 2017 2016
S$ m S$ m S$ m S$ m
Regional associates
- operating results 651 710 -8.2 2,767 2,732 1.3
- fair value losses 1 (10) nm (44) (128) -65.9
- amortisation of acquired intangibles (5) - nm (8) - nm
648 699 -7.4 2,715 2,604 4.3
Other associates 63 41 52.8 231 184 25.4
Group share of ordinary results 710 740 -4.1 2,946 2,788 5.7
Group share of exceptional items - (19) nm - 3 nm
Group share of pre-tax profit 710 721 -1.5 2,946 2,791 5.6
Group share of tax expense (195) (193) 0.8 (856) (861) -0.6
Group share of post-tax profit 516 528 -2.3 2,091 1,930 8.3
Excluding Airtel:
Group share of pre-tax profit 623 557 11.8 2,348 2,113 11.2
Group share of tax expense (142) (120) 17.9 (536) (499) 7.4
Group share of post-tax profit 481 437 10.1 1,812 1,614 12.3
%
Quarter
31 Mar YOY
Chge
%
Year
31 Mar YOY
Chge
Notes:
(1) The accounts of the associates are prepared based on local GAAP. Where applicable, the accounting policies of the associates have been restated for compliance with the Group’s accounting policies.
(2) Share of results excluded the Group’s share of exceptional items of Airtel and SingPost as well as AIS’ handset subsidy costs which have been classified as exceptional items of the Group.
(3) Intouch, which Singtel acquired an equity interest of 21.0% in November 2016, has an equity interest of 40.5% in AIS.
(4) NetLink Trust is 100% owned by Singtel and is equity accounted as an associate in the Group as Singtel does not control it. The deferred gain arose from Singtel’s gain on disposal of assets and business to NetLink Trust in prior years, which was deferred in the Group’s balance sheet and amortised over the useful lives of the transferred assets.
(5) Gains on disposal/ deemed disposal in the last corresponding period relate to Globe’s disposal of equity interest in Yondu, Inc. and fair valuation of its previously held equity interest in Bayan Telecommunications, Inc.
(6) Shows the post-tax profit contribution of the associates to the Group’s underlying net profit.
(7) Assuming constant exchange rates for the regional currencies (Indian Rupee, Indonesian Rupiah, Philippine Peso and Thai Baht) from the corresponding periods ended 31 March 2016.
“*” denotes less than S$0.5 million and “**” denotes less than 0.05% With weaker Airtel’s earnings due to aggressive price competition in India, the associates’ pre-tax underlying profit contributions were stable. Excluding Airtel, the associates’ pre-tax underlying profit contributions grew 13% mainly from Telkomsel, NetLink Trust and contribution from Intouch which was acquired in November 2016, partially offset by declines at Globe and AIS.
Singapore Telecommunications Ltd And Subsidiary Companies Page 46 SECTION 5 : ASSOCIATES/ JOINT VENTURES
The share of taxes of associates grew 2.0% mainly due to one-time deferred tax asset recognised by AIS in the last corresponding quarter. On a post-tax basis, the associates’ underlying profit contributions were stable at S$523 million and contributed 53% to the Group’s underlying net profit, down 1 percentage point from the same quarter last year. Excluding Airtel, the associates’ post-tax underlying profit contributions were up 12%. Telkomsel registered strong growth in earnings with double-digit growth in both operating revenue and EBITDA driven by voice, data and digital revenues. Airtel recorded weaker revenue and earnings from sustained aggressive pricing by the new market entrant in India, as well as higher depreciation, spectrum amortisation charges and related finance costs. AIS recorded higher operating revenue but earnings were lower due to increased spectrum amortisation charges and financing costs. Globe reported higher revenue and EBITDA but its earnings were lower due to higher depreciation charges as well as equity accounted losses and interest expense from its acquisition of Vega Telecom, Inc. NetLink Trust’s operating revenue and earnings continued to grow at double-digit on increased fibre penetration in Singapore. PT Telekomunikasi Selular (“Telkomsel”) Telkomsel is the leading operator of cellular telecommunications services in Indonesia with 136,000 radio base stations (of which 63% are 3G/4G base transceiver stations) providing nationwide coverage. Telkomsel continued to expand its network with a focus on growing data and digital services. In the quarter, Telkomsel added approximately 7,600 3G/4G radio base stations. Telkomsel continued to register double-digit growth in its revenue, EBITDA and net profit. Operating revenue was up 10% year-on-year boosted by growth across voice, data and digital businesses. Voice revenue grew 11% mainly driven by a higher customer base, improvement in network quality and migration of pay per use to voice packages. Data and digital services rose a robust 23% with higher data usage amid continued strong take-up of smartphones. EBITDA rose 13% despite higher operation and maintenance costs from accelerated network deployment and increased marketing expenses. The Group’s share of Telkomsel’s pre-tax profit rose 15% in Indonesian Rupiah terms after including higher depreciation charges. With the 2% appreciation of the Indonesian Rupiah against the Singapore Dollar this quarter, the Group’s share of Telkomsel’s pre-tax profit grew 17% from the same quarter last year. On a post-tax basis, Telkomsel’s profit contribution for the quarter increased 18% to S$281 million which constituted 28% of the Group’s underlying net profit, up 4 percentage points from the last corresponding quarter. Compared to the preceding quarter, Telkomsel’s operating revenue declined 3% in Indonesian Rupiah terms due to seasonality while EBITDA grew 4% on lower marketing expenses and staff costs. Telkomsel recorded a net decline of 4.6 million mobile customers in the quarter on increased churn following the cessation of festive promotions. The total mobile customer base grew 16 million or 10% from a year ago to 169 million, including 90 million of data customers at end of March 2017.
Singapore Telecommunications Ltd And Subsidiary Companies Page 47 SECTION 5 : ASSOCIATES/ JOINT VENTURES
Bharti Telecom Group (“Airtel”) Airtel is listed on the Indian Stock Exchanges - National Stock Exchange and the Bombay Stock Exchange. It is a leading integrated telecommunications company with operations in 17 countries across Asia and Africa, offering telecom services under wireless and fixed line technology, national and international long distance connectivity, digital TV and integrated telecom solutions to its enterprise customers. Airtel also owns tower infrastructure pertaining to telecom operations through its subsidiary and joint venture companies. Airtel has voluntarily reported consolidated financial statements based on IFRS in the Indian Stock Exchanges since April 2010. With effect from 1 April 2016, Airtel adopted Indian Accounting Standards as required by the local authorities. Consequently, Airtel ceased to report consolidated financial statements based on IFRS in the Indian Stock Exchanges. The consolidated financial statements of Airtel used for equity accounting by Singtel continued to be based on IFRS. On 28 March 2017, Airtel sold 10.3% of its equity shareholding in Bharti Infratel Limited (“Infratel”) to a consortium of funds advised by KKR and Canada Pension Plan Investment Board. Following the sale, Airtel’s effective equity shareholding in Infratel fell to 61.7%. India and Sri Lanka (“India and South Asia”) In the quarter, Airtel entered into a definitive agreement with Tikona Digital Networks to acquire Tikona’s 4G business in India, including its 100 MHz spectrum in 2300 MHz band as well as 350 sites in 5 telecom circles. Airtel also entered into a definitive agreement with Telenor South Asia Investments Pte Ltd to acquire its operations in 7 telecom circles and 43.4 MHz spectrum in the 1800 MHz band. The closing of the transactions are subject to regulatory approvals and other closing conditions. The transactions will augment Airtel’s overall customer base and 4G spectrum assets in India. Airtel rolled out 4G services in the state of Jammu and Kashmir. With this, 4G services are now available in all 22 telecom circles across India. In India, Airtel’s operating performance continued to be adversely affected by the entry of the new operator which offered free voice and data. Operating revenue fell 7% for the quarter with 11% decline in mobile revenue partly mitigated by growth in non-mobile segments. Traffic volume for voice grew a steep 24% with the introduction of bundled offers with unlimited voice. Consequently, voice realisation per minute fell 27%. Data traffic volume rose 53% but data realisation per MB fell 47% on competitive pressures. Despite lower operating revenue, Airtel India extended its revenue market share leadership with good execution of its strategy. With a decline in operating revenue, EBITDA correspondingly declined 13%. Results of ‘South Asia’ comprised operations in Sri Lanka and Bangladesh in the corresponding quarter last year. With the deconsolidation of Airtel Bangladesh in November 2016, operating revenue and net losses in South Asia declined significantly by 78% and 66% respectively.

Singapore Telecommunications Ltd And Subsidiary Companies Page 48 SECTION 5 : ASSOCIATES/ JOINT VENTURES
With incremental depreciation from network assets and higher spectrum amortisation charges in India, the Group’s share of pre-tax operating profit (before finance costs and fair value adjustments) from India and South Asia declined 32% in Indian Rupee terms. Pre-tax operating profit contribution fell 31% to S$200 million after accounting for the 2% appreciation of the Indian Rupee against the Singapore Dollar. Compared to the preceding quarter, Airtel’s revenue and EBITDA from its India and South Asia operations declined 6% and 8% respectively. Airtel added 7.8 million mobile customers in India this quarter, up from 5.9 million added in the preceding quarter, with churn improving to 3.6% from 4.1% in the preceding quarter despite the tough environment. As at 31 March 2017, Airtel had 274 million mobile customers in India, an increase of 22 million or 8.9% from a year ago. The number of data customers increased 2.4 million this quarter, reversing the decline seen in the preceding quarter, but declined 1.5% from a year ago at 57 million, representing 21% of its total mobile customer base. Africa As at 31 March 2017, ‘Airtel Money’ and 3G services were available across all the 15 African countries that Airtel has presence in, while 4G services were available in 3 African countries. In this quarter, Airtel gained market share in some key geographies. In constant currency terms, Africa’s operating revenue declined 6%. Excluding the disposed subsidiaries in Africa, operating revenue grew 2% with strong data revenue growth of 15% driven by higher data consumption and penetration. EBITDA improved 39% driven by strong cost control measures. In reported US Dollar terms, however, operating revenue fell 21%. Excluding the disposed subsidiaries in Africa, operating revenue fell 14% impacted by the steep depreciation of the Nigerian’s Naira while EBITDA improved 13%. Compared to the preceding quarter, Airtel Africa’s operating revenue declined 3% while EBITDA grew 6% in constant currency terms. In reported US Dollar terms, operating revenue declined 5% while EBITDA grew 3%. With lower depreciation charges, the Group’s share of Airtel Africa’s pre-tax operating profit (before finance costs and fair value losses) more than tripled to S$37 million. Airtel Africa recorded a net decline of 0.3 million mobile customers in the quarter due to disconnections as a result of regulatory compliances in certain African countries. As at 31 March 2017, the mobile customer base stood at 80 million16, stable from a year ago due to divestment of operations in Burkina Faso and Sierra Leone. The number of data customers was 18 million, representing 23% of total mobile customer base. In the quarter, Airtel and Millicom International Cellular S.A. (“Millicom”), through their respective subsidiaries, signed an agreement to combine their operations in Ghana. Airtel and Millicom would have equal ownership and governance rights in the joint entity. The merger is subject to closing conditions and regulatory approvals.
16 Adjusting for the divestment of operations in Burkina Faso and Sierra Leone, the number of mobile subscribers
grew 5.4 million or 7.2% from a year ago.

Singapore Telecommunications Ltd And Subsidiary Companies Page 49 SECTION 5 : ASSOCIATES/ JOINT VENTURES
Overall At the consolidated level, Airtel’s operating revenue, EBITDA and EBIT declined 12%, 13% and 31% respectively. The Group’s share of net finance costs increased sharply by 43% mainly on increased spectrum related finance costs in India. The share of fair value losses (mainly derivatives and forex losses) amounted to S$0.4 million as the Indian Rupee appreciated against the US Dollar, down significantly from S$13 million in the last corresponding quarter. Consequently, the Group’s share of overall pre-tax profit from Airtel declined 51% to S$90 million. Post-tax underlying profit contribution, however, declined 60% to S$36 million. Airtel’s effective tax rate in India increased on account of reversal/ reduction of tax holiday benefits in certain telecom circles. Consequently, on a post-tax basis, Airtel’s contribution to the Group’s underlying net profit declined to 4% (Q4 FY2016: 9%). Airtel also recorded some one-off exceptional losses this quarter which have been classified as exceptional items of the Group (see page 16). The exceptional items comprised mainly regulatory levies, litigation related charges and costs related to its network re-farming and upgrading programme. Including mobile customers across operations in 17 countries covering India, Sri Lanka and Africa, Airtel’s total mobile customer base across all geographies was 356 million as at 31 March 2017. This represented a growth of 14 million or 4.0%, or a growth of 22 million or 6.6% excluding operations in Bangladesh, from a year ago. Advanced Info Service (“AIS”) AIS, the largest mobile communications operator in Thailand, is listed on the Stock Exchange of Thailand. AIS provides mobile services on 2G, 3G and 4G networks. In the current quarter, AIS’ service revenue (excluding interconnect) increased 4% underpinned by higher data consumption driven by improved 4G network coverage and higher postpaid and fixed broadband revenues. AIS’ EBITDA (before handset subsidy) grew 8%17 on lower universal service obligation and regulatory fees partially offset by higher network costs from network expansion and payments to TOT Public Company Limited for the lease of 2100 MHz spectrum, towers, equipment and facilities. With higher amortisation charges from 900 MHz and 1800 MHz spectrum, as well as higher spectrum financing costs, AIS’ pre-tax profit declined by 17%17
in Thai Baht terms. With the 2% appreciation of the Thai Baht against the Singapore Dollar, the Group’s share of AIS’ pre-tax profit declined 15% to S$95 million. On a post-tax basis, AIS’ underlying profit contribution for the quarter declined 21% to S$78 million on higher effective tax rate due to recognition of a deferred tax asset on past tax losses in the same quarter last year. AIS contributed 8% (Q4 FY2016: 10%) to the Group’s underlying net profit. This contribution excluded AIS’ handset subsidy costs relating to the migration of 2G handset customers to 3G/4G. The Group’s share of this cost of S$6 million has been classified as an exceptional item of the Group, consistent with prior periods (see Page 16).
17 Excluding 3G/4G handset subsidy costs classified as an exceptional item of Singtel Group. If such costs are not
excluded, AIS’ EBITDA and pre-tax profit would have increased by 29% and 6% respectively from the last corresponding quarter, and its EBITDA would have increased by 15% from the preceding quarter.
Singapore Telecommunications Ltd And Subsidiary Companies Page 50 SECTION 5 : ASSOCIATES/ JOINT VENTURES
Against the preceding quarter, service revenue (excluding interconnect) was stable while EBITDA increased 3% mainly due to lower staff costs, partly offset by higher mobile customer acquisition costs in the postpaid segment. In this quarter, AIS focused on acquiring more quality customers and shifted its mix of prepaid customers to the more profitable postpaid. As at 31 March 2017, its mobile customer base decreased by 0.4 million from a quarter ago, but increased 1.7 million or 4.4% from a year ago to 41 million. AIS continues to maintain its mobile market leadership position as well as being the largest network coverage operator in Thailand. Globe Telecom, Inc (“Globe”) Globe is listed on the Philippine Stock Exchange. Globe’s service revenue grew 4% driven by growth in data related services across mobile, broadband and corporate businesses as demand for internet and data connectivity continued to grow. Notwithstanding higher network costs to support the growing subscriber base and network expansion, Globe’s EBITDA rose 2%. Globe’s pre-tax profit declined 11% in Philippine Peso terms after including higher depreciation charges from its expanded asset base as well as the equity accounted losses and interest expense from the acquisition of Vega Telecom, Inc. With 5% depreciation of the Philippine Peso against the Singapore Dollar this quarter, the Group’s share of Globe’s pre-tax profit contribution decreased 15% to S$74 million. On a post-tax basis, Globe contributed S$50 million or 5% (Q4 FY2016: 6%) of the Group’s underlying net profit. Against the preceding quarter, Globe’s service revenue remained stable while EBITDA increased 7% with lower marketing expenses. As at 31 March 2017, Globe’s total mobile customer base was 59 million, 4.2 million lower than a quarter ago due to churn of prepaid subscribers who are inactive for more than 90 days compared to the previous 120 days. Compared to the same quarter a year ago, its mobile customer base was up 1.3 million or 2.3%. On 17 February 2017, Ant Financial Services Group, one of the world’s leading digital financial services providers, and Ayala Corporation entered into a strategic partnership with Globe to accelerate financial inclusion and upgrade payment services in the Philippines.
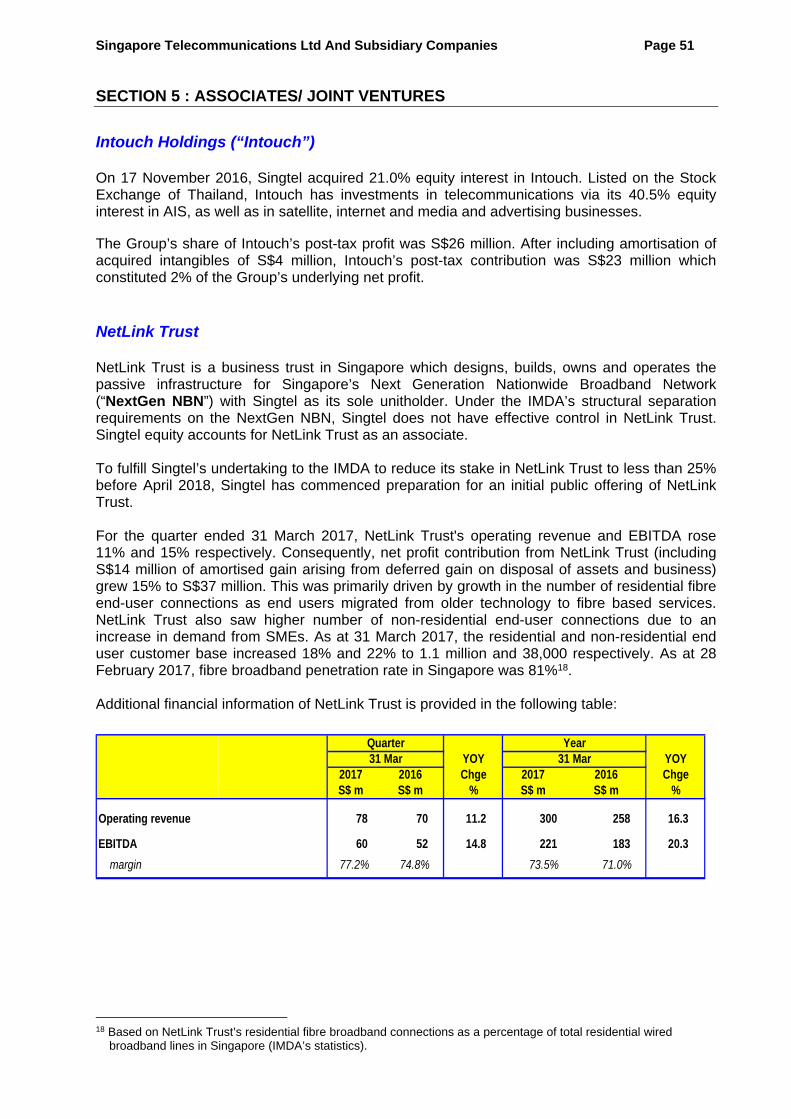
Singapore Telecommunications Ltd And Subsidiary Companies Page 51 SECTION 5 : ASSOCIATES/ JOINT VENTURES
Intouch Holdings (“Intouch”) On 17 November 2016, Singtel acquired 21.0% equity interest in Intouch. Listed on the Stock Exchange of Thailand, Intouch has investments in telecommunications via its 40.5% equity interest in AIS, as well as in satellite, internet and media and advertising businesses. The Group’s share of Intouch’s post-tax profit was S$26 million. After including amortisation of acquired intangibles of S$4 million, Intouch’s post-tax contribution was S$23 million which constituted 2% of the Group’s underlying net profit. NetLink Trust NetLink Trust is a business trust in Singapore which designs, builds, owns and operates the passive infrastructure for Singapore’s Next Generation Nationwide Broadband Network (“NextGen NBN”) with Singtel as its sole unitholder. Under the IMDA’s structural separation requirements on the NextGen NBN, Singtel does not have effective control in NetLink Trust. Singtel equity accounts for NetLink Trust as an associate. To fulfill Singtel’s undertaking to the IMDA to reduce its stake in NetLink Trust to less than 25% before April 2018, Singtel has commenced preparation for an initial public offering of NetLink Trust. For the quarter ended 31 March 2017, NetLink Trust's operating revenue and EBITDA rose 11% and 15% respectively. Consequently, net profit contribution from NetLink Trust (including S$14 million of amortised gain arising from deferred gain on disposal of assets and business) grew 15% to S$37 million. This was primarily driven by growth in the number of residential fibre end-user connections as end users migrated from older technology to fibre based services. NetLink Trust also saw higher number of non-residential end-user connections due to an increase in demand from SMEs. As at 31 March 2017, the residential and non-residential end user customer base increased 18% and 22% to 1.1 million and 38,000 respectively. As at 28 February 2017, fibre broadband penetration rate in Singapore was 81%18. Additional financial information of NetLink Trust is provided in the following table:
2017 2016 2017 2016S$ m S$ m S$ m S$ m
Operating revenue 78 70 11.2 300 258 16.3
EBITDA 60 52 14.8 221 183 20.3
margin 77.2% 74.8% 73.5% 71.0%
31 MarQuarter
YOYChge
%
Year31 Mar YOY
Chge%
18 Based on NetLink Trust’s residential fibre broadband connections as a percentage of total residential wired broadband lines in Singapore (IMDA’s statistics).
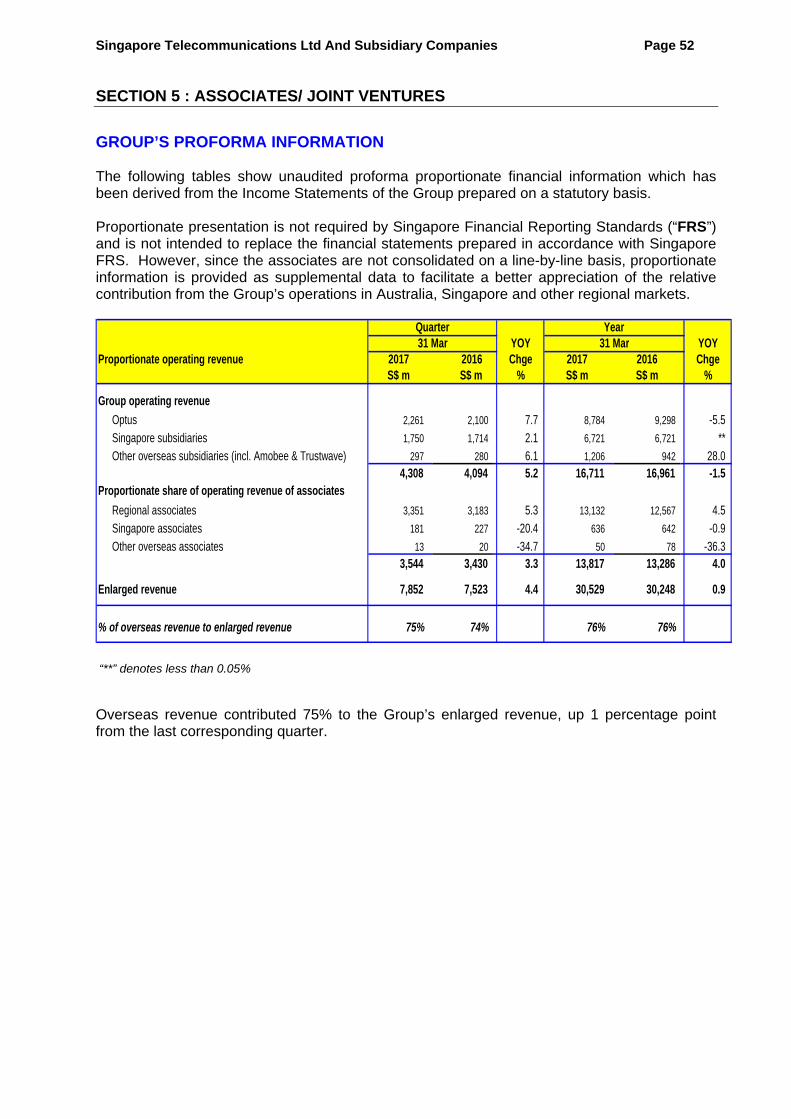
Singapore Telecommunications Ltd And Subsidiary Companies Page 52 SECTION 5 : ASSOCIATES/ JOINT VENTURES
GROUP’S PROFORMA INFORMATION
The following tables show unaudited proforma proportionate financial information which has been derived from the Income Statements of the Group prepared on a statutory basis. Proportionate presentation is not required by Singapore Financial Reporting Standards (“FRS”) and is not intended to replace the financial statements prepared in accordance with Singapore FRS. However, since the associates are not consolidated on a line-by-line basis, proportionate information is provided as supplemental data to facilitate a better appreciation of the relative contribution from the Group’s operations in Australia, Singapore and other regional markets.
Proportionate operating revenue 2017 2016 2017 2016S$ m S$ m S$ m S$ m
Group operating revenue
Optus 2,261 2,100 7.7 8,784 9,298 -5.5
Singapore subsidiaries 1,750 1,714 2.1 6,721 6,721 **
Other overseas subsidiaries (incl. Amobee & Trustwave) 297 280 6.1 1,206 942 28.0 4,308 4,094 5.2 16,711 16,961 -1.5
Regional associates 3,351 3,183 5.3 13,132 12,567 4.5
Singapore associates 181 227 -20.4 636 642 -0.9
Other overseas associates 13 20 -34.7 50 78 -36.3 3,544 3,430 3.3 13,817 13,286 4.0
Enlarged revenue 7,852 7,523 4.4 30,529 30,248 0.9
% of overseas revenue to enlarged revenue 75% 74% 76% 76%
Year31 Mar YOY
Chge
Quarter 31 Mar YOY
Proportionate share of operating revenue of associates
Chge% %
“**” denotes less than 0.05% Overseas revenue contributed 75% to the Group’s enlarged revenue, up 1 percentage point from the last corresponding quarter.

Singapore Telecommunications Ltd And Subsidiary Companies Page 53 SECTION 5 : ASSOCIATES/ JOINT VENTURES
Proportionate EBITDA 2017 2016 2017 2016
S$ m S$ m S$ m S$ m
Group EBITDA
Optus 796 749 6.2 2,784 2,825 -1.4
Singapore subsidiaries 587 605 -2.9 2,525 2,520 0.2
Other overseas subsidiaries (including Amobee & Trustwave) (74) (92) -19.2 (312) (332) -6.1
1,308 1,262 3.7 4,998 5,013 -0.3
Regional associates 1,508 1,403 7.5 5,821 5,348 8.9
Singapore associates 76 63 21.8 289 254 13.7
Other overseas associates 10 13 -20.3 38 59 -35.5
1,594 1,479 7.8 6,148 5,660 8.6
Total proportionate EBITDA 2,903 2,740 5.9 11,145 10,673 4.4
77% 76% 75% 74%
Contributions to total proportionate EBITDA
Regional associates 52% 51% 52% 50%
Australia 27% 27% 25% 26%
Singapore 23% 24% 25% 26%
Others -2% -3% -2% -3%
100% 100% 100% 100%
YOY
Chge
%
Quarter
31 Mar YOY
Proportionate share of associates' EBITDA (1)
Chge
%
Overseas proportionate EBITDA as a % to total proportionate EBITDA
Year
31 Mar
Note:
(1) Proportionate share of associates’ EBITDA represents the Group’s effective interests in the respective entities’ EBITDA. As such, proportionate EBITDA does not represent EBITDA available to the Group.
Through its investments in key market overseas, the Group has diversified its earnings base. Overseas operations contributed 77% to proportionate EBITDA against 76% in the last corresponding quarter.
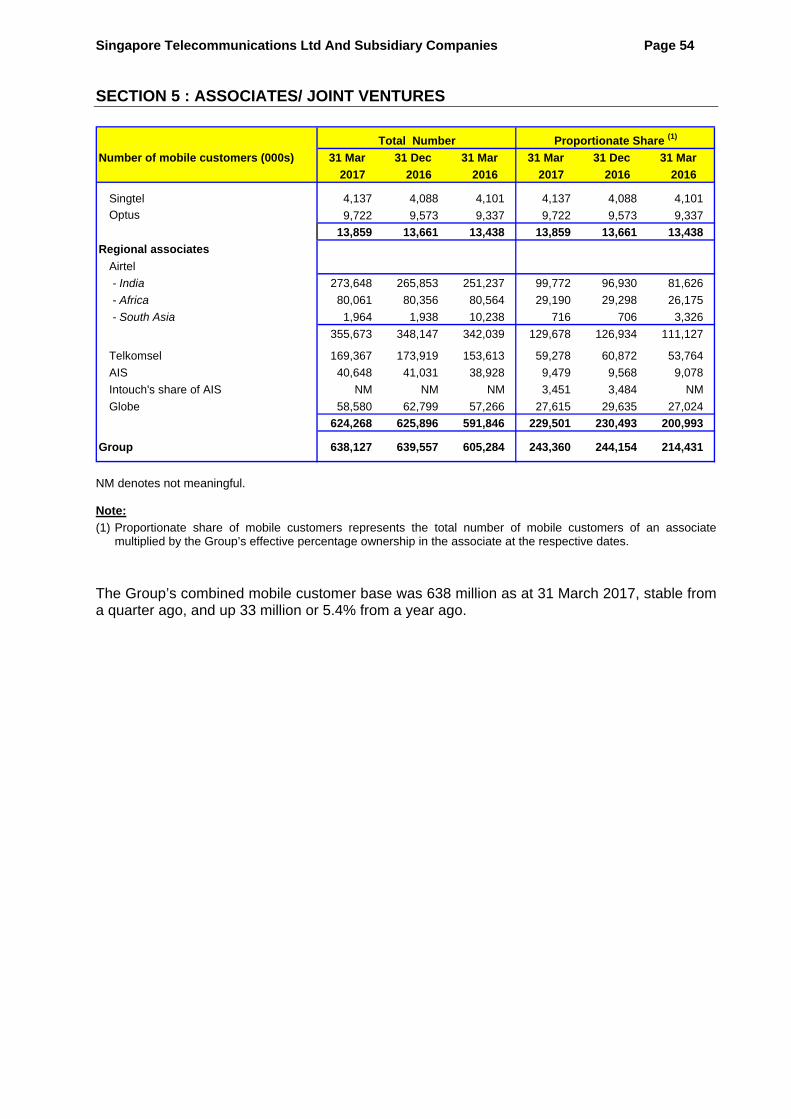
Singapore Telecommunications Ltd And Subsidiary Companies Page 54 SECTION 5 : ASSOCIATES/ JOINT VENTURES
Number of mobile customers (000s) 31 Mar 31 Dec 31 Mar 31 Mar 31 Dec 31 Mar
2017 2016 2016 2017 2016 2016
Singtel 4,137 4,088 4,101 4,137 4,088 4,101
Optus 9,722 9,573 9,337 9,722 9,573 9,337
13,859 13,661 13,438 13,859 13,661 13,438
Regional associates
Airtel
- India 273,648 265,853 251,237 99,772 96,930 81,626
- Africa 80,061 80,356 80,564 29,190 29,298 26,175
- South Asia 1,964 1,938 10,238 716 706 3,326
355,673 348,147 342,039 129,678 126,934 111,127
Telkomsel 169,367 173,919 153,613 59,278 60,872 53,764
AIS 40,648 41,031 38,928 9,479 9,568 9,078
Intouch's share of AIS NM NM NM 3,451 3,484 NM
Globe 58,580 62,799 57,266 27,615 29,635 27,024
624,268 625,896 591,846 229,501 230,493 200,993
Group 638,127 639,557 605,284 243,360 244,154 214,431
Total Number Proportionate Share (1)
NM denotes not meaningful. Note:
(1) Proportionate share of mobile customers represents the total number of mobile customers of an associate multiplied by the Group’s effective percentage ownership in the associate at the respective dates.
The Group’s combined mobile customer base was 638 million as at 31 March 2017, stable from a quarter ago, and up 33 million or 5.4% from a year ago.

Singapore Telecommunications Ltd And Subsidiary Companies Page 55 SECTION 5 : ASSOCIATES/ JOINT VENTURES
CASH DIVIDENDS/ DISTRIBUTIONS RECEIVED FROM ASSOCIATES/ JOINT VENTURES (1)
2017 2016 2017 2016
S$ m S$ m S$ m S$ m
Telkomsel (2)
- interim dividend FY 2016 - nm 257 nm
- f inal dividend FY 2015 / FY 2014 - - 715 557 28.4
- special dividend FY 2014 - - 165 nm
- nm 971 722 34.6
AIS (3)
- interim dividend FY 2016 / FY 2015 - - 155 181 -14.4
- f inal dividend FY 2015 / FY 2014 - - 176 165 6.2
- - 330 346 -4.6
Globe (4)
- quarterly dividend FY 2016/ FY 2015 / FY 2014 41 40 0.5 160 157 2.1
Airtel (5)
- f inal dividend FY 2016 / FY 2015 - 17 28 -41.1
Regional associates 297 40 @ 1,478 1,252 18.0
Other associates
Southern Cross/ PCHL (6) 29 13 134.4 61 43 43.2
SingPost 3 7 -66.2 27 38 -29.0
NetLink Trust (7) - 80 nm
Others 2 6 -73.8 9 17 -46.0
33 26 28.5 178 98 80.7
Total 331 66 397.7 1,656 1,351 22.6
Chge Chge
% %
Quarter Year
31 Mar YOY 31 Mar YOY
257 -
- - -
-
- -
257
-
-
-
- -
“@” denotes more than 500% and “nm” denotes not meaningful Notes:
(1) The cash dividends received from overseas associates and joint ventures as stated in the table above are before related tax payments.
(2) Telkomsel declared a full year dividend of 95% on net profit for its 2016 financial year (2015: 90%). The Group’s share of the dividend is approximately S$980 million, of which S$257 million and S$724 million have been received in March 2017 and May 2017 respectively.
(3) AIS declared a full year dividend of 98% on net profit for its 2016 financial year (2015: 99%). Dividends are paid twice a year, with an interim dividend distributed from its first half year results and a final dividend distributed from its second half year results. On 3 February 2017, AIS declared a final dividend of THB 4.29 per share for its 2016 financial year. The Group received its share of final dividend of S$119 million in April 2017.
(4) Globe paid its first quarterly dividend of PHP 22.75 per common share for its 2016 financial year in March 2017. The Group’s share of this dividend was S$41 million. Globe will pay its next quarterly dividend of PHP 22.75 per common share in June 2017. The Group’s share of this dividend is approximately S$40 million.
(5) Airtel does not have a fixed dividend policy. The Group received its share of the final dividend for 2016 financial year from its direct stake of 15.0% in August 2016. Airtel declared a final dividend of Rs 1.00 per share for its 2017 financial year, subject to shareholders’ approval. The Group’s share of this dividend is Rs 600 million (approximately S$13 million) which will be received in September 2017 quarter.
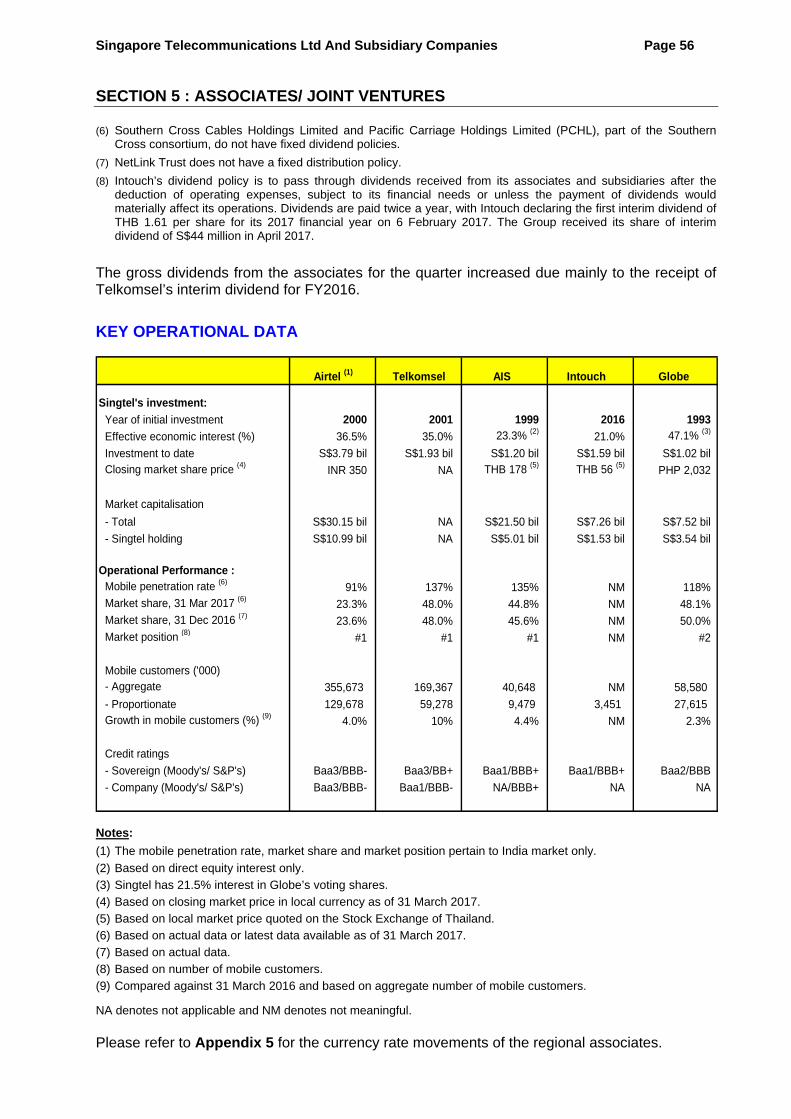
Singapore Telecommunications Ltd And Subsidiary Companies Page 56 SECTION 5 : ASSOCIATES/ JOINT VENTURES
(6) Southern Cross Cables Holdings Limited and Pacific Carriage Holdings Limited (PCHL), part of the Southern Cross consortium, do not have fixed dividend policies.
(7) NetLink Trust does not have a fixed distribution policy.
(8) Intouch’s dividend policy is to pass through dividends received from its associates and subsidiaries after the deduction of operating expenses, subject to its financial needs or unless the payment of dividends would materially affect its operations. Dividends are paid twice a year, with Intouch declaring the first interim dividend of THB 1.61 per share for its 2017 financial year on 6 February 2017. The Group received its share of interim dividend of S$44 million in April 2017.
The gross dividends from the associates for the quarter increased due mainly to the receipt of Telkomsel’s interim dividend for FY2016.
KEY OPERATIONAL DATA
AIS Intouch Globe
Singtel's investment:
Year of initial investment 2000 2001 1999 2016 1993
Effective economic interest (%) 36.5% 35.0% 23.3% (2)21.0% 47.1% (3)
Investment to date S$3.79 bil S$1.93 bil S$1.20 bil S$1.59 bil S$1.02 bilClosing market share price (4)
INR 350 NA THB 178 (5) THB 56 (5)PHP 2,032
Market capitalisation
- Total S$30.15 bil NA S$21.50 bil S$7.26 bil S$7.52 bil
- Singtel holding S$10.99 bil NA S$5.01 bil S$1.53 bil S$3.54 bil
Operational Performance :Mobile penetration rate (6)
91% 137% 135% NM 118%Market share, 31 Mar 2017 (6)
23.3% 48.0% 44.8% NM 48.1%Market share, 31 Dec 2016 (7)
23.6% 48.0% 45.6% NM 50.0%Market position (8)
#1 #1 #1 NM #2
Mobile customers ('000) - Aggregate 355,673 169,367 40,648 NM 58,580
- Proportionate 129,678 59,278 9,479 3,451 27,615 Growth in mobile customers (%) (9)
4.0% 10% 4.4% NM 2.3%
Credit ratings
- Sovereign (Moody's/ S&P's) Baa3/BBB- Baa3/BB+ Baa1/BBB+ Baa1/BBB+ Baa2/BBB
- Company (Moody's/ S&P's) Baa3/BBB- Baa1/BBB- NA/BBB+ NA NA
TelkomselAirtel (1)
Notes:
(1) The mobile penetration rate, market share and market position pertain to India market only.
(2) Based on direct equity interest only.
(3) Singtel has 21.5% interest in Globe’s voting shares.
(4) Based on closing market price in local currency as of 31 March 2017.
(5) Based on local market price quoted on the Stock Exchange of Thailand.
(6) Based on actual data or latest data available as of 31 March 2017.
(7) Based on actual data.
(8) Based on number of mobile customers.
(9) Compared against 31 March 2016 and based on aggregate number of mobile customers.
NA denotes not applicable and NM denotes not meaningful. Please refer to Appendix 5 for the currency rate movements of the regional associates.

Singapore Telecommunications Ltd And Subsidiary Companies Page 57 SECTION 6 : PRODUCT INFORMATION
SINGAPORE MOBILE (PRODUCT VIEW)
31 Mar 31 Dec 31 Mar 31 Mar 31 Mar 2017 2016 2016 2017 2016
Mobile Communications revenue (S$'M) (1) 511 526 520 2,082 2,116 -1.6
Number of mobile subscribers (000s)Prepaid 1,745 1,738 1,773 1,745 1,773 -1.6Postpaid 2,392 2,350 2,328 2,392 2,328 2.7Total 4,137 4,088 4,101 4,137 4,101 0.9
Number of 4G mobile subscribers (000s) 2,644 2,562 2,290 2,644 2,290 15.5
MOUs per subscriber per month (2)
Prepaid 212 231 264 236 281 -16.0
Postpaid (3) 229 233 246 236 251 -5.9
Average revenue per subscriber per
month (2) (4) (S$ per month)Prepaid 18 18 18 18 18 1.7Postpaid 67 69 70 68 72 -5.5Blended 46 48 47 47 48 -3.1
Data services as % of ARPU
- total data (5) 57% 56% 52% 55% 50%
- non-SMS data 49% 47% 43% 46% 40%
Tiered data plans - postpaid base on tiered data plans (6) 63% 65% 66% 63% 66%- tiered data plan customers exceeding data bundles 40% 37% 29% 40% 29%
Acquisition cost per postpaid subscriber (S$) (7) 378 495 411 431 425 1.6
Postpaid external churn per month (8)0.8% 0.9% 0.8% 1.0% 0.9%
Singapore mobile penetration rate (9)150% 150% 149% 150% 149%
Market share (9)
Prepaid 50.5% 50.7% 52.7% 50.5% 52.7%Postpaid 47.2% 47.2% 47.7% 47.2% 47.7%
Overall 48.6% 48.6% 49.8% 48.6% 49.8%
YOYChge
%
Quarter Year
Notes:
(1) This comprises cellular service revenue in Singapore only and is determined net of bill rebates and prepaid sales discount, and includes revenue earned from broadband bundles. It excludes revenue earned from international calls classified under “International Telephone” revenue.
(2) Based on average number of subscribers, calculated as the simple average of opening and closing number of subscribers.
(3) MOU of postpaid base excludes customers that have data-only SIM plans.
(4) ARPU includes revenue earned from international telephone calls. For prepaid, ARPU is computed net of sales discounts.
(5) Includes revenue from SMS, *SEND, MMS and other data services.
(6) Postpaid base on tiered data plans comprise of customers on smartphone plans.
(7) This relates to blended acquisition and retention cost per postpaid customer.
(8) Calculated by expressing the number of postpaid subscribers who deactivate or disconnect their service (both voluntary and the Company’s initiated churn) as a percentage of average number of subscribers.
(9) The market share data as at 31 March 2017 was based on Telco operators’ published results. The other market statistics were based on IMDA’s latest available published statistics as of 28 February 2017.
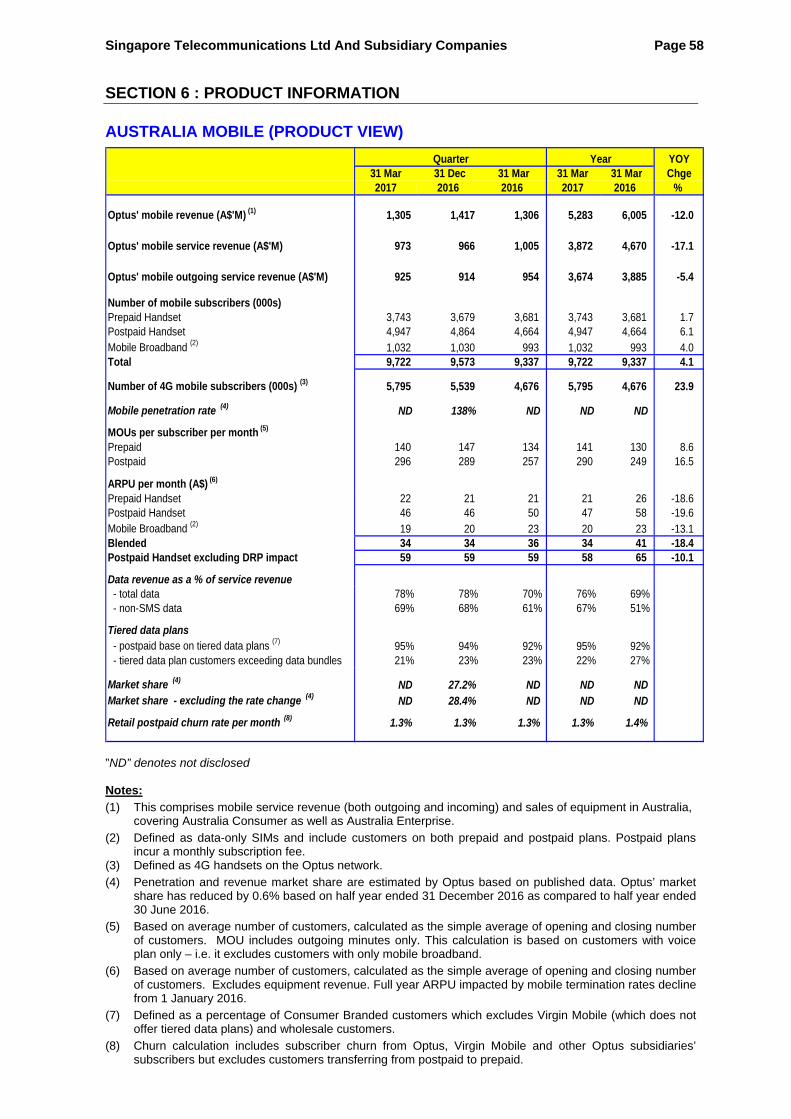
Singapore Telecommunications Ltd And Subsidiary Companies Page 58 SECTION 6 : PRODUCT INFORMATION
AUSTRALIA MOBILE (PRODUCT VIEW)
31 Mar 31 Dec 31 Mar 31 Mar 31 Mar2017 2016 2016 2017 2016
Optus' mobile revenue (A$'M) (1) 1,305 1,417 1,306 5,283 6,005 -12.0
Optus' mobile service revenue (A$'M) 973 966 1,005 3,872 4,670 -17.1
Optus' mobile outgoing service revenue (A$'M) 925 914 954 3,674 3,885 -5.4
Number of mobile subscribers (000s)Prepaid Handset 3,743 3,679 3,681 3,743 3,681 1.7Postpaid Handset 4,947 4,864 4,664 4,947 4,664 6.1Mobile Broadband (2) 1,032 1,030 993 1,032 993 4.0Total 9,722 9,573 9,337 9,722 9,337 4.1
Number of 4G mobile subscribers (000s) (3) 5,795 5,539 4,676 5,795 4,676 23.9
Mobile penetration rate (4) ND 138% ND ND ND
MOUs per subscriber per month (5)
Prepaid 140 147 134 141 130 8.6Postpaid 296 289 257 290 249 16.5
ARPU per month (A$) (6)
Prepaid Handset 22 21 21 21 26 -18.6Postpaid Handset 46 46 50 47 58 -19.6Mobile Broadband (2) 19 20 23 20 23 -13.1Blended 34 34 36 34 41 -18.4Postpaid Handset excluding DRP impact 59 59 59 58 65 -10.1
Data revenue as a % of service revenue - total data 78% 78% 70% 76% 69% - non-SMS data 69% 68% 61% 67% 51%
Tiered data plans - postpaid base on tiered data plans (7) 95% 94% 92% 95% 92% - tiered data plan customers exceeding data bundles 21% 23% 23% 22% 27%
Market share (4) ND 27.2% ND ND NDMarket share - excluding the rate change (4) ND 28.4% ND ND ND
Retail postpaid churn rate per month (8) 1.3% 1.3% 1.3% 1.3% 1.4%
Quarter Year YOYChge
%
”ND” denotes not disclosed Notes:
(1) This comprises mobile service revenue (both outgoing and incoming) and sales of equipment in Australia, covering Australia Consumer as well as Australia Enterprise.
(2) Defined as data-only SIMs and include customers on both prepaid and postpaid plans. Postpaid plans incur a monthly subscription fee.
(3) Defined as 4G handsets on the Optus network.
(4) Penetration and revenue market share are estimated by Optus based on published data. Optus’ market share has reduced by 0.6% based on half year ended 31 December 2016 as compared to half year ended 30 June 2016.
(5) Based on average number of customers, calculated as the simple average of opening and closing number of customers. MOU includes outgoing minutes only. This calculation is based on customers with voice plan only – i.e. it excludes customers with only mobile broadband.
(6) Based on average number of customers, calculated as the simple average of opening and closing number of customers. Excludes equipment revenue. Full year ARPU impacted by mobile termination rates decline from 1 January 2016.
(7) Defined as a percentage of Consumer Branded customers which excludes Virgin Mobile (which does not offer tiered data plans) and wholesale customers.
(8) Churn calculation includes subscriber churn from Optus, Virgin Mobile and other Optus subsidiaries’ subscribers but excludes customers transferring from postpaid to prepaid.

Singapore Telecommunications Ltd And Subsidiary Companies Page 59 SECTION 6 : PRODUCT INFORMATION
Singtel TV (PRODUCT VIEW)
31 Mar 31 Dec 31 Mar 31 Mar 31 Mar
2017 2016 2016 2017 2016
Singtel TV revenue (S$'M) 61 63 58 246 232 6.0
Average revenue per residential TV customer
per month (S$ per month) 41 41 39 41 39 4.8
Number of residential TV customers (000s) 408 409 423 408 423 -3.6
YearQuarter YOYChge
%
SINGAPORE CONSUMER HOME
31 Mar 31 Dec 31 Mar 31 Mar 31 Mar
2017 2016 2016 2017 2016
Singapore Consumer home revenue (S$'M) (1) 135 140 131 549 526 4.4
Number of households on triple/ quad
play services (000s) (2) 503 500 500 503 500 0.6
Quarter YOYChge
%
Year
Notes:
(1) This comprises fixed broadband, fixed voice and Singtel TV in the residential segment only and does not include mobile.
(2) Total number of residential households who subscribed to 3 or 4 unique services comprising fixed broadband, Singtel TV, fixed voice and mobile.
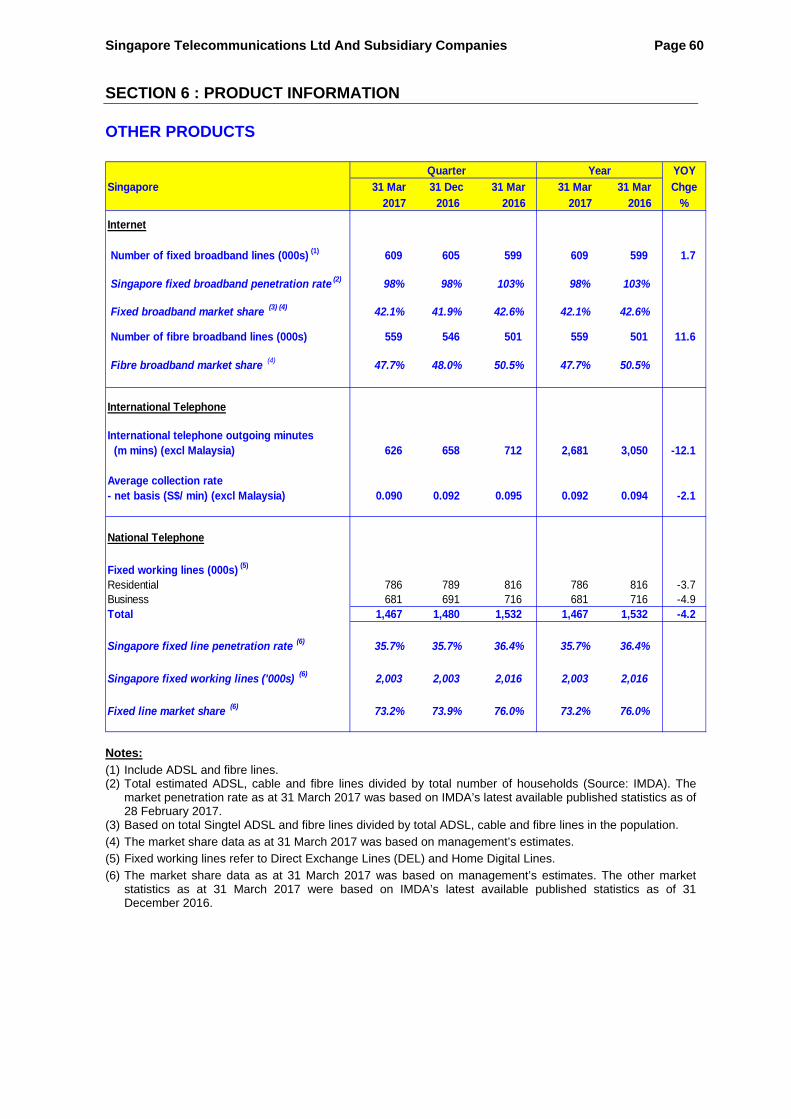
Singapore Telecommunications Ltd And Subsidiary Companies Page 60 SECTION 6 : PRODUCT INFORMATION
OTHER PRODUCTS
Singapore 31 Mar 31 Dec 31 Mar 31 Mar 31 Mar
2017 2016 2016 2017 2016
Internet
Number of fixed broadband lines (000s) (1) 609 605 599 609 599 1.7
Singapore fixed broadband penetration rate (2) 98% 98% 103% 98% 103%
Fixed broadband market share (3) (4) 42.1% 41.9% 42.6% 42.1% 42.6%
Number of fibre broadband lines (000s) 559 546 501 559 501 11.6
Fibre broadband market share (4) 47.7% 48.0% 50.5% 47.7% 50.5%
International Telephone
International telephone outgoing minutes (m mins) (excl Malaysia) 626 658 712 2,681 3,050 -12.1
Average collection rate- net basis (S$/ min) (excl Malaysia) 0.090 0.092 0.095 0.092 0.094 -2.1
National Telephone
Fixed working lines (000s) (5) Residential 786 789 816 786 816 -3.7Business 681 691 716 681 716 -4.9Total 1,467 1,480 1,532 1,467 1,532 -4.2
Singapore fixed line penetration rate (6) 35.7% 35.7% 36.4% 35.7% 36.4%
Singapore fixed working lines ('000s) (6) 2,003 2,003 2,016 2,003 2,016
Fixed line market share (6) 73.2% 73.9% 76.0% 73.2% 76.0%
Chge
%
Quarter YOYYear
Notes:
(1) Include ADSL and fibre lines. (2) Total estimated ADSL, cable and fibre lines divided by total number of households (Source: IMDA). The
market penetration rate as at 31 March 2017 was based on IMDA’s latest available published statistics as of 28 February 2017.
(3) Based on total Singtel ADSL and fibre lines divided by total ADSL, cable and fibre lines in the population.
(4) The market share data as at 31 March 2017 was based on management’s estimates.
(5) Fixed working lines refer to Direct Exchange Lines (DEL) and Home Digital Lines.
(6) The market share data as at 31 March 2017 was based on management’s estimates. The other market statistics as at 31 March 2017 were based on IMDA’s latest available published statistics as of 31 December 2016.

Singapore Telecommunications Ltd And Subsidiary Companies Page 61 SECTION 6 : PRODUCT INFORMATION
Australia 31 Mar 31 Dec 31 Mar 31 Mar 31 Mar2017 2016 2016 2017 2016
Enterprise Fixed
Business voice minutes (m min) 1,237 1,237 1,353 5,159 5,302 -2.7
Wholesale Fixed
Wholesale domestic voice minutes (m min) 1,026 1,065 916 3,937 4,003 -1.7
Mass Market Fixed
On-net ARPU (A$) (1)
Voice 32 33 36 34 36 -6.6
Broadband (2) 53 54 53 53 53 0.2
Telephony customers (000s)
HFC (3) 447 451 454 447 454 -1.7
ULL (4) 394 411 448 394 448 -11.9
On-net 841 862 902 841 902 -6.7
Resale 57 55 19 57 19 202.1NBN 225 190 110 225 110 104.6Off-net 282 245 129 282 129 118.9
TV customers (000s) 456 433 345 456 345 32.2
HFC bundling rate (5) 98% 98% 98% 98% 98%HFC penetration 32% 32% 32% 32% 32%
Internet customers (000s)On-net HFC broadband 438 440 433 438 433 1.1
ULL broadband (4) 413 429 475 413 475 -13.0
Business grade broadband 26 25 24 26 24 4.6877 894 933 877 933 -6.0
Off-net Resale 42 40 22 42 22 90.0
NBN 228 192 113 228 113 101.9
Broadband subtotal 1,147 1,125 1,068 1,147 1,068 7.4Dial-up 3 3 3 3 3 -4.3Total Internet customers 1,150 1,129 1,071 1,150 1,071 7.4
Quarter Year YOYChge
%
Notes:
(1) Per month, based on average number of HFC and ULL customers. Comparatives have been restated to be consistent with the current quarter.
(2) Includes Optus TV with Fetch.
(3) Includes all customers who take local telephony over the HFC network, and customers who take one or more of pay TV or cable internet services over the HFC network.
(4) Include wholesale ULL subscribers.
(5) Based on customers who are receiving a ‘bundled benefit’ from taking a package of products (local telephony plus at least one of broadband, dial-up internet or pay TV).
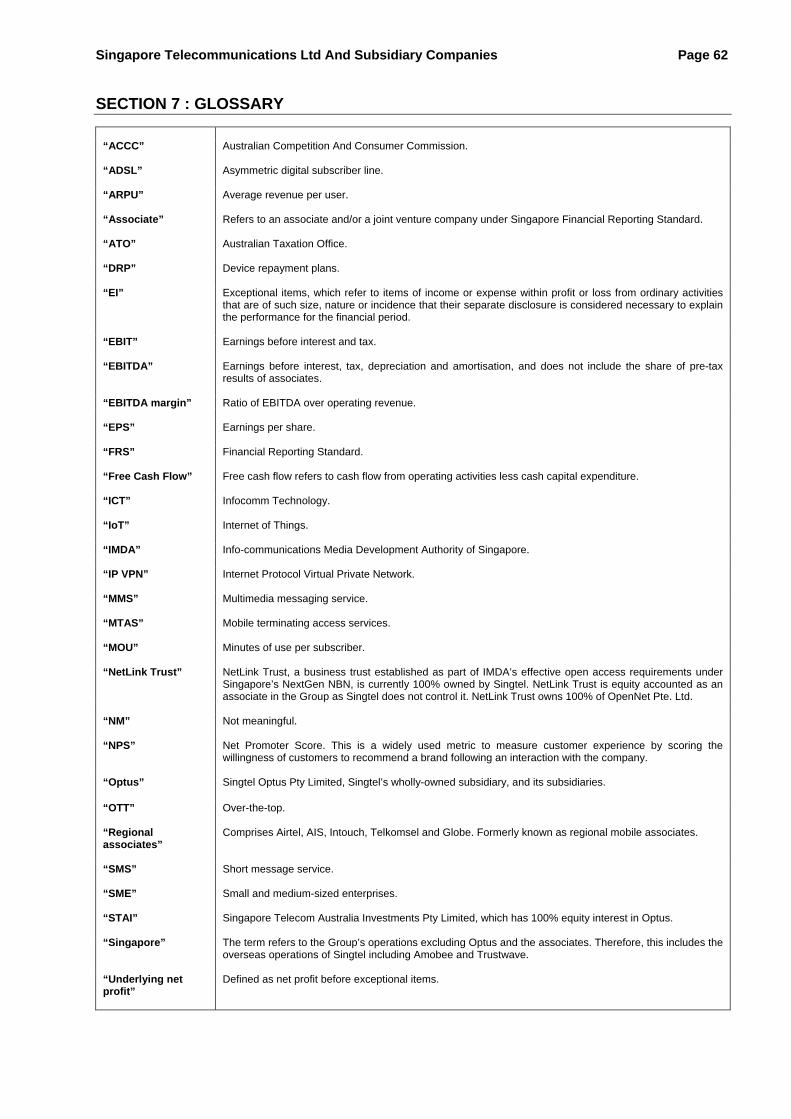
Singapore Telecommunications Ltd And Subsidiary Companies Page 62
SECTION 7 : GLOSSARY
“ACCC” “ADSL”
Australian Competition And Consumer Commission. Asymmetric digital subscriber line.
“ARPU” Average revenue per user.
“Associate” “ATO”
Refers to an associate and/or a joint venture company under Singapore Financial Reporting Standard. Australian Taxation Office.
“DRP” Device repayment plans.
“EI” Exceptional items, which refer to items of income or expense within profit or loss from ordinary activities that are of such size, nature or incidence that their separate disclosure is considered necessary to explain the performance for the financial period.
“EBIT” Earnings before interest and tax.
“EBITDA”
Earnings before interest, tax, depreciation and amortisation, and does not include the share of pre-tax results of associates.
“EBITDA margin” Ratio of EBITDA over operating revenue. “EPS”
Earnings per share.
“FRS”
Financial Reporting Standard.
“Free Cash Flow”
Free cash flow refers to cash flow from operating activities less cash capital expenditure.
“ICT” “IoT”
Infocomm Technology. Internet of Things.
“IMDA” Info-communications Media Development Authority of Singapore. “IP VPN” Internet Protocol Virtual Private Network. “MMS” “MTAS”
Multimedia messaging service. Mobile terminating access services.
“MOU” Minutes of use per subscriber.
“NetLink Trust” NetLink Trust, a business trust established as part of IMDA’s effective open access requirements under
Singapore’s NextGen NBN, is currently 100% owned by Singtel. NetLink Trust is equity accounted as an associate in the Group as Singtel does not control it. NetLink Trust owns 100% of OpenNet Pte. Ltd.
“NM” Not meaningful.
“NPS” Net Promoter Score. This is a widely used metric to measure customer experience by scoring the
willingness of customers to recommend a brand following an interaction with the company.
“Optus” Singtel Optus Pty Limited, Singtel’s wholly-owned subsidiary, and its subsidiaries.
“OTT” “Regional associates”
Over-the-top. Comprises Airtel, AIS, Intouch, Telkomsel and Globe. Formerly known as regional mobile associates.
“SMS” “SME” “STAI”
Short message service. Small and medium-sized enterprises. Singapore Telecom Australia Investments Pty Limited, which has 100% equity interest in Optus.
“Singapore” The term refers to the Group’s operations excluding Optus and the associates. Therefore, this includes the overseas operations of Singtel including Amobee and Trustwave.
“Underlying net profit”
Defined as net profit before exceptional items.

Singapore Telecommunications Ltd And Subsidiary Companies Appendix 1 Page 1 of 4
GROUP SUMMARY INCOME STATEMENTS For The Fourth Quarter Ended 31 March 2017
2017 2016 YOY
Singapore Asso/JV Corp Singtel Optus Group Group
S$ m S$ m S$ m S$ m S$ m S$ m S$ m
Operating revenue 2,047 - - 2,047 2,261 4,308 4,094 5.2
Operating expenses (1,557) - - (1,557) (1,503) (3,061) (2,865) 6.8
489 - - 489 758 1,247 1,229 1.5 Other income 23 - - 23 38 61 33 87.718
EBITDA 513 - - 513 796 1,308 1,262 3.7 - EBITDA margin 25.0% - - 25.0% 35.2% 30.4% 30.8%
Share of associates' pre-tax profits
Regional associates - 658 - 658 - 658 699 -6.0
Other associates - 62 - 62 * 63 41 52.8
- ordinary operations - 720 - 720 * 720 740 -2.7
- exceptional items - - - - - - (19) nm- 720 - 720 * 720 721 -0.1
EBITDA and share of
associates' pre-tax profits 513 720 - 1,232 796 2,028 1,983 2.3
Depreciation & amortisation (215) - - (215) (370) (585) (545) 7.2
EBIT 298 720 - 1,017 426 1,444 1,437 0.4
Net finance expense - net interest expense (44) - - (44) (45) (89) (85) 4.7
- other finance (expense)/ income (9) - 15 6 * 7 (7) nm(53) - 15 (38) (44) (82) (91) -10.0
Profit before EI and tax 245 720 15 980 382 1,362 1,346 1.2
Taxation- current and deferred taxes (20) - - (20) (116) (136) (154) -11.9- share of taxes of associates - (199) - (199) 2 (197) (193) 2.0
- withholding taxes (1) - - (48) (48) - (48) (24) 105.1(20) (199) (48) (268) (114) (381) (371) 2.8
Profit/ (Loss) after tax 224 521 (33) 712 269 981 975 0.5
Minority interests 8 - - 8 - 8 6 37.5
Underlying net profit/ (loss) 232 521 (33) 720 269 988 981 0.8
(exclude Airtel) (2) 232 485 (33) 684 269 952 890 7.0
Exceptional items ("EI") (post-tax) (4) (54) 32 (25) - (25) (35) -28.4
Net profit/ (loss) 228 467 (1) 695 269 963 946 1.8
(exclude Airtel) (2) 228 437 (1) 664 269 933 855 9.1
%
Chge
Quarter 31 Mar
20172017
Notes: (1) These are withholding and dividend distribution taxes deducted at source when dividends are remitted by the
overseas associates. For accounting purpose, the dividend income and related withholding and dividend distribution taxes are accrued when declared by the associates. Dividend income has no impact on the income statement of the Group as they are eliminated at Group. The cash inflows upon the receipt of dividend are shown in Section 5.
(2) The profits were adjusted to exclude results of Airtel.
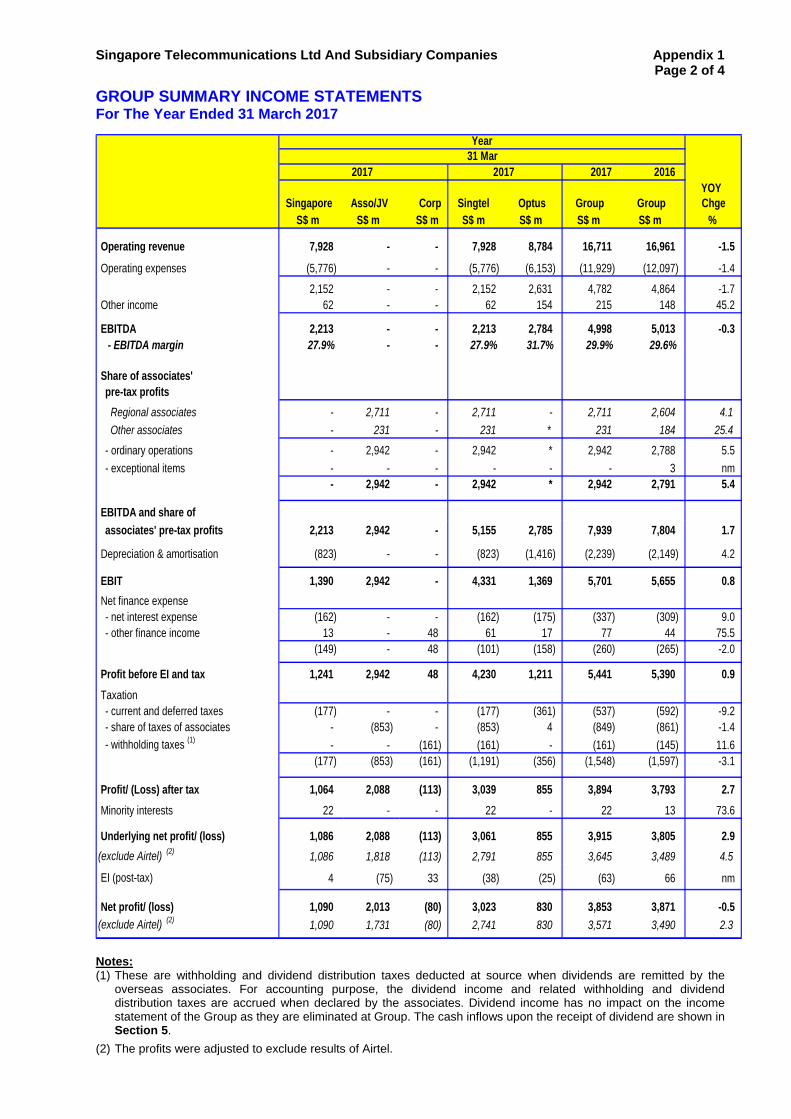
Singapore Telecommunications Ltd And Subsidiary Companies Appendix 1 Page 2 of 4
GROUP SUMMARY INCOME STATEMENTS For The Year Ended 31 March 2017
2017 2016 YOY
Singapore Asso/JV Corp Singtel Optus Group GroupS$ m S$ m S$ m S$ m S$ m S$ m S$ m
Operating revenue 7,928 - - 7,928 8,784 16,711 16,961 -1.5
Operating expenses (5,776) - - (5,776) (6,153) (11,929) (12,097) -1.4
2,152 - - 2,152 2,631 4,782 4,864 -1.7 Other income 62 - - 62 154 215 148 45.2
EBITDA 2,213 - - 2,213 2,784 4,998 5,013 -0.3 - EBITDA margin 27.9% - - 27.9% 31.7% 29.9% 29.6%
Share of associates' pre-tax profits
Regional associates - 2,711 - 2,711 - 2,711 2,604 4.1
Other associates - 231 - 231 * 231 184 25.4
- ordinary operations - 2,942 - 2,942 * 2,942 2,788 5.5
- exceptional items - - - - - - 3 nm- 2,942 - 2,942 * 2,942 2,791 5.4
EBITDA and share of
associates' pre-tax profits 2,213 2,942 - 5,155 2,785 7,939 7,804 1.7
Depreciation & amortisation (823) - - (823) (1,416) (2,239) (2,149) 4.2
EBIT 1,390 2,942 - 4,331 1,369 5,701 5,655 0.8
Net finance expense - net interest expense (162) - - (162) (175) (337) (309) 9.0
- other finance income 13 - 48 61 17 77 44 75.5(149) - 48 (101) (158) (260) (265) -2.0
Profit before EI and tax 1,241 2,942 48 4,230 1,211 5,441 5,390 0.9
Taxation- current and deferred taxes (177) - - (177) (361) (537) (592) -9.2- share of taxes of associates - (853) - (853) 4 (849) (861) -1.4
- withholding taxes (1) - - (161) (161) - (161) (145) 11.6(177) (853) (161) (1,191) (356) (1,548) (1,597) -3.1
Profit/ (Loss) after tax 1,064 2,088 (113) 3,039 855 3,894 3,793 2.7
Minority interests 22 - - 22 - 22 13 73.6
Underlying net profit/ (loss) 1,086 2,088 (113) 3,061 855 3,915 3,805 2.9
(exclude Airtel) (2) 1,086 1,818 (113) 2,791 855 3,645 3,489 4.5
EI (post-tax) 4 (75) 33 (38) (25) (63) 66 nm
Net profit/ (loss) 1,090 2,013 (80) 3,023 830 3,853 3,871 -0.5
(exclude Airtel) (2) 1,090 1,731 (80) 2,741 830 3,571 3,490 2.3
% Chge
Year31 Mar
20172017
Notes: (1) These are withholding and dividend distribution taxes deducted at source when dividends are remitted by the
overseas associates. For accounting purpose, the dividend income and related withholding and dividend distribution taxes are accrued when declared by the associates. Dividend income has no impact on the income statement of the Group as they are eliminated at Group. The cash inflows upon the receipt of dividend are shown in Section 5.
(2) The profits were adjusted to exclude results of Airtel.
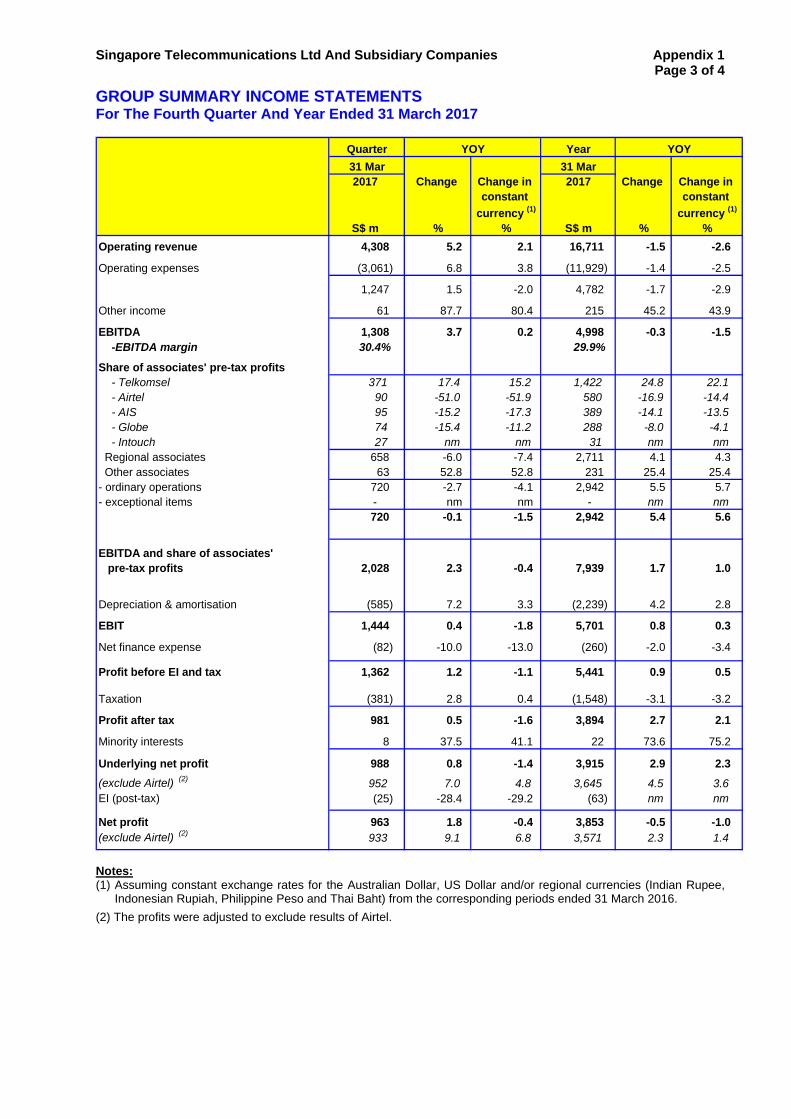
Singapore Telecommunications Ltd And Subsidiary Companies Appendix 1 Page 3 of 4
GROUP SUMMARY INCOME STATEMENTS For The Fourth Quarter And Year Ended 31 March 2017
Operating revenue 4,308 5.2 2.1 16,711 -1.5 -2.6
Operating expenses (3,061) 6.8 3.8 (11,929) -1.4 -2.5
1,247 1.5 -2.0 4,782 -1.7 -2.9
Other income 61 87.7 80.4 215 45.2 43.9
EBITDA 1,308 3.7 0.2 4,998 -0.3 -1.5-EBITDA margin 30.4% 29.9%
Share of associates' pre-tax profits- Telkomsel 371 17.4 15.2 1,422 24.8 22.1- Airtel 90 -51.0 -51.9 580 -16.9 -14.4- AIS 95 -15.2 -17.3 389 -14.1 -13.5- Globe 74 -15.4 -11.2 288 -8.0 -4.1- Intouch 27 nm nm 31 nm nm
Regional associates 658 -6.0 -7.4 2,711 4.1 4.3 Other associates 63 52.8 52.8 231 25.4 25.4- ordinary operations 720 -2.7 -4.1 2,942 5.5 5.7- exceptional items - nm nm - nm nm
720 -0.1 -1.5 2,942 5.4 5.6
EBITDA and share of associates' pre-tax profits 2,028 2.3 -0.4 7,939 1.7 1.0
Depreciation & amortisation (585) 7.2 3.3 (2,239) 4.2 2.8
1,444 0.4 -1.8 5,701 0.8 0.3
Net finance expense (82) -10.0 -13.0 (260) -2.0 -3.4
Profit before EI and tax 1,362 1.2 -1.1 5,441 0.9 0.5
Taxation (381) 2.8 0.4 (1,548) -3.1 -3.2
Profit after tax 981 0.5 -1.6 3,894 2.7 2.1
Minority interests 8 37.5 41.1 22 73.6 75.2
Underlying net profit 988 0.8 -1.4 3,915 2.9 2.3
(exclude Airtel) (2) 952 7.0 4.8 3,645 4.5 3.6EI (post-tax) (25) -28.4 -29.2 (63) nm nm
Net profit 963 1.8 -0.4 3,853 -0.5 -1.0(exclude Airtel) (2) 933 9.1 6.8 3,571 2.3 1.4
%% S$ mcurrency (1)
Change constant constant
currency (1)
%
Change in Change in 20172017 Change
YOYQuarter
31 Mar
YOY Year
31 Mar
%
EBIT
S$ m
Notes: (1) Assuming constant exchange rates for the Australian Dollar, US Dollar and/or regional currencies (Indian Rupee,
Indonesian Rupiah, Philippine Peso and Thai Baht) from the corresponding periods ended 31 March 2016.
(2) The profits were adjusted to exclude results of Airtel.

Singapore Telecommunications Ltd And Subsidiary Companies Appendix 1 Page 4 of 4
BUSINESS SEGMENTS For The Fourth Quarter And Year Ended 31 March 2017
Operating revenue
Group Consumer 2,457 7.1 2.5 9,572 -5.3 -6.9Group Enterprise 1,723 2.6 1.3 6,600 3.2 2.7
Core Business 4,181 5.2 2.0 16,172 -2.0 -3.2
Group Digital Life 127 5.8 4.6 539 18.7 18.8
Group 4,308 5.2 2.1 16,711 -1.5 -2.6
EBITDA
Group Consumer 908 7.4 2.6 3,295 0.9 -0.9Group Enterprise 466 -1.9 -2.8 1,913 -2.3 -2.6
Core Business 1,374 4.0 0.7 5,208 -0.3 -1.5
Group Digital Life (36) -7.5 -7.5 (122) -10.6 -10.5
Corporate (30) 47.0 47.0 (88) 16.8 16.8
Group 1,308 3.7 0.2 4,998 -0.3 -1.5
EBIT (exclude share of associates' pre-tax profits)
Group Consumer 513 6.5 2.0 1,771 -2.2 -3.9Group Enterprise 294 -5.9 -6.3 1,268 -5.1 -5.2
Core Business 807 1.7 -1.3 3,039 -3.5 -4.5
Group Digital Life (53) -6.7 -7.0 (190) -7.4 -7.3
Corporate (30) 47.3 47.3 (90) 14.2 14.2
Group 724 1.0 -2.2 2,759 -3.7 -4.8
Change in constant
2017 Change
%% %S$ mcurrency (1)
Change constant
Change in
currency (1)
%
2017
S$ m
Quarter
31 Mar
YOY Year
31 Mar
YOY
Note: (1) Assuming constant exchange rates for the Australian Dollar and US Dollar from the corresponding periods ended
31 March 2016.
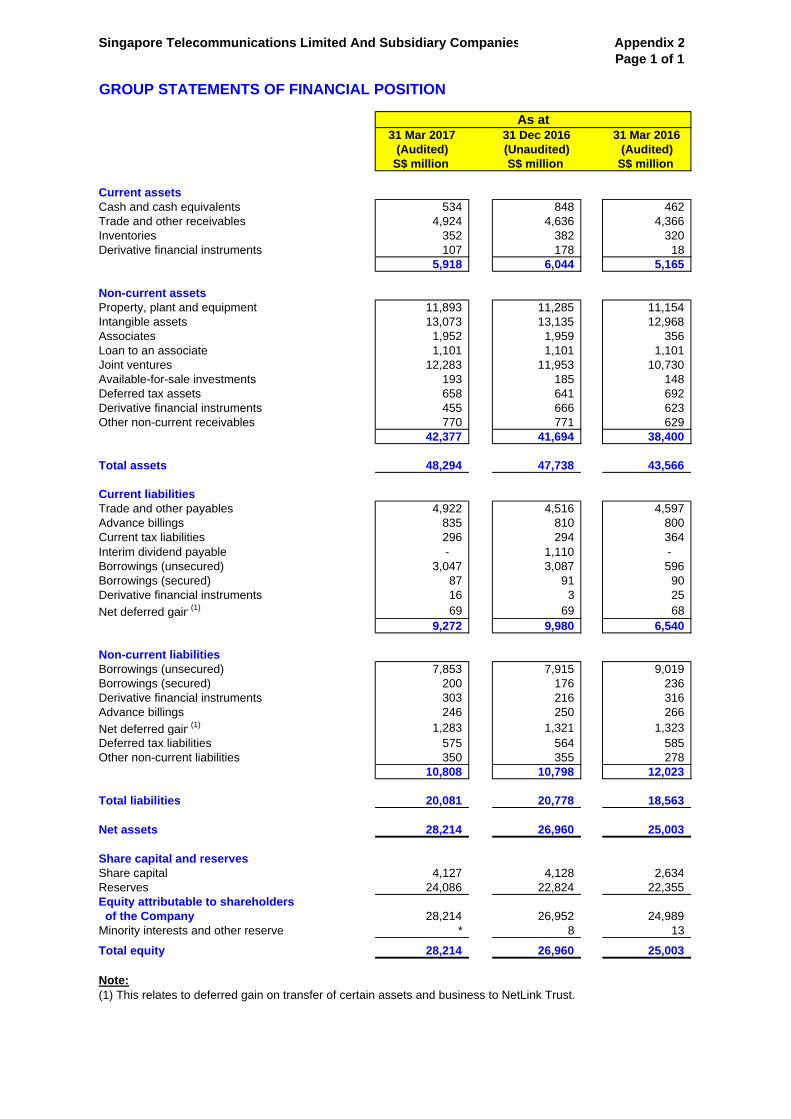
Singapore Telecommunications Limited And Subsidiary Companies Appendix 2Page 1 of 1
GROUP STATEMENTS OF FINANCIAL POSITION
31 Mar 2017 31 Dec 2016 31 Mar 2016(Audited) (Unaudited) (Audited)
S$ million S$ million S$ million
Current assetsCash and cash equivalents 534 848 462 Trade and other receivables 4,924 4,636 4,366 Inventories 352 382 320 Derivative financial instruments 107 178 18 5,918 6,044 5,165
Non-current assetsProperty, plant and equipment 11,893 11,285 11,154 Intangible assets 13,073 13,135 12,968 Associates 1,952 1,959 356 Loan to an associate 1,101 1,101 1,101 Joint ventures 12,283 11,953 10,730 Available-for-sale investments 193 185 148 Deferred tax assets 658 641 692 Derivative financial instruments 455 666 623 Other non-current receivables 770 771 629
42,377 41,694 38,400
Total assets 48,294 47,738 43,566
Current liabilitiesTrade and other payables 4,922 4,516 4,597 Advance billings 835 810 800 Current tax liabilities 296 294 364 Interim dividend payable - 1,110 - Borrowings (unsecured) 3,047 3,087 596 Borrowings (secured) 87 91 90 Derivative financial instruments 16 3 25
Net deferred gain (1) 69 69 68 9,272 9,980 6,540
Non-current liabilitiesBorrowings (unsecured) 7,853 7,915 9,019 Borrowings (secured) 200 176 236 Derivative financial instruments 303 216 316 Advance billings 246 250 266
Net deferred gain (1) 1,283 1,321 1,323 Deferred tax liabilities 575 564 585 Other non-current liabilities 350 355 278
10,808 10,798 12,023
Total liabilities 20,081 20,778 18,563
Net assets 28,214 26,960 25,003
Share capital and reservesShare capital 4,127 4,128 2,634 Reserves 24,086 22,824 22,355 Equity attributable to shareholders of the Company 28,214 26,952 24,989 Minority interests and other reserve * 8 13
Total equity 28,214 26,960 25,003
Note:(1) This relates to deferred gain on transfer of certain assets and business to NetLink Trust.
As at

Singapore Telecommunications Ltd And Subsidiary Companies Appendix 3 Page 1 of 2
SINGAPORE CASH FLOW STATEMENT For The Fourth Quarter And Year Ended 31 March 2017
31 Mar 31 Mar 31 Dec2017 2016 2016 2017 2016S$ m S$ m S$ m S$ m S$ m
Net cash inflow from operating activities Profit before exceptional items and tax 245 241 312 1,241 1,251 -0.8Non-cash items 278 281 221 991 953 4.0Operating cash flow before working capital changes 523 522 533 2,232 2,204 1.2Changes in operating assets and liabilities 17 74 128 (94) (306) -69.1
540 596 661 2,137 1,899 12.6Cash paid to employees under performance share plans - - - * (3) nmTax paid on operating activities (41) (38) (87) (247) (203) 22.0Operating cash flow 499 557 573 1,890 1,693 11.6
Net cash inflow/ (outflow) for investing activities Accrued capital expenditure (362) (417) (188) (834) (806) 3.5Changes in creditors' balances 112 113 1 (16) (19) -13.9Cash capital expenditure (251) (305) (187) (851) (825) 3.1
Net loan to STAI from Optus (1) (136) (123) - 7 17 -56.0
Dividend received by STAI from Optus (1) 635 617 - 635 617 2.9Withholding tax paid on interest received on inter-company loans (13) (14) - (27) (27) 1.5Payment for purchase of subsidiaries, net of cash acquired - (2) - (3) (1,059) -99.7Contribution from minority interests - 10 13 13 21 (39.2) Investment in associates * (215) (2,470) (2,472) (215) @Investment in venture investments (7) (13) (6) (35) (39) -10.4Proceeds from disposal of venture investments 16 5 5 75 81 -7.7Proceeds from disposal of property, plant and equipment * * 1 34 6 500.0Loan repaid by an associate - 510 - - 510 nmDeferred proceeds/ proceeds from disposal of associates 18 1 1 61 13 370.8Purchase of spectrum - - - (96) - nmPurchase of other intangibles (4) (2) (9) (15) (13) 14.7Others 17 21 1 38 66 -42.4
275 492 (2,650) (2,635) (846) 211.4
Net cash (outflow)/ inflow for financing activities
Net (decrease)/ increase in borrowings (275) (135) 726 645 888 -27.4Net interest paid on borrowings and swaps (35) (44) (53) (181) (172) 5.5Settlement for swap for bonds repaid 16 - - 16 - nmInterim dividend paid to shareholders (1,110) (1,084) - (1,110) (1,084) 2.4Final dividend paid to shareholders - - - (1,706) (1,705) **Purchase of performance shares (6) (6) (6) (20) (29) -29.1Proceeds from issue of shares - - 1,603 1,602 - nmOthers * 1 (6) (5) (3) 42.4
(1,409) (1,268) 2,265 (758) (2,105) -64.0
Net (decrease)/ increase in cash balance from Singapore (635) (219) 189 (1,503) (1,258) 19.5
Net (decrease)/ increase in cash balance from Singapore (635) (219) 189 (1,503) (1,258) 19.5
Dividends/ distributions received from associates 331 54 57 1,643 1,308 25.6Withholding tax paid (32) (6) (6) (155) (133) 16.8Net dividends/ distributions received from associates 299 48 51 1,487 1,175 26.6
Net (decrease)/ increase in cash and cash equivalents (336) (171) 240 (16) (83) -80.9Singtel cash and cash equivalents at beginning 743 581 489 403 453 -11.0Exchange effects on cash and cash equivalents (10) (7) 14 9 33 -72.0Singtel cash and cash equivalents at end 397 403 743 397 403 -1.6
Singapore free cash flow 248 253 387 1,040 869 19.7
Free cash flow from associates' dividends/ distributions 299 48 51 1,487 1,175 26.6
Cash capex to operating revenue 12% 15% 9% 11% 11%
%
Quarter Year31 Mar YOY
Chge
Note: (1) The intercompany amounts are eliminated at the Group level.

Singapore Telecommunications Ltd And Subsidiary Companies Appendix 3 Page 2 of 2
OPTUS CASH FLOW STATEMENT For The Fourth Quarter And Year Ended 31 March 2017
31 Mar 31 Mar 31 Dec YOY 2017 2016 2016 2017 2016 Chge
A$ m A$ m A$ m A$ m A$ m %
Net cash inflow from operating activitiesProfit before exceptional items and tax 356 379 269 1,160 1,322 -12.3Non-cash items 387 328 378 1,478 1,420 4.1Operating cashflow before working capital changes 743 707 647 2,638 2,742 -3.8Changes in operating assets and liabilities (103) (67) (78) (379) (723) -47.6Tax paid (1) (63) (63) (178) (412) (318) 29.4Operating cash flow 576 578 392 1,847 1,700 8.6
Net cash outflow from investing activitiesAccrued capital expenditure (553) (617) (373) (1,541) (1,598) -3.6Changes in creditors' balances 178 398 (41) 193 515 -62.5Payment for purchase of property, plant and equipment (375) (219) (414) (1,348) (1,083) 24.4Payment for purchase of subsidiary, net of cash acquired - - - (2) * nmLoan to STAI (2) (121) (131) - (260) (264) -1.8Repayment of loan by STAI (2) 250 250 - 250 250 -Purchase of spectrum * * * (29) (70) -58.0Others (18) (19) (27) (109) (81) 35.0
(264) (119) (441) (1,497) (1,249) 19.9
Net cash (outflow) / inflow from financing activitiesNet increase in bank borrowings 350 120 100 480 236 103.3Dividend paid to STAI (2) (600) (600) - (600) (600) -Purchase of Singtel shares - - - (7) (15) -54.8Net interest paid on borrowings and swaps (35) (35) (46) (164) (161) 2.0Finance lease payments (exclude interest) - * - * (2) nm (285) (516) 54 (291) (542) -46.3
Net increase/ (decrease) in cash balance from Optus 28 (57) 6 59 (90) nm Dividends received from associates - 12 2 13 42 -69.6Net increase/ (decrease) in cash and cash equivalents 28 (45) 8 72 (48) nm Optus cash and cash equivalents at beginning 101 102 93 57 105 -46.0
Optus cash and cash equivalents at end 128 57 101 128 57 126.6
Optus free cash flow (1) 202 358 (22) 500 617 -19.0
(exclude ATO tax payment) 202 358 112 634 617 2.7
Free cash flow from associates' dividends - 12 2 13 42 -69.6
Cash capex to operating revenue 18% 11% 19% 16% 12%
Quarter Year31 Mar
Notes: (1) After tax payment of A$134 million paid to the ATO for amended assessments in December 2016 quarter. (2) The intercompany amounts are eliminated at the Group level.
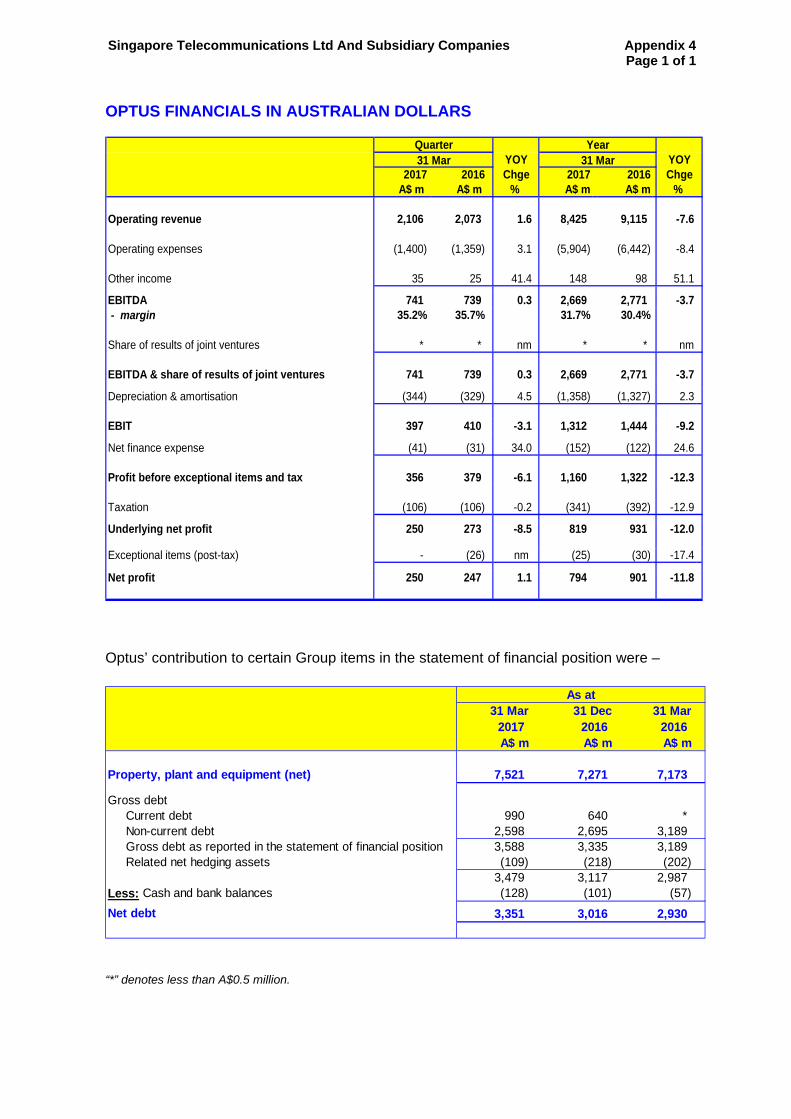
Singapore Telecommunications Ltd And Subsidiary Companies Appendix 4 Page 1 of 1
OPTUS FINANCIALS IN AUSTRALIAN DOLLARS
2017 2016 2017 2016A$ m A$ m A$ m A$ m
Operating revenue 2,106 2,073 1.6 8,425 9,115 -7.6
Operating expenses (1,400) (1,359) 3.1 (5,904) (6,442) -8.4
Other income 35 25 41.4 148 98 51.1
EBITDA 741 739 0.3 2,669 2,771 -3.7 - margin 35.2% 35.7% 31.7% 30.4%
Share of results of joint ventures * * nm * * nm
EBITDA & share of results of joint ventures 741 739 0.3 2,669 2,771 -3.7
Depreciation & amortisation (344) (329) 4.5 (1,358) (1,327) 2.3
EBIT 397 410 -3.1 1,312 1,444 -9.2
Net finance expense (41) (31) 34.0 (152) (122) 24.6
Profit before exceptional items and tax 356 379 -6.1 1,160 1,322 -12.3
Taxation (106) (106) -0.2 (341) (392) -12.9
Underlying net profit 250 273 -8.5 819 931 -12.0
Exceptional items (post-tax) - (26) nm (25) (30) -17.4
Net profit 250 247 1.1 794 901 -11.8
%
Quarter
ChgeYOY
YearYOYChge
%
31 Mar 31 Mar
Optus’ contribution to certain Group items in the statement of financial position were –
31 Mar 31 Dec 31 Mar2017 2016 2016A$ m A$ m A$ m
Property, plant and equipment (net) 7,521 7,271 7,173
Gross debt Current debt 990 640 *Non-current debt 2,598 2,695 3,189 Gross debt as reported in the statement of financial position 3,588 3,335 3,189 Related net hedging assets (109) (218) (202)
3,479 3,117 2,987 Less: Cash and bank balances (128) (101) (57)
Net debt 3,351 3,016 2,930
As at
“*” denotes less than A$0.5 million.

Singapore Telecommunications Ltd And Subsidiary Companies Appendix 5 Page 1 of 2
CURRENCY RISK MANAGEMENT & OTHER MATTERS The Group maintains a policy of hedging all known foreign currency exposures related to commercial commitments or transactions. These commitments or transactions include payment of operating expenses, traffic settlement, capital expenditure, interest and debt. Translation risks of foreign currency EBITDA and net investments are not hedged unless specifically approved by the Board. Financial instruments such as foreign currency forward contracts and cross currency swaps are used only to hedge underlying commercial exposures and are not held or sold for speculative purposes. All hedging transactions are reviewed regularly. To minimise the adverse impact of foreign exchange movements on the Group’s financial position, the Group determines the appropriate debt currency mix by matching it to the currency mix of the Group’s underlying cash flows.
31 Mar 31 Dec 31 Mar Debt Currency Mix 2017 2016 2016
SGD 66% 69% 67% AUD 34% 31% 33%
Total 100% 100% 100%
As at
The debt currency mix is constantly being reviewed and aligned with the Group’s cash flows. CREDIT RATINGS
As at 31 Mar 2017 Singtel Optus
Standard & Poor's A+ (stable) A (stable)
Moody's Investors Service Aa3 (stable) A1 (stable)
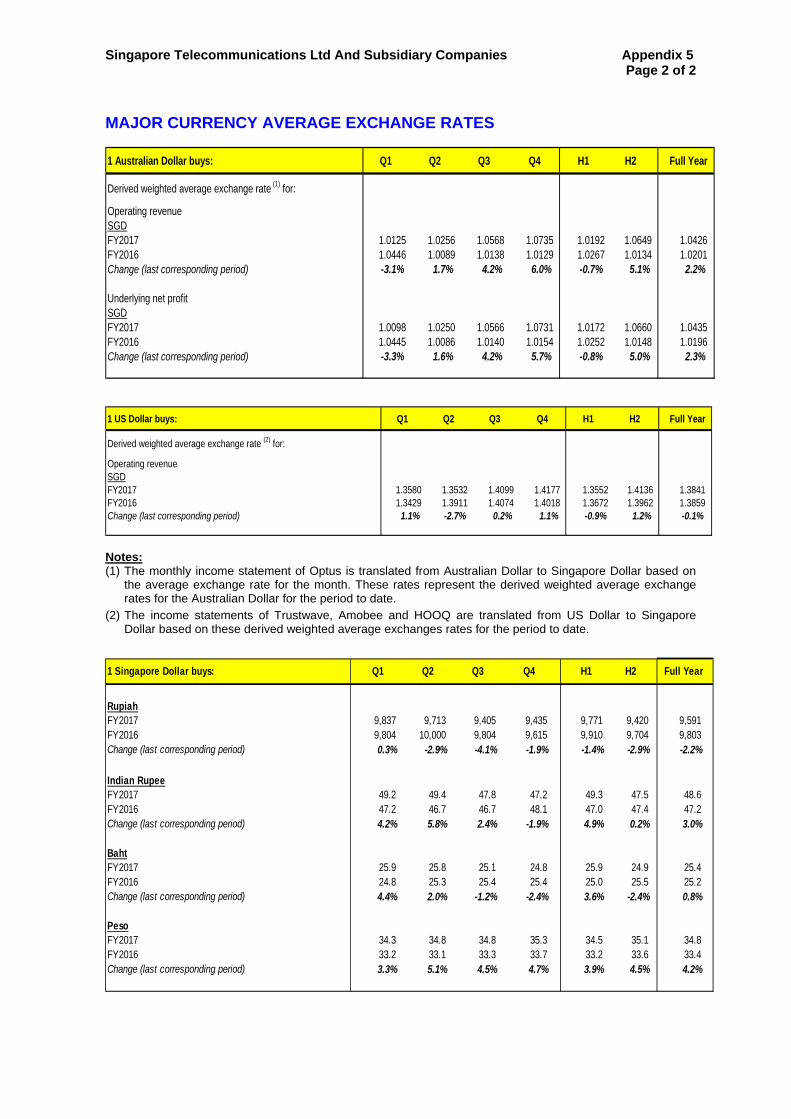
Singapore Telecommunications Ltd And Subsidiary Companies Appendix 5 Page 2 of 2
MAJOR CURRENCY AVERAGE EXCHANGE RATES
1 Australian Dollar buys: Q1 Q2 Q3 Q4 H1 H2 Full Year
Derived weighted average exchange rate (1) for:
Operating revenue SGDFY2017 1.0125 1.0256 1.0568 1.0735 1.0192 1.0649 1.0426FY2016 1.0446 1.0089 1.0138 1.0129 1.0267 1.0134 1.0201Change (last corresponding period) -3.1% 1.7% 4.2% 6.0% -0.7% 5.1% 2.2%
Underlying net profit SGDFY2017 1.0098 1.0250 1.0566 1.0731 1.0172 1.0660 1.0435FY2016 1.0445 1.0086 1.0140 1.0154 1.0252 1.0148 1.0196Change (last corresponding period) -3.3% 1.6% 4.2% 5.7% -0.8% 5.0% 2.3%
1 US Dollar buys: Q1 Q2 Q3 Q4 H1 H2 Full Year
Derived weighted average exchange rate (2) for:
Operating revenue SGDFY2017 1.3580 1.3532 1.4099 1.4177 1.3552 1.4136 1.3841FY2016 1.3429 1.3911 1.4074 1.4018 1.3672 1.3962 1.3859Change (last corresponding period) 1.1% -2.7% 0.2% 1.1% -0.9% 1.2% -0.1%
Notes: (1) The monthly income statement of Optus is translated from Australian Dollar to Singapore Dollar based on
the average exchange rate for the month. These rates represent the derived weighted average exchange rates for the Australian Dollar for the period to date.
(2) The income statements of Trustwave, Amobee and HOOQ are translated from US Dollar to Singapore Dollar based on these derived weighted average exchanges rates for the period to date.
1 Singapore Dollar buys: Q1 Q2 Q3 Q4 H1 H2 Full Year
RupiahFY2017 9,837 9,713 9,405 9,435 9,771 9,420 9,591 FY2016 9,804 10,000 9,804 9,615 9,910 9,704 9,803 Change (last corresponding period) 0.3% -2.9% -4.1% -1.9% -1.4% -2.9% -2.2%
Indian RupeeFY2017 49.2 49.4 47.8 47.2 49.3 47.5 48.6 FY2016 47.2 46.7 46.7 48.1 47.0 47.4 47.2 Change (last corresponding period) 4.2% 5.8% 2.4% -1.9% 4.9% 0.2% 3.0%
BahtFY2017 25.9 25.8 25.1 24.8 25.9 24.9 25.4 FY2016 24.8 25.3 25.4 25.4 25.0 25.5 25.2 Change (last corresponding period) 4.4% 2.0% -1.2% -2.4% 3.6% -2.4% 0.8%
PesoFY2017 34.3 34.8 34.8 35.3 34.5 35.1 34.8 FY2016 33.2 33.1 33.3 33.7 33.2 33.6 33.4 Change (last corresponding period) 3.3% 5.1% 4.5% 4.7% 3.9% 4.5% 4.2%