singapore industry focus singapore rigbuilders for these jack-ups as contract prices are also...
TRANSCRIPT
ed-CK / sa- YM
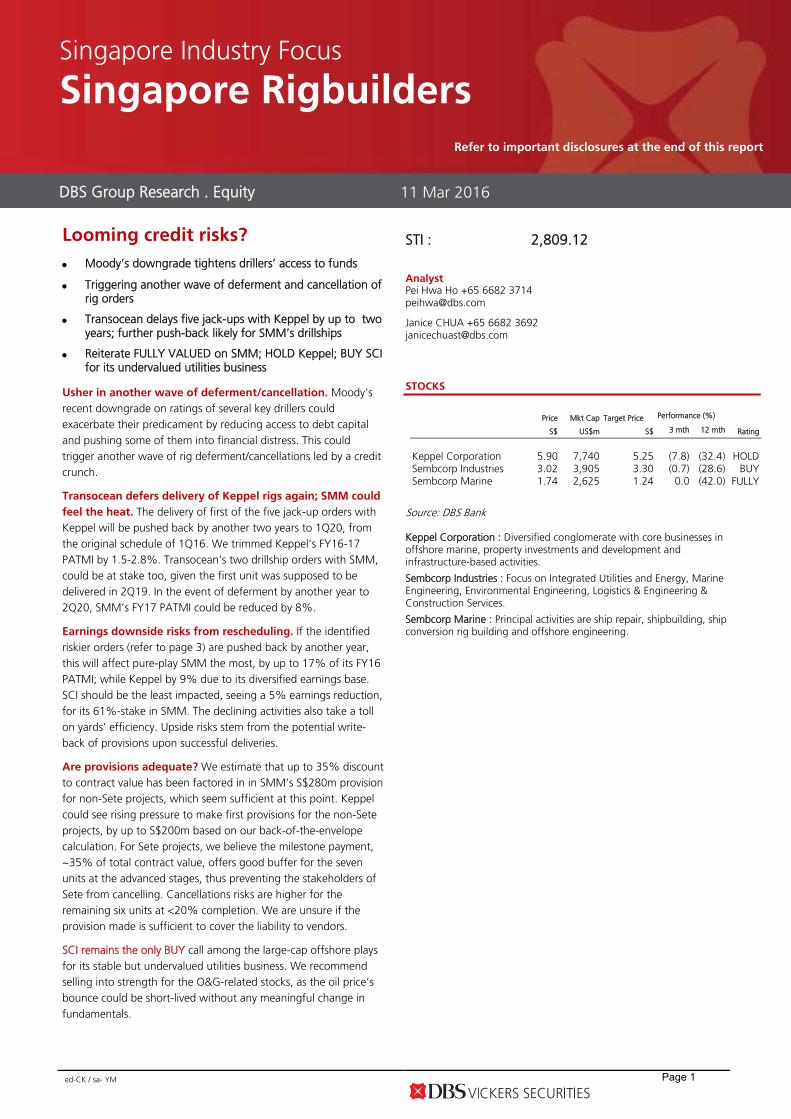
Looming credit risks?
Moody’s downgrade tightens drillers’ access to funds
Triggering another wave of deferment and cancellation of rig orders
Transocean delays five jack-ups with Keppel by up to two years; further push-back likely for SMM’s drillships
Reiterate FULLY VALUED on SMM; HOLD Keppel; BUY SCI for its undervalued utilities business
Usher in another wave of deferment/cancellation. Moody’s recent downgrade on ratings of several key drillers could exacerbate their predicament by reducing access to debt capital and pushing some of them into financial distress. This could trigger another wave of rig deferment/cancellations led by a credit crunch.
Transocean defers delivery of Keppel rigs again; SMM could
feel the heat. The delivery of first of the five jack-up orders with Keppel will be pushed back by another two years to 1Q20, from the original schedule of 1Q16. We trimmed Keppel’s FY16-17 PATMI by 1.5-2.8%. Transocean’s two drillship orders with SMM, could be at stake too, given the first unit was supposed to be delivered in 2Q19. In the event of deferment by another year to 2Q20, SMM’s FY17 PATMI could be reduced by 8%.
Earnings downside risks from rescheduling. If the identified riskier orders (refer to page 3) are pushed back by another year, this will affect pure-play SMM the most, by up to 17% of its FY16 PATMI; while Keppel by 9% due to its diversified earnings base. SCI should be the least impacted, seeing a 5% earnings reduction, for its 61%-stake in SMM. The declining activities also take a toll on yards’ efficiency. Upside risks stem from the potential write-back of provisions upon successful deliveries.
Are provisions adequate? We estimate that up to 35% discount to contract value has been factored in in SMM’s S$280m provision for non-Sete projects, which seem sufficient at this point. Keppel could see rising pressure to make first provisions for the non-Sete projects, by up to S$200m based on our back-of-the-envelope calculation. For Sete projects, we believe the milestone payment, ~35% of total contract value, offers good buffer for the seven units at the advanced stages, thus preventing the stakeholders of Sete from cancelling. Cancellations risks are higher for the remaining six units at <20% completion. We are unsure if the provision made is sufficient to cover the liability to vendors.
SCI remains the only BUY call among the large-cap offshore plays for its stable but undervalued utilities business. We recommend selling into strength for the O&G-related stocks, as the oil price’s bounce could be short-lived without any meaningful change in fundamentals.
STI : 2,809.12
Analyst Pei Hwa Ho +65 6682 3714 [email protected]
Janice CHUA +65 6682 3692 [email protected]
STOCKS
Source: DBS Bank Keppel Corporation : Diversified conglomerate with core businesses in offshore marine, property investments and development and infrastructure-based activities.
Sembcorp Industries : Focus on Integrated Utilities and Energy, Marine Engineering, Environmental Engineering, Logistics & Engineering & Construction Services.
Sembcorp Marine : Principal activities are ship repair, shipbuilding, ship conversion rig building and offshore engineering.
DBS Group Research . Equity 11 Mar 2016
Singapore Industry Focus
Singapore Rigbuilders
Refer to important disclosures at the end of this report
Price Mkt Cap Target Price Performance (%)
S$ US$m S$ 3 mth 12 mth Rating
Keppel Corporation 5.90 7,740 5.25 (7.8) (32.4) HOLD Sembcorp Industries 3.02 3,905 3.30 (0.7) (28.6) BUY Sembcorp Marine 1.74 2,625 1.24 0.0 (42.0) FULLY
Page 1

Industry Focus
Singapore Rigbuilders
Page 2
Usher in another wave of deferment and cancellation Moody’s downgraded ratings of drillers by up to five notches each on 29 Feb. Transocean’s credit rating was lowered three notches from Ba2 to B2; Rowan saw its rating fall from Baa3 to B1; Ensco faced the largest axe with its rating chopped five notches from Baa2 to B1. Moody’s justified the downgrades by saying that drillers face headwinds of “significantly reduced upstream capital spending and the declining creditworthiness of customers, coupled with a steady supply of newbuild rigs entering an already-oversupplied market”. Moody’s cut ratings at six offshore drillers on Feb 29, 2016
Company From To Changes (notch)
Diamond Baa2 Ba2 (3)
Transocean Ba2 B2 (3)
Rowan Baa3 B1 (4)
Noble Holdings Baa3 B1 (4)
Atwood Oceanics Ba3 Caa1 (4)
Ensco Baa2 B1 (5)
Source: Moody’s Setting up the stage for credit crunch. Moody’s downgrade could exacerbate drillers’ predicament by reducing access to debt capital and pushing some of them into financial distress. This could then trigger another wave of rig deferment/ cancellations led by a credit crunch. Transocean pushed back deliveries for five jack-ups with Keppel by up to two years. About a week after Moody’s downgrade, Transocean announced on 8 Mar that it has reached an agreement with Keppel O&M to defer the delivery of the five jack-up orders by up to two years from 2020 onwards. This 3rd deferment pushes back the delivery of the first of the five jack-ups by up to four years from the original schedule of 1Q 2016 to 1Q 2020. Though, the remaining four units are now scheduled for delivery in shorter intervals of 2-3 months thereafter, compared to the 6-month interval agreed in the last deferment and 4-month interval in the original schedule.
Transocean pushed back delivery of five jack-ups with Keppel by up to 48 months from original schedule
Delivery Original Feb-15 May-15 Mar-16
First jack-up 1Q16 3Q16 1Q18 1Q20 Delays - 6-mth 18-mth 24-mth
Intervals for subsequent four jack-ups
4-mth 4-mth 6-mth 2-3mth
Source: Transocean Keppel: 1.5-2.8% bottomline impact from the deferments. Keppel was awarded the contracts worth US$1.1bn in Nov 2013. We believe the talks on further push-back would have been ongoing for quite a while, given the deteriorating market condition since Dec 2015 and Keppel is unlikely to have commenced construction works on these units, given typical lead time for a jack-up rig is approximately 24 months. Hence, Keppel is probably not required to make any provision for these jack-ups as contract prices are also intact. As for the commitment with equipment suppliers, we are hopeful that Keppel is able to make the necessary adjustment accordingly without incurring additional charges, out of long-term business relationships under the current climate. The push-back will, however, result in slower revenue drawdown and potentially affect the overall efficiency of the yard. We are trimming our FY16/17 PATMI forecasts by 1.5-2.8% after adjusting the delivery schedule for the five Transocean units. SMM might feel the heat too? SMM has two drillship orders worth US$1.08bn with Transocean, which also had been pushed back by two years last year. We believe there may be further rescheduling on these orders as well. In that case, SMM’s FY17 earnings could be impacted by c.8%, assuming a delay of >1-year.
Page 2
Industry Focus
Singapore Rigbuilders
Page 3
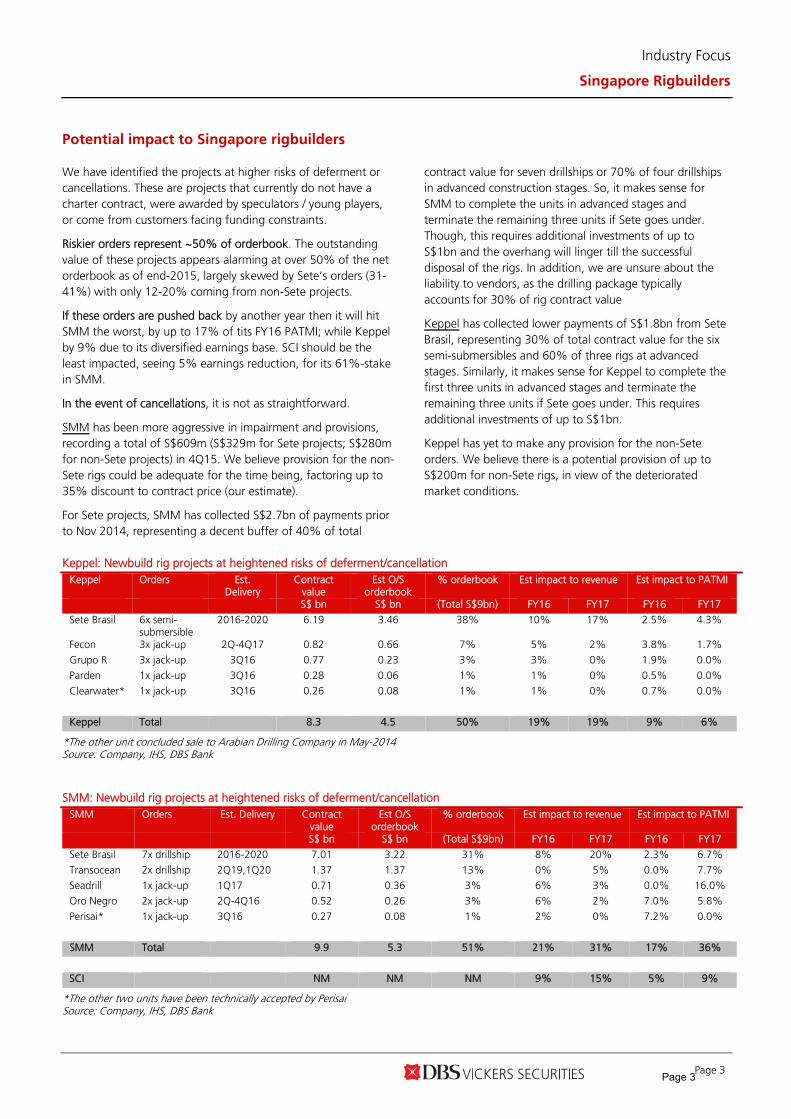
Potential impact to Singapore rigbuilders
We have identified the projects at higher risks of deferment or cancellations. These are projects that currently do not have a charter contract, were awarded by speculators / young players, or come from customers facing funding constraints.
Riskier orders represent ~50% of orderbook. The outstanding value of these projects appears alarming at over 50% of the net orderbook as of end-2015, largely skewed by Sete’s orders (31-41%) with only 12-20% coming from non-Sete projects.
If these orders are pushed back by another year then it will hit SMM the worst, by up to 17% of tits FY16 PATMI; while Keppel by 9% due to its diversified earnings base. SCI should be the least impacted, seeing 5% earnings reduction, for its 61%-stake in SMM.
In the event of cancellations, it is not as straightforward.
SMM has been more aggressive in impairment and provisions, recording a total of S$609m (S$329m for Sete projects; S$280m for non-Sete projects) in 4Q15. We believe provision for the non-Sete rigs could be adequate for the time being, factoring up to 35% discount to contract price (our estimate).
For Sete projects, SMM has collected S$2.7bn of payments prior to Nov 2014, representing a decent buffer of 40% of total
contract value for seven drillships or 70% of four drillships in advanced construction stages. So, it makes sense for SMM to complete the units in advanced stages and terminate the remaining three units if Sete goes under. Though, this requires additional investments of up to S$1bn and the overhang will linger till the successful disposal of the rigs. In addition, we are unsure about the liability to vendors, as the drilling package typically accounts for 30% of rig contract value
Keppel has collected lower payments of S$1.8bn from Sete Brasil, representing 30% of total contract value for the six semi-submersibles and 60% of three rigs at advanced stages. Similarly, it makes sense for Keppel to complete the first three units in advanced stages and terminate the remaining three units if Sete goes under. This requires additional investments of up to S$1bn.
Keppel has yet to make any provision for the non-Sete orders. We believe there is a potential provision of up to S$200m for non-Sete rigs, in view of the deteriorated market conditions.
Keppel: Newbuild rig projects at heightened risks of deferment/cancellation
Keppel Orders Est. Delivery
Contract value
Est O/S orderbook
% orderbook Est impact to revenue Est impact to PATMI
S$ bn S$ bn (Total S$9bn) FY16 FY17 FY16 FY17
Sete Brasil 6x semi-submersible
2016-2020 6.19 3.46 38% 10% 17% 2.5% 4.3%
Fecon 3x jack-up 2Q-4Q17 0.82 0.66 7% 5% 2% 3.8% 1.7%
Grupo R 3x jack-up 3Q16 0.77 0.23 3% 3% 0% 1.9% 0.0%
Parden 1x jack-up 3Q16 0.28 0.06 1% 1% 0% 0.5% 0.0%
Clearwater* 1x jack-up 3Q16 0.26 0.08 1% 1% 0% 0.7% 0.0%
Keppel Total 8.3 4.5 50% 19% 19% 9% 6%
*The other unit concluded sale to Arabian Drilling Company in May-2014 Source: Company, IHS, DBS Bank
SMM: Newbuild rig projects at heightened risks of deferment/cancellation SMM Orders Est. Delivery Contract
value Est O/S
orderbook % orderbook Est impact to revenue Est impact to PATMI
S$ bn S$ bn (Total S$9bn) FY16 FY17 FY16 FY17
Sete Brasil 7x drillship 2016-2020 7.01 3.22 31% 8% 20% 2.3% 6.7%
Transocean 2x drillship 2Q19,1Q20 1.37 1.37 13% 0% 5% 0.0% 7.7%
Seadrill 1x jack-up 1Q17 0.71 0.36 3% 6% 3% 0.0% 16.0%
Oro Negro 2x jack-up 2Q-4Q16 0.52 0.26 3% 6% 2% 7.0% 5.8%
Perisai* 1x jack-up 3Q16 0.27 0.08 1% 2% 0% 7.2% 0.0%
SMM Total 9.9 5.3 51% 21% 31% 17% 36%
SCI NM NM NM 9% 15% 5% 9%
*The other two units have been technically accepted by Perisai Source: Company, IHS, DBS Bank
Page 3

Industry Focus
Singapore Rigbuilders
Page 4
Keppel: Orderbook (S$9bn) SMM: Orderbook (S$10.4bn)
*For SMNM, Floaters refer to FPSO / FSO projects Source: Company Singapore rigbuilders’ provision status
Company Impairment/provisions in 4Q15
Methodology More to come?
Shipyards Keppel Corp S$230m for Sete Brasil
projects Net realisable value of rigs under construction, after assessing the construction progress, payment received, liable payment to vendors and market value of rigs.
Further provisions possible on Sete Brasil rigs; In addition, Keppel has yet made any provisions for the non-Sete projects, which we estimate could total up to US$200m for some of the riskier projects from Grupo R, Fecon and Clearwater.
Sembcorp Marine
S$329m for Sete Brasil projects; and S$280m for non-Sete rigs
Net realisable value of rigs under construction, after assessing the construction progress, payment received, liable payment to vendors and market value of rigs.
Further provisions possible on Sete Brasil rigs; We believe SMM has made adequate provisions for the non-Sete units at risks. But recent yard accident in end Feb-2016 that damaged the Noble's CJ70 harsh-environment jack-up rig due for delivery in 2Q16 may result in additional costs, if not fully covered by insurance.
Source: Company, DBS Bank
Delivery Jackup Semi-submersible
Drillship Floater Offshore Platform
2016 6 - 1 1 4
Delivery Jackup Semi-submersible
FPSO / FSU
Pipelay vessel
Liftboat
2016 12 2 5 1 1
Jackups, 1.5, 17%
Semi‐submersibles,
4.4, 49%
FPSOs / FLNGs, 2.7, 30%
Specialised vessels, 0.2, 2%
Others, 0.2, 2%
Keppel
Jackups, 0.6, 6%
Semi‐submersibles,
1.5, 15%
Drillships, 4.5, 43%
Floaters, 1.9, 18%
Offshore Platforms, 1.8,
18%
Sembcorp Marine
Page 4

Industry Focus
Singapore Rigbuilders
Page 5
Keppel: Rig orderbook as of end 2015
Date announced
Type of rig / vessel Contract value
(US$ m)
Contract Value, (S$ m)
Original Delivery
Rescheduling Customer
Semi-Submersibles
4-Jun-13 DSS 38M semisubmersible rig 576 720.0 4Q16 SOCAR 20-Aug-13 KFELS SSAU5000NG accommodation semi 280 355.6 4Q15 2016 Floatel 22-Dec-11 DSS 38E semisubmersible rig 809 1,043.6 4Q15 Deferred Sete Brasil
7-Aug-12 DSS 38E semisubmersible rig 824 1,030.0 4Q16 Deferred Sete Brasil
7-Aug-12 DSS 38E semisubmersible rig 824 1,030.0 3Q17 Deferred Sete Brasil
7-Aug-12 DSS 38E semisubmersible rig 824 1,030.0 2Q18 Deferred Sete Brasil
7-Aug-12 DSS 38E semisubmersible rig 824 1,030.0 4Q18 Deferred Sete Brasil
7-Aug-12 DSS 38E semisubmersible rig 824 1,030.0 3Q19 Deferred Sete Brasil
Total 7,269
Jack-Ups 16-Sep-14 KFELS B class 227 288.1 1Q16 Gulf Drilling Int
21-Nov-13 KFELS Super A class 265.0 330.5 2Q16 Ensco PLC 28-Mar-13 KFELS B Class jackup rig 205 254.7 2Q15 1Q16 Grupo R 28-Mar-13 KFELS B Class jackup rig 205 254.7 3Q15 1Q16 Grupo R 28-Mar-13 KFELS B Class jackup rig 205 254.7 3Q15 3Q16 Grupo R 28-Mar-13 KFELS B Class jackup rig 205 254.7 4Q15 3Q16 Grupo R 15-Jul-13 KFELS B Class jackup rig 206 260.0 4Q15 3Q16 Grupo R 2-Aug-13 KFELS B Class jackup rig 206 261.6 4Q15 3Q16 Parden 1-Oct-13 KFELS B Class jackup rig 220 276.3 4Q15 2016 Clearwater
1-Oct-13 KFELS B Class jackup rig 220 276.3 1Q16 3Q16 Clearwater 10-Oct-13 KFELS B Class jackup rig 240 300.0 4Q15 2016 Perforadora Central 3-Mar-14 KFELS N class plus 500 633.9 1Q17 TS Offshore
13-Feb-14 KFELS B class 217 274.3 3Q16 2Q17 Fecon International 13-Feb-14 KFELS B class 217 274.3 4Q16 3Q17 Fecon International 13-Feb-14 KFELS B class 217 274.3 4Q16 4Q17 Fecon International 7-Nov-13
KFELS Super B class 220 273.5 1Q16 1Q20 Transocean
7-Nov-13 KFELS Super B class 220 273.5 2Q16 2Q20 Transocean 7-Nov-13 KFELS Super B class 220 273.5 4Q16 3Q20 Transocean 7-Nov-13 KFELS Super B class 220 273.5 1Q17 4Q20 Transocean 7-Nov-13 KFELS Super B class 220 273.5 3Q17 1Q21 Transocean 31-Oct-14 KFELS Super B class 240 306.8 4Q16 BOT Lease Co., Ltd
Total 6,142
Land Rig 29-Dec-14 Land drilling rig 100 132.3 mid-2016 CDC
Source: Company, DBS Bank
Page 5
Industry Focus
Singapore Rigbuilders
Page 6
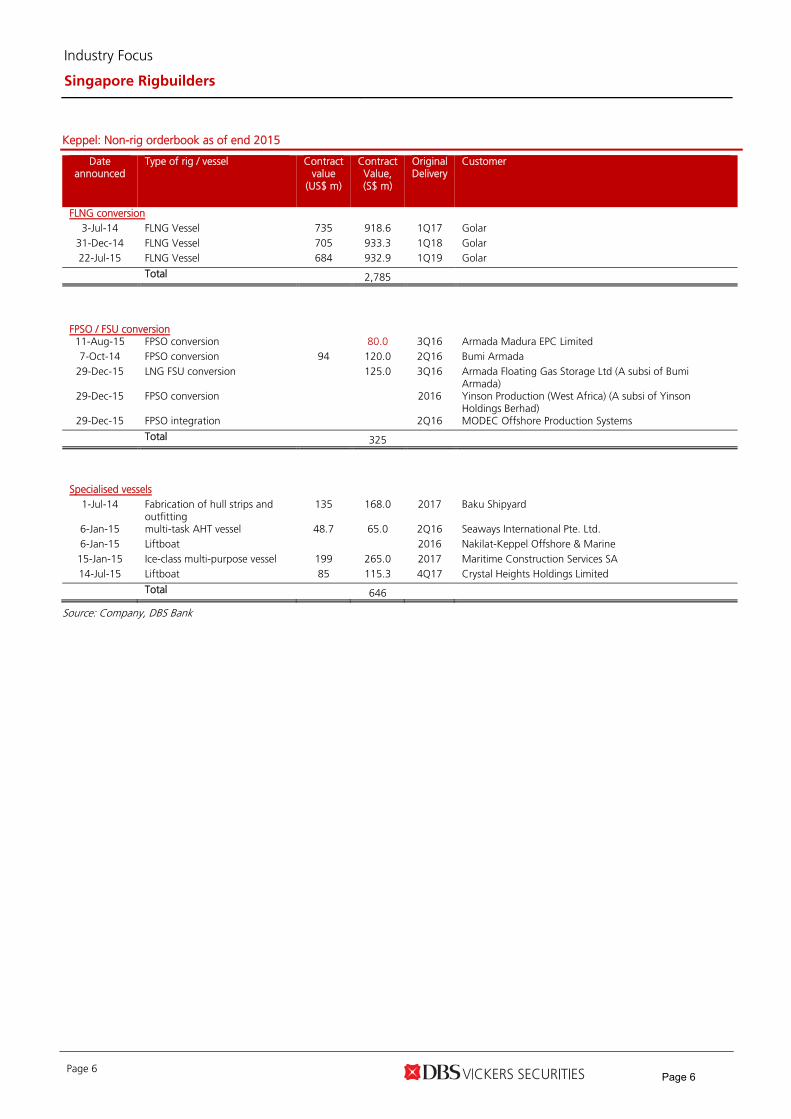
Keppel: Non-rig orderbook as of end 2015
Date announced
Type of rig / vessel Contract value
(US$ m)
Contract Value, (S$ m)
Original Delivery
Customer
FLNG conversion 3-Jul-14 FLNG Vessel 735 918.6 1Q17 Golar
31-Dec-14 FLNG Vessel 705 933.3 1Q18 Golar 22-Jul-15 FLNG Vessel 684 932.9 1Q19 Golar
Total 2,785
FPSO / FSU conversion 11-Aug-15 FPSO conversion 80.0 3Q16 Armada Madura EPC Limited 7-Oct-14 FPSO conversion 94 120.0 2Q16 Bumi Armada
29-Dec-15 LNG FSU conversion 125.0 3Q16 Armada Floating Gas Storage Ltd (A subsi of Bumi Armada)
29-Dec-15 FPSO conversion 2016 Yinson Production (West Africa) (A subsi of Yinson Holdings Berhad)
29-Dec-15 FPSO integration 2Q16 MODEC Offshore Production Systems
Total 325
Specialised vessels 1-Jul-14 Fabrication of hull strips and
outfitting 135 168.0 2017 Baku Shipyard
6-Jan-15 multi-task AHT vessel 48.7 65.0 2Q16 Seaways International Pte. Ltd. 6-Jan-15 Liftboat 2016 Nakilat-Keppel Offshore & Marine
15-Jan-15 Ice-class multi-purpose vessel 199 265.0 2017 Maritime Construction Services SA 14-Jul-15 Liftboat 85 115.3 4Q17 Crystal Heights Holdings Limited
Total 646
Source: Company, DBS Bank
Page 6

Industry Focus
Singapore Rigbuilders
Page 7
Sembcorp Marine: Rig orderbook as of end 2015 Date announced
Type of rig / vessel(s) Contract value
(US$ m)
Value, Est
(S$ m)
Original Delivery
Rescheduling Customer
Drillship 6-Feb-12 Drillship - Jurong Espadon design 792.5 983.0 2Q15 Deferred Sete Brasil
8-Aug-12 Drillship - Jurong Espadon design 806.4 1,008.0 4Q16 Deferred Sete Brasil
8-Aug-12 Drillship - Jurong Espadon design 806.4 1,008.0 3Q17 Deferred Sete Brasil
8-Aug-12 Drillship - Jurong Espadon design 806.4 1,008.0 2Q18 Deferred Sete Brasil
8-Aug-12 Drillship - Jurong Espadon design 806.4 1,008.0 4Q18 Deferred Sete Brasil
8-Aug-12 Drillship - Jurong Espadon design 806.4 1,008.0 2Q19 Deferred Sete Brasil
29-Nov-12 Drillship - Jurong Espadon design 806.4 991.9 3Q16 Deferred Sete Brasil
27-Feb-14 Drillship - Jurong Espadon III design 540.0 684.1 2Q17 2Q19 Transocean
27-Feb-14 Drillship - Jurong Espadon III design 540.0 684.1 1Q18 1Q20 Transocean
Total 6,711 8,383
Semi-submersible 3-Apr-12 Harsh-environment ultra-deepwater semi-submersible rig 568.0 712.8 1Q2015 1Q17 Seadrill
19-Nov-12 GVA 3000E design Accommodation semi-submersible rig 295.2 363.1 4Q14 1Q16 Prosafe 12-Sep-13 Semi-submersible Well Intervention Rig 346 438.1 mid-2016 Helix 15-Jul-15 Semi-submersible crane vessel 950 1,292.0 4Q18 Heerema
Total 2,451 3,179
Jackup 28-Feb-13 Baker Marine Pacific Class 400 jackup rig 208.0 257.9 2Q 2015 Technically
accepted in 1Q16
Perisai
31-Dec-13 Baker Marine Pacific Class 400 jack up 211.5 268.0 3Q2016 Deferred Perisai 18-Mar-13 Baker Marine Pacific Class 400 jackup rig 208.5 260.6 End 1Q 2015 Technically
accepted in 1Q16
Oro Negro
1-Jul-13 Baker Marine Pacific Class 400 jackup rig 208.5 260.6 Jul-15 2Q16 Oro Negro 1-Jul-13 Baker Marine Pacific Class 400 jackup rig 208.5 260.6 3Q2015 4Q16 Oro Negro 26-Feb-14 Baker Marine Pacific Class 400 jackup rig 214.3 270.9 4Q15 Terminated Marco Polo 28-May-13 Gusto MSC CJ70 596 739.0 1Q2016 Noble Corp 21-May-14 Friede & Goldman JU 2000E jackup rig 236.0 295.6 2Q16 Hercules 3-Nov-14 Baker Marine Pacific Class 400 jackup rig 240 306.8 4Q16 BOT Lease
Total 2,331 2,920
Source: Company, DBS Bank
Page 7

Industry Focus
Singapore Rigbuilders
Page 8
Sembcorp Marine: Non-rig orderbook as of end 2015 Date announced
Type of rig / vessel(s) Contract value (US$ m)
Contract Value, Est (S$ m)
Original Delivery Customer
Floaters 21-Jul-14 FPSO 238.2 300.0 4Q16 Saipem 21-Jul-14 FPSO 238.2 300.0 2Q17 Saipem 13-Oct-14 FPSO 696 887.4 3Q16 OOGTK Libra 20-Oct-14 FPSO 129 180.0 2016 MODEC Offshore Production 22-Apr-15 FSO 40 56.0 Jun-16 Teekay Offshore 18-Nov-15 FSO Newbuild 150.0 214.5 1Q18 MODEC Offshore Production
Total 1,491 1,938
Offshore Platforms (Key projects) 23-Sep-14 LNG Process Modules 190 241.1 Jun-16 Bechtel 1-Sep-15 Fixed platform topsides 1,110.0 1,565.1 2Q18 Maersk Oil North Sea
Total 1,330 1,848
Source: Company, DBS Bank
Page 8
ASIAN INSIGHTS VICKERS SECURITIES ed: CK / sa: YM
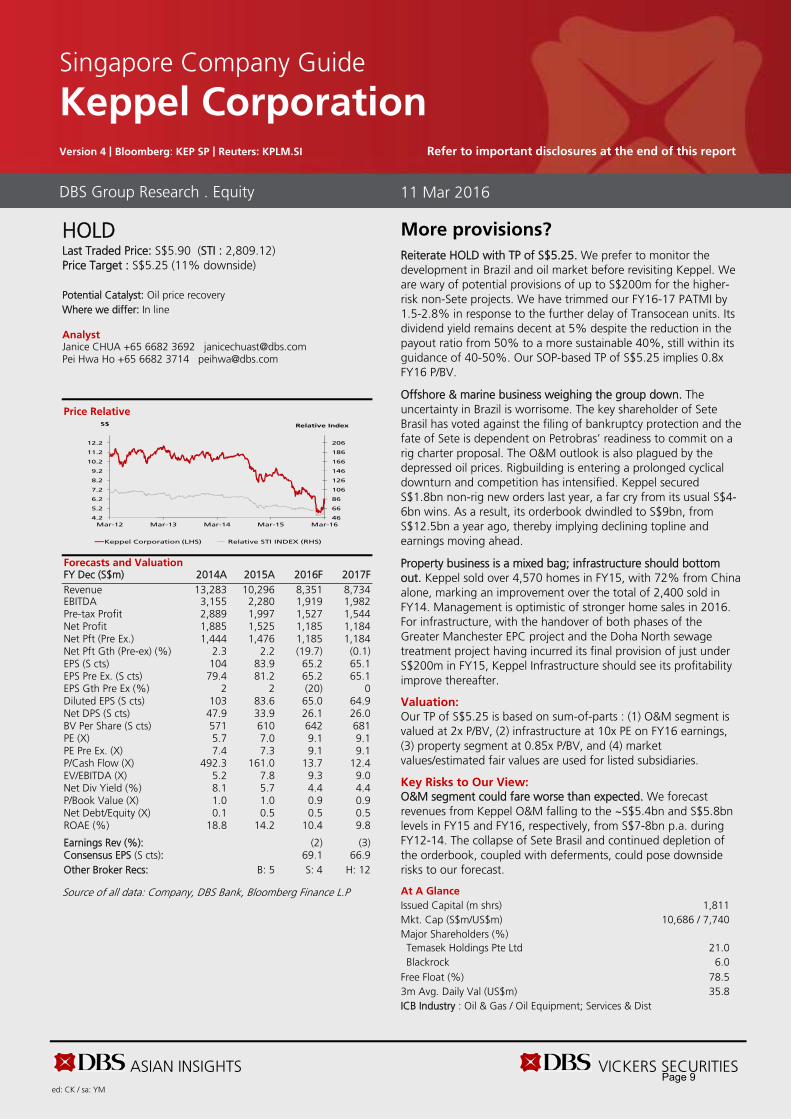
HOLD Last Traded Price: S$5.90 (STI : 2,809.12) Price Target : S$5.25 (11% downside) Potential Catalyst: Oil price recovery Where we differ: In line Analyst Janice CHUA +65 6682 3692 [email protected] Pei Hwa Ho +65 6682 3714 [email protected]
Price Relative
Forecasts and Valuation FY Dec (S$m) 2014A 2015A 2016F 2017F Revenue 13,283 10,296 8,351 8,734 EBITDA 3,155 2,280 1,919 1,982 Pre-tax Profit 2,889 1,997 1,527 1,544 Net Profit 1,885 1,525 1,185 1,184 Net Pft (Pre Ex.) 1,444 1,476 1,185 1,184 Net Pft Gth (Pre-ex) (%) 2.3 2.2 (19.7) (0.1) EPS (S cts) 104 83.9 65.2 65.1 EPS Pre Ex. (S cts) 79.4 81.2 65.2 65.1 EPS Gth Pre Ex (%) 2 2 (20) 0 Diluted EPS (S cts) 103 83.6 65.0 64.9 Net DPS (S cts) 47.9 33.9 26.1 26.0 BV Per Share (S cts) 571 610 642 681 PE (X) 5.7 7.0 9.1 9.1 PE Pre Ex. (X) 7.4 7.3 9.1 9.1 P/Cash Flow (X) 492.3 161.0 13.7 12.4 EV/EBITDA (X) 5.2 7.8 9.3 9.0 Net Div Yield (%) 8.1 5.7 4.4 4.4 P/Book Value (X) 1.0 1.0 0.9 0.9 Net Debt/Equity (X) 0.1 0.5 0.5 0.5 ROAE (%) 18.8 14.2 10.4 9.8 Earnings Rev (%): (2) (3) Consensus EPS (S cts): 69.1 66.9 Other Broker Recs: B: 5 S: 4 H: 12
Source of all data: Company, DBS Bank, Bloomberg Finance L.P
More provisions?
Reiterate HOLD with TP of S$5.25. We prefer to monitor the development in Brazil and oil market before revisiting Keppel. We are wary of potential provisions of up to S$200m for the higher-risk non-Sete projects. We have trimmed our FY16-17 PATMI by 1.5-2.8% in response to the further delay of Transocean units. Its dividend yield remains decent at 5% despite the reduction in the payout ratio from 50% to a more sustainable 40%, still within its guidance of 40-50%. Our SOP-based TP of S$5.25 implies 0.8x FY16 P/BV.
Offshore & marine business weighing the group down. The uncertainty in Brazil is worrisome. The key shareholder of Sete Brasil has voted against the filing of bankruptcy protection and the fate of Sete is dependent on Petrobras’ readiness to commit on a rig charter proposal. The O&M outlook is also plagued by the depressed oil prices. Rigbuilding is entering a prolonged cyclical downturn and competition has intensified. Keppel secured S$1.8bn non-rig new orders last year, a far cry from its usual S$4-6bn wins. As a result, its orderbook dwindled to S$9bn, from S$12.5bn a year ago, thereby implying declining topline and earnings moving ahead.
Property business is a mixed bag; infrastructure should bottom out. Keppel sold over 4,570 homes in FY15, with 72% from China alone, marking an improvement over the total of 2,400 sold in FY14. Management is optimistic of stronger home sales in 2016. For infrastructure, with the handover of both phases of the Greater Manchester EPC project and the Doha North sewage treatment project having incurred its final provision of just under S$200m in FY15, Keppel Infrastructure should see its profitability improve thereafter.
Valuation:
Our TP of S$5.25 is based on sum-of-parts : (1) O&M segment is valued at 2x P/BV, (2) infrastructure at 10x PE on FY16 earnings, (3) property segment at 0.85x P/BV, and (4) market values/estimated fair values are used for listed subsidiaries.
Key Risks to Our View: O&M segment could fare worse than expected. We forecast revenues from Keppel O&M falling to the ~S$5.4bn and S$5.8bn levels in FY15 and FY16, respectively, from S$7-8bn p.a. during FY12-14. The collapse of Sete Brasil and continued depletion of the orderbook, coupled with deferments, could pose downside risks to our forecast.
At A Glance Issued Capital (m shrs) 1,811 Mkt. Cap (S$m/US$m) 10,686 / 7,740 Major Shareholders (%) Temasek Holdings Pte Ltd 21.0 Blackrock 6.0
Free Float (%) 78.5 3m Avg. Daily Val (US$m) 35.8 ICB Industry : Oil & Gas / Oil Equipment; Services & Dist
DBS Group Research . Equity 11 Mar 2016
Singapore Company Guide
Keppel Corporation Version 4 | Bloomberg: KEP SP | Reuters: KPLM.SI Refer to important disclosures at the end of this report
46
66
86
106
126
146
166
186
206
4.2
5.2
6.2
7.2
8.2
9.2
10.2
11.2
12.2
Mar-12 Mar-13 Mar-14 Mar-15 Mar-16
Relative IndexS$
Keppel Corporation (LHS) Relative STI INDEX (RHS)
Page 9
ASIAN INSIGHTS VICKERS SECURITIES Page 2
Company Guide
Keppel Corporation
CRITICAL DATA POINTS TO WATCH
Earnings Drivers:
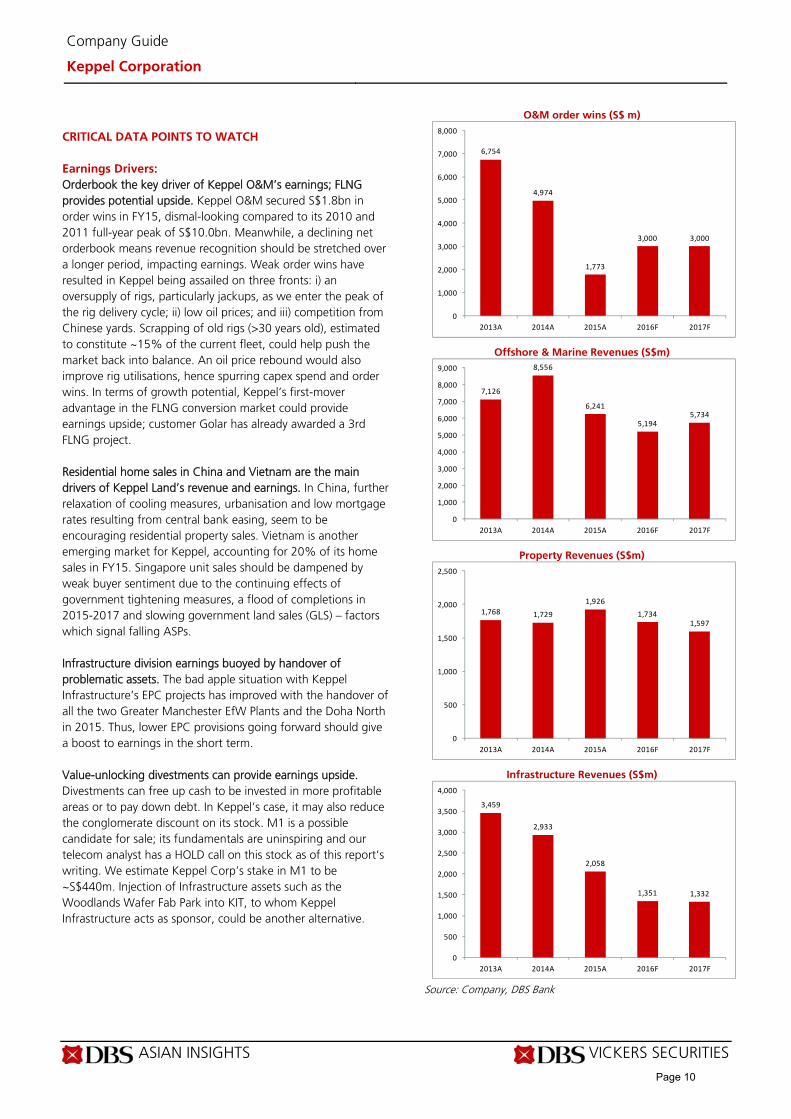
Orderbook the key driver of Keppel O&M’s earnings; FLNG provides potential upside. Keppel O&M secured S$1.8bn in order wins in FY15, dismal-looking compared to its 2010 and 2011 full-year peak of S$10.0bn. Meanwhile, a declining net orderbook means revenue recognition should be stretched over a longer period, impacting earnings. Weak order wins have resulted in Keppel being assailed on three fronts: i) an oversupply of rigs, particularly jackups, as we enter the peak of the rig delivery cycle; ii) low oil prices; and iii) competition from Chinese yards. Scrapping of old rigs (>30 years old), estimated to constitute ~15% of the current fleet, could help push the market back into balance. An oil price rebound would also improve rig utilisations, hence spurring capex spend and order wins. In terms of growth potential, Keppel’s first-mover advantage in the FLNG conversion market could provide earnings upside; customer Golar has already awarded a 3rd FLNG project. Residential home sales in China and Vietnam are the main drivers of Keppel Land’s revenue and earnings. In China, further relaxation of cooling measures, urbanisation and low mortgage rates resulting from central bank easing, seem to be encouraging residential property sales. Vietnam is another emerging market for Keppel, accounting for 20% of its home sales in FY15. Singapore unit sales should be dampened by weak buyer sentiment due to the continuing effects of government tightening measures, a flood of completions in 2015-2017 and slowing government land sales (GLS) – factors which signal falling ASPs. Infrastructure division earnings buoyed by handover of problematic assets. The bad apple situation with Keppel Infrastructure’s EPC projects has improved with the handover of all the two Greater Manchester EfW Plants and the Doha North in 2015. Thus, lower EPC provisions going forward should give a boost to earnings in the short term. Value-unlocking divestments can provide earnings upside. Divestments can free up cash to be invested in more profitable areas or to pay down debt. In Keppel’s case, it may also reduce the conglomerate discount on its stock. M1 is a possible candidate for sale; its fundamentals are uninspiring and our telecom analyst has a HOLD call on this stock as of this report’s writing. We estimate Keppel Corp’s stake in M1 to be ~S$440m. Injection of Infrastructure assets such as the Woodlands Wafer Fab Park into KIT, to whom Keppel Infrastructure acts as sponsor, could be another alternative.
O&M order wins (S$ m)
Offshore & Marine Revenues (S$m)
Property Revenues (S$m)
Infrastructure Revenues (S$m)
Source: Company, DBS Bank
6,754
4,974
1,773
3,000 3,000
0
1,000
2,000
3,000
4,000
5,000
6,000
7,000
8,000
2013A 2014A 2015A 2016F 2017F
7,126
8,556
6,241
5,1945,734
0
1,000
2,000
3,000
4,000
5,000
6,000
7,000
8,000
9,000
2013A 2014A 2015A 2016F 2017F
1,768 1,729
1,926
1,7341,597
0
500
1,000
1,500
2,000
2,500
2013A 2014A 2015A 2016F 2017F
3,459
2,933
2,058
1,351 1,332
0
500
1,000
1,500
2,000
2,500
3,000
3,500
4,000
2013A 2014A 2015A 2016F 2017F
Page 10
ASIAN INSIGHTS VICKERS SECURITIES Page 3
Company Guide
Keppel Corporation
Balance Sheet:
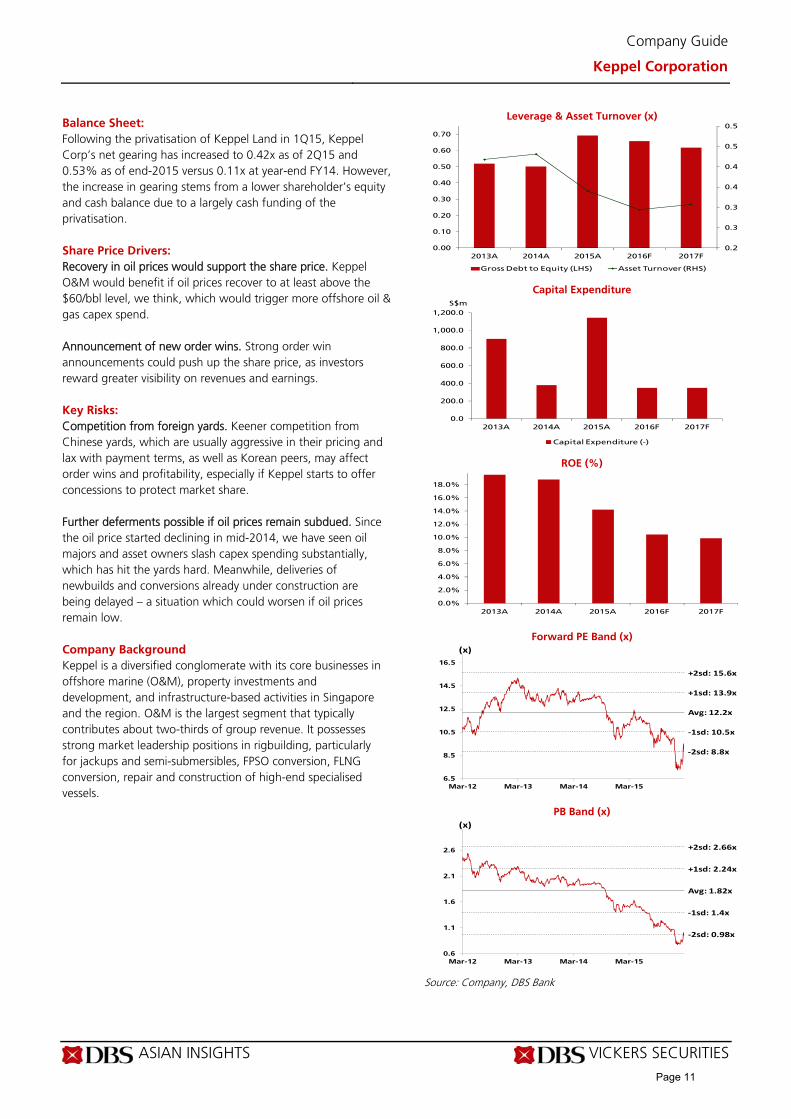
Following the privatisation of Keppel Land in 1Q15, Keppel Corp’s net gearing has increased to 0.42x as of 2Q15 and 0.53% as of end-2015 versus 0.11x at year-end FY14. However, the increase in gearing stems from a lower shareholder’s equity and cash balance due to a largely cash funding of the privatisation.
Share Price Drivers:
Recovery in oil prices would support the share price. Keppel O&M would benefit if oil prices recover to at least above the $60/bbl level, we think, which would trigger more offshore oil & gas capex spend. Announcement of new order wins. Strong order win announcements could push up the share price, as investors reward greater visibility on revenues and earnings.
Key Risks:
Competition from foreign yards. Keener competition from Chinese yards, which are usually aggressive in their pricing and lax with payment terms, as well as Korean peers, may affect order wins and profitability, especially if Keppel starts to offer concessions to protect market share. Further deferments possible if oil prices remain subdued. Since the oil price started declining in mid-2014, we have seen oil majors and asset owners slash capex spending substantially, which has hit the yards hard. Meanwhile, deliveries of newbuilds and conversions already under construction are being delayed – a situation which could worsen if oil prices remain low.
Company Background
Keppel is a diversified conglomerate with its core businesses in offshore marine (O&M), property investments and development, and infrastructure-based activities in Singapore and the region. O&M is the largest segment that typically contributes about two-thirds of group revenue. It possesses strong market leadership positions in rigbuilding, particularly for jackups and semi-submersibles, FPSO conversion, FLNG conversion, repair and construction of high-end specialised vessels.
Leverage & Asset Turnover (x)
Capital Expenditure
ROE (%)
Forward PE Band (x)
PB Band (x)
Source: Company, DBS Bank
0.2
0.3
0.3
0.4
0.4
0.5
0.5
0.00
0.10
0.20
0.30
0.40
0.50
0.60
0.70
2013A 2014A 2015A 2016F 2017F
Gross Debt to Equity (LHS) Asset Turnover (RHS)
0.0
200.0
400.0
600.0
800.0
1,000.0
1,200.0
2013A 2014A 2015A 2016F 2017F
Capital Expenditure (-)
S$m
0.0%
2.0%
4.0%
6.0%
8.0%
10.0%
12.0%
14.0%
16.0%
18.0%
2013A 2014A 2015A 2016F 2017F
Avg: 12.2x
+1sd: 13.9x
+2sd: 15.6x
‐1sd: 10.5x
‐2sd: 8.8x
6.5
8.5
10.5
12.5
14.5
16.5
Mar-12 Mar-13 Mar-14 Mar-15
(x)
Avg: 1.82x
+1sd: 2.24x
+2sd: 2.66x
‐1sd: 1.4x
‐2sd: 0.98x
0.6
1.1
1.6
2.1
2.6
Mar-12 Mar-13 Mar-14 Mar-15
(x)
Page 11

ASIAN INSIGHTS VICKERS SECURITIES Page 4
Company Guide
Keppel Corporation
Key Assumptions
FY Dec 2013A 2014A 2015A 2016F 2017F O&M order wins (S$ m) 6,754 4,974 1,773 3,000 3,000
Segmental Breakdown
FY Dec 2013A 2014A 2015A 2016F 2017F Revenues (S$m) Offshore and Marine 7,126 8,556 6,241 5,194 5,734 Property 1,768 1,729 1,926 1,734 1,597 Infrastructure 3,459 2,933 2,058 1,351 1,332 Investments 27.2 64.0 71.1 71.9 70.7 Others N/A N/A N/A N/A N/A Total 12,380 13,283 10,296 8,351 8,734 EBIT (S$m)
Offshore and Marine 1,059 1,224 597 675 712 Property 981 667 636 385 365 Infrastructure 69.2 466 221 256 293 Investments 17.5 18.2 45.6 18.0 17.7 Others 7.26 (1.6) 14.1 0.0 0.0 Total 2,134 2,373 1,514 1,335 1,388 EBIT Margins (%)
Offshore and Marine 14.9 14.3 9.6 13.0 12.4 Property 55.5 38.6 33.0 22.2 22.8 Infrastructure 2.0 15.9 10.7 19.0 22.0 Investments 64.3 28.4 64.2 25.0 25.0 Others N/A N/A N/A N/A N/A Total 17.2 17.9 14.7 16.0 15.9
Income Statement (S$m)
FY Dec 2013A 2014A 2015A 2016F 2017F Revenue 12,380 13,283 10,296 8,351 8,734 Cost of Goods Sold (8,604) (9,245) (7,023) (5,329) (5,582) Gross Profit 3,777 4,038 3,273 3,022 3,152 Other Opng (Exp)/Inc (1,642) (1,665) (1,760) (1,687) (1,764) Operating Profit 2,134 2,373 1,514 1,335 1,388 Other Non Opg (Exp)/Inc 14.0 11.9 15.0 8.35 8.73 Associates & JV Inc 626 504 504 350 350 Net Interest (Exp)/Inc 19.5 (0.9) (35.5) (167) (203) Exceptional Gain/(Loss) 0.0 0.0 0.0 0.0 0.0 Pre-tax Profit 2,794 2,889 1,997 1,527 1,544 Tax (397) (462) (404) (260) (278) Minority Interest (551) (541) (68.3) (82.4) (82.3) Preference Dividend 0.0 0.0 0.0 0.0 0.0 Net Profit 1,846 1,885 1,525 1,185 1,184 Net Profit before Except. 1,412 1,444 1,476 1,185 1,184 EBITDA 3,017 3,155 2,280 1,919 1,982 Growth Revenue Gth (%) (11.3) 7.3 (22.5) (18.9) 4.6 EBITDA Gth (%) (12.3) 4.6 (27.7) (15.8) 3.3 Opg Profit Gth (%) (18.6) 11.2 (36.2) (11.8) 3.9 Net Profit Gth (Pre-ex) (%) (26.2) 2.3 2.2 (19.7) (0.1) Margins & Ratio Gross Margins (%) 30.5 30.4 31.8 36.2 36.1 Opg Profit Margin (%) 17.2 17.9 14.7 16.0 15.9 Net Profit Margin (%) 14.9 14.2 14.8 14.2 13.6 ROAE (%) 19.5 18.8 14.2 10.4 9.8 ROA (%) 6.2 6.1 5.0 4.2 4.2 ROCE (%) 8.6 9.1 5.6 5.3 5.2 Div Payout Ratio (%) 39.2 46.2 40.4 40.0 40.0 Net Interest Cover (x) NM 2,579.8 42.6 8.0 6.8
Source: Company, DBS Bank
Page 12

ASIAN INSIGHTS VICKERS SECURITIES Page 5
Company Guide
Keppel Corporation
Quarterly / Interim Income Statement (S$m)
FY Dec 4Q2014 1Q2015 2Q2015 3Q2015 4Q2015 Revenue 3,925 2,814 2,563 2,440 2,480 Cost of Goods Sold (2,803) (1,803) (1,920) (1,535) (1,765) Gross Profit 1,122 1,011 643 904 714 Other Oper. (Exp)/Inc (196) (613) (229) (534) (384) Operating Profit 926 398 414 370 331 Other Non Opg (Exp)/Inc 3.77 1.22 4.75 7.01 1.98 Associates & JV Inc 255 61.2 90.2 101 251 Net Interest (Exp)/Inc (23.8) (5.2) (11.3) (9.6) (9.4) Exceptional Gain/(Loss) 0.0 0.0 0.0 0.0 0.0 Pre-tax Profit 1,161 455 498 469 575 Tax (136) (81.3) (88.0) (97.0) (138) Minority Interest (299) (13.9) (13.1) (9.5) (31.8) Net Profit 726 360 397 363 405 Net profit bef Except. 382 357 160 363 596 EBITDA 1,254 526 574 534 646 Growth Revenue Gth (%) 23.3 (28.3) (8.9) (4.8) 1.6 EBITDA Gth (%) 78.9 (58.0) 9.0 (6.9) 20.9 Opg Profit Gth (%) 63.8 (57.0) 4.0 (10.6) (10.7) Net Profit Gth (Pre-ex) (%) 11.6 (6.3) (55.2) 126.6 64.2 Margins Gross Margins (%) 28.6 35.9 25.1 37.1 28.8 Opg Profit Margins (%) 23.6 14.2 16.2 15.2 13.3 Net Profit Margins (%) 18.5 12.8 15.5 14.9 16.3
Balance Sheet (S$m)
FY Dec 2013A 2014A 2015A 2016F 2017F Net Fixed Assets 3,798 2,673 2,846 2,970 3,084 Invts in Associates & JVs 5,482 4,988 5,522 5,820 6,116 Other LT Assets 2,818 2,706 3,988 3,988 3,988 Cash & ST Invts 6,010 6,107 2,118 1,986 2,084 Inventory 8,995 10,681 10,651 9,824 10,275 Debtors 1,916 2,510 3,299 2,784 2,911 Other Current Assets 1,037 1,889 509 509 509 Total Assets 30,056 31,555 28,932 27,880 28,967 ST Debt 517 1,796 1,657 1,657 1,657 Creditor 5,409 5,581 5,752 4,639 4,852 Other Current Liab 3,416 3,597 2,498 1,908 1,990 LT Debt 6,583 5,587 6,602 6,602 6,602 Other LT Liabilities 442 266 498 498 498 Shareholder’s Equity 9,701 10,381 11,096 11,664 12,374 Minority Interests 3,988 4,347 830 913 995 Total Cap. & Liab. 30,056 31,555 28,932 27,880 28,967 Non-Cash Wkg. Capital 3,123 5,902 6,209 6,570 6,853 Net Cash/(Debt) (1,090) (1,275) (6,141) (6,273) (6,175) Debtors Turn (avg days) 55.4 60.8 103.0 132.9 119.0 Creditors Turn (avg days) 237.4 223.4 305.2 371.6 324.0 Inventory Turn (avg days) 363.5 399.9 574.5 732.2 686.1 Asset Turnover (x) 0.4 0.4 0.3 0.3 0.3 Current Ratio (x) 1.9 1.9 1.7 1.8 1.9 Quick Ratio (x) 0.8 0.8 0.5 0.6 0.6 Net Debt/Equity (X) 0.1 0.1 0.5 0.5 0.5 Net Debt/Equity ex MI (X) 0.1 0.1 0.6 0.5 0.5 Capex to Debt (%) 12.7 (5.1) 13.8 4.2 4.2 Z-Score (X) 1.8 1.9 1.7 1.7 1.7
Source: Company, DBS Bank
Page 13

ASIAN INSIGHTS VICKERS SECURITIES Page 6
Company Guide
Keppel Corporation
Cash Flow Statement (S$m)
FY Dec 2013A 2014A 2015A 2016F 2017F Pre-Tax Profit 2,794 2,889 1,997 1,527 1,544 Dep. & Amort. 242 265 247 225 236 Tax Paid (585) (328) (302) (353) (260) Assoc. & JV Inc/(loss) (626) (504) (504) (350) (350) Chg in Wkg.Cap. (492) (340) (198) (268) (302) Other Operating CF (709) (1,960) (1,174) 0.0 0.0 Net Operating CF 625 21.8 66.6 782 868 Capital Exp.(net) (903) 379 (1,142) (350) (350) Other Invts.(net) 0.0 0.0 0.0 0.0 0.0 Invts in Assoc. & JV (473) 231 (341) (149) (148) Div from Assoc & JV 267 410 351 201 202 Other Investing CF 431 (144) 1,259 0.0 0.0 Net Investing CF (678) 877 126 (298) (296) Div Paid (843) (1,029) (956) (617) (474) Chg in Gross Debt 2,130 272 924 0.0 0.0 Capital Issues 39.8 34.3 8.89 0.0 0.0 Other Financing CF 201 (46.5) (3,279) 0.0 0.0 Net Financing CF 1,528 (769) (3,302) (617) (474) Currency Adjustments 34.6 42.2 28.1 0.0 0.0 Chg in Cash 1,509 171 (3,082) (132) 98.2 Opg CFPS (S cts) 61.8 19.9 14.5 57.7 64.4 Free CFPS (S cts) (15.4) 22.0 (59.1) 23.8 28.5
Source: Company, DBS Bank
Target Price & Ratings History
Source: DBS Bank
S.No. DateClosing
PriceTarget Price
Rat ing
1: 18 May 15 8.85 9.32 BUY
2: 22 Jun 15 8.41 9.32 BUY
3: 10 Aug 15 7.52 8.14 HOLD
4: 31 Aug 15 6.84 7.50 HOLD
5: 18 Sep 15 7.15 7.50 HOLD
6: 23 Oct 15 7.25 7.40 HOLD
7: 26 Oct 15 7.20 7.40 HOLD
8: 16 Nov 15 6.80 7.40 HOLD
9: 11 Jan 16 5.54 7.40 HOLD
10: 18 Jan 16 4.85 7.40 HOLD
11: 22 Jan 16 5.02 7.40 HOLD12: 25 Jan 16 4.81 5.25 HOLD13: 01 Feb 16 4.90 5.25 HOLD14: 10 Feb 16 4.88 5.25 HOLD
Note : Share price and Target price are adjusted for corporate actions. 15: 15 Feb 16 5.02 5.25 HOLD16: 22 Feb 16 5.21 5.25 HOLD
12
3 4
5
6
78
910
11
12
13
14
15
16
4.47
5.47
6.47
7.47
8.47
9.47
Mar-15 Jul-15 Nov-15 Mar-16
S$
Page 14
ASIAN INSIGHTS VICKERS SECURITIES ed: JS / sa:YM
BUY Last Traded Price: S$3.02 (STI : 2,809.12) Price Target : S$3.30 (9% upside)
Potential Catalyst: Ramp up of India power plant, improvement in marine business Where we differ: In line
Analyst Janice CHUA +65 6682 3692 [email protected] Pei Hwa Ho +65 6682 3714 [email protected]
Price Relative
Forecasts and Valuation FY Dec (S$ m) 2014A 2015A 2016F 2017F Revenue 10,895 9,545 8,667 9,324 EBITDA 1,612 1,015 1,311 1,393 Pre-tax Profit 1,246 426 838 895 Net Profit 801 549 581 626 Net Pft (Pre Ex.) 801 549 581 626 Net Pft Gth (Pre-ex) (%) (2.4) (31.5) 5.8 7.9 EPS (S cts) 44.9 30.7 32.5 35.1 EPS Pre Ex. (S cts) 44.9 30.7 32.5 35.1 EPS Gth Pre Ex (%) (2) (32) 6 8 Diluted EPS (S cts) 44.5 30.5 32.2 34.8 Net DPS (S cts) 16.0 11.0 11.1 11.2 BV Per Share (S cts) 315 360 382 406 PE (X) 6.7 9.8 9.3 8.6 PE Pre Ex. (X) 6.7 9.8 9.3 8.6 P/Cash Flow (X) nm nm 9.8 5.0 EV/EBITDA (X) 6.3 12.0 9.8 9.4 Net Div Yield (%) 5.3 3.6 3.7 3.7 P/Book Value (X) 1.0 0.8 0.8 0.7 Net Debt/Equity (X) 0.4 0.6 0.7 0.6 ROAE (%) 14.8 9.1 8.8 8.9 Earnings Rev (%): 0 0 Consensus EPS (S cts): 30.2 32.6 Other Broker Recs: B: 11 S: 3 H: 3 Source of all data: Company, DBS Bank, Bloomberg Finance L.P
SMM Privatisation Rumour Unsubstantiated
Utilities’ discount unwarranted. Stripping out the fair value of Sembcorp Marine (SMM) and market value of Salalah and Gallant Venture, SCI’s utilities business is valued at an undemanding 0.7x P/B and 7x FY16F PE vs historical mean of 11x PE. Our SOTP-based TP of S$3.30 translates to 0.9x P/B, which is 20-30% below GFC/AFC trough. We believe this is a fair multiple in view of 9% ROE and 4% dividend yield. Reiterate BUY.
Chatter on SMM privatisation does not hold water. SCI’s PATMI slid 75% y-o-y and 50% q-o-q to S$60.8m in 4Q15, due to Marine losses (S$328m), and impairment (S$70m) charges on Utilities’ PPE. In response to the privatization rumour of SembCorp Marine, management stressed that any asset acquisitions should be accretive and enhance returns to SCI shareholders. Moreover, there are more appealing opportunities in the utilities space in view of the lacklustre marine prospects. In our view, the more likely scenario of a restructuring of rigbuilders would be the merger of Keppel O&M and SMM. As such, the elimination of fear of privatisation could give an uplift to SCI’s stock prices in the near term.
Emerging markets the growth engine. SCI’s first India power plant, fully operational since Sept-2015, is expected to contribute S$70m or 12% of FY16F PATMI. It incurred startup losses of S$22.5m last year, but is expected to turn profitable in 1Q16 with the ramp-up to >80% since end 2015. This would help to mitigate the earnings decline from Singapore power plants while other overseas utility businesses are expected to be stable this year. Besides, SCI has also made its forays into other emerging markets – Bangladesh and Myanmar, underpinning longer-term growth prospects of its utilities segment.
Valuation:
Given its diverse earnings stream and various listed assets, we derive our fair value on SCI based on the sum of its different parts, which include market valuations of its stakes in listed companies Sembcorp Marine (SGX-listed, 60.6% stake), Gallant Venture (SGX-listed, 11.96% stake) and Salalah (Muscat stock exchange, 40% stake) and earnings from utilities and urban development. For its holding company position, we have applied a 10% conglomerate discount to the reappraised net asset value (RNAV). Our TP is arrived at S$3.30, translating to 0.9x P/B.
Key Risks to Our View:
Key risks to earnings are further deferments / cancellations of marine projects, deterioration of Singapore power’s spark spreads, and execution hiccups in India power plants.
At A Glance Issued Capital (m shrs) 1,785 Mkt. Cap (S$m/US$m) 5,391 / 3,905 Major Shareholders (%) Temasek Holdings Pte Ltd 49.5 JP Morgan Chase & Co 5.0
Free Float (%) 50.1 3m Avg. Daily Val (US$m) 15.0 ICB Industry : Oil & Gas / Oil Equipment; Services & Dist
DBS Group Research . Equity 11 Mar 2016
Singapore Company Guide
Sembcorp Industries Version 4 | Bloomberg: SCI SP | Reuters: SCIL.SI Refer to important disclosures at the end of this report
45
65
85
105
125
145
165
185
205
2.0
2.5
3.0
3.5
4.0
4.5
5.0
5.5
6.0
Mar-12 Mar-13 Mar-14 Mar-15 Mar-16
Relative IndexS$
Sembcorp Industries (LHS) Relative STI INDEX (RHS)
Page 15

ASIAN INSIGHTS VICKERS SECURITIES Page 2
Company Guide
Sembcorp Industries
SOTP-based valuation for SCI
Value (S$ m)
Basis
Sembcorp Marine 1,571 Fair value for Sembcorp Marine
Gallant Ventures 63 Share price
Salalah 350 40% stake
1,984 Less: book value of listed companies (2,035) Surplus from listed companies -51 Utilities (Surplus) 267 Based on 11x FY16 PE, less book value
Urban Development (441) Based on 11x FY16 PE, less book value
Net Surplus -225
Book value as of end FY15 6,817 RNAV 6,592 RNAV per share (S$) 3.66 Fair value (S$) 3.30 10% conglomerate discount
Implied FY16 PE (x) 10.1
Implied FY16 PB (x) 0.9
Source of all data: Company, DBS Bank
Implied valuation for utilities business
Value (S$m)
Basis
SCI's market capitalisation 5,168 Market price @ 9 Mar
SCI's share of market capitalisation for:
SMM 1,571 DBS TP of S$1.24
Salalah 350 Market price @ 9 Mar
Gallant Venture 63 Market price @ 9 Mar
Congolomerate discount 10%
Implied value for Utilities 3,382
Implied FY16 PE for Utilities (x) 7.6
Implied FY16 PB for Utilities (x) 0.7
Source of all data: Company, DBS Bank
Page 16

ASIAN INSIGHTS VICKERS SECURITIES Page 3
Company Guide
Sembcorp Industries
CRITICAL DATA POINTS TO WATCH
Earnings Drivers:
Utilities projects pipeline should progressively add to earnings. New facilities will add to SCI’s power generation and water treatment capacities, which should increase earnings assuming the operations are profitable. A total of 3,800MW of power generation capacity, 140tph of steam capacity and 1.3million m3/day of water treatment capacity is expected to be added from now until 2018. This roughly translates to a 36%, 3% and 14% increase in power, steam and water treatment capacities respectively. Narrowing spark spreads in Singapore have hit power generation earnings. Growth in supply of electricity outpacing the growth in consumption led to Uniform Singapore Energy Price (USEP) falling by 22% y-o-y in 2013, 21% in 2014 and by further 29% in 2015, shrinking the generator’s spark spread – a barometer of profits on electricity sales. However, the impact will not be significant, as Singapore power generation only makes up <5% of SCI’s net income. Nonetheless, an increase in USEP prices going forward will help earnings. Greater contribution from non-Singapore power generation facilities would also alleviate the pressure on profitability. Marine business (SMM) earnings are orderbook-driven. Sembcorp Marine’s (SMM) orderbook has declined to S$10.4bn as of end-2015, in tandem with the downturn in the offshore oil & gas industry. Order wins of S$3.2bn in 2015 were weak but respectable amid the current environment; 2013 and 2014 saw full-year order wins of S$4.2bn. The current orderbook stretches until 2020, but there is risk of order deferments – which would spread revenues and earnings thinner – given that drilling units account for 75% of its value. It has primarily been low oil prices that saw oil majors and asset owners defer capex spending. Hence, a rebound in oil prices should trigger more order wins for SMM, which would be positive for earnings. Urban Development business provides growth opportunities. Urban Development accounts for c.6% of SCI’s bottomline. Thus, a strong performance of this segment will not move the needle too much for now, but represents an avenue for growth. SCI has about 3,500ha of saleable land remaining across China, Indonesia and Vietnam, which it can develop. However, headwinds in the form of delays in China land sales have proven to be a stumbling block recently; better sales momentum, which we are seeing a glimmer of, would give some earnings uplift.
Marine contract wins
Source: Company, DBS Bank
4,193 4,192
3,150
2,500
3,000
0
500
1,000
1,500
2,000
2,500
3,000
3,500
4,000
2013A 2014A 2015F 2016F 2017F
1.27806069
‐0.321467419
0.061017937
0.083144‐0.100755209
SCI Group Net Profit for FY15 - Total S$549m
Utilities
Marine
Urban DevelopmentOther Businesses
0.209265859
0.053884533
0.13613685
0.068852459
0.0426229510.017676408
‐0.055737705
0.527298646
Utilities FY15 Net Profit by Geography - Total S$702m
Singapore
Rest of ASEAN, Australia & IndiaChina
Middle East & Africa
UK
The Americas
Corporate
0.352179837
0.273160763
0.374659401
Utilities in Singapore FY15 Net Profits - Total S$147m
Energy
Water
On‐site Logistics & Solid Waste Management
Page 17

ASIAN INSIGHTS VICKERS SECURITIES Page 4
Company Guide
Sembcorp Industries
Balance Sheet:
SCI’s gearing stood at 0.4x as of end 2015 – a stark contrast to a net cash position in 2013; increasing leverage at SMM has been the main reason for the increase in debt levels. Overall though, gearing remains at palatable levels and there is adequate debt headroom of approx S$3bn for SCI’s expansion capex and working capital. Share Price Drivers:
Oil price rebound would drive the share price higher. Investors would have greater confidence in the Marine business, as the operating environment improves. While drilling rig orders might lag oil price recovery, we could expect orders for production related facilities to flow through. Order wins in the Marine segment and land sales from Urban Development would bode well for SCI’s share price. While the oil price rebound would be an early indicator, securing contract wins by SMM is a more tangible indicator. More momentum in land sales would signal more hope for growth, and be positive to share price. Widening spark spreads at Singapore power plants. Signs of positive and widening spark spreads in Singapore would alleviate a key concern of investors and provide support to the share price. Key Risks:
Increasing competition in the Singapore power market. Total power generation supply in Singapore rose over 9% y-o-y in the past two years, marking the biggest y-o-y jumps since the electricity market started. This has depressed prices and hurt SCI’s bottom line. The oversupply of capacity and over-commitment of gas supply issues will likely continue to plague Singapore power market in the near-to-medium term. Execution of Indian power plants. The availability of coal supply and power purchase agreements (PPA) for SCI’s power plants in India have been a concern. We find comfort that the TPCIL plant is up and running on 86% of capacity committed on long term PPAs and operating on both domestic and imported coal. Company Background
Sembcorp Industries (SCI) is a trusted provider of essential energy and water solutions to both industrial and municipal customers. It has facilities with 10,600 megawatts of gross power capacity and over 10 million cubic metres of water per day in operation and under development. It is also a world leader in marine and offshore engineering (via Sembcorp Marine) as well as an established brand name in urban development (comprising industrial parks as well as business, commercial and residential space) in Vietnam, China and Indonesia.
Leverage & Asset Turnover (x)
Capital Expenditure
ROE (%)
Forward PE Band (x)
PB Band (x)
Source: Company, DBS Bank
0.4
0.5
0.5
0.6
0.6
0.7
0.7
0.8
0.8
0.9
0.9
0.00
0.10
0.20
0.30
0.40
0.50
0.60
0.70
0.80
0.90
2013A 2014A 2015F 2016F 2017F
Gross Debt to Equity (LHS) Asset Turnover (RHS)
0.0
200.0
400.0
600.0
800.0
1,000.0
1,200.0
1,400.0
1,600.0
2013A 2014A 2015F 2016F 2017F
Capital Expenditure (-)
S$m
0.0%
2.0%
4.0%
6.0%
8.0%
10.0%
12.0%
14.0%
16.0%
2013A 2014A 2015F 2016F 2017F
Avg: 12.1x
+1sd: 13.8x
+2sd: 15.4x
‐1sd: 10.5x
‐2sd: 8.9x
6.0
8.0
10.0
12.0
14.0
16.0
Mar-12 Mar-13 Mar-14 Mar-15
(x)
Avg: 1.67x
+1sd: 2.11x
+2sd: 2.55x
‐1sd: 1.23x
‐2sd: 0.78x
0.5
1.0
1.5
2.0
2.5
Mar-12 Mar-13 Mar-14 Mar-15
(x)
Page 18
ASIAN INSIGHTS VICKERS SECURITIES Page 5
Company Guide
Sembcorp Industries
Key Assumptions
FY Dec 2013A 2014A 2015A 2016F 2017F Marine contract wins 4,193 4,192 3,150 2,500 3,000
Segmental Breakdown
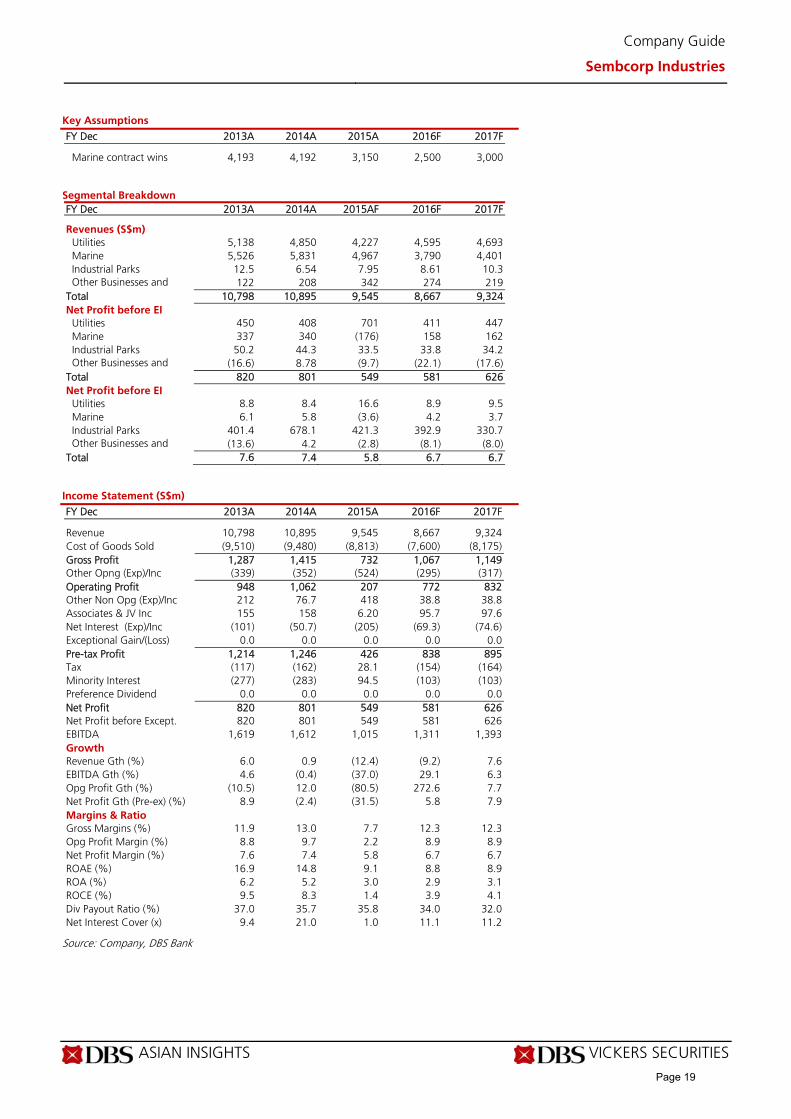
FY Dec 2013A 2014A 2015AF 2016F 2017F Revenues (S$m) Utilities 5,138 4,850 4,227 4,595 4,693 Marine 5,526 5,831 4,967 3,790 4,401 Industrial Parks 12.5 6.54 7.95 8.61 10.3 Other Businesses and 122 208 342 274 219 Total 10,798 10,895 9,545 8,667 9,324 Net Profit before EI
Utilities 450 408 701 411 447 Marine 337 340 (176) 158 162 Industrial Parks 50.2 44.3 33.5 33.8 34.2 Other Businesses and (16.6) 8.78 (9.7) (22.1) (17.6) Total 820 801 549 581 626 Net Profit before EI
Utilities 8.8 8.4 16.6 8.9 9.5 Marine 6.1 5.8 (3.6) 4.2 3.7 Industrial Parks 401.4 678.1 421.3 392.9 330.7 Other Businesses and (13.6) 4.2 (2.8) (8.1) (8.0) Total 7.6 7.4 5.8 6.7 6.7
Income Statement (S$m)
FY Dec 2013A 2014A 2015A 2016F 2017F Revenue 10,798 10,895 9,545 8,667 9,324 Cost of Goods Sold (9,510) (9,480) (8,813) (7,600) (8,175) Gross Profit 1,287 1,415 732 1,067 1,149 Other Opng (Exp)/Inc (339) (352) (524) (295) (317) Operating Profit 948 1,062 207 772 832 Other Non Opg (Exp)/Inc 212 76.7 418 38.8 38.8 Associates & JV Inc 155 158 6.20 95.7 97.6 Net Interest (Exp)/Inc (101) (50.7) (205) (69.3) (74.6) Exceptional Gain/(Loss) 0.0 0.0 0.0 0.0 0.0 Pre-tax Profit 1,214 1,246 426 838 895 Tax (117) (162) 28.1 (154) (164) Minority Interest (277) (283) 94.5 (103) (103) Preference Dividend 0.0 0.0 0.0 0.0 0.0 Net Profit 820 801 549 581 626 Net Profit before Except. 820 801 549 581 626 EBITDA 1,619 1,612 1,015 1,311 1,393 Growth Revenue Gth (%) 6.0 0.9 (12.4) (9.2) 7.6 EBITDA Gth (%) 4.6 (0.4) (37.0) 29.1 6.3 Opg Profit Gth (%) (10.5) 12.0 (80.5) 272.6 7.7 Net Profit Gth (Pre-ex) (%) 8.9 (2.4) (31.5) 5.8 7.9 Margins & Ratio Gross Margins (%) 11.9 13.0 7.7 12.3 12.3 Opg Profit Margin (%) 8.8 9.7 2.2 8.9 8.9 Net Profit Margin (%) 7.6 7.4 5.8 6.7 6.7 ROAE (%) 16.9 14.8 9.1 8.8 8.9 ROA (%) 6.2 5.2 3.0 2.9 3.1 ROCE (%) 9.5 8.3 1.4 3.9 4.1 Div Payout Ratio (%) 37.0 35.7 35.8 34.0 32.0 Net Interest Cover (x) 9.4 21.0 1.0 11.1 11.2
Source: Company, DBS Bank
Page 19
ASIAN INSIGHTS VICKERS SECURITIES Page 6
Company Guide
Sembcorp Industries
Quarterly / Interim Income Statement (S$m)
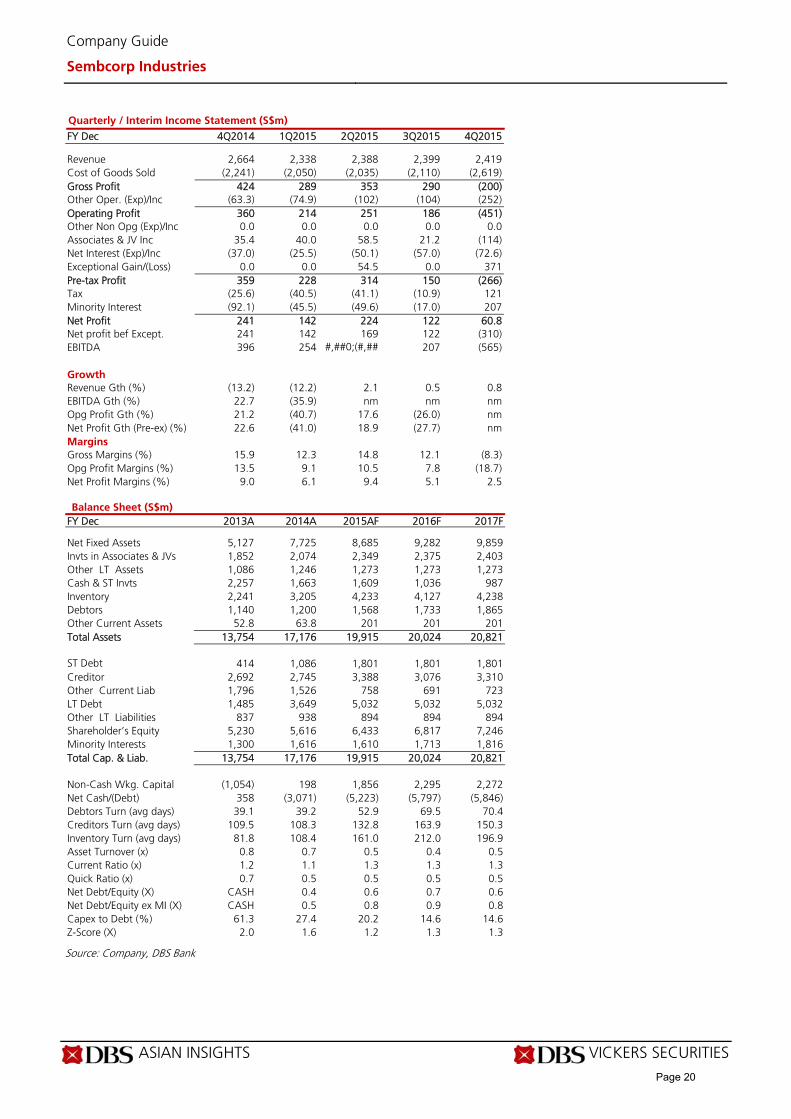
FY Dec 4Q2014 1Q2015 2Q2015 3Q2015 4Q2015 Revenue 2,664 2,338 2,388 2,399 2,419 Cost of Goods Sold (2,241) (2,050) (2,035) (2,110) (2,619) Gross Profit 424 289 353 290 (200) Other Oper. (Exp)/Inc (63.3) (74.9) (102) (104) (252) Operating Profit 360 214 251 186 (451) Other Non Opg (Exp)/Inc 0.0 0.0 0.0 0.0 0.0 Associates & JV Inc 35.4 40.0 58.5 21.2 (114) Net Interest (Exp)/Inc (37.0) (25.5) (50.1) (57.0) (72.6) Exceptional Gain/(Loss) 0.0 0.0 54.5 0.0 371 Pre-tax Profit 359 228 314 150 (266) Tax (25.6) (40.5) (41.1) (10.9) 121 Minority Interest (92.1) (45.5) (49.6) (17.0) 207 Net Profit 241 142 224 122 60.8 Net profit bef Except. 241 142 169 122 (310) EBITDA 396 254 #,##0;(#,## 207 (565) Growth Revenue Gth (%) (13.2) (12.2) 2.1 0.5 0.8 EBITDA Gth (%) 22.7 (35.9) nm nm nm Opg Profit Gth (%) 21.2 (40.7) 17.6 (26.0) nm Net Profit Gth (Pre-ex) (%) 22.6 (41.0) 18.9 (27.7) nm Margins Gross Margins (%) 15.9 12.3 14.8 12.1 (8.3) Opg Profit Margins (%) 13.5 9.1 10.5 7.8 (18.7) Net Profit Margins (%) 9.0 6.1 9.4 5.1 2.5
Balance Sheet (S$m)
FY Dec 2013A 2014A 2015AF 2016F 2017F Net Fixed Assets 5,127 7,725 8,685 9,282 9,859 Invts in Associates & JVs 1,852 2,074 2,349 2,375 2,403 Other LT Assets 1,086 1,246 1,273 1,273 1,273 Cash & ST Invts 2,257 1,663 1,609 1,036 987 Inventory 2,241 3,205 4,233 4,127 4,238 Debtors 1,140 1,200 1,568 1,733 1,865 Other Current Assets 52.8 63.8 201 201 201 Total Assets 13,754 17,176 19,915 20,024 20,821 ST Debt 414 1,086 1,801 1,801 1,801 Creditor 2,692 2,745 3,388 3,076 3,310 Other Current Liab 1,796 1,526 758 691 723 LT Debt 1,485 3,649 5,032 5,032 5,032 Other LT Liabilities 837 938 894 894 894 Shareholder’s Equity 5,230 5,616 6,433 6,817 7,246 Minority Interests 1,300 1,616 1,610 1,713 1,816 Total Cap. & Liab. 13,754 17,176 19,915 20,024 20,821 Non-Cash Wkg. Capital (1,054) 198 1,856 2,295 2,272 Net Cash/(Debt) 358 (3,071) (5,223) (5,797) (5,846) Debtors Turn (avg days) 39.1 39.2 52.9 69.5 70.4 Creditors Turn (avg days) 109.5 108.3 132.8 163.9 150.3 Inventory Turn (avg days) 81.8 108.4 161.0 212.0 196.9 Asset Turnover (x) 0.8 0.7 0.5 0.4 0.5 Current Ratio (x) 1.2 1.1 1.3 1.3 1.3 Quick Ratio (x) 0.7 0.5 0.5 0.5 0.5 Net Debt/Equity (X) CASH 0.4 0.6 0.7 0.6 Net Debt/Equity ex MI (X) CASH 0.5 0.8 0.9 0.8 Capex to Debt (%) 61.3 27.4 20.2 14.6 14.6 Z-Score (X) 2.0 1.6 1.2 1.3 1.3
Source: Company, DBS Bank
Page 20
ASIAN INSIGHTS VICKERS SECURITIES Page 7
Company Guide
Sembcorp Industries
Cash Flow Statement (S$m)
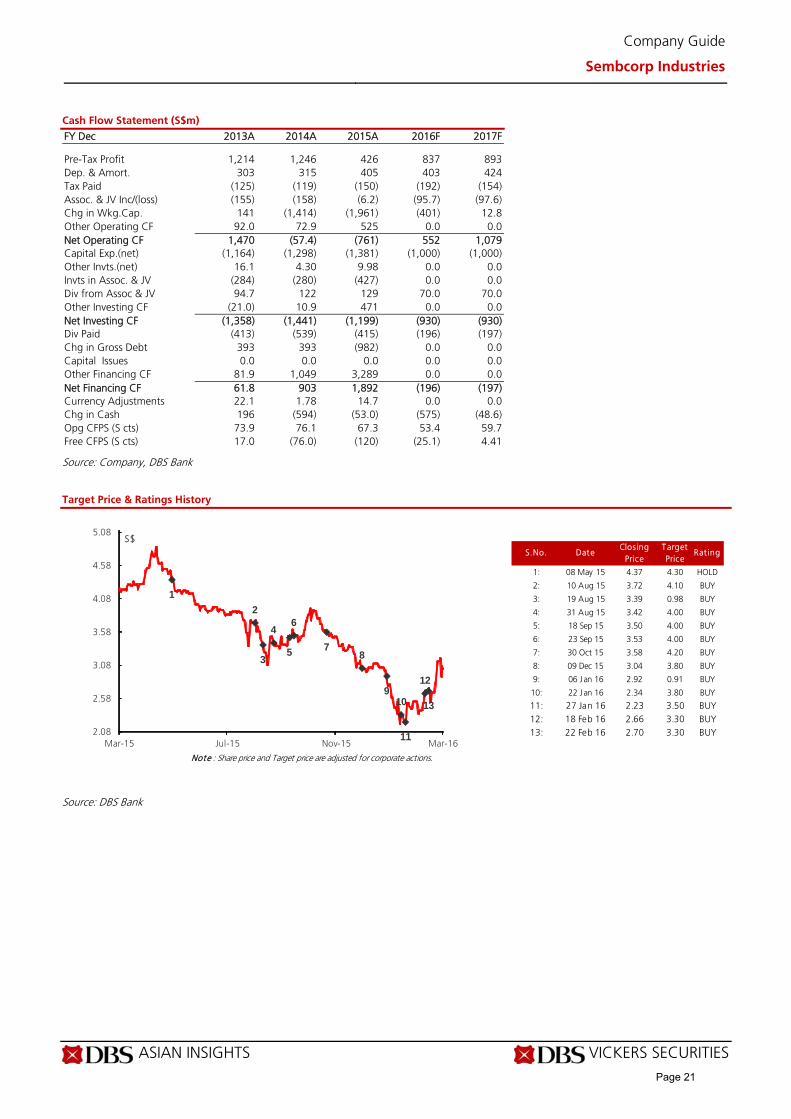
FY Dec 2013A 2014A 2015A 2016F 2017F Pre-Tax Profit 1,214 1,246 426 837 893 Dep. & Amort. 303 315 405 403 424 Tax Paid (125) (119) (150) (192) (154) Assoc. & JV Inc/(loss) (155) (158) (6.2) (95.7) (97.6) Chg in Wkg.Cap. 141 (1,414) (1,961) (401) 12.8 Other Operating CF 92.0 72.9 525 0.0 0.0 Net Operating CF 1,470 (57.4) (761) 552 1,079 Capital Exp.(net) (1,164) (1,298) (1,381) (1,000) (1,000) Other Invts.(net) 16.1 4.30 9.98 0.0 0.0 Invts in Assoc. & JV (284) (280) (427) 0.0 0.0 Div from Assoc & JV 94.7 122 129 70.0 70.0 Other Investing CF (21.0) 10.9 471 0.0 0.0 Net Investing CF (1,358) (1,441) (1,199) (930) (930) Div Paid (413) (539) (415) (196) (197) Chg in Gross Debt 393 393 (982) 0.0 0.0 Capital Issues 0.0 0.0 0.0 0.0 0.0 Other Financing CF 81.9 1,049 3,289 0.0 0.0 Net Financing CF 61.8 903 1,892 (196) (197) Currency Adjustments 22.1 1.78 14.7 0.0 0.0 Chg in Cash 196 (594) (53.0) (575) (48.6) Opg CFPS (S cts) 73.9 76.1 67.3 53.4 59.7 Free CFPS (S cts) 17.0 (76.0) (120) (25.1) 4.41
Source: Company, DBS Bank
Target Price & Ratings History
Source: DBS Bank
S.No. DateClosing
PriceTarget Price
Rat ing
1: 08 May 15 4.37 4.30 HOLD
2: 10 Aug 15 3.72 4.10 BUY
3: 19 Aug 15 3.39 0.98 BUY
4: 31 Aug 15 3.42 4.00 BUY
5: 18 Sep 15 3.50 4.00 BUY
6: 23 Sep 15 3.53 4.00 BUY
7: 30 Oct 15 3.58 4.20 BUY
8: 09 Dec 15 3.04 3.80 BUY
9: 06 Jan 16 2.92 0.91 BUY
10: 22 Jan 16 2.34 3.80 BUY
11: 27 Jan 16 2.23 3.50 BUY12: 18 Feb 16 2.66 3.30 BUY13: 22 Feb 16 2.70 3.30 BUY
Note : Share price and Target price are adjusted for corporate actions.
1
2
3
4
5
6
78
910
11
12
13
2.08
2.58
3.08
3.58
4.08
4.58
5.08
Mar-15 Jul-15 Nov-15 Mar-16
S$
Page 21
ASIAN INSIGHTS VICKERS SECURITIES ed: CK / sa:YM
FULLY VALUED
Last Traded Price: S$1.74 (STI : 2,809.12) Price Target : S$1.24 (-28% downside)
Potential Catalyst: Oil price recovery, vessel deliveries Where we differ: In line Analyst Janice CHUA +65 6682 3692 [email protected] Pei Hwa Ho +65 6682 3714 [email protected]
What’s New Raising stake in GraviFloat to 56%; options to
acquire the remaining 44%
Consideration of US$38m to be funded by internal
cash
Gaining control of GraviFloat; expanding products
offerings into offshore gas processing units
Price Relative
Forecasts and Valuation FY Dec (S$ m) 2014A 2015A 2016F 2017F Revenue 5,833 4,968 3,790 4,401 EBITDA 829 (216) 578 652 Pre-tax Profit 707 (378) 327 344 Net Profit 560 (290) 261 268 Net Pft (Pre Ex.) 560 (290) 261 268 Net Pft Gth (Pre-ex) (%) 4.1 nm nm 2.9 EPS (S cts) 26.8 (13.9) 12.5 12.8 EPS Pre Ex. (S cts) 26.8 (13.9) 12.5 12.8 EPS Gth Pre Ex (%) 4 nm nm 3 Diluted EPS (S cts) 27.0 (13.9) 12.5 12.8 Net DPS (S cts) 13.0 6.00 4.37 4.49 BV Per Share (S cts) 142 120 127 135 PE (X) 6.5 nm 13.9 13.5 PE Pre Ex. (X) 6.5 nm 13.9 13.5 P/Cash Flow (X) nm nm 5.7 15.6 EV/EBITDA (X) 5.4 nm 11.0 9.9 Net Div Yield (%) 7.5 3.5 2.5 2.6 P/Book Value (X) 1.2 1.4 1.4 1.3 Net Debt/Equity (X) 0.2 1.0 0.9 0.9 ROAE (%) 19.9 (10.6) 10.1 9.8 Earnings Rev (%): 0 0 Consensus EPS (S cts): 10.8 10.8 Other Broker Recs: B: 1 S: 15 H: 5
Source of all data: Company, DBS Bank, Bloomberg Finance L.P
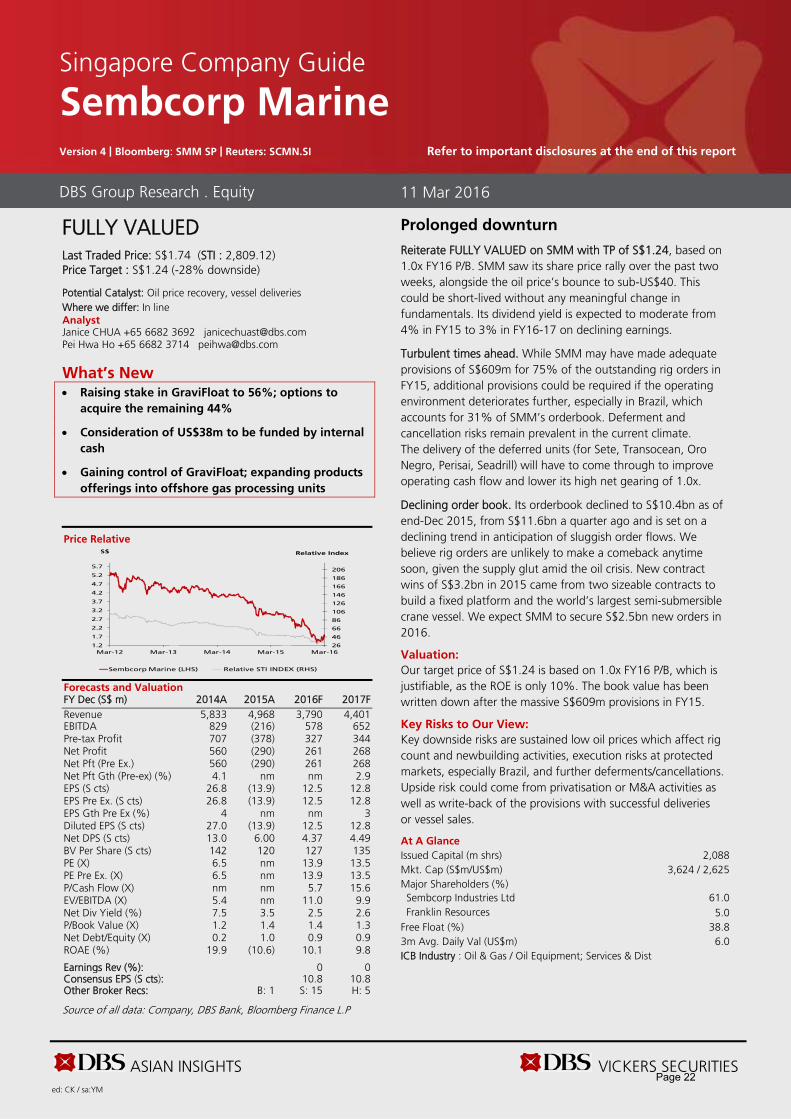
Prolonged downturn
Reiterate FULLY VALUED on SMM with TP of S$1.24, based on 1.0x FY16 P/B. SMM saw its share price rally over the past two weeks, alongside the oil price’s bounce to sub-US$40. This could be short-lived without any meaningful change in fundamentals. Its dividend yield is expected to moderate from 4% in FY15 to 3% in FY16-17 on declining earnings.
Turbulent times ahead. While SMM may have made adequate provisions of S$609m for 75% of the outstanding rig orders in FY15, additional provisions could be required if the operating environment deteriorates further, especially in Brazil, which accounts for 31% of SMM’s orderbook. Deferment and cancellation risks remain prevalent in the current climate. The delivery of the deferred units (for Sete, Transocean, Oro Negro, Perisai, Seadrill) will have to come through to improve operating cash flow and lower its high net gearing of 1.0x.
Declining order book. Its orderbook declined to S$10.4bn as of end-Dec 2015, from S$11.6bn a quarter ago and is set on a declining trend in anticipation of sluggish order flows. We believe rig orders are unlikely to make a comeback anytime soon, given the supply glut amid the oil crisis. New contract wins of S$3.2bn in 2015 came from two sizeable contracts to build a fixed platform and the world’s largest semi-submersible crane vessel. We expect SMM to secure S$2.5bn new orders in 2016.
Valuation:
Our target price of S$1.24 is based on 1.0x FY16 P/B, which is justifiable, as the ROE is only 10%. The book value has been written down after the massive S$609m provisions in FY15.
Key Risks to Our View:
Key downside risks are sustained low oil prices which affect rig count and newbuilding activities, execution risks at protected markets, especially Brazil, and further deferments/cancellations. Upside risk could come from privatisation or M&A activities as well as write-back of the provisions with successful deliveries or vessel sales.
At A Glance Issued Capital (m shrs) 2,088 Mkt. Cap (S$m/US$m) 3,624 / 2,625 Major Shareholders (%) Sembcorp Industries Ltd 61.0 Franklin Resources 5.0
Free Float (%) 38.8 3m Avg. Daily Val (US$m) 6.0 ICB Industry : Oil & Gas / Oil Equipment; Services & Dist
DBS Group Research . Equity 11 Mar 2016
Singapore Company Guide
Sembcorp Marine Version 4 | Bloomberg: SMM SP | Reuters: SCMN.SI Refer to important disclosures at the end of this report
26
46
66
86
106
126
146
166
186
206
1.2
1.7
2.2
2.7
3.2
3.7
4.2
4.7
5.2
5.7
Mar-12 Mar-13 Mar-14 Mar-15 Mar-16
Relative IndexS$
Sembcorp Marine (LHS) Relative STI INDEX (RHS)
Page 22
ASIAN INSIGHTS VICKERS SECURITIES Page 2
Company Guide
Sembcorp Marine
WHAT’S NEW
Raising stake in GraviFloat
What’s happening
Raising stake in GraviFloat to 56%. Subsequent to its initial acquisition of a 12% stake in GraviFloat on 2 Jun 2014, SMM announced that it has acquired an additional 44% equity stake for US$38m. This will bring its stake in Gravifloat to 56%, making it a subsidiary of SMM.
Options to acquire the remaining 44%. Under the agreement, SMM will eventually increase its stake by a further 44% to 100% through an equity purchase at the same price.
What’s the impact
Fully funded by internal resources. The consideration will be funded by internal cash. This was arrived after taking into account (i) the NTA of US$475k as at end-2015, (ii) the intellectual property rights and the prospects of commercialising the design, and (iii) SMM’s gain of control of Gravifloat.
Strategic move into LNG/LPG. The move underlines SMM’s confidence in GraviFloat’s design and reflects its strategy to broaden the group’s range of proprietary designs and solutions for the fast-evolving LNG and LPG industries.
We may see earnings contributions coming from the newbuild orders for the proprietary LNG and LPG terminals. However, we are not able to quantify the earnings impact at this juncture.
What is GraviFloat
GraviFloat designs and holds patents for a suite of re-deployable, modularised solutions based on its unique near-shore floating yet gravity-based LNG terminal solutions. The company was incorporated in Norway in 2006 as a spin-off of LMG Marin, a leading marine engineering and naval architecture company.
GraviFloat terminals are designed to offer customers across the LNG value chain a more cost-competitive solution compared with FSRUs (floating storage and regasification units) and land terminals, and can be designed for both liquefaction and receiving terminal services.
They are designed to be installed in shallow waters and are fully fixed to the seabed when in operation, with the flexibility to be designed for a variety of purposes and at almost any size.
They can be designed as an LNG receiving and regasification capacity liquefaction terminal, as a mobile unit for stranded gas production and liquefaction, or for temporary production of associated gas to support oil production, to name a few more common applications.
Page 23

ASIAN INSIGHTS VICKERS SECURITIES Page 3
Company Guide
Sembcorp Marine
CRITICAL DATA POINTS TO WATCH
Earnings Drivers:
Declining orderbook. Order wins and orderbook trends are often the key drivers of rigbuilders’ share price and earnings. Based on existing capacity, SMM requires S$4-5bn worth of order replenishments every year. We expect new orders to be 60% of those levels in the coming two years amid sector headwinds, a harbinger of declining orderbook and earnings ahead. SMM’s orderbook stood at S$10.4bn as of Dec 2015, of which approx. 31% comes from the drillship projects with Sete Brasil. While this translates into a book-to-bill ratio of over 2x based on existing delivery schedule, it is vulnerable to deferments and cancellations. Asset deflation underway. Post-GFC, newbuild prices for drilling rigs tumbled 20-30% from 2008-2010. The 5-15% price gain over the past few years could all be given back, if not worse. In this downturn, China plays a bigger role in global rig market, garnering one-third of the global orderbook. Over 90% of these contracts are built on speculation without back-to-back charters and on 5:95 balloon payment terms, making it vulnerable to cancellations. We expect fire sales to suppress rig prices as shipyards would be desperate to recoup their construction costs if ship owners walk away. Rig utilisation and dayrates remain under pressure. Low oil price adds fuel to fire, aggravating the already challenging rigbuilding market that is suffering from a massive order backlog and keen competition. Utilisation and day rates have fallen around 20-40% from June 2014 levels. We believe a gradual recovery in oil prices and rig market towards end-2016 will set the stage for rising newbuild demand thereafter. Pace of rigbuilding recovery is dependent on oil price rebound, retirement of old fleets and cancellations at Chinese yards. An oil price rebound to above US$60/bbl will stimulate E&P activities and thus rig demand, while rig attribution and cancellations will soothe the supply pressure and eventually bring the sector back to equilibrium.
New order wins (S$ m)
Sales Trend
Asset Trend
Profitability Trend
Margin Trends (%)
Source: Company, DBS Bank
4,193 4,192
3,150
2,500
3,000
0
500
1,000
1,500
2,000
2,500
3,000
3,500
4,000
2013A 2014A 2015F 2016F 2017F
-20.0%
-10.0%
0.0%
10.0%
20.0%
30.0%
0
1,000
2,000
3,000
4,000
5,000
2013A 2014A 2015F 2016F 2017F
S$ m
Total Revenue Revenue Growth (%) (YoY)
1,000
2,000
3,000
4,000
5,000
6,000
7,000
8,000
9,000
2013A 2014A 2015F 2016F 2017F
S$ m
Net Fixed Assets (Tangible) Total Current Assets
231
281
331
381
431
481
531
581
631
681
2013A 2014A 2015F 2016F 2017F
S$ m
Operating EBIT Pre tax Profit Net Profit
0%
2%
4%
6%
8%
10%
12%
14%
16%
18%
20%
2013A 2014A 2015F 2016F 2017F
EBITDA Margin % EBIT Margin % Net Income Margin %
Page 24
ASIAN INSIGHTS VICKERS SECURITIES Page 4
Company Guide
Sembcorp Marine
Balance Sheet:
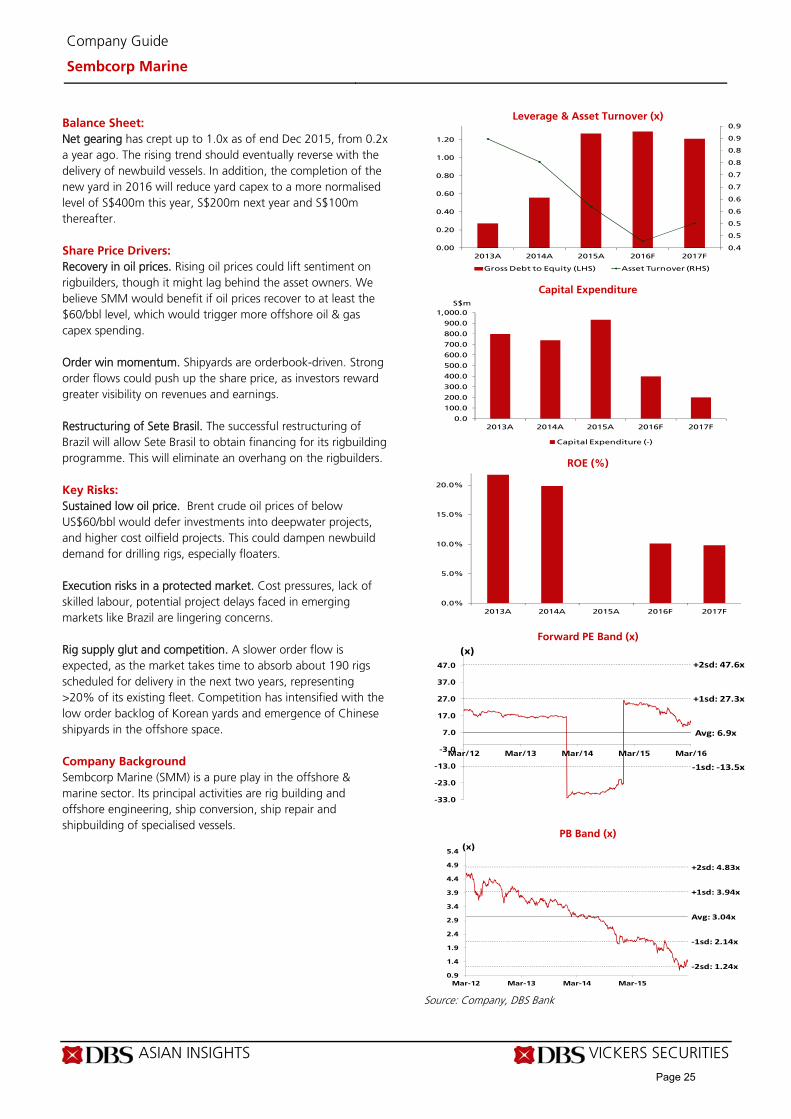
Net gearing has crept up to 1.0x as of end Dec 2015, from 0.2x a year ago. The rising trend should eventually reverse with the delivery of newbuild vessels. In addition, the completion of the new yard in 2016 will reduce yard capex to a more normalised level of S$400m this year, S$200m next year and S$100m thereafter. Share Price Drivers:
Recovery in oil prices. Rising oil prices could lift sentiment on rigbuilders, though it might lag behind the asset owners. We believe SMM would benefit if oil prices recover to at least the $60/bbl level, which would trigger more offshore oil & gas capex spending. Order win momentum. Shipyards are orderbook-driven. Strong order flows could push up the share price, as investors reward greater visibility on revenues and earnings. Restructuring of Sete Brasil. The successful restructuring of Brazil will allow Sete Brasil to obtain financing for its rigbuilding programme. This will eliminate an overhang on the rigbuilders. Key Risks:
Sustained low oil price. Brent crude oil prices of below US$60/bbl would defer investments into deepwater projects, and higher cost oilfield projects. This could dampen newbuild demand for drilling rigs, especially floaters. Execution risks in a protected market. Cost pressures, lack of skilled labour, potential project delays faced in emerging markets like Brazil are lingering concerns. Rig supply glut and competition. A slower order flow is expected, as the market takes time to absorb about 190 rigs scheduled for delivery in the next two years, representing >20% of its existing fleet. Competition has intensified with the low order backlog of Korean yards and emergence of Chinese shipyards in the offshore space. Company Background
Sembcorp Marine (SMM) is a pure play in the offshore & marine sector. Its principal activities are rig building and offshore engineering, ship conversion, ship repair and shipbuilding of specialised vessels.
Leverage & Asset Turnover (x)
Capital Expenditure
ROE (%)
Forward PE Band (x)
PB Band (x)
Source: Company, DBS Bank
0.4
0.5
0.5
0.6
0.6
0.7
0.7
0.8
0.8
0.9
0.9
0.00
0.20
0.40
0.60
0.80
1.00
1.20
2013A 2014A 2015A 2016F 2017F
Gross Debt to Equity (LHS) Asset Turnover (RHS)
0.0
100.0
200.0
300.0
400.0
500.0
600.0
700.0
800.0
900.0
1,000.0
2013A 2014A 2015A 2016F 2017F
Capital Expenditure (-)
S$m
0.0%
5.0%
10.0%
15.0%
20.0%
2013A 2014A 2015A 2016F 2017F
Avg: 6.9x
+1sd: 27.3x
+2sd: 47.6x
‐1sd: ‐13.5x
-33.0
-23.0
-13.0
-3.0
7.0
17.0
27.0
37.0
47.0
Mar/12 Mar/13 Mar/14 Mar/15 Mar/16
(x)
Avg: 3.04x
+1sd: 3.94x
+2sd: 4.83x
‐1sd: 2.14x
‐2sd: 1.24x0.9
1.4
1.9
2.4
2.9
3.4
3.9
4.4
4.9
5.4
Mar-12 Mar-13 Mar-14 Mar-15
(x)
Page 25

ASIAN INSIGHTS VICKERS SECURITIES Page 5
Company Guide
Sembcorp Marine
Key Assumptions
FY Dec 2013A 2014A 2015A 2016F 2017F New order wins (S$ m) 4,193 4,192 3,150 2,500 3,000
Segmental Breakdown
FY Dec 2013A 2014A 2015A 2016F 2017F Revenues (S$m) Rig Building (newbuilds) 3,564 3,779 3,319 1,183 1,942 Offshore & Conversion 1,204 1,353 1,017 1,974 1,792 Ship repair 681 622 557 592 622 Shipbuilding (newbuilds) 0.0 0.0 0.0 0.0 0.0 Others 76.9 78.6 75.8 40.0 45.0 Total 5,526 5,833 4,968 3,790 4,401
Income Statement (S$m)
FY Dec 2013A 2014A 2015A 2016F 2017F Revenue 5,526 5,833 4,968 3,790 4,401 Cost of Goods Sold (4,818) (4,989) (4,837) (3,240) (3,803) Gross Profit 708 844 131 550 599 Other Opng (Exp)/Inc (78.3) (137) (281) (106) (123) Operating Profit 630 707 (150) 444 476 Other Non Opg (Exp)/Inc 1.96 1.19 (18.2) 0.0 0.0 Associates & JV Inc 15.6 9.86 (174) (26.1) (0.1) Net Interest (Exp)/Inc 0.13 (11.3) (36.0) (90.5) (131) Exceptional Gain/(Loss) 17.8 0.10 0.0 0.0 0.0 Pre-tax Profit 665 707 (378) 327 344 Tax (76.7) (106) 77.6 (55.6) (62.0) Minority Interest (32.5) (41.2) 10.3 (10.9) (14.1) Preference Dividend 0.0 0.0 0.0 0.0 0.0 Net Profit 556 560 (290) 261 268 Net Profit before Except. 538 560 (290) 261 268 EBITDA 744 829 (216) 578 652 Growth Revenue Gth (%) 24.7 5.6 (14.8) (23.7) 16.1 EBITDA Gth (%) 6.0 11.4 nm nm 12.8 Opg Profit Gth (%) 13.6 12.3 nm nm 7.2 Net Profit Gth (Pre-ex) (%) 7.5 4.1 nm nm 2.9 Margins & Ratio Gross Margins (%) 12.8 14.5 2.6 14.5 13.6 Opg Profit Margin (%) 11.4 12.1 (3.0) 11.7 10.8 Net Profit Margin (%) 10.1 9.6 (5.8) 6.9 6.1 ROAE (%) 21.7 19.9 (10.6) 10.1 9.8 ROA (%) 8.5 7.2 (3.3) 2.9 3.1 ROCE (%) 15.9 13.2 (2.6) 5.7 5.8 Div Payout Ratio (%) 48.9 48.5 N/A 35.0 35.0 Net Interest Cover (x) NM 62.9 (4.2) 4.9 3.6
Source: Company, DBS Bank
Page 26

ASIAN INSIGHTS VICKERS SECURITIES Page 6
Company Guide
Sembcorp Marine
Quarterly / Interim Income Statement (S$m)
FY Dec 4Q2014 1Q2015 2Q2015 3Q2015 4Q2015 Revenue 1,445 1,304 1,208 1,130 1,327 Cost of Goods Sold (1,170) (1,135) (1,009) (1,039) (1,655) Gross Profit 275 169 199 90.8 (328) Other Oper. (Exp)/Inc (38.4) (31.0) (52.1) (16.0) (182) Operating Profit 236 138 147 74.8 (510) Other Non Opg (Exp)/Inc (0.2) 0.19 0.44 (17.1) (1.7) Associates & JV Inc (11.0) 3.87 (2.6) (24.4) (150) Net Interest (Exp)/Inc (7.4) (7.1) (8.9) (10.6) (9.4) Exceptional Gain/(Loss) 0.03 0.12 0.11 0.0 (0.2) Pre-tax Profit 218 135 136 22.6 (671) Tax (20.6) (26.3) (22.8) 8.95 118 Minority Interest (19.4) (3.0) (3.9) 0.60 16.7 Net Profit 178 106 109 32.1 (537) Net profit bef Except. 178 106 109 32.1 (537) EBITDA 255 173 176 65.1 (624) Growth Revenue Gth (%) (15.6) (9.8) (7.4) (6.4) 17.4 EBITDA Gth (%) 24.2 (32.1) 1.8 (63.0) nm Opg Profit Gth (%) 37.9 (41.5) 6.4 (49.1) nm Net Profit Gth (Pre-ex) (%) 34.7 (40.5) 3.2 (70.6) nm Margins Gross Margins (%) 19.0 13.0 16.5 8.0 (24.7) Opg Profit Margins (%) 16.4 10.6 12.2 6.6 (38.4) Net Profit Margins (%) 12.3 8.1 9.0 2.8 (40.5)
Balance Sheet (S$m)
FY Dec 2013A 2014A 2015A 2016F 2017F Net Fixed Assets 2,394 3,009 3,541 3,780 3,803 Invts in Associates & JVs 446 470 312 286 286 Other LT Assets 189 192 231 231 231 Cash & ST Invts 1,695 1,093 690 1,053 994 Inventory 2,084 3,005 3,833 2,707 3,144 Debtors 442 469 590 474 550 Other Current Assets 0.20 0.20 3.89 3.89 3.89 Total Assets 7,250 8,238 9,201 8,535 9,013 ST Debt 166 434 915 915 915 Creditor 1,781 1,826 2,519 1,516 1,761 Other Current Liab 1,583 1,189 463 404 446 LT Debt 600 1,308 2,465 2,715 2,715 Other LT Liabilities 310 350 175 175 175 Shareholder’s Equity 2,677 2,965 2,511 2,646 2,823 Minority Interests 132 167 153 164 178 Total Cap. & Liab. 7,250 8,238 9,201 8,535 9,013 Non-Cash Wkg. Capital (838) 459 1,445 1,265 1,491 Net Cash/(Debt) 929 (648) (2,690) (2,577) (2,636) Debtors Turn (avg days) 30.1 28.5 38.9 51.2 42.5 Creditors Turn (avg days) 134.1 134.9 168.3 239.1 164.9 Inventory Turn (avg days) 147.5 190.4 264.9 387.6 294.5 Asset Turnover (x) 0.8 0.8 0.6 0.4 0.5 Current Ratio (x) 1.2 1.3 1.3 1.5 1.5 Quick Ratio (x) 0.6 0.5 0.3 0.5 0.5 Net Debt/Equity (X) CASH 0.2 1.0 0.9 0.9 Net Debt/Equity ex MI (X) CASH 0.2 1.1 1.0 0.9 Capex to Debt (%) 104.0 42.4 27.6 11.0 5.5 Z-Score (X) 2.0 2.0 1.2 1.5 1.5
Source: Company, DBS Bank
Page 27
ASIAN INSIGHTS VICKERS SECURITIES Page 7
Company Guide
Sembcorp Marine
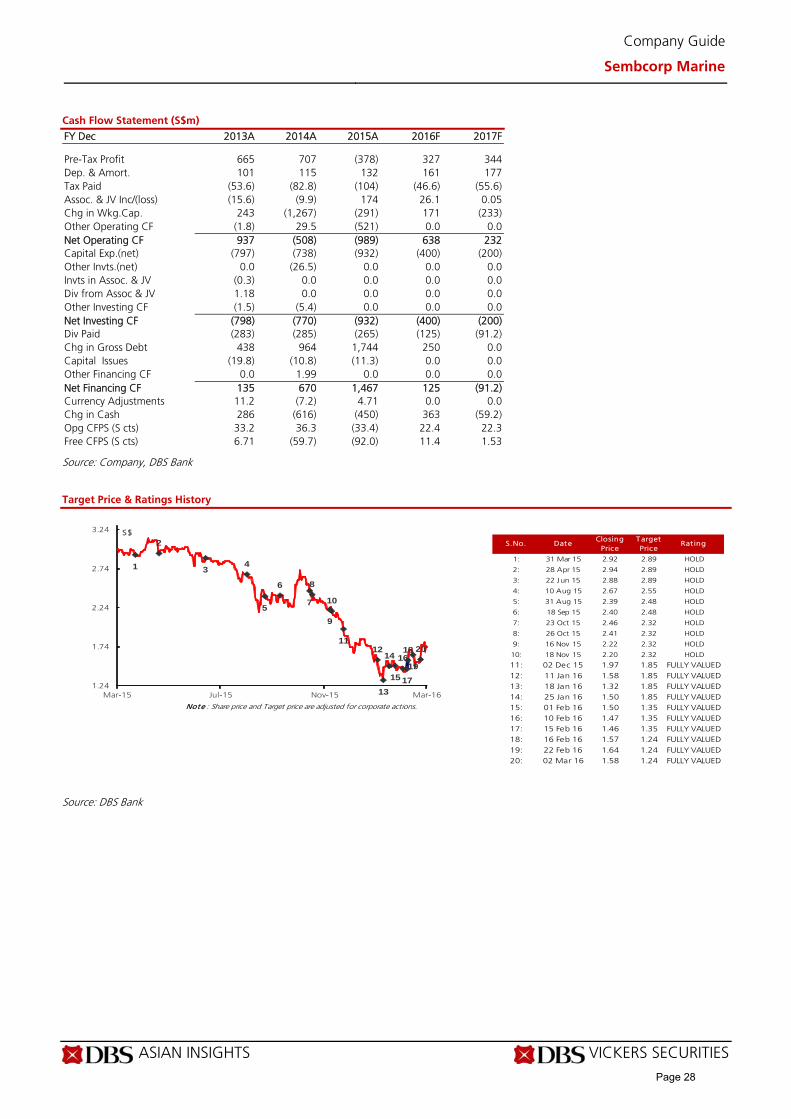
Cash Flow Statement (S$m)
FY Dec 2013A 2014A 2015A 2016F 2017F Pre-Tax Profit 665 707 (378) 327 344 Dep. & Amort. 101 115 132 161 177 Tax Paid (53.6) (82.8) (104) (46.6) (55.6) Assoc. & JV Inc/(loss) (15.6) (9.9) 174 26.1 0.05 Chg in Wkg.Cap. 243 (1,267) (291) 171 (233) Other Operating CF (1.8) 29.5 (521) 0.0 0.0 Net Operating CF 937 (508) (989) 638 232 Capital Exp.(net) (797) (738) (932) (400) (200) Other Invts.(net) 0.0 (26.5) 0.0 0.0 0.0 Invts in Assoc. & JV (0.3) 0.0 0.0 0.0 0.0 Div from Assoc & JV 1.18 0.0 0.0 0.0 0.0 Other Investing CF (1.5) (5.4) 0.0 0.0 0.0 Net Investing CF (798) (770) (932) (400) (200) Div Paid (283) (285) (265) (125) (91.2) Chg in Gross Debt 438 964 1,744 250 0.0 Capital Issues (19.8) (10.8) (11.3) 0.0 0.0 Other Financing CF 0.0 1.99 0.0 0.0 0.0 Net Financing CF 135 670 1,467 125 (91.2) Currency Adjustments 11.2 (7.2) 4.71 0.0 0.0 Chg in Cash 286 (616) (450) 363 (59.2) Opg CFPS (S cts) 33.2 36.3 (33.4) 22.4 22.3 Free CFPS (S cts) 6.71 (59.7) (92.0) 11.4 1.53
Source: Company, DBS Bank
Target Price & Ratings History
Source: DBS Bank
S.No. DateClosing
PriceTarget Price
Rat ing
1: 31 Mar 15 2.92 2.89 HOLD
2: 28 Apr 15 2.94 2.89 HOLD
3: 22 Jun 15 2.88 2.89 HOLD
4: 10 Aug 15 2.67 2.55 HOLD
5: 31 Aug 15 2.39 2.48 HOLD
6: 18 Sep 15 2.40 2.48 HOLD
7: 23 Oct 15 2.46 2.32 HOLD
8: 26 Oct 15 2.41 2.32 HOLD
9: 16 Nov 15 2.22 2.32 HOLD
10: 18 Nov 15 2.20 2.32 HOLD
11: 02 Dec 15 1.97 1.85 FULLY VALUED12: 11 Jan 16 1.58 1.85 FULLY VALUED13: 18 Jan 16 1.32 1.85 FULLY VALUED14: 25 Jan 16 1.50 1.85 FULLY VALUED
Note : Share price and Target price are adjusted for corporate actions. 15: 01 Feb 16 1.50 1.35 FULLY VALUED16: 10 Feb 16 1.47 1.35 FULLY VALUED17: 15 Feb 16 1.46 1.35 FULLY VALUED18: 16 Feb 16 1.57 1.24 FULLY VALUED19: 22 Feb 16 1.64 1.24 FULLY VALUED20: 02 Mar 16 1.58 1.24 FULLY VALUED
1
2
34
5
6
7
8
9
10
1112
13
14
15
16
17
18
19
20
1.24
1.74
2.24
2.74
3.24
Mar-15 Jul-15 Nov-15 Mar-16
S$
Page 28
Industry Focus
Singapore Rigbuilders
Page 9
DBS Bank recommendations are based an Absolute Total Return* Rating system, defined as follows:
STRONG BUY (>20% total return over the next 3 months, with identifiable share price catalysts within this time frame)
BUY (>15% total return over the next 12 months for small caps, >10% for large caps)
HOLD (-10% to +15% total return over the next 12 months for small caps, -10% to +10% for large caps)
FULLY VALUED (negative total return i.e. > -10% over the next 12 months)
SELL (negative total return of > -20% over the next 3 months, with identifiable catalysts within this time frame)
Share price appreciation + dividends
GENERAL DISCLOSURE/DISCLAIMER
This report is prepared by DBS Bank Ltd This report is solely intended for the clients of DBS Bank Ltd and DBS Vickers Securities (Singapore) Pte Ltd,
its respective connected and associated corporations and affiliates (collectively, the “DBS Vickers Group”) only and no part of this document may
be (i) copied, photocopied or duplicated in any form or by any means or (ii) redistributed without the prior written consent of DBS Bank Ltd.
The research set out in this report is based on information obtained from sources believed to be reliable, but we (which collectively refers to DBS
Bank Ltd., its respective connected and associated corporations, affiliates and their respective directors, officers, employees and agents (collectively,
the “DBS Group”)) do not make any representation or warranty as to its accuracy, completeness or correctness. Opinions expressed are subject to
change without notice. This document is prepared for general circulation. Any recommendation contained in this document does not have regard
to the specific investment objectives, financial situation and the particular needs of any specific addressee. This document is for the information of
addressees only and is not to be taken in substitution for the exercise of judgement by addressees, who should obtain separate independent legal
or financial advice. The DBS Group accepts no liability whatsoever for any direct, indirect and/or consequential loss (including any claims for loss of
profit) arising from any use of and/or reliance upon this document and/or further communication given in relation to this document. This
document is not to be construed as an offer or a solicitation of an offer to buy or sell any securities. The DBS Group, along with its affiliates and/or
persons associated with any of them may from time to time have interests in the securities mentioned in this document. The DBS Group may have
positions in, and may effect transactions in securities mentioned herein and may also perform or seek to perform broking, investment banking and
other banking services for these companies.
Any valuations, opinions, estimates, forecasts, ratings or risk assessments herein constitutes a judgment as of the date of this report, and there can
be no assurance that future results or events will be consistent with any such valuations, opinions, estimates, forecasts, ratings or risk assessments.
The information in this document is subject to change without notice, its accuracy is not guaranteed, it may be incomplete or condensed and it
may not contain all material information concerning the company (or companies) referred to in this report.
The valuations, opinions, estimates, forecasts, ratings or risk assessments described in this report were based upon a number of estimates and
assumptions and are inherently subject to significant uncertainties and contingencies. It can be expected that one or more of the estimates on
which the valuations, opinions, estimates, forecasts, ratings or risk assessments were based will not materialize or will vary significantly from actual
results. Therefore, the inclusion of the valuations, opinions, estimates, forecasts, ratings or risk assessments described herein IS NOT TO BE RELIED
UPON as a representation and/or warranty by the DBS Group (and/or any persons associated with the aforesaid entities), that:
(a) such valuations, opinions, estimates, forecasts, ratings or risk assessments or their underlying assumptions will be achieved, and
(b) there is any assurance that future results or events will be consistent with any such valuations, opinions, estimates, forecasts, ratings or risk
assessments stated therein.
Any assumptions made in this report that refers to commodities, are for the purposes of making forecasts for the company (or companies)
mentioned herein. They are not to be construed as recommendations to trade in the physical commodity or in the futures contract relating to the
commodity referred to in this report.
DBS Vickers Securities (USA) Inc ("DBSVUSA")"), a U.S.-registered broker-dealer, does not have its own investment banking or research
department, has not participated in any public offering of securities as a manager or co-manager or in any other investment banking transaction
in the past twelve months and does not engage in market-making.
ANALYST CERTIFICATION
The research analyst(s) primarily responsible for the content of this research report, in part or in whole, certifies that the views about the
companies and their securities expressed in this report accurately reflect his/her personal views. The analyst(s) also certifies that no part of his/her
compensation was, is, or will be, directly, or indirectly, related to specific recommendations or views expressed in this report. As of 11 Mar 2016,
the analyst(s) and his/her spouse and/or relatives who are financially dependent on the analyst(s), do not hold interests in the securities
recommended in this report (“interest” includes direct or indirect ownership of securities).
Page 29
Industry Focus
Singapore Rigbuilders
Page 10
COMPANY-SPECIFIC / REGULATORY DISCLOSURES
1. DBS Bank Ltd, DBS Vickers Securities (Singapore) Pte Ltd (''DBSVS''), their subsidiaries and/or other affiliates have proprietary positions in
Keppel Corporation, Sembcorp Industries, Sembcorp Marine recommended in this report as of 29 Feb 2016
2. DBS Bank Ltd does not market make in equity securities of the issuer(s) or company(ies) mentioned in this Research Report.
3. Compensation for investment banking services:
DBS Bank Ltd., DBSVS, their subsidiaries and/or other affiliates of DBSVUSA have received compensation, within the past 12 months for
investment banking services from Keppel Corporation as of 29 Feb 2016.
DBSVUSA does not have its own investment banking or research department, nor has it participated in any public offering of securities
as a manager or co-manager or in any other investment banking transaction in the past twelve months. Any US persons wishing to
obtain further information, including any clarification on disclosures in this disclaimer, or to effect a transaction in any security discussed
in this document should contact DBSVUSA exclusively.
4. Directorship/trustee interests:
Danny Teoh Leong Kay, a member of DBS Group Holdings Board of Directors, is a Director of Keppel Corporation as of 28 Feb 2015.
RESTRICTIONS ON DISTRIBUTION
General This report is not directed to, or intended for distribution to or use by, any person or entity who is a citizen or resident of or located in any locality, state, country or other jurisdiction where such distribution, publication, availability or use would be contrary to law or regulation.
Australia This report is being distributed in Australia by DBS Bank Ltd. (“DBS”) or DBS Vickers Securities (Singapore) Pte Ltd (“DBSVS”), both of which are exempted from the requirement to hold an Australian Financial Services Licence under the Corporation Act 2001 (“CA”) in respect of financial services provided to the recipients. Both DBS and DBSVS are regulated by the Monetary Authority of Singapore under the laws of Singapore, which differ from Australian laws. Distribution of this report is intended only for “wholesale investors” within the meaning of the CA.
Hong Kong This report is being distributed in Hong Kong by DBS Vickers (Hong Kong) Limited which is licensed and regulated by the Hong Kong Securities and Futures Commission.
Indonesia This report is being distributed in Indonesia by PT DBS Vickers Securities Indonesia.
Malaysia This report is distributed in Malaysia by AllianceDBS Research Sdn Bhd ("ADBSR"). Recipients of this report, received from ADBSR are to contact the undersigned at 603-2604 3333 in respect of any matters arising from or in connection with this report. In addition to the General Disclosure/Disclaimer found at the preceding page, recipients of this report are advised that ADBSR (the preparer of this report), its holding company Alliance Investment Bank Berhad, their respective connected and associated corporations, affiliates, their directors, officers, employees, agents and parties related or associated with any of them may have positions in, and may effect transactions in the securities mentioned herein and may also perform or seek to perform broking, investment banking/corporate advisory and other services for the subject companies. They may also have received compensation and/or seek to obtain compensation for broking, investment banking/corporate advisory and other services from the subject companies.
Wong Ming Tek, Executive Director, ADBSR
Singapore This report is distributed in Singapore by DBS Bank Ltd (Company Regn. No. 196800306E) or DBSVS (Company Regn No. 198600294G), both of which are Exempt Financial Advisers as defined in the Financial Advisers Act and regulated by the Monetary Authority of Singapore. DBS Bank Ltd and/or DBSVS, may distribute reports produced by its respective foreign entities, affiliates or other foreign research houses pursuant to an arrangement under Regulation 32C of the Financial Advisers Regulations. Where the report is distributed in Singapore to a person who is not an Accredited Investor, Expert Investor or an Institutional Investor, DBS Bank Ltd accepts legal responsibility for the contents of the report to such persons only to the extent required by law. Singapore recipients should contact DBS Bank Ltd at 6327 2288 for matters arising from, or in connection with the report.
Thailand This report is being distributed in Thailand by DBS Vickers Securities (Thailand) Co Ltd. Research reports distributed are only intended for institutional clients only and no other person may act upon it.
United Kingdom This report is being distributed in the UK by DBS Vickers Securities (UK) Ltd, who is an authorised person in the meaning of the Financial Services and Markets Act and is regulated by The Financial Conduct Authority. Research distributed in the UK is intended only for institutional clients.
Page 30
Industry Focus
Singapore Rigbuilders
Page 11
Dubai
This research report is being distributed in The Dubai International Financial Centre (“DIFC”) by DBS Bank Ltd., (DIFC Branch) having its office at PO Box 506538, 3rd Floor, Building 3, East Wing, Gate Precinct, Dubai International Financial Centre (DIFC), Dubai, United Arab Emirates. DBS Bank Ltd., (DIFC Branch) is regulated by The Dubai Financial Services Authority. This research report is intended only for professional clients (as defined in the DFSA rulebook) and no other person may act upon it.
United States This report was prepared by DBS Bank Ltd. DBSVUSA did not participate in its preparation. The research analyst(s) named on this report are not registered as research analysts with FINRA and are not associated persons of DBSVUSA. The research analyst(s) are not subject to FINRA Rule 2241 restrictions on analyst compensation, communications with a subject company, public appearances and trading securities held by a research analyst. This report is being distributed in the United States by DBSVUSA, which accepts responsibility for its contents. This report may only be distributed to Major U.S. Institutional Investors (as defined in SEC Rule 15a-6) and to such other institutional investors and qualified persons as DBSVUSA may authorize. Any U.S. person receiving this report who wishes to effect transactions in any securities referred to herein should contact DBSVUSA directly and not its affiliate.
Other jurisdictions In any other jurisdictions, except if otherwise restricted by laws or regulations, this report is intended only for qualified, professional, institutional or sophisticated investors as defined in the laws and regulations of such jurisdictions.
DBS Bank Ltd
12 Marina Boulevard, Marina Bay Financial Centre Tower 3
Singapore 018982
Tel. 65-6878 8888
Company Regn. No. 196800306E
Page 31