singapore healthcare spending influencers
TRANSCRIPT
8/8/2019 Singapore Healthcare Spending Influencers
http://slidepdf.com/reader/full/singapore-healthcare-spending-influencers 1/12
Factors Influencing Healthcare Spending in Singapore: A Regression Model
International Journal of The Computer, the Internet and Management Vol.12No.3 (September-December, 2004) pp 51-62
51
Factors Influencing Healthcare Spending in Singapore:A Regression Model
Seng Lee Huang
School of Mechanical and Manufacturing EngineeringSingapore Polytechnic, Singapore
Email:[email protected]
Abstract
In this paper, historical records of
health care expenditure from 1960 to 2001
were gathered and a regression model was
developed using ordinary least squaretechnique. The regression model is
developed at an aggregate level which helps
to provide some insights on the factors
affecting health care spending. The data
analysed by using the PH-Stat2 Software, the
program will suggest alternative models and
the most suitable model is chosen, verified
and evaluated for its aptness.
1. Introduction
Expenditures on health care are rising inmany countries and Singapore is noexception. In absolute terms, the aggregatehealth care expenditure rose from $0.1
billion in 1961 to $5 billion(at current market price) in 2001, and government health careoperating expenditure rose from $0.05
billion to $1.2 billion(at current market price) in 1961 and 2001 respectively, whichaccounts for 6.7% of the governmentoperating budget in 2001 [1]. In terms of individuals’ expenditure, the health careexpenditure per capita rose from S$177 in
1961 to S$1 380 in 2001 (at 1990 price).Health care service is manpower
intensive, and the rising manpower cost isalso a cause for concern. Furthermore,Singapore population is ageing rapidly, andthe proportion of population who are 60
years old and older has risen from 4.1% in1961 to 11% in 2001 and it is expected toreach 27% in 2030 [2].
Even though the Singapore economy hasenjoyed rapid growth; the gross domestic
product per capita average annual growthrate is 6.3 % from 1960 to 2001. But thegovernment is concerned as health care costsare rising steadily while the population isaging and the economy is maturing.
In October 1993, the government hasspelt out its philosophy, policy and approach
to controlling health care costs in a WhitePaper on “Affordable Health Care”, thussetting the direction for the health caresystem.
The Singapore health care philosophyemphasises on building a healthy populationthrough preventive health care programs andthe promotion of healthy living. Emphasis is
placed on health education, immunization
and health screening for early detection of diseases. The government is committed to
provide good and affordable basic medicalservices to all Singaporeans through the
provision of heavily subsidised medicalservices at the public hospital. Butindividuals are encouraged to takeresponsibility for their own health by savingfor medical expenses and avoid reliance on
state welfare or medical insurance and evenin the most heavily subsidised wards they areexpected to co-pay. And if the market fails tokeep the health care costs down, thegovernment will step in and intervene.
8/8/2019 Singapore Healthcare Spending Influencers
http://slidepdf.com/reader/full/singapore-healthcare-spending-influencers 2/12
Seng Lee Huang
52
2. Determinants of Health Care Expenditure
Spending on health care is a result of amultitude of factors interacting with oneanother. In line with the current literature on
determinants of health care expenditure andtaking into the consideration of health caresystem and the way it is financed, five keydeterminants were chosen: gross domestic
product, government health operatingexpenditures, supply of doctors, aging
population and the use of Medisavewithdrawal for payment of health careexpenditures.
Many empirical studies have shown thatgross domestic product has a stronginfluence on health care spending, For example Newhouse in 1977[3], Gerdthamand Jonsson in 1992 [4] and Hitiris andPosnett in 1992 [5], using cross-sectional
OECD (Organisation of EconomicCooperation and Development) data,reported that gross domestic product was one
of the most important determinants of aggregate health care expenditure. InGetzen’s 1990 paper [6], the model that he
proposed uses only gross domestic productand inflation factors. In 2000, Getzen’s paper [7] suggested that health spending is more a
function of income over previous five yearsthan of current. That is gross domestic
product growth effectively has impact on
private health spending after three to fiveyears.
Another influencing factor is the percentage of elderly people in a country.The old spend more on medical care than the
young, and it is, therefore, intuitively correctto assume that the aggregate health care riseswith higher percentage of elderly populationin the country. Studies made in Japan byFujino published in 1987 [8] showed that theelderly consume about 3.2 times moremedical services than the average person.In addition, studies done in the United States
by Murthy and Ukpolo published in 1994[9]showed that it is one of the most significant
determinants of health expenditures.Government subsidy also influence
health care expenditure, in Matteo andMatteos’ paper [10], 1998, they showed thatthe real per capita provincial government
expenditures is positively correlated to provincial per capita federal transfer revenues.
In the health care industry, there isasymmetrical information between thedoctor and patient; therefore, there is this
potential for exploitation when the supplier who also acts as the agent can bring about alevel of consumption different from that
which would have occurred if the fullyinformed consumer were to choose freely.Hence the “inducement hypothesis” whichstates that health care is supply driven that issupply creates its own demand since.Therefore, as the number of doctors grows,
the health care consumption increases asmore physicians would induce more demand.
The aggregate health care expenditure
which is a function of economic wealth of anation, the amount of government subsidy,the proportion of aging population and , the
ratio of doctor to per thousand populationand lastly the effect of MediSave scheme.These variables were chosen because a) they
reflect the changes in health care expenditureand not changes in inflation, or population or recession and b) good historical data is
available for the study.
AHE = F (GDP (lag 0 - 5 ) , GHR, DOC, AGE,
MED)…………………..(1)
AHE = aggregate health care expenditure per capita
GDP (lag 0 -5) = gross domestic product per
capita with a lag of 0 to 5 years
GHR = percentage of government health
expenditure to gross domestic product
DOC = doctor per thousand population
AGE = proportion of population≥ 60 years
old
MED = Medisave scheme
8/8/2019 Singapore Healthcare Spending Influencers
http://slidepdf.com/reader/full/singapore-healthcare-spending-influencers 3/12
Factors Influencing Healthcare Spending in Singapore: A Regression Model
International Journal of The Computer, the Internet and Management Vol.12No.3 (September-December, 2004) pp 51-62
53
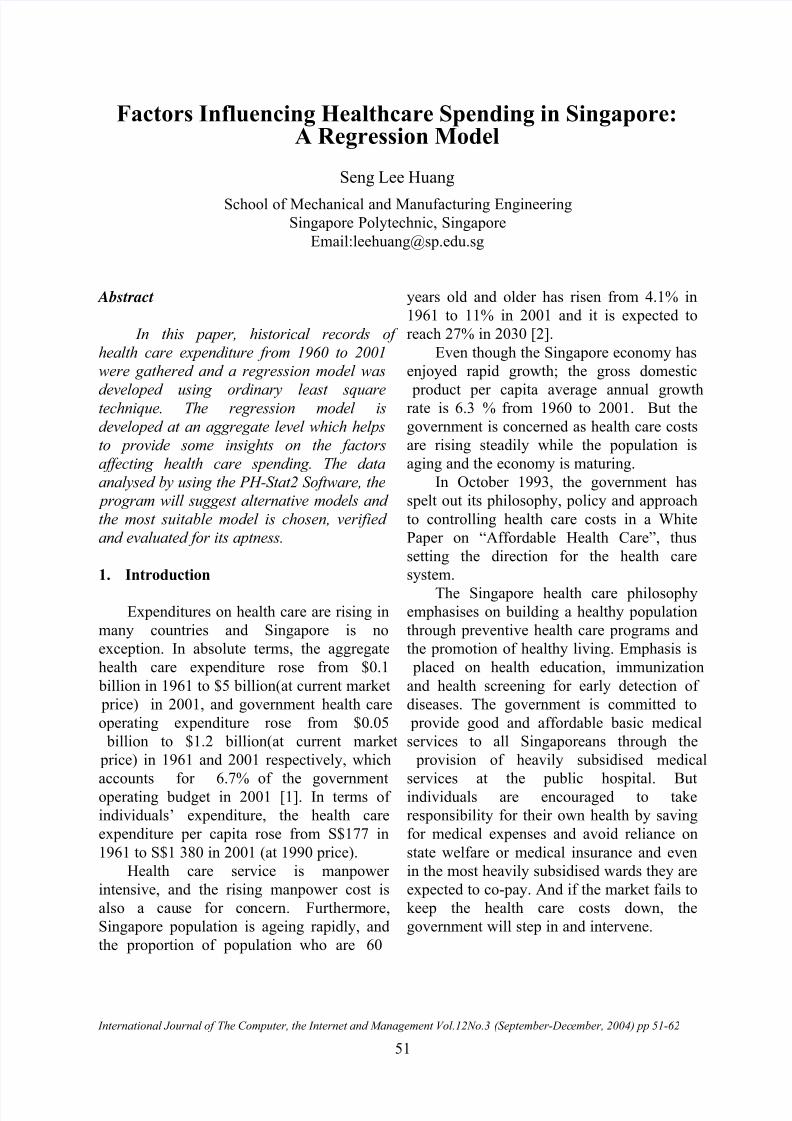
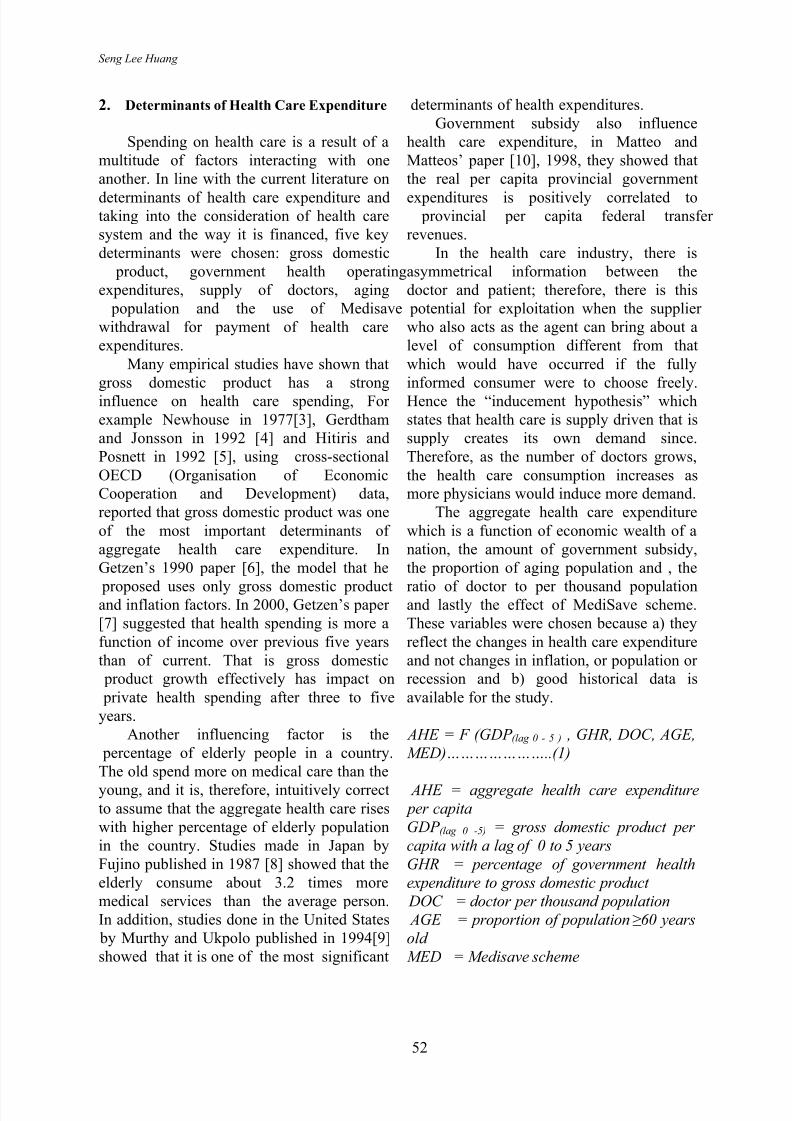
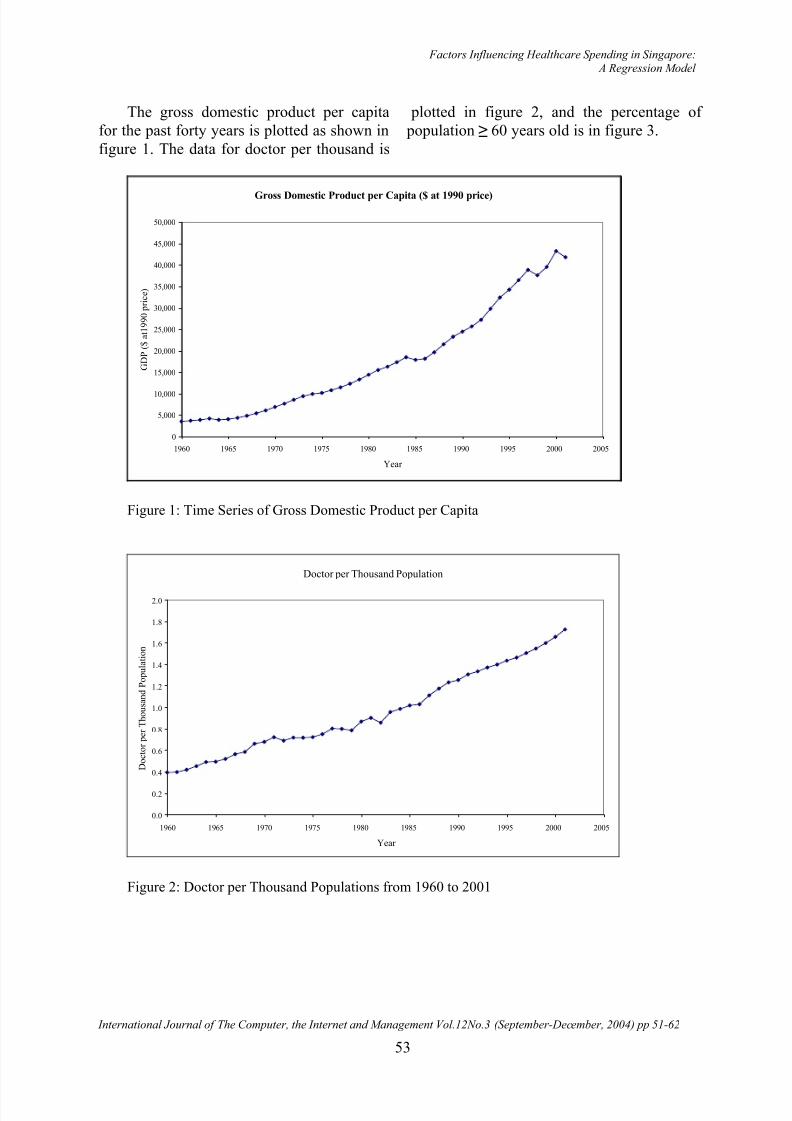
The gross domestic product per capitafor the past forty years is plotted as shown infigure 1. The data for doctor per thousand is
plotted in figure 2, and the percentage of population ≥ 60 years old is in figure 3.
Gross Domestic Product per Capita ($ at 1990 price)
0
5,000
10,000
15,000
20,000
25,000
30,000
35,000
40,000
45,000
50,000
1960 1965 1970 1975 1980 1985 1990 1995 2000 2005
Year
G D P ( $ a t 1 9 9 0 p r i c e )
Figure 1: Time Series of Gross Domestic Product per Capita
Doctor per Thousand Population
0.0
0.2
0.4
0.6
0.8
1.0
1.2
1.4
1.6
1.8
2.0
1960 1965 1970 1975 1980 1985 1990 1995 2000 2005
Year
D o c t o r p e r T h o u s a n d P o p u l a t i o n
Figure 2: Doctor per Thousand Populations from 1960 to 2001
8/8/2019 Singapore Healthcare Spending Influencers
http://slidepdf.com/reader/full/singapore-healthcare-spending-influencers 4/12
Seng Lee Huang
54
Proportion of Population ≥60 years old
0
2
4
6
8
10
12
1960 1965 1970 1975 1980 1985 1990 1995 2000 2005
Year
P e r c e n t a g e o f P o p u l a t i o n > = 6 0 y e
a r s o l d
Figure 3: Proportion of Population ≥ 60 Years Old from 1960 to 2001
3. Methodology
The health care expenditure is analysedat an aggregate level, and records of healthcare expenditures were obtained fromYearbook of Statistics Singapore from 1960to 2001. The expenditures were adjusted for inflation by using the gross domestic product
deflator based on 1990 prices, and thendivided by the population to obtain the realexpenditures per capita.
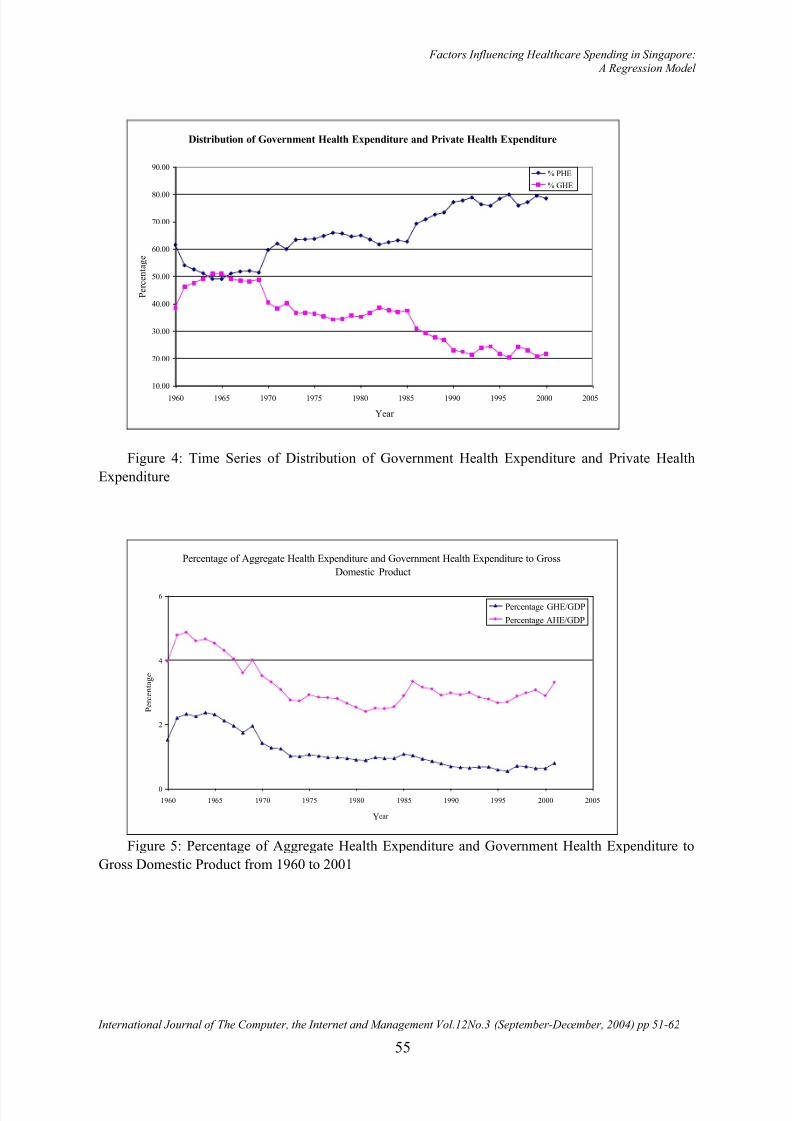
Aggregate Health Expenditure = Private
Health Expenditure (PHE) + Government
Health Expenditure (GHE)
The aggregate health expenditure isdefined as the sum of private health
expenditure and government healthexpenditure. Government health expenditure
only includes direct and related healthexpenses by the Ministry of Health andexcludes development expenditures andother expenditures related to environmentalhealth. Private health expenditure includesexpenditures on medical and pharmaceutical
products, and expenditures on services of physicians and nurses. The aggregate health
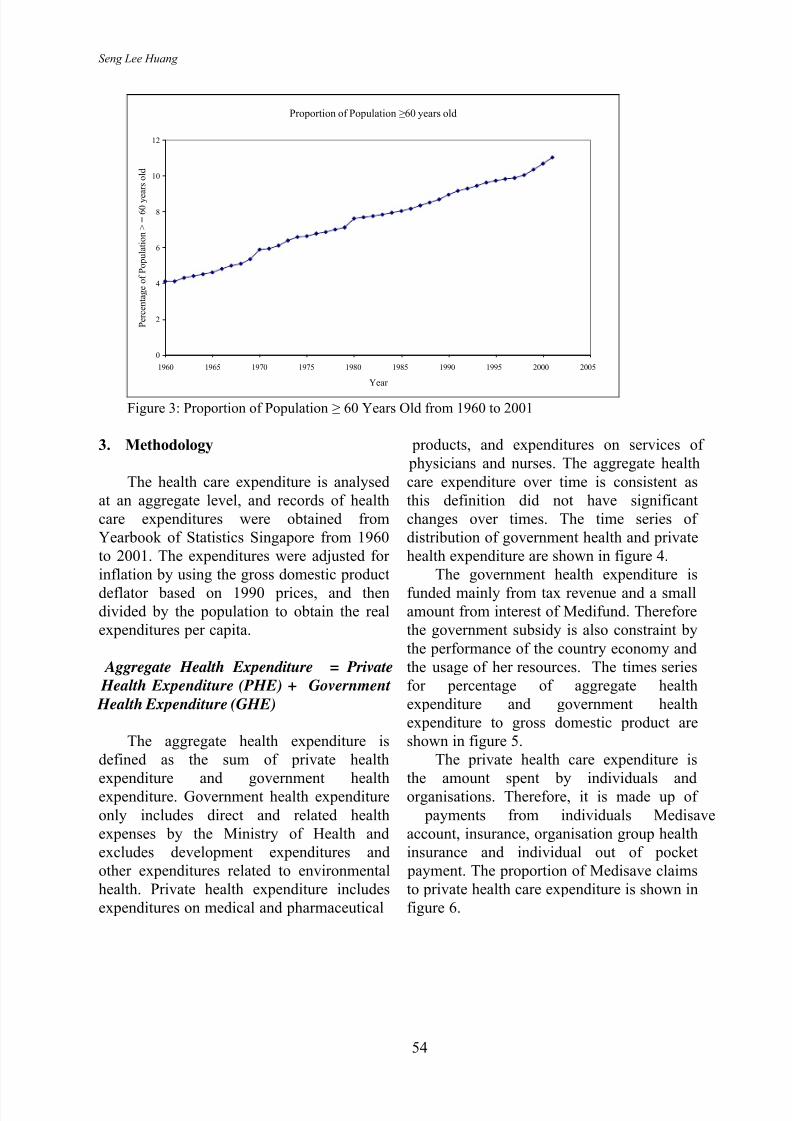
care expenditure over time is consistent asthis definition did not have significantchanges over times. The time series of distribution of government health and privatehealth expenditure are shown in figure 4.
The government health expenditure is
funded mainly from tax revenue and a smallamount from interest of Medifund. Thereforethe government subsidy is also constraint by
the performance of the country economy andthe usage of her resources. The times seriesfor percentage of aggregate healthexpenditure and government healthexpenditure to gross domestic product areshown in figure 5.
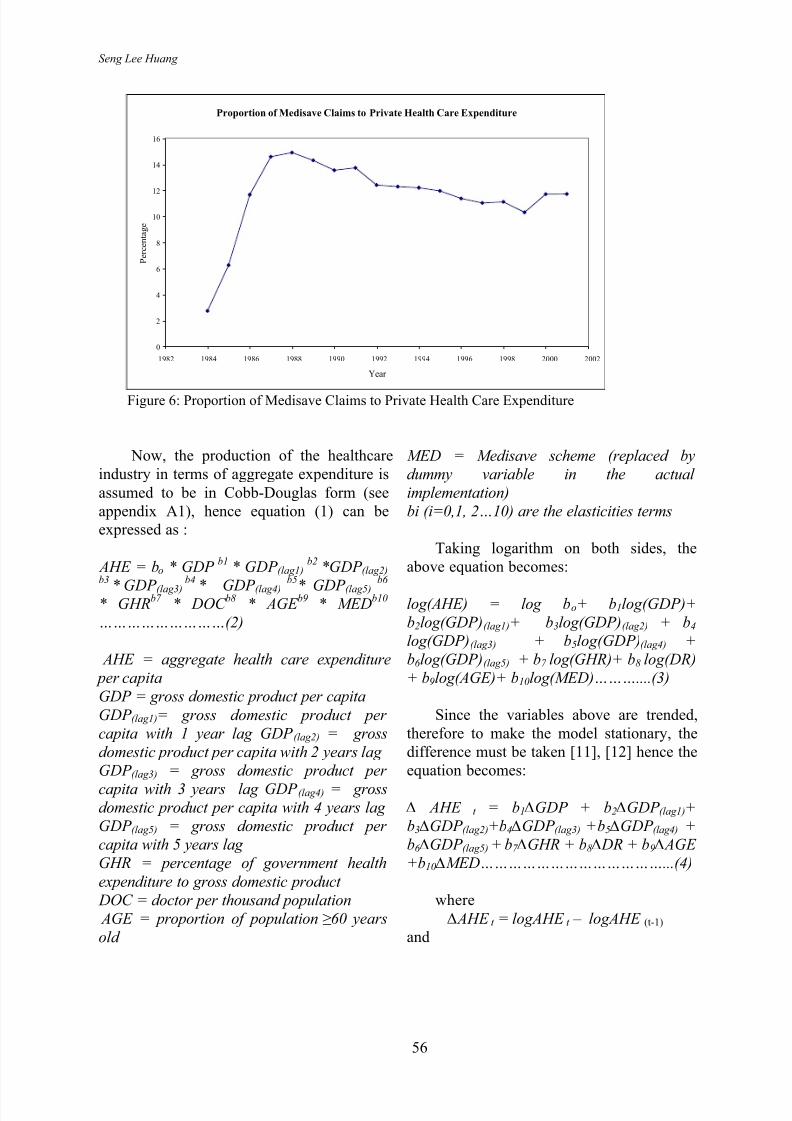
The private health care expenditure is
the amount spent by individuals andorganisations. Therefore, it is made up of
payments from individuals Medisaveaccount, insurance, organisation group healthinsurance and individual out of pocket
payment. The proportion of Medisave claimsto private health care expenditure is shown infigure 6.
8/8/2019 Singapore Healthcare Spending Influencers
http://slidepdf.com/reader/full/singapore-healthcare-spending-influencers 5/12
Factors Influencing Healthcare Spending in Singapore: A Regression Model
International Journal of The Computer, the Internet and Management Vol.12No.3 (September-December, 2004) pp 51-62
55
Distribution of Government Health Expenditure and Private Health Expenditure
10.00
20.00
30.00
40.00
50.00
60.00
70.00
80.00
90.00
1960 1965 1970 1975 1980 1985 1990 1995 2000 2005
Year
P e r c e n t a g e
% PHE
% GHE
Figure 4: Time Series of Distribution of Government Health Expenditure and Private Health
Expenditure
Percentage of Aggregate Health Expenditure and Government Health Expenditure to Gross
Domestic Product
0
2
4
6
1960 1965 1970 1975 1980 1985 1990 1995 2000 2005
Year
P e r c e n t a g e
Percentage GHE/GDP
Percentage AHE/GDP
Figure 5: Percentage of Aggregate Health Expenditure and Government Health Expenditure to
Gross Domestic Product from 1960 to 2001
8/8/2019 Singapore Healthcare Spending Influencers
http://slidepdf.com/reader/full/singapore-healthcare-spending-influencers 6/12
Seng Lee Huang
56
Proportion of Medisave Claims to Private Health Care Expenditure
0
2
4
6
8
10
12
14
16
1982 1984 1986 1988 1990 1992 1994 1996 1998 2000 2002
Year
P e r c e n t a g e
Figure 6: Proportion of Medisave Claims to Private Health Care Expenditure
Now, the production of the healthcareindustry in terms of aggregate expenditure is
assumed to be in Cobb-Douglas form (seeappendix A1), hence equation (1) can beexpressed as :
AHE = bo * GDP b1
* GDP (lag1)b2
*GDP (lag2)b3
* GDP (lag3)
b4
* GDP (lag4)
b5
* GDP (lag5)
b6
* GHRb7
* DOC b8
* AGE b9
* MEDb10
………………………(2)
AHE = aggregate health care expenditure
per capita
GDP = gross domestic product per capita
GDP (lag1)= gross domestic product per
capita with 1 year lag GDP (lag2) = gross
domestic product per capita with 2 years lag
GDP (lag3) = gross domestic product per
capita with 3 years lag GDP (lag4) = grossdomestic product per capita with 4 years lag
GDP (lag5) = gross domestic product per
capita with 5 years lag
GHR = percentage of government health
expenditure to gross domestic product
DOC = doctor per thousand population
AGE = proportion of population ≥ 60 years
old
MED = Medisave scheme (replaced by
dummy variable in the actual
implementation)
bi (i=0,1, 2…10) are the elasticities terms
Taking logarithm on both sides, theabove equation becomes:
log(AHE) = log bo+ b1log(GDP)+
b2log(GDP)(lag1)+ b3log(GDP)(lag2) + b4
log(GDP)(lag3) + b5log(GDP)(lag4) +
b6 log(GDP)(lag5) + b7 log(GHR)+ b8 log(DR)
+ b9log(AGE)+ b10log(MED)………....(3)
Since the variables above are trended,therefore to make the model stationary, thedifference must be taken [11], [12] hence theequation becomes:
∆ AHE t = b1 ∆GDP + b2 ∆GDP (lag1)+
b3 ∆GDP (lag2)+b4 ∆GDP (lag3) + b5 ∆GDP (lag4) +
b6 ∆GDP (lag5) + b7 ∆GHR + b8 ∆ DR + b9 ∆ AGE
+b10 ∆MED…………………………………...(4)
where ∆ AHE t = logAHE t – logAHE (t-1)
and
8/8/2019 Singapore Healthcare Spending Influencers
http://slidepdf.com/reader/full/singapore-healthcare-spending-influencers 7/12
Factors Influencing Healthcare Spending in Singapore: A Regression Model
International Journal of The Computer, the Internet and Management Vol.12No.3 (September-December, 2004) pp 51-62
57
t = 1,2,3 …….41 (1961, 1962,
………,2001)
∆MED is replaced by a dummy variable,hence the equation becomes
ahe = b1*gdp + b2*gdp(lag1) + b3*gdp(lag2) +
b4*gdp(lag3) + b5 *gdp(lag4) + b6 *gdp(lag5) +
b7 *ghr + b8*dr + b9*age + b10* dum
………….…(5)
dum = 0 (Medisave scheme not present)
dum = 1 (Medisave scheme present)
small letters to represent (log-log)
4. Implementation
There are 10 possible dependentvariables: gdp, gdp(-1), gdp(-2), gdp(-3), gdp(-4),
gdp(-5) , ghr, doc, age, dum. The developmentof the model is done on the PH2-Statsoftware which uses the approach of best-subsets regression analysis. This programhas a limitation of running a maximum of
seven dependent variables at one time.Therefore, the analysis was split into severalruns.
For each run, the variables ghr, doc, ageand dum remained in the all the runs. For variables gdp, gdp(-1), gdp(-2), gdp(-3), gdp(-4), and gdp(-5) were first grouped into twogroups: gdp, gdp(-1), gdp(-2), as one group and
gdp(-3), gdp(-4), and gdp(-5) as another group. To determine which of these variablesshould be chosen for the next run, theexpected signs of the coefficients werecompared with the results. If it does not
agree with the expected signs that variable isdropped. Then, the variables with the right
signs were chosen from the two groups for the final run
The best-subsets approach evaluates all
the possible regression models for a given setof independent variables. The software willsuggest alternative models based on thestatistic C p. This evaluation criterion for competing models is developed by Mallows
[13]. The statistic C p measures thedifferences between fitted regression modeland the true model. When a regression modelwith k independent variables contains onlyrandom differences from a true model, the
average value of C p is k+1, the number of parameters. Thus in evaluating manyalternative models, the goal is to find modelswhose C p is close to or below (k+1).
In general, the steps involved in buildingthe model are:
1. Choose a set of independentvariables to be considered for theregression model.
2. Fit a full regression model that
contains all the independentvariables so that the varianceinflationary factor, VIF (seeappendix A2) can be determinedfor each independent variable.
3. Determine if any independentvariables have a VIF >5.
4. Three possible results can occur:
a. None of the independentvariables has VIF>5, proceedto step 5.
b. One of the independentvariables has a VIF>5,eliminate the variable and
proceed to step 5.c. More than one independent
variable has VIF>5, eliminate
the independent variable thathas the highest VIF and go
back to step 2.5. Perform the best-subsets regression
with the remaining independentvariables to obtain the best models
(in terms of C p) for a given number of independent variables.
6. List all the models that have C p≤
(k+1).7. Choose the best model based on C p,
interpretability and parsimony(perform partial F test).
8/8/2019 Singapore Healthcare Spending Influencers
http://slidepdf.com/reader/full/singapore-healthcare-spending-influencers 8/12
Seng Lee Huang
58
8. Perform a complete analysis of thismodel including residual analysis.Depending on the results of theresidual analysis, remodel theregression equation. The regression
analysis is based on ordinary leastsquare method; therefore residualanalyses are performed to check for
any violations of assumptions:constant variance, independenceand normality.
5. Results The results from the various sets of
dependent variables are summarized below.
Model 1.1 2.1 4.7 5.1
gdp 0.4435# 0.4506# - 0.4532#
gdp(-1) - - - -
gdp(-2) - 0.2428 - 0.2346
gdp(-3) - - 0.0103 -
gdp(-4) - - - -
gdp(-5) - - - - ghr 0.3194** 0.3187** 0.3236** 0.3201**
doc - - - -
age - - 0.7040* -
dum 0.0107* 0.0128# 0.0069 0.0123#
R Square 0.4179 0.4541 0.4457 0.4535
Adj R Square 0.3694 0.3899 0.3764 0.3872
(Notes: significant at α =0.01**, α =0.05#, α =0.10*)
Table [1]: Summary of Regression Results
Comparing the regression results of models 1.1, 2.1, 4.7 and 5.1, the model 2.1 ischosen as it has the highest adjusted R square value. The variance inflationary
factor is checked again for model 2.1, and allthe values are below 1.4 which is not verymuch greater than one, and the DurbinWatson statistic test = 2.15 which is greater than du,.01 =1.72 (k=4, n=38), which meansthat there is no evidence of positive
autocorrelation among the residuals.The assumptions of constant variance,independence and normality were checked
and residual plots were plotted. It is observedthat the plots were random, and therefore donot violate the above assumptions.
Hence, the model is :
ahe = 0.4506 gdp + 0.2428 gdp(-2) + 0.3187
ghr + 0.0128 dum
Since the equation is in log-log form,this would make the analysis easy. Theelasticity of gross domestic product per capita is 0.69 and the elasticity of percentage
of government health care expenditure togross domestic product is 0.32 and Medisavescheme elasticity is 0.01. Assuming that allthe dependents grow at a rate of 1%annually, this would result in a 1.0249%growth in aggregate health expenditure.
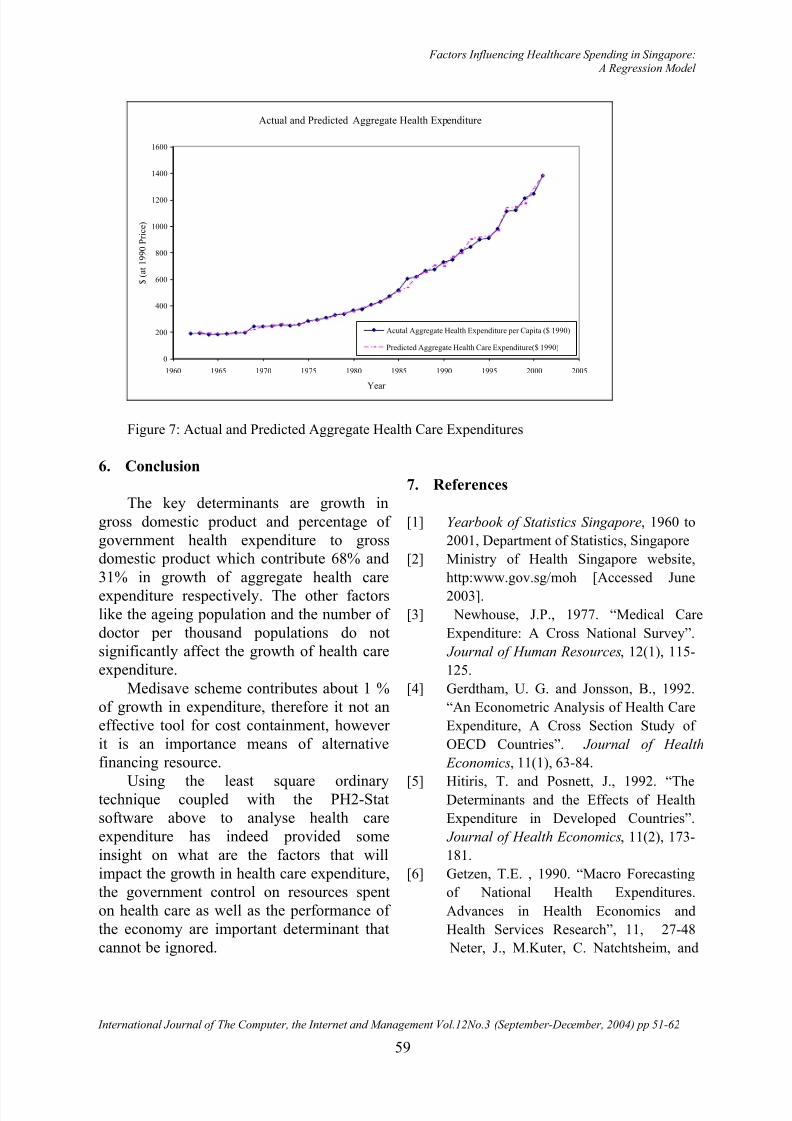
Based on the equation obtained from theleast square technique, a simulation run was
done for 1960 to 2001; the result of the run isshown in the figure below. The predictedresult was very close to the actual.
8/8/2019 Singapore Healthcare Spending Influencers
http://slidepdf.com/reader/full/singapore-healthcare-spending-influencers 9/12
Factors Influencing Healthcare Spending in Singapore: A Regression Model
International Journal of The Computer, the Internet and Management Vol.12No.3 (September-December, 2004) pp 51-62
59
Actual and Predicted Aggregate Health Expenditure
0
200
400
600
800
1000
1200
1400
1600
1960 1965 1970 1975 1980 1985 1990 1995 2000 2005
Year
$ ( a t 1 9 9 0 P r i c e )
Acutal Aggregate Health Expenditure per Capita ($ 1990)
Predicted Aggregate Health Care Expenditure($ 1990)
Figure 7: Actual and Predicted Aggregate Health Care Expenditures
6. Conclusion
The key determinants are growth in
gross domestic product and percentage of government health expenditure to grossdomestic product which contribute 68% and
31% in growth of aggregate health careexpenditure respectively. The other factorslike the ageing population and the number of doctor per thousand populations do notsignificantly affect the growth of health careexpenditure.
Medisave scheme contributes about 1 %of growth in expenditure, therefore it not aneffective tool for cost containment, however it is an importance means of alternativefinancing resource.
Using the least square ordinarytechnique coupled with the PH2-Statsoftware above to analyse health careexpenditure has indeed provided some
insight on what are the factors that willimpact the growth in health care expenditure,the government control on resources spenton health care as well as the performance of the economy are important determinant thatcannot be ignored.
7. References
[1] Yearbook of Statistics Singapore, 1960 to
2001, Department of Statistics, Singapore
[2] Ministry of Health Singapore website,
http:www.gov.sg/moh [Accessed June
2003].
[3] Newhouse, J.P., 1977. “Medical Care
Expenditure: A Cross National Survey”.
Journal of Human Resources, 12(1), 115-
125.
[4] Gerdtham, U. G. and Jonsson, B., 1992.
“An Econometric Analysis of Health Care
Expenditure, A Cross Section Study of
OECD Countries”. Journal of Health
Economics, 11(1), 63-84.
[5] Hitiris, T. and Posnett, J., 1992. “TheDeterminants and the Effects of Health
Expenditure in Developed Countries”.
Journal of Health Economics, 11(2), 173-
181.
[6] Getzen, T.E. , 1990. “Macro Forecasting
of National Health Expenditures.
Advances in Health Economics and
Health Services Research”, 11, 27-48
Neter, J., M.Kuter, C. Natchtsheim, and
8/8/2019 Singapore Healthcare Spending Influencers
http://slidepdf.com/reader/full/singapore-healthcare-spending-influencers 10/12
Seng Lee Huang
60
W. Wasserman, 1996. Applied Linear
Statistical Models. 4th
ed. Homewood, IL:
Irwin.
[7] Getzen, T.E., 2000. “Forecasting Health
Expenditures: Short, Medium and
Lon(Long) Term”. Journal of Health care Finance, 26(3), 56-72.
[8] Fujino, S., 1987. “Health Economics in
Japan: Prospects for the Future”. In: Smith
G.T., ed,. Health Economics: Prospects
for the Future. London; New York:
Croom Helm.
[9] Murthy, N.R.V. and Ukpolo, V., 1994.
“Aggregate Health Care Expenditure in
the United States: Evidence From
Cointegration Tests”. Applied Economics,
26(8), 797 – 802.
[10] Matteo, L.D., Matteo, R.D., 1998.
“Evidence on the Determinants of
Canadian Provincial Government Health
Expenditures:1965-1991”. Journal of
Health Economics, 17(2), 211-228.
[11] Getzen, T.E., 2000. “Forecasting Health
Expenditures: Short, Medium and
Lon(Long) Term”. Journal of Healthcare
Finance, 26(3), 56-72.
[12] Getzen, T.E., 1992. “Population Agingand the Growth of Health Expenditures”.
Journal of Gerontolgy: Social Sciences,
47(3), S98-104.
[13] Thomas, R.L., 1985. Introductory
Econometrics: Theory and Applications.
London; New York: Longman.
[14] Levine, D.M., Stephan, D., Krehbie, T.C.,
Berenson, M.L., 2002. Statistics for
Managers using MicroSoft Excel . 3rd ed.
Prentice Hall.
[15] Snee, R. D., 1973. “Some Aspects of
Nonorthogonal Data Analysis, Part I.
Developing Prediction Equations”.
Journal of Quality Technology, 5(2), 67-
69.
8/8/2019 Singapore Healthcare Spending Influencers
http://slidepdf.com/reader/full/singapore-healthcare-spending-influencers 11/12
Factors Influencing Healthcare Spending in Singapore: A Regression Model
International Journal of The Computer, the Internet and Management Vol.12No.3 (September-December, 2004) pp 51-62
61
Appendix
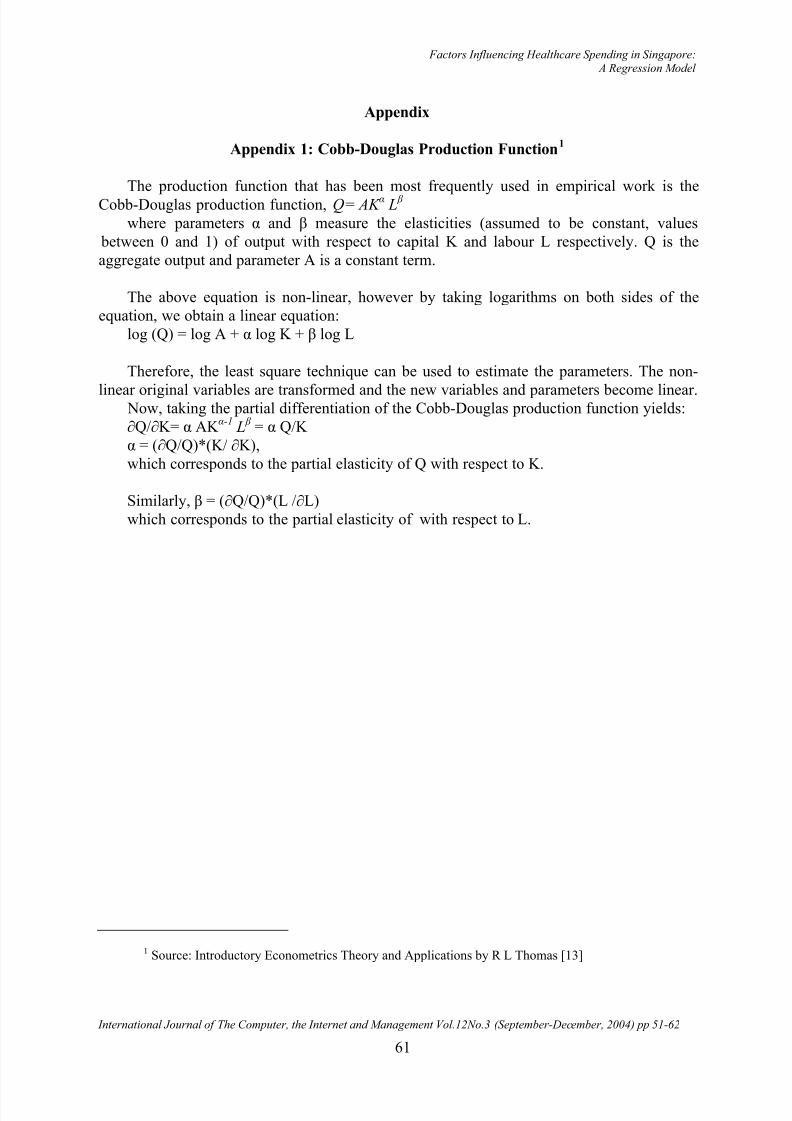
Appendix 1: Cobb-Douglas Production Function1
The production function that has been most frequently used in empirical work is the
Cobb-Douglas production function, Q= AK α L β
where parameters α and β measure the elasticities (assumed to be constant, values between 0 and 1) of output with respect to capital K and labour L respectively. Q is theaggregate output and parameter A is a constant term.
The above equation is non-linear, however by taking logarithms on both sides of theequation, we obtain a linear equation:
log (Q) = log A + α log K + β log L
Therefore, the least square technique can be used to estimate the parameters. The non-
linear original variables are transformed and the new variables and parameters become linear. Now, taking the partial differentiation of the Cobb-Douglas production function yields:∂Q/∂K= α AK α-1
L β = α Q/K
α = (∂Q/Q)*(K/ ∂K),which corresponds to the partial elasticity of Q with respect to K.
Similarly, β = (∂Q/Q)*(L /∂L)which corresponds to the partial elasticity of with respect to L.
1 Source: Introductory Econometrics Theory and Applications by R L Thomas [13]
8/8/2019 Singapore Healthcare Spending Influencers
http://slidepdf.com/reader/full/singapore-healthcare-spending-influencers 12/12
Seng Lee Huang
62
Appendix 2: Variance Inflationary Factor [14]
One of the important problems in the application of multiple regression analysis involvesthe possible collinearity of the independent variables. This condition refers to situations inwhich some of the independent variables are highly correlated with each other. In such
situations, collinear variables do not provide new information, and it becomes difficult toseparate the effect of such variables on the dependent response variable.
One method of measuring collinearity uses the variance inflationary factor (VIF) for eachindependent variable. VIF is defined as:
21
1
j
jr
VIF −
= where r j
2 is the coefficient of multiple determination of dependent variable X j with allother X variables
If the set of dependent variables are uncorrelated, then VIF j is equal to 1. If the set of dependent variables is highly intercorrelated, then VIF j might even exceed 10. However,some statisticians [15] have suggested a more conservative criterion that would employ toleast squares regression, that is VIF j should not exceed 5.