simultaneous pmc and pmse observations with a ground-based · 4tokyo metropolitan university, hino,...
TRANSCRIPT

Ann. Geophys., 31, 1793–1803, 2013www.ann-geophys.net/31/1793/2013/doi:10.5194/angeo-31-1793-2013© Author(s) 2013. CC Attribution 3.0 License.
Annales Geophysicae
Open A
ccess
Simultaneous PMC and PMSE observations with a ground-basedlidar and SuperDARN HF radar at Syowa Station, Antarctica
H. Suzuki1, T. Nakamura2, M. K. Ejiri 2, T. Ogawa3, M. Tsutsumi2, M. Abo4, T. D. Kawahara5, Y. Tomikawa2,A. S. Yukimatu2, and N. Sato2
1Rikkyo University, Toshimaku, Tokyo, Japan2National Institute of Polar Research, Tachikawa, Tokyo, Japan3National Institute of Information and Communications Technology, Koganei, Tokyo, Japan4Tokyo Metropolitan University, Hino, Tokyo, Japan5Shinshu University, Nagano, Japan
Correspondence to:H. Suzuki ([email protected])
Received: 31 December 2012 – Revised: 17 July 2013 – Accepted: 27 August 2013 – Published: 24 October 2013
Abstract. A Rayleigh–Raman lidar system was installed inJanuary 2011 at Syowa Station, Antarctica (69.0◦ S, 39.6◦ E).Polar mesospheric clouds (PMCs) were detected by lidar ataround 22:30 UTC (LT−3 h) on 4 February 2011, which wasthe first day of observation. This was the first detection ofPMCs over Syowa Station by lidar. On the same day, a SuperDual Auroral Radar Network (SuperDARN) HF radar withoblique-incidence beams detected polar mesospheric sum-mer echoes (PMSE) between 21:30 and 23:00 UTC. Thisevent is regarded as the last PMC activity around Syowa Sta-tion during the austral summer season (2010–2011), since noother PMC signals were detected by lidar in February 2011.This is consistent with results of PMC and mesopause tem-perature observations by satellite-born instruments of AIM(Aeronomy of Ice in the Mesosphere)/CIPS (Cloud Imag-ing and Particle Size) and AURA/MLS (Microwave LimbSounder) and horizontal wind measurements taken by a sepa-rate MF radar. Doppler velocity of PMSE observed by the HFradar showed motion toward Syowa Station (westward). Thiswestward motion is consistent with the wind velocities ob-tained by the MF radar. However, the PMSE region showedhorizontal motion from a north-to-south direction during thePMC event. This event indicates that the apparent horizontalmotion of the PMSE region can deviate from neutral winddirections and observed Doppler velocities.
Keywords. Atmospheric composition and structure (middleatmosphere – composition and chemistry) – Ionosphere (Po-lar ionosphere) – Meteorology and atmospheric dynamics(middle atmosphere dynamics)
1 Introduction
Polar mesospheric clouds (PMCs), also known as noctilu-cent clouds (NLCs), are the highest altitude clouds in theEarth’s atmosphere, and are produced at very low temper-atures below the frost point (< 140 K) in the mesopause re-gion. The former term (PMCs) tends to be used for cloudsthat are observed from space, while the latter term (NLCs)represents visible phenomena from the ground. These cloudscan only be observed during the summer season, when thepolar mesopause region is coldest due to an adiabatic coolingcaused by an upwelling motion induced by the global merid-ional circulation, which is driven by gravity wave accelera-tion (Lindzen, 1981). Since occurrences of these clouds arehighly dependent on background conditions (i.e., tempera-ture and mixing ratio of water vapor), PMCs are thoughtto be a possible indicator of Earth’s environmental change.Thus, numerous ground-based observations have been con-ducted via human (visible) observations (e.g., Romejko et al.,2003; Kirkwood et al., 2008), a northern hemispheric net-work of automated cameras (Dalin et al., 2008, 2011; Du-bietis et al., 2011), lidars in both the Northern Hemisphere(Hansen et al., 1989; Gardner et al., 2001; Wickwar et al.,2002; Fiedler et al., 2003; Collins et al., 2003; Thayer etal., 2003; Höffner et al., 2003) and the Southern Hemisphere(Gardner et al., 2001; Chu et al., 2003, 2004, 2006, 2011),and a combination of lidar and an imaging technique (Tay-lor et al., 2009), all of which have been used to analyze theoccurrence and brightness of PMCs and NLCs. Space-born
Published by Copernicus Publications on behalf of the European Geosciences Union.

1794 H. Suzuki et al.: Simultaneous PMC and PMSE observations
41
612
Figure 1. Field of view for the Syowa-East HF radar with a 16-beam coverage (beams 613
numbered as B0, B1, B2, …, B15). Ground ranges from Syowa Station and the 614
Syowa-South HF radar field of view are also indicated with curved dot-dashed lines and 615
black dashed lines, respectively. 616
617
Fig. 1. Field of view for the Syowa-East HF radar with a 16-beamcoverage (beams numbered as B0, B1, B2, . . . , B15). Ground rangesfrom Syowa Station and the Syowa-South HF radar field of view arealso indicated with curved dot-dashed lines and black dashed lines,respectively.
observations via satellites have also made significant ad-vances in the study of PMCs. For example, global satelliteobservations have revealed significant year-to-year variabil-ity (Hervig and Siskind, 2006), hemispheric asymmetry (e.g.,Karlsson et al., 2011), and long-term trends of PMC activity(DeLand et al., 2006). On the other hand, altitude variation,small-scale structure, and local time dependence of PMC ac-tivity, all of which are generally difficult to analyze usingsatellite observations, have been studied mainly with lidardata (references as described above). In addition, a signifi-cant effect of short-period (several hours) gravity waves onPMC activity has been clearly detected by lidar at McMurdoStation (77.8◦ S), Antarctica (Chu et al., 2011).
Polar mesospheric summer echoes (PMSEs), which arestrongly associated with PMCs occurrence, are extensivelystudied by various ground-based radars such as UHF radars(e.g., Nicolls et al., 2009), VHF radars (e.g., Palmer et al.,1996; Hoffmann et al., 1999; Smirnova et al., 2011), MFradars (e.g., Röttger, 1994; Bremer et al., 1996; Liu et al.,2002), and HF radars (Ogawa et al., 2002; Collins et al.,2003; Ramos et al., 2009). A common volume (CV) observa-tion of PMCs and PMSEs was achieved by, for example, vonZahn and Bremer (1999) at sites in the Northern Hemisphere.In the Southern Hemisphere, the first CV observation was re-ported by Klekociuk et al. (2008) at Davis Station (68.6◦ S,78.0◦ E), Antarctica. At Syowa Station (69.0◦ S, 39.6◦ E),Antarctica, PMSE observations have been conducted using
an oblique-incidence Super Dual Auroral Radar Network(SuperDARN) HF radar (e.g., Ogawa et al., 2002; Hosokawaet al., 2004). The first visual NLC at Syowa Station was pho-tographed on 11 February 2009 (Takeda, 2010). At that time,however, there were no ground-based instruments capable ofcontinuously monitoring PMC activity at Syowa Station. Itis evident that the study of the relationship between localdynamics (gravity wave, turbulence, etc.) and behavior ofPMC occurrence combined with PMSE is a very importantsubject in order to understand the physical processes associ-ated with very low mesopause temperatures at high latitudesduring the summer. A Rayleigh lidar was installed at SyowaStation in January 2011 to monitor atmospheric temperaturefrom the upper troposphere to the mesosphere and clouds(polar stratospheric clouds and PMCs) at high altitudes. Inthis study, multiparametric observations using lidar (PMCs),HF radar (PMSEs), and MF radar (horizontal wind velocity)data are presented as the first successful simultaneous PMCand PMSE observation at Syowa Station.
2 Instrumentation
A Rayleigh–Raman lidar for profiling atmospheric tempera-ture up to the mesosphere was developed for Antarctic ob-servations. This lidar had been transported to Syowa Sta-tion by the 52nd Japanese Antarctic Research Expedition(JARE 52), and began operation on 4 February 2011. Themain transmitter is a pulsed Nd:YAG laser (355 nm) with300 mJ pulse energy and 20 Hz repetition frequency, whichemits the beam into the vertical direction with a beam di-vergence of∼ 0.5 mrad. The receiver telescope has an 82 cmdiameter, and three photo multiplier tubes (PMTs) that areused to detect Rayleigh-scattered light from low and highaltitudes at 355 nm and N2 Raman emission at 387 nm. Weanalyzed signals of the most sensitive channel for an elasticscattering (Rayleigh high channel) in order to detect PMCs.The height resolution for this channel is 15 m, and exposuretime is 1 min (1200 shots). Further details and validations ofthis lidar system are described by Suzuki et al. (2012). Inthis study, a PMC signal was deduced by integrating photoncounts over a vertical range of 990 m and a period of 20 minin order for the SNR of the PMC signals of the present eventto be most significantly recognized.
Figure 1 shows field views of two HF radars, calledSyowa-East and Syowa-South, at Syowa Station. Theseradars are part of SuperDARN, and were originally designedfor the study of the ionospheric E- and F-region irregulari-ties (Greenwald et al., 1995). Only data from the Syowa-Eastradar were available for the current study because the Syowa-South radar was under maintenance. The Syowa HF radarsfirst detected PMSE over Syowa Station in 1997 (Ogawa etal., 2002). As shown in Fig. 1, Syowa-East radar’s field ofview consists of 16 narrow beams (beam numbers B0, B1,B2, . . . , B15; beam width∼ 3.3◦) over an azimuth sector of
Ann. Geophys., 31, 1793–1803, 2013 www.ann-geophys.net/31/1793/2013/

H. Suzuki et al.: Simultaneous PMC and PMSE observations 1795
42
618
Figure 2. (a) Count profiles of PMC signals observed by the Rayleigh lidar and (b) a 619
color contour plot of the counts. Each line plot shows integrated counts over 20 min in 620
time (24000 shots) and 990 m in altitude (66 bins). Solid and dotted lines in the upper 621
panel represent zero counts and 1-sigma error levels, respectively. The vertical solid line 622
shown in the lower panel corresponds to the averaged sampling time embedded between 623
both panels.624
Fig. 2. (a)Count profiles of PMC signals observed by the Rayleighlidar and(b) a color contour plot of the counts. Each line plot showsintegrated counts over 20 min in time (24 000 shots) and 990 m inaltitude (66 bins). Solid and dotted lines in the upper panel representzero counts and 1-sigma error levels, respectively. The vertical solidline shown in the lower panel corresponds to the averaged samplingtime embedded between both panels.
52◦. The radar beam pattern in the vertical plane has max-imum sensitivity at elevation angles of 15–35◦ (dependingon radar frequency) with an average half-power beam widthof ∼ 30◦. During the period of the current study, the beamwas sequentially steered from beam B0 to beam B15 withan azimuth step of 3.3◦, a scan repeat time of∼ 50 s, and arange resolution of 30 km. The first range gate and the radarfrequency were set to 60 km and approximately 10.2 MHz,respectively. The beam in the vertical plane at this frequencyhas maximum sensitivity at an elevation angle of∼ 30◦.
The MF radar is a monostatic pulse radar with a peaktransmitting power of 50 kW and an operation frequency of2.4 MHz. This instrument can be used to determine horizon-tal wind velocity (zonal,u; meridional,v) between 60 and90 km in altitude with a sampling interval of 2 km when the Dregion of the ionosphere is not greatly disturbed by geomag-netic activity (e.g., Tsutsumi et al., 2001). In our study, MFradar data are used to estimate the mean background wind ataltitudes of the observed PMC.
Satellite data are also employed in this study to compareour results of PMC occurrence and temperature trends of themesopause over Syowa Station during the austral summerseason between the summer solstice of 2010 and late Febru-ary of 2011. A seasonal variation of the latitudinal depen-dence of PMC activity is analyzed using CIPS (Cloud Imag-ing and Particle Size) nadir (version 4.2) imager’s summarydata (level 3c); the imager is onboard the AIM (Aeronomy
43
625
Figure 3. (a) A photon count profile of data integrated between 22:19 and 22:39 UTC. 626
The signal is corrected by multiplying z (altitude) squared to raw count data. The 627
vertical solid and dotted lines indicate zero counts and a 1-sigma error level, 628
respectively. The gray solid curve shows estimated Rayleigh signals. (b) Backscatter 629
ratio (BSR) between 80 and 90 km in altitude. The curved dotted lines show 1-sigma 630
error of BSR. The two vertical lines show variability of an estimated Rayleigh signal 631
relative to 1.0. 632
633
Fig. 3. (a)A photon count profile of data integrated between 22:19and 22:39 UTC. The signal is corrected by multiplyingz (altitude)squared to raw count data. The vertical solid and dotted lines indi-cate zero counts and a 1-sigma error level, respectively. The graysolid curve shows estimated Rayleigh signals.(b) Backscatter ratio(BSR) between 80 and 90 km in altitude. The curved dotted linesshow 1-sigma error of BSR. The two vertical lines show variabilityof an estimated Rayleigh signal relative to 1.0.
of Ice in the Mesosphere) satellite (Russell III et al., 2008;McClintock et al., 2009). Atmospheric temperature and hu-midity (H2O) at PMC altitudes near Syowa Station are an-alyzed using MLS (Microwave Limb Sounder) (version 3.3)data; this instrument is onboard the AURA satellite (Schwarzet al., 2008).
3 Results
Operation of the lidar system at Syowa Station began on4 February 2011. Observations were conducted only duringsolar midnight on clear or partially cloudy nights in Febru-ary 2011. Weather conditions, minimum solar elevation an-gles, and operation times in February 2011 are briefly sum-marized in Table 1. Among the seven days of observations, aPMC signal was detected only on the first day of observation(4 February 2011).
Figure 2 shows photon counts represented as (a) line plotsand a (b) color contour plot, observed using the Rayleighhigh channel of the Rayleigh lidar on 4 February 2011, andintegrated over 20 min in time (24 000 shots) and 990 m inaltitude (66 bins). Note that the sky background, determinedas an average photon count between 90 and 150 km in alti-tude, is not shown in Fig. 2. The dotted lines in the upperpanel show an error standard deviation. The vertical solidlines in the lower panel correspond to centers of samplingtimes. Signals larger than the background level by more thanone standard error level are seen in profiles at 21:48 UTC and22:29 UTC around altitudes of 86–87 km. In particular, theprofile at 22:29 UTC shows clearer features, which is con-sidered to be due to the presence of PMCs. Thus, PMC fea-tures at this time are discussed in the following analysis. The
www.ann-geophys.net/31/1793/2013/ Ann. Geophys., 31, 1793–1803, 2013
1796 H. Suzuki et al.: Simultaneous PMC and PMSE observations
44
6
34
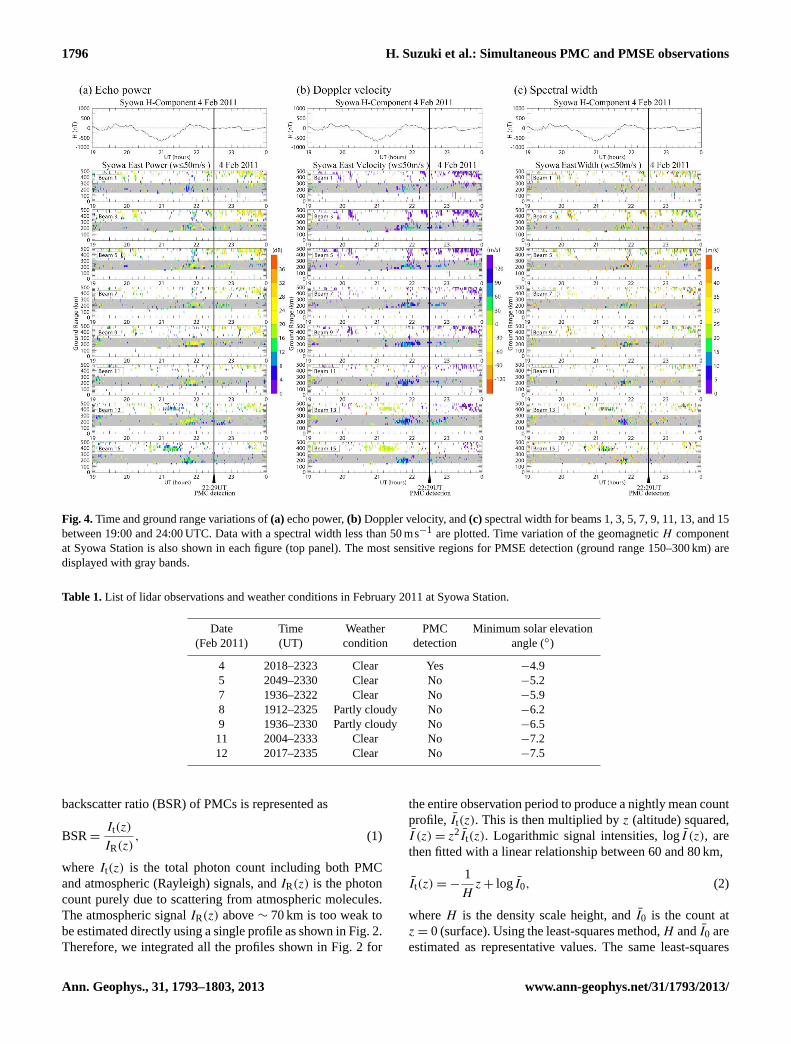
Fig. 4.Time and ground range variations of(a) echo power,(b) Doppler velocity, and(c) spectral width for beams 1, 3, 5, 7, 9, 11, 13, and 15between 19:00 and 24:00 UTC. Data with a spectral width less than 50 ms−1 are plotted. Time variation of the geomagneticH componentat Syowa Station is also shown in each figure (top panel). The most sensitive regions for PMSE detection (ground range 150–300 km) aredisplayed with gray bands.
Table 1.List of lidar observations and weather conditions in February 2011 at Syowa Station.
Date Time Weather PMC Minimum solar elevation(Feb 2011) (UT) condition detection angle (◦)
4 2018–2323 Clear Yes −4.95 2049–2330 Clear No −5.27 1936–2322 Clear No −5.98 1912–2325 Partly cloudy No −6.29 1936–2330 Partly cloudy No −6.511 2004–2333 Clear No −7.212 2017–2335 Clear No −7.5
backscatter ratio (BSR) of PMCs is represented as
BSR=It(z)
IR(z), (1)
whereIt(z) is the total photon count including both PMCand atmospheric (Rayleigh) signals, andIR(z) is the photoncount purely due to scattering from atmospheric molecules.The atmospheric signalIR(z) above∼ 70 km is too weak tobe estimated directly using a single profile as shown in Fig. 2.Therefore, we integrated all the profiles shown in Fig. 2 for
the entire observation period to produce a nightly mean countprofile, It(z). This is then multiplied byz (altitude) squared,I (z) = z2It(z). Logarithmic signal intensities, logI (z), arethen fitted with a linear relationship between 60 and 80 km,
It(z) = −1
Hz + logI0, (2)
whereH is the density scale height, andI0 is the count atz = 0 (surface). Using the least-squares method,H andI0 areestimated as representative values. The same least-squares
Ann. Geophys., 31, 1793–1803, 2013 www.ann-geophys.net/31/1793/2013/

H. Suzuki et al.: Simultaneous PMC and PMSE observations 1797
46
642
Figure 5. Two-dimensional plots for time variation of echo power (with a spectral width 643
smaller than 50 m/s) during 21:09:25 – 23:00:54 UTC. Location of Syowa Station, radar 644
field of view and ground ranges are indicated in the top left panel. The most sensitive 645
regions for PMSE detection (ground range 150-300 km) are displayed with a gray band. 646
647
Fig. 5. Two-dimensional plots for time variation of echo power (with a spectral width smaller than 50 ms−1) between 21:09:25 and23:00:54 UTC. Location of Syowa Station, radar field of view, and ground ranges are indicated in the top left panel. The most sensitiveregions for PMSE detection (ground range 150–300 km) are displayed with a gray band.
fitting technique is then applied to each signal profile aver-aged over 20 min in time and 990 m in altitude, withH fixedto the value determined by the fitting to the nightly average,and the height for fitting is restricted to a range between 60and 70 km. The atmospheric signal,IR(z), for each time isthen estimated using the relationshipIR(z) = I ′
0exp(−z/H),
whereI ′
0 is the estimated parameter corresponding toI0 inEq. (2). EstimatedIR(z) and observedIt(z) between 22:19and 22:39 UTC are shown in Fig. 3a. The vertical solid lineindicates zero counts, and the two dotted lines indicate a 1-sigma error level when counts= 0. Estimated atmosphericsignals are plotted by a gray solid line. Figure 3b shows BSRbetween 80 and 90 km derived using Eq. (1). Peak altitude(zc) and BSR at 22:29 UTC are 86.6± 0.5 km and 4± 2, re-spectively.
PMSE were detected using the Syowa-East HF radar (seeFig. 1) on the same day. Figure 4 shows time and groundrange variations of (a) echo power, (b) Doppler velocity, and(c) spectral width on beams B1, B3, B5, B7, B9, B11, B13,and B15 between 19:00 and 24:00 UTC. Positive (negative)Doppler velocity (Fig. 4b) values indicate motion towards(away from) the radar site. The gray bands in each plot cor-respond to a ground range between 150 and 300 km. Thisregion is most sensitive for PMSE detection when using afield view of a HF radar (Ogawa et al., 2002). A time varia-tion of the geomagnetic horizontal (H ) component at SyowaStation is also plotted in each figure. TheH component var-ied between 19:00 and 24:00 UTC, resulting in detection of
strong radar echoes from E-region field-aligned irregularities(E-FAI) in addition to echoes from the upper mesosphere. Inorder to exclude possible E-FAI echoes that exist at a simi-lar range to mesospheric echoes (150–300 km) and to extractechoes from the upper mesosphere, only data with a spec-tral width smaller than 50 ms−1 were selected and plottedin Fig. 4, since E-FAI echoes have a much larger spectralwidth (typically > 100 ms−1). It is known that PMSE ap-pearing during quiet geomagnetic conditions have spectralwidths smaller than 50 ms−1 (Ogawa et al., 2002, 2003a, b).
In Fig. 4, PMSE with maximum echo powers of about30 dB are clearly observed at ground ranges around 200 kmbetween 21:30 and 23:00 UTC for all beams. Echoes atother times or at ranges beyond 300 km are possibly dueto E- and/or F-FAI echoes with spectral widths smaller than50 ms−1. The appearance of PMSE at around 200 km for allbeams is consistent with the results of Ogawa et al. (2002)and Hosokawa et al. (2005). All Doppler velocities of PMSEin Fig. 4b are positive, and therefore westward (see Fig. 1).
Figure 5 displays time variation (every∼ 10 min) of thetwo-dimensional echo power map between 21:19:31 and23:00:54 UTC for echoes with spectral widths smaller than50 ms−1. The radar field of view and ground ranges areshown in the upper-left panel. The most sensitive regionsfor PMSE detection (ground range 150–300 km) are indi-cated with a gray band, as in Fig. 4. Echoes at ranges far be-yond 300 km are mainly due to E- and/or F-FAI with narrowspectral widths.
www.ann-geophys.net/31/1793/2013/ Ann. Geophys., 31, 1793–1803, 2013

1798 H. Suzuki et al.: Simultaneous PMC and PMSE observations
47
648
Figure 6. (a) Color contour of mean cloud albedo measured by AIM/CIPS. This shows 649
daily averaged cloud albedos within a longitudinal range of 39.6°±45.0° and within a 650
latitudinal range of 60S° to 85S° in 5.0° increments with 5.0° variations (i.e., 60S°±5°, 651
Fig. 6. (a) Color contour of mean cloud albedo measured byAIM/CIPS. This shows daily averaged cloud albedos within a lon-gitudinal range of 39.6◦ ± 45.0◦ and within a latitudinal range of60 to 85◦ S in 5.0◦ increments with 5.0◦ variations (i.e., 60◦ ±5◦ S,65◦
± 5◦, . . . , 85◦ ± 5◦). (b) Mesospheric temperature plot for themesopause region (0.0046 hPa in pressure,∼ 85 km in altitude)measured by AURA/MLS satellite instruments. Each plus symbolcorresponds to one sounding taken over a tangential point within250 km of Syowa Station for each swath. If more than three datapoints satisfy this 250 km distance from Syowa Station, data of theclosest point is plotted. The green diamonds the show frost point,Tfrost. (c) Daily mean horizontal winds averaged between 84 and86 km observed with the MF radar at Syowa Station. Black andred solid lines show zonal and meridional winds, respectively. Boldlines show smoothed winds using the Hanning window with a fullwidth of 28 days. Vertical background lines for each panel show thenights with lidar observation at Syowa Station.
The possible relationship between PMCs and PMSE ob-served during this event is discussed in the following section.
4 Discussion
Statistical results of lidar observations over three summerseasons, between the end of 2002 and early 2005, at RotheraStation (67.5◦ S, 68.0◦ W) suggest the mean altitude ofPMCs is 84.12± 0.21 km (Chu et al., 2006). Simultaneousobservations of PMCs and PMSE during one austral summer
from 2005 to 2006 were conducted at Davis Station (68.6◦ S,78.0◦ E), and the results suggest a mean PMC and PMSE alti-tude of 83.97±0.10 km (standard deviation,σ = 1.0 km) and85.31±0.14 km (σ = 1.3 km), respectively (Klekociuk et al.,2008). Recently, the mean PMC altitude at Davis Station wasdeduced by using a longer period in the data set (2001 to2009), and shows a very similar value of 83.97± 0.07 km(σ = 2.71 km) (Kaifler et al., 2013). Results from anotherAntarctic station (Wasa, 73.1◦ S, 13.4◦ W) using VHF radaralso show that the peak occurrence rate of PMSE appears ataround 85 km (Kirkwood et al., 2007). The altitude of thePMC, zc = 86.6 km, observed at Syowa Station, as shownin Fig. 3, is slightly higher than the above-mentioned previ-ous lidar observations conducted at southern high latitudessimilar to Syowa Station. The peak BSR of the PMC for thepresent case was 4±2. Chu et al. (2006) also reported a meanpeak BSR of a PMC observed over Rothera Station; BSR=
17.8± 0.64 (σ = 7.3) at an operating wavelength (374 nm)of their iron Boltzmann lidar. To compare this value withour result, the dependence on wavelength for the backscat-tering coefficients by both atmospheric molecules (βR) andthe PMC (βpmc) should be taken into account. This correc-tion is expressed as follows:
BSR355 =
(β374,R
β355,R
)(β355,PMC
β374,PMC
)(BSR374− 1) + 1. (3)
The ratio of the backscattering coefficients of the PMC attwo wavelengths (β355,pmc/β374,pmc) is referred to as the“color ratio” and is about 1.1 for this wavelength combina-tion (Baumgarten et al., 2007; Höffner et al., 2003). The ratioof the backscattering coefficients of the Rayleigh scatteringcan be estimated as (β374,R/β355,R) =(355/374)4 ∼ 0.8 by itsλ−4 dependence. Thus, the correction to convert the BSRat 374 nm to the BSR at 355 nm is expressed as BSR355 =
0.8× 1.1× (BSR374− 1) + 1. If BSR374 is set to 17.8, thenBSR355 is calculated as 15.8. Therefore, the observed BSR(BSR= 4) by our lidar was very weak relative to the resultsby Chu et al. (2006), even if this effect is taken into account.
As shown in Table 1, PMCs were only detected on4 February 2011 over Syowa Station. Figure 6a showsmean cloud albedo and (b) mesospheric temperatures of themesopause regions (0.0046 hPa in pressure,∼ 85 km in alti-tude) observed by AIM/CIPS and AURA/MLS satellite in-struments. The green diamonds in Fig. 6b indicate the frostpoint,Tfrost, estimated by using Aura humidity values (H2O)and a formula of saturation pressure of water vapor over ice(Stevens et al., 2001) at an altitude of 0.0046 hPa (∼ 85 km).The PMC albedo shown in Fig. 6a is the daily averagedvalue within a longitudinal range of 39.6◦
±45.0◦ and withina latitudinal range of 60 to 85◦ S in 5.0◦ increments with5.0◦ variations (i.e., 60◦ S±5◦, 65◦
±5◦, . . . , 85◦±5◦). Eachsymbol (plus) in Fig. 6b corresponds to a single soundingtaken over a tangential point within 250 km of Syowa Sta-tion (69.0± 2.3◦ S, 39.5± 6.4◦ E) for each swath. Verticallines indicate nights with lidar observation at Syowa Station,
Ann. Geophys., 31, 1793–1803, 2013 www.ann-geophys.net/31/1793/2013/

H. Suzuki et al.: Simultaneous PMC and PMSE observations 1799
of which only on 4 February 2011 (thick line) was a PMCdetected. Figure 6a shows a reduction of the PMC region athigher latitudes in February. PMC activity near the latitude ofSyowa Station continued until about 45 to 50 days after thesummer solstice, and did not occur again after this period.Temperatures around PMC altitudes (∼ 85 km), as shown inFig. 6b, gradually increased from day 40 to 70. The range oftemperature variation was 140–170 K and 150–180 K beforeand after 4 February 2011, respectively. In other words, thetemperature sometimes reached below frost point (∼ 145 K)on the day before 4 February 2011. However, the temperatureafter the day is greater than 155 K (> Tfrost). Daily mean hor-izontal winds averaging around 85.0±3.0 km in altitude wereobserved with the MF radar at Syowa Station, and are shownin Fig. 6c. The meridional wind (red solid line) changed fromnorthward to southward five days after the PMC event, im-plying background temperature above Syowa Station shiftedfrom that of a cold summer to a warm winter during this pe-riod. Both trends shown by satellite temperature data and MFradar wind data are consistent with the PMC observation.
The atmospheric temperature during the lidar observationperiod (4–11 February 2011) did not show any drastic varia-tion, and did not descend belowTfrost. However, PMCs wereonly detected on the night of 4 February 2011. This factimplies that small-scale disturbances in temperature fieldscaused by atmospheric gravity waves or other local phe-nomena play an important role on PMC activity, since MLStemperature data are not sampled completely in CV. An-other possibility is that a decrease in equatorward wind re-duces the transportation of PMCs from higher latitude re-gions where PMCs are still actively formed. The PMC de-tected over Syowa Station on 4 February 2011 is thought tobe the last observation at the end season of PMC activityaround Syowa Station. A relationship between backgroundwinds using MF radar data, temperature using AURA/MLSdata, and PMSE occurrence using VHF radar data at DavisStation between 2004 and 2005 (Morris et al., 2007) was verysimilar to the present case.
The PMSE shown in Figs. 4 and 5 were detected to theeast of Syowa Station, since the sampling region of theHF radar, which has wide azimuth coverage (52◦), was di-rected towards geographical east as shown in Fig. 1. Onthe other hand, lidar detected backscatter from the zenith ofSyowa Station. Thus, both instruments did not observe a CV,contrary to the case of Klekociuk et al. (2008), who usedboth Rayleigh lidar and VHF radar. However, our oblique-incidence HF radar could detect a two-dimensional distribu-tion and motion of PMSE regions in wide areas (Ogawa etal., 2002).
Figure 7 shows color contour plots of 10 min averagedzonal (u, upper panel) and meridional (v, lower panel) windsobserved by the Syowa Station MF radar. The white verticaland horizontal lines show the time (22:29 UTC) and peak al-titude (86.6 km) of PMC occurrence, respectively, taken fromFig. 3. The zonal winds’ directions around the PMC altitude
49
663
Figure 7. Color contour plots of 10 min averaged zonal (u, upper panel) and meridional 664
(v, lower panel) wind observed by the MF radar. White vertical and horizontal lines 665
indicate the time (22:29 UTC) and peak altitude of the PMC (86.6 km) observed by 666
lidar as shown in Figure 3. 667
668
Fig. 7. Color contour plots of 10 min averaged zonal (u, up-per panel) and meridional (v, lower panel) wind observed by theMF radar. White vertical and horizontal lines indicate the time(22:29 UTC) and peak altitude of the PMC (86.6 km) observed bylidar as shown in Fig. 3.
between 21:30 and 23:00 UTC (see Fig. 4) were mostly west-ward with an amplitude of 10–40 ms−1. This westward winddirection is consistent with positive (toward Syowa Station)Doppler velocities of PMSE (Fig. 4b). However, Dopplervelocities near ground ranges of∼ 200 km between 21:30and 23:00 UTC were very large, and sometimes exceeded+100 ms−1. In addition, these velocities are a projectiononto the radar coverage, and therefore can be larger whenDoppler velocity is converted to horizontal velocity in mostcases. It is reported that Doppler velocity of PMSE agreeswell with neutral wind observed by MF radar under quiet ge-omagnetic conditions (Ogawa et al., 2004). In general, mo-tion of plasma irregularities causing PMSE is controlled byboth neutral wind and the background ionospheric electricfield. As shown in Fig. 4, when the PMSE were observed, amedium-scale geomagnetic storm was in progress, suggest-ing that the irregularity motion was more affected by theelectric field. Thus, the quantitative inconsistency betweenHF radar Doppler velocity and MF radar neutral wind mea-surements can be explained by an electric field caused by ageomagnetic storm.
In addition, the PMSE region showed horizontal motionfrom north to south between 21:39 and 22:20 UTC. Fig-ure 8 shows strong echo regions with echo power greater
www.ann-geophys.net/31/1793/2013/ Ann. Geophys., 31, 1793–1803, 2013

1800 H. Suzuki et al.: Simultaneous PMC and PMSE observations
50
669
Figure 8. Spatiotemporal variation of the strong echo region (>20dB) for the ground 670
range between 150 and 300 km. The wind vector at the PMC altitude (86.6km) scaled 671
by the distance of wind advection for one hour is also shown. 672
673
Fig. 8.Spatiotemporal variation of the strong echo region (> 20 dB)for the ground range between 150 and 300 km. The wind vector atthe PMC altitude (86.6 km) scaled by the distance of wind advectionfor one hour is also shown.
than 20 dB. This clearly indicates a southward motion ofthe PMSE region. The horizontal neutral wind velocity atthe PMC altitude (zc = 86.6 km) obtained by MF radar isalso shown in the bottom-right corner of Fig. 8. The hori-zontal wind greatly differed from the apparent motion of theecho region. According to a statistical study by Klekociuket al. (2008), the mean altitude of PMSE is 85.31± 0.14 km(σ = 1.3 km) at Davis Station. However, the neutral windsmeasured by the MF radar (Fig. 7) show no large wind shearnear the PMC altitude within such a range. Thus, the direc-tion of the apparent motion of the PMSE region was quite dif-ferent from that of the neutral wind during this event. PMSEpower is also perturbed by atmospheric waves (Huaman andKelley, 2002) as well as PMCs (Chandran et al., 2010; Chu etal., 2011; Kaifler et al., 2013). Recently, Dalin et al. (2012)showed that the variability of the PMSE layer is also con-trolled by the ice number density and its height gradient, in-duced by wave-induced perturbations and turbulent energydissipation. Thus, the horizontal displacement of the strongecho region is also likely due to a propagation of atmosphericgravity waves. A detailed study of ionospheric disturbanceand atmospheric wave effects on PMSE Doppler velocity andpower will be an objective in future work.
The origin of the observed PMC and PMSE is thoughtto be strongly related to each another. Electron density ir-regularities due to charged ice particles induce PMSE, andgrown water–ice sediment from PMSE altitudes is detectedas PMC (Reid, 1990; Lübken et al., 1998; von Zhan and Bre-
mer, 1999; Rapp and Lübken, 2004). The present case alsosupports a strong relationship between PMCs and PMSE, al-though more data and CV observations are needed to studythe detailed physical processes.
A powerful VHF MST radar, with 500 kW output powerand 18 000 m2 antenna aperture, called PANSY (Program ofthe Antarctic Syowa MST/IS) radar, was installed at SyowaStation in 2011. The research observation by PANSY startedin late April of 2012 with∼ 25 % full antenna system op-eration. PANSY can be a powerful tool for PMSE studyin addition to other radars. This radar system can be oper-ated as an imaging radar that can resolve the 3-D structureof PMSE over Syowa Station. Detailed multiparameter ob-servations of PMC and PMSE using lidar, SuperDARN HFradar, MF radar, and PANSY are expected to be objectives infuture work.
5 Conclusion
Simultaneous observations of PMCs and PMSE using aRayleigh–Raman lidar system and a SuperDARN HF radarwere conducted on 4 February 2011, at Syowa Station,Antarctica. This is the first detection of PMCs via lidar atSyowa Station. Estimated BSR and peak altitude of a PMCat 22:29 UTC were 4±2 and 86.6±0.5 km, respectively. Li-dar observations after this date did not detect any PMC sig-nals. AIM/CIPS satellite data also showed weaker activitiesof PMC around the latitude of Syowa Station after this event.In addition, AURA/MLS satellite data showed a phase ofincreased atmospheric temperature at PMC altitudes aroundthis date. The temperature sometimes reached below the frostpoint (Tfrost) on the days before 4 February 2011. However,the temperature after the day is greater than that level. Thus,the PMC detected on 4 February 2011 is regarded as the lastobservation near the end of the PMC season for latitudes sim-ilar to Syowa Station during the austral summer from 2010to 2011.
Zonal winds near the PMC altitude during this event weremostly westward with an amplitude of 10–40 ms−1. Thewestward wind direction is consistent with the positive (to-ward Syowa Station) Doppler velocities of PMSE using theHF radar. However, the PMSE echo region showed south-ward horizontal motion during this period. This suggests thathorizontal variation of the PMSE region is not simply con-trolled by neutral background wind but instead by other ef-fects, such as an electric field or vertical displacement due toatmospheric waves. Detailed multiparametric and CV obser-vations of PMC and PMSE using lidar and PANSY radar areexpected to solve these problems in the future.
Acknowledgements.This work was supported by JSPS Grant-in-Aid for Scientific Research (B) (grant number 24340121), Grant-in-Aid for Young Scientists (B) (grant number 25800276) andKP-2 project of National Institute of Polar Research. The Syowa
Ann. Geophys., 31, 1793–1803, 2013 www.ann-geophys.net/31/1793/2013/

H. Suzuki et al.: Simultaneous PMC and PMSE observations 1801
Rayleigh–Raman lidar, the HF radar, and the MF radar are operatedby Japanese Antarctic Research Expedition (JARE). The authorsacknowledge the support from the Aura and AIM projects as wellas the MLS and CIPS teams for making the temperature and cloudimaging data available.
Topical Editor C. Jacobi thanks three anonymous referees fortheir help in evaluating this paper.
References
Baumgarten, G., von Cossart, G., and Fiedler, J.: The size of noc-tilucent cloud particles above ALOMAR (69 N, 16 E): Opticalmodeling and method description, Adv. Space Res., 40, 772–784,doi:10.1016/j.asr.2007.01.018, 2007.
Bremer, J., Hoffmann, P., Manson, A. H., Meek, C. E., Rüster, R.,and Singer, W.: PMSE observations at three different frequen-cies in northern Europe during summer 1994, Ann. Geophys.,14, 1317–1327, doi:10.1007/s00585-996-1317-7, 1996.
Chandran, A., Rusch, D. W., Merkel, A. W., Palo, S. E., Thomas,G. E., Taylor, M. J., Bailey, S. M., and Russell III, J. M.: Po-lar mesospheric cloud structures observed from the cloud imag-ing and particle size experiment on the Aeronomy of Ice in theMesosphere spacecraft: Atmospheric gravity waves as drivers forlongitudinal variability in polar mesospheric cloud occurrence, J.Geophys. Res., 115, D13102, doi:10.1029/2009JD013185, 2010.
Chu, X., Gardner, C. S., and Roble, R. G.: Lidar studies ofinterannual seasonal and diurnal variations of polar meso-spheric clouds at the South Pole, J. Geophys. Res., 108, 8447,doi:10.1029/2002JD002524, 2003.
Chu, X., Nott, G. J., Espy, P. J., Gardner, C. S., Diettrich, J. C., Clil-verd, M. A., and Jarvis, M. J.: Lidar observations of polar meso-spheric clouds at Rothera, Antarctica (67.5 S, 68.0 W), Geophys.Res. Lett., 31, L02114, doi:10.1029/2003GL018638, 2004.
Chu, X., Espy, P. J., Nott, G. J., Diettrich, J. C., and Gardner, C.S.: Polar mesospheric clouds observed by an iron Boltzmann li-dar at Rothera (67.5 S, 68.0 W), Antarctica from 2002 to 2005:Properties and implications, J. Geophys. Res., 111, D20213,doi:10.1029/2006JD007086, 2006.
Chu, X., Huang, W., Fong, W., Yu, Z., Wang, Z., Smith,J. A., and Gardner, C. S.: First lidar observations of po-lar mesospheric clouds and Fe temperatures at McMurdo(77.8◦ S, 166.7◦ E), Antarctica, Geophys. Res. Lett., 38, L16810,doi:10.1029/2011GL048373, 2011.
Collins, R. L., Kelley, M. C., Nicolls, M. J., Ramos, C., Hou,T., Stern, T. E., Mizutani, K., and Itabe, T.: Simultane-ous lidar observations of a noctilucent cloud and an internalwave in the polar mesosphere, J. Geophys. Res., 108, 8435,doi:10.1029/2002JD002427, 2003.
Dalin, P., Pertsev, N., Zadorozhny, A., Connors, M., Schofield,I., Shelton, I., Zalcik, M.,McEwan, T., McEachran, I., Frand-sen, S., Hansen, O., Andersen, H., Sukhodoev, V., Perminov,V., and Romejko, V.: Ground-based observations of noctilu-cent clouds with a Northern Hemisphere network of automaticdigital cameras, J. Atmos. Solar-Terr. Phys., 70, 1460–1472,doi:10.1016/j.jastp.2008.04.018, 2008.
Dalin, P., Pertsev, N., Dubietis, A., Zalcik, M., Zadorozhny, A.,Connors, M., Schofield, I., McEwan, T., McEachran, I., Frand-sen, S., Hansen, O., Andersen, H., Sukhodoev, V.,Perminov,V., Balciunas, R., and Romejko, V.: A comparison between
ground-based observations of noctilucent clouds and Aurasatellite data, J. Atmos. Sol-Terr. Phys., 73, 2097–2109,doi:10.1016/j.jastp.2011.01.020, 2011.
Dalin, P., Kirkwood, S., Hervig, M., Mihalikova, M., Mikhaylova,D., Wolf, I., and Osepian, A.: Wave influence on polar meso-sphere summer echoes above Wasa: experimental and modelstudies, Ann. Geophys., 30, 1143–1157, doi:10.5194/angeo-30-1143-2012, 2012.
DeLand, M. T., Shettle, E. P., Thomas, G. E., and Olivero, J. J.:A quarter-century of satellite PMC observations, J. Atmos. Sol.Terr. Phys., 68, 9–29, 2006.
Dubietis, A., Dalin, P., Balciunas, R., Cernis, K., Pertsev, N., Sukho-doev, V., Perminov, V., Zalcik, M., Zadorozhny, A., Connors, M.,Schofield, I., McEwan, T., McEachran, I., Frandsen, S., Hansen,O., Andersen, H., Grönne, J., Melnikov, D., Manevich, A., andRomejko, V.: Noctilucent clouds: modern ground-based photo-graphic observations by a digital camera network, Appl. Optics,50, F72–F79, doi:10.1364/AO.50.000F72, 2011.
Fiedler, J., Baumgarten, G., and von Cossart, G.: Noctilucent cloudsabove ALOMAR between 1997 and 2001: Occurrence and prop-erties, J. Geophys. Res., 108, 8453, doi:10.1029/2002JD002419,2003.
Gardner, C. S., Papen, G. C., Chu, X., and Pan, W.: First lidar ob-servations of middle atmosphere temperatures, Fe densities, andpolar mesospheric clouds over the North and South poles, Geo-phys. Res. Lett., 28, 1199–1202, 2001.
Greenwald, R. A., Baker, K. B., Dudeney, J. R., Pinnock, M., Jones,T. B., Thomas, E. C., Villain, J.-P., Cerisier, J. -C., Senior, C.,Hanuise, C., Hunsucker, R. D., Sofko, G., Koehler, J., Nielsen,E., Pellinen, R., Walker, A. D. M., Sato, N., and Yamagishi, H.:DARN/SuperDARN: A global view of the dynamics of highlati-tude convection, Space Sci. Rev., 71, 761–796, 1995.
Hansen, G., Serwazi, M., and von Zahn, U.: First detection of anoctilucent cloud by lidar, Geophys. Res. Lett., 16, 1445–1448,1989.
Hervig, M. and Siskind, D. E.: Decadal and inter-hemispheric vari-ability in polar mesospheric clouds, water vapor, and tempera-ture, J. Atmos. Sol. Terr. Phys., 68, 30–41, 2006.
Hoffmann, P., Singer, W., and Bremer, J.: Mean seasonal and diurnalvariations of PMSE and winds from 4 years of radar observationsat ALOMAR, Geophys. Res. Lett., 26, 1525–1528, 1999.
Höffner, J., Fricke-Begemann, C., and Lübken, F.-J.: First obser-vations of noctilucent clouds by lidar at Svalbard, 78◦ N, At-mos. Chem. Phys., 3, 1101–1111, doi:10.5194/acp-3-1101-2003,2003.
Hosokawa, K., Ogawa, T., Yukimatu, A. S., Sato, N., and Iyemori,T.: Statistics of Antarctic mesospheric echoes observed with theSuperDARN Syowa Radar, Geophys. Res. Lett., 31, L02106,doi:10.1029/2003GL018776, 2004.
Hosokawa, K., Ogawa, T., Arnold, N. F., Lester, M., Sato, N.,and Yukimatu, A. S.: Extraction of polar mesosphere summerechoes from SuperDARN data, Geophys. Res. Lett., 32, L12801,doi:10.1029/2005GL022788, 2005.
Huaman, M. M. and Kelley, M. C.: Mesosphere: Polar SummerMesopause, in: Encyclopedia of Atmospheric Science, ElsevierScience, 2171–1279, 2002.
Kaifler, N., Baumgarten, G., Klekociuk, A. R., Alexander, S. P.,Fiedler, J., and Lübken, F.-J.: Small scale structures of NLC
www.ann-geophys.net/31/1793/2013/ Ann. Geophys., 31, 1793–1803, 2013

1802 H. Suzuki et al.: Simultaneous PMC and PMSE observations
observed by lidar at 69◦ N/69◦ S and their possible relation togravity waves, J. Atmos. Sol. Terr. Phys, in press, 2013.
Karlsson, B., Randall, C. E., Shepherd, T. G., Harvey, V. L.,Lumpe, J., Nielsen, K., Bailey, S. M., Hervig, M., and Rus-sell III, J. M.: On the seasonal onset of polar mesosphericclouds and the breakdown of the stratospheric polar vortexin the Southern Hemisphere, J. Geophys. Res., 116, D18107,doi:10.1029/2011JD015989, 2011.
Kirkwood, S., Wolf, I., Nilsson, H., Dalin, P., Mikhaylova, D., andBelova, E.: Polar mesosphere summer echoes at Wasa, Antarctica(73◦ S): First observations and comparison with 68◦ N, Geophys.Res. Lett., 34, L15803, doi:10.1029/2007GL030516, 2007.
Kirkwood, S., Dalin, P., and Réchou, A.: Noctilucent clouds ob-served from the UK and Denmark – trends and variations over43 years, Ann. Geophys., 26, 1243–1254, doi:10.5194/angeo-26-1243-2008, 2008.
Klekociuk, A. R., Morris, R. J., and Innis, J. L.: First SouthernHemisphere common-volume measurements of PMC and PMSE,Geophys. Res. Lett., 35, L24804, doi:10.1029/2008GL035988,2008.
Lindzen, R. S.: Turbulence and stress owing to gravity wave andtidal breakdown., J. Geophys. Res., 86, 9707–9714, 1981.
Liu, J. Y., Pan, C. J., and Lee, C. C.: VHF radar and MF/HF dy-nasonde observations during polar mesosphere summer echoesconditions at EISCAT, Earth Planets Space, 54, 691–698, 2002.
Lübken, F.-J., Rapp, M., Blix, T., and Thrane, E.: Microphysical andturbulent measurements of the Schmidt number in the vicinity ofpolar mesosphere summer echoes, Geophys. Res. Lett., 25, 893–896, 1998.
McClintock, W. E., Rusch, D. W., Thomas, G. E., Merkel, A. W.,Lankton, M. R., Drake, V. A., Bailey, S. M., and Russell III,J. M.: The cloud imaging and particle size experiment on theAeronomy of Ice in the Mesosphere mission: Instrument con-cept, design, calibration, and on-orbit performance, J. Atmos,2009.
Morris, R. J., Murphy, D. J., Klekociuk, A. R., and Holdsworth, D.A.: First complete season of PMSE observations above Davis,Antarctica, and their relation to winds and temperatures, Geo-phys. Res. Lett., 34, L05805, doi:10.1029/2006GL028641, 2007.
Nicolls, M. J., Kelley, M. C., Varney, R. H., and Heinselman, C.J.: Spectral observations of polar mesospheric summer echoes at33 cm (350 MHz) with PFISR, J. Atmos. Solar-Terr. Phys., 71,662–674, 2009.
Ogawa, T., Nishitani, N., Sato, N., Yamagishi, H., and Yukimatu,A. S.: Upper mesosphere summer echoes detected with theAntarctic Syowa HF radar, Geophys. Res. Lett., 29, 61-1–61-4,doi:10.1029/2001GL014094, 2002.
Ogawa, T., Arnold, N. F., Kirkwood, S., Nishitani, N., and Lester,M.: Finland HF and Esrange MST radar observations of po-lar mesosphere summer echoes, Ann. Geophys., 21, 1047–1055,doi:10.5194/angeo-21-1047-2003, 2003a.
Ogawa, T., Hosokawa, K., Nishitani, N., Sato, N., Yamagishi, H.,and Yukimatu, A. S.: Characteristics of polar mesosphere sum-mer echoes observed with oblique incidence HF radars at SyowaStation, Adv. Polar Upper Atmos. Res., 17, 13–29, 2003b.
Ogawa, T., Nozawa, S., Tsutsumi, M., Arnold, N. F., Nishitani,N., Sato, N., and Yukimatu, A. S.: Arctic and Antarctic po-lar mesosphere summer echoes observed with oblique inci-dence HF radars: analysis using simultaneous MF and VHF
radar data, Ann. Geophys., 22, 4049–4059, doi:10.5194/angeo-22-4049-2004, 2004.
Palmer, J. R., Rishbeth, H., Jones, G. O. L., and Williams, P. J. S.:A statistical study of polar mesosphere summer echoes observedby EISCAT, J. Atmos. Terr. Phys., 58, 307–315, 1996.
Ramos, C., Kelley, M. C., Djuth, F. T., Groves, K. M., Murayama,Y., Kawamura, S., and Thorsen, D.: Multifrequency observationsof Polar Mesosphere Summer Echoes using Alaskan radar fa-cilities: Comparisons and scattering calculations, Radio Sci., 44,RS5011, doi:10.1029/2008RS004102, 2009.
Rapp, M. and Lübken, F.-J.: Polar mesosphere summer echoes(PMSE): Review of observations and current understanding, At-mos. Chem. Phys., 4, 2601–2633, doi:10.5194/acp-4-2601-2004,2004.
Reid, G. C.: Ice particles and electron “bite-outs” at the summerpolar mesopause, J. Geophys. Res., 95, 13891–13896, 1990.
Romejko, V. A., Dalin, P. A., and Pertsev, N. N.: Fortyyears of noctilucent cloud observations near Moscow:database and simple statistics, J. Geophys. Res., 108, 8443,doi:10.1029/2002JD002364, 2003.
Röttger, J.: Polar mesosphere summer echoes: Dynamics and aeron-omy of the mesosphere, Adv. Space Res., 14, 123–137, 1994.
Russell III, J. M., Bailey, S. M., Horanyi, M., Gordley, L. L., Rusch,D. W., Hervig, M. E., Thomas, G. E., Randall, C. E., Siskind, D.E., Stevens, M. H., Summers, M. E., Taylor, M. I., Englert, C.R., Espy, P. J., McClintock, W. E., and Merkel, A. W.: Aeron-omy of Ice in the Mesosphere (AIM) Mission: Overview andearly science results. J. Atmos. Sol.-Terr. Phys., 71, 316–330,doi:10.1016/j.jastp.2008.08.011, 2008.
Schwartz, M. J., Lambert, A., Manney, G. L., Read, W. G., Livesey,N. J., Froidevaux, L., Ao, C. O., Bernath, P. F., Boone, C. D.,Cofield, R. E., Daffer, W. H., Drouin, B. J., Fetzer, E. J., Fuller, R.A., Jarnot, R. F., Jiang, J. H., Jiang, Y. B., Knosp, B. W., Krüger,K., Li, J.-L. F., Mlynczak, M. G., Pawson, S., Russell III, J. M.,Santee, M. L., Snyder, W. V., Stek, P. C., Thurstans, R. P., Tomp-kins, A. M., Wagner, P. A., Walker, K. A., Waters, J. W., and Wu,D. L.: Validation of the Aura Microwave Limb Sounder temper-ature and geopotential height measurements, J. Geophys. Res.,113, D15S11, doi:10.1029/2007JD008783, 2008.
Smirnova, M., Belova, E., and Kirkwood, S.: Polar mesospheresummer echo strength in relation to solar variability and geomag-netic activity during 1997–2009, Ann. Geophys., 29, 563–572,doi:10.5194/angeo-29-563-2011, 2011.
Stevens M. H., Conway, R. R., Englert, C. R., Summers, M. E.,Grossmann, K. U., and Gusev, O. A.: PMCs and the water frostpoint in the Arctic summer mesosphere, Geophys. Res. Lett., 28,4449–4452, 2001.
Suzuki, H., Nakamura, T., Ejiri, M. K., Abo, M., Kawahara, T.D., Tomikawa, Y., and Tsutsumi, M.: A RAYLEIGH RAMANLIDAR SYSTEM FOR TROPOSPHERE-MESOSPHERE OB-SERVATIONS AT SYOWA STATION, ANTARCTICA, Re-viewed and Revised Papers Presented at the 26th InternationalLaser Radar Conference (ILRC 2012), S9P-18, 2012.
Takeda, Y.: Atmospheric phenomena at Syowa in 2009–10, PolarNews, 91, 46, 9–13, 2010.
Taylor, M. J., Zhao, Y., Pautet, P., Nicolls, M. J., Collins, R. L.,Barker-Tvedtnes, J., Burton, C. D., Thurairajah, B., Reimuller, J.,Varney, R. H., Heinselman, C. J., and Mizutani, K.: Coordinatedoptical and radar image measurements of noctilucent clouds and
Ann. Geophys., 31, 1793–1803, 2013 www.ann-geophys.net/31/1793/2013/

H. Suzuki et al.: Simultaneous PMC and PMSE observations 1803
polar mesospheric summer echoes, J. Atmos. Sol.-Terr. Phys.,71, 675–687, doi:10.1016/j.JASTP.2008.12.005, 2009.
Thayer, J. P., Rapp, M., Gerrard, A. J., Gudmundsson, E., and Kane,T. J.: Gravity wave influences on Arctic mesospheric clouds asdetermined by the Sondrestrom, Greenland, Rayleigh lidar, J.Geophys. Res., 108, 8449, doi:10.1029/2002JD002363, 2003.
Tsutsumi, M., Aso, T., and Ejiri, M.: Initial results of Syowa MFradar observations in Antarctica., Adv. Polar Upper Atmos. Res.,15, 103–116, 2001.
von Zahn, U. and Bremer, J.: Simultaneous and common vol-ume observations of noctilucent clouds and polar meso-sphere summer echoes, Geophys. Res. Lett., 26, 1521–1524,doi:10.1029/1999GL900206, 1999.
Wickwar, V. B., Taylor, M. J., Herron, J. P., and Martineau,B. A.: Visual and lidar observations of noctilucent cloudsabove Logan, Utah, at 41.7◦ N, J. Geophys. Res., 107, 4054,doi:10.1029/2001JD001180, 2002.
www.ann-geophys.net/31/1793/2013/ Ann. Geophys., 31, 1793–1803, 2013